1. Introduction
Malignant melanoma is the most lethal form of skin malignancy and remains an important public health issue due to its increasing incidence, propensity for rapid metastasis, and high mortality [
1,
2].
Single nucleotide variants in the v-Raf murine sarcoma viral oncogene homolog B (
BRAF) gene are highly prevalent in melanomas [
3]. The incidence is reported at around 45%, with the majority of these cases (70–80%) being caused by the substitution of the valine residue for glutamate at position 600 (V600E); the second most frequently observed is the substitution of the valine residue for lysine at the same position (V600K) [
4,
5]. The BRAF protein belongs to the family of serine/threonine protein kinases. It has a key role in the regulation of cell growth and division through activation of the MAPK/ERK pathway [
6]. Variants, such as V600E, that affect the active domain of the kinase may result in a constitutively active BRAF independent of upstream messaging. This is understood to contribute to growth and proliferation via downstream inhibition of apoptosis and tumour suppressor inactivation and is hence oncogenic. The focus on targeting and inhibiting this signalling pathway has led to important strides in improving outcomes for melanoma patients.
In the clinical setting, the determination of the mutational status of a patient’s melanoma is integral to effective management of their disease [
7]. However, the use of targeted therapies is limited to specific mutations; for example, the BRAF and MEK inhibitors dabrafenib and trametinib are used in BRAF V600-mutated melanomas. Furthermore, the use of such targeted therapies in V600-positive disease has been associated with improved outcomes [
8,
9]. A key study that included patients with either unresectable or metastatic melanoma, who had been given first-line treatment with dabrafenib plus trametinib, demonstrated a 5-year survival of 34% and progression-free survival of 19% [
10,
11]. Therefore, determining the molecular profile of a patient’s melanoma is essential for initiating them on the most appropriate treatment.
It is imperative that patients who may be eligible for targeted BRAF-inhibitor therapies are tested for relevant mutations in both a reliable and a timely manner. Next generation sequencing (NGS) can be viewed as the gold standard to obtain results in the clinical setting; however, it can take up to two weeks, or longer, especially when testing occurs off-site [
12]. Such time intervals may represent a delay significant enough to negatively impact disease outcomes. This is arguably even more pertinent when these patients harbour advanced and metastatic disease. It makes sense, therefore, to supplement NGS with faster detection methods, thereby diminishing delay to treatment [
13].
The focus of this research is one such example: Biocartis’ Idylla™ BRAF Mutation Test. It is an automated cartridge system based on polymerase chain reaction (PCR) technology using allele specific TaqMan primers. It takes in formalin-fixed paraffin-embedded (FFPE) tissue samples, and is primed to detect one of the following six mutations: V600E/E2/D/K/R/M. These machines are located on-site and give a result within 90 min. The platform does not require nucleotide extraction before analysis, making it ideal for use in cellular pathology laboratories without molecular grade facilities [
13]. The pre-processing steps required are bench preparation, cutting tissue, then placing the sample between paper discs that had been dampened with nuclease free water. These were then placed in the single-use cartridge. From that point on it is a closed, automated system, that runs the PCR and processes the data. Each cartridge contains three chambers. Chamber A can detect wild type
BRAF, chamber B detects mutations V600E/E2/D, and chamber C mutations V600K/R/M.
Melanin is a known PCR inhibitor that has been to shown to function by reversibly binding to thermostable DNA polymerase [
14,
15] Additionally, the detection of target sequences is based on fluorescence signals; however, melanin can absorb light in the same wavelength range as the fluorescent dyes used, theoretically resulting in reduced signal, and thereby potentially affecting the accuracy of the test [
16]. Since a subset of melanoma samples will contain especially high levels of melanin pigment, it was pertinent to investigate whether these highly pigmented samples interfered with the Idylla™ BRAF Mutation Test [
17].
2. Methods
The study sample was a retrospective patient cohort with confirmed histopathological diagnosis of melanoma between February and November 2020 within the Swansea Bay University Health Board. These samples included skin, lymph nodes, and other metastatic sites. The samples had been run on the Idylla™ BRAF Mutation Test by the third author (K Murphy) and had also been validated with NGS by a partner site. The FFPE tissue was archival, with prior conclusion of the diagnostic pathway. The samples used were pseudo-anonymised.
Haematoxylin and eosin (H&E) stained FFPE slides were evaluated for melanin content using light microscopy by the first two authors (S D Parsons and A Finall). No macro- or micro-dissected samples were used for tumour nuclear content (TNC) enrichment. The slides were evaluated by the observers independently, blind to the mutational status of each sample. Then each sample was categorised into either: No (n = 5), Low (n = 74), or High (n = 19) melanin content. The slides evaluated under light microscopy were not the exact FFPE slice that had been processed for the respective PCR run. This is because these samples had necessarily already been consumed by the test process. Instead, it was ensured the slides evaluated were prepared from the immediate adjacent FFPE block surface; therefore, the melanin content on that slide was likely to be representative of the one consumed in the cartridge. For the purposes of standardisation, the slides were viewed at 10× magnification. In each case where categorisation was discordant between the two observers, these were discussed, and their status subsequently agreed via consensus.
The high melanin category was defined as more than or equal to 50% of the tissue area containing areas of pigmentation. The low melanin category was defined as greater than 0% but less than 50% of the tissue area containing pigmentation. The no melanin category was defined as 0% of the tissue area containing pigment. The adoption of a three-tier system, specifically, was driven by considerations related to the inherent subjectivity of the classification process. Recognising that the interpretation of melanin levels can be subjective, the decision-makers opted for a simplified framework to avoid exacerbating the potential for discrepancies arising from inter-observer variation. Additionally, the rationale underpinning the three-tier system was based on the system for grading human epidermal growth factor receptor 2 (HER2) immunohistochemical expression in breast cancer [
18,
19]. The HER2 categorisation uses categories 0/1+ (no significance), 2+ (borderline significance), 3+ (positive significance); this is similar in principle to our design of no, low, and high melanin. In this way our grading system aligns with the approaches of a previously established and validated model. Finally, this degree of categorisation was decided upon to facilitate a straightforward comparison between the associated groups of PCR results.
In the context of the PCR reactions the quantification cycle (Cq) value measures the cycle number at which the fluorescence of the amplified product reaches a specific threshold [
20]. It can be used to quantify the amount of target DNA present and give an indication of the efficiency of a PCR reaction. Regarding the optimal range of Cq values for FFPE samples, these are determined by the decision tree of the test, as guided by its software cut-offs and instructions for use (IFU). The specific Cq cut-offs are considered proprietary information, intrinsic to the test’s decision-making process, and are tailored to varying factors including sample input and mutation status of the cartridge. The total Cq values play a pivotal role in quality control as detailed in the test’s IFU and have been corroborated by several research papers [
17,
21,
22,
23]. These values are indicative of the amplifiable DNA content within the cartridge, aiding in the assessment of sample input and cartridge validity.
Test runs with wild-type Cq values that are above a certain threshold, and that have no mutation detected, are automatically excluded. This is to avert false negatives arising, for example from inadequate DNA input to the cartridge. The range of Cq values for all runs included in this study were, for wild-type: 27.63 to 37.75, and mutation detected: 30.99 to 46.18. Cq values up to 34.4 were observed in valid test results detecting no mutation. One sample with no mutation detected was determined by the software algorithm to be an invalid result had a Cq value of 36.15 [
24]. The presence of a mutated genotype is determined by calculating the ΔCq, which refers to the difference between the Cq values of the BRAF wild type and either the V600E/E2/D or V600K/R/M, as relevant [
25]. If the ΔCq falls within an established range, this is classed as a confirmed mutant signal and the software then labels the sample as mutation positive. Samples with a valid wild-type signal and a mutation amplification signal, but with the ΔCq falling outside a calculated expected range are categorised by the test as mutation negative. The purpose of defining a specific range is to increase specificity, by minimising false positives and false negatives. The assay aims to distinguish true mutant signals from variations that might occur due to experimental noise or other factors. This helps in avoiding false positives by ensuring that only signals within the expected range are labelled as mutations.
The approach this study took to evaluate the question of whether melanin content impacts the Idylla™ BRAF Mutation Test detection of BRAF mutations employed two primary lines of investigation. The first involved analysing the data to identify potential differences in Cq values among different melanin content categories. By comparing Cq values across categories with varying melanin content (‘no’, ‘low’, and ‘high’ melanin), the study sought to determine if there were notable differences in the test’s performance based on melanin levels. The second involved a detailed examination of the PCR curves. The goal was to investigate these curves and their distribution to identify any potential evidence suggesting inhibition caused by melanin. PCR curves provide information about the amplification process and can indicate potential issues, such as inhibition, that might affect the accuracy or reliability of the test results [
26]. By scrutinising these curves, the study aimed to detect any patterns or anomalies that might suggest interference or inhibition caused by varying levels of melanin in the samples.
3. Results
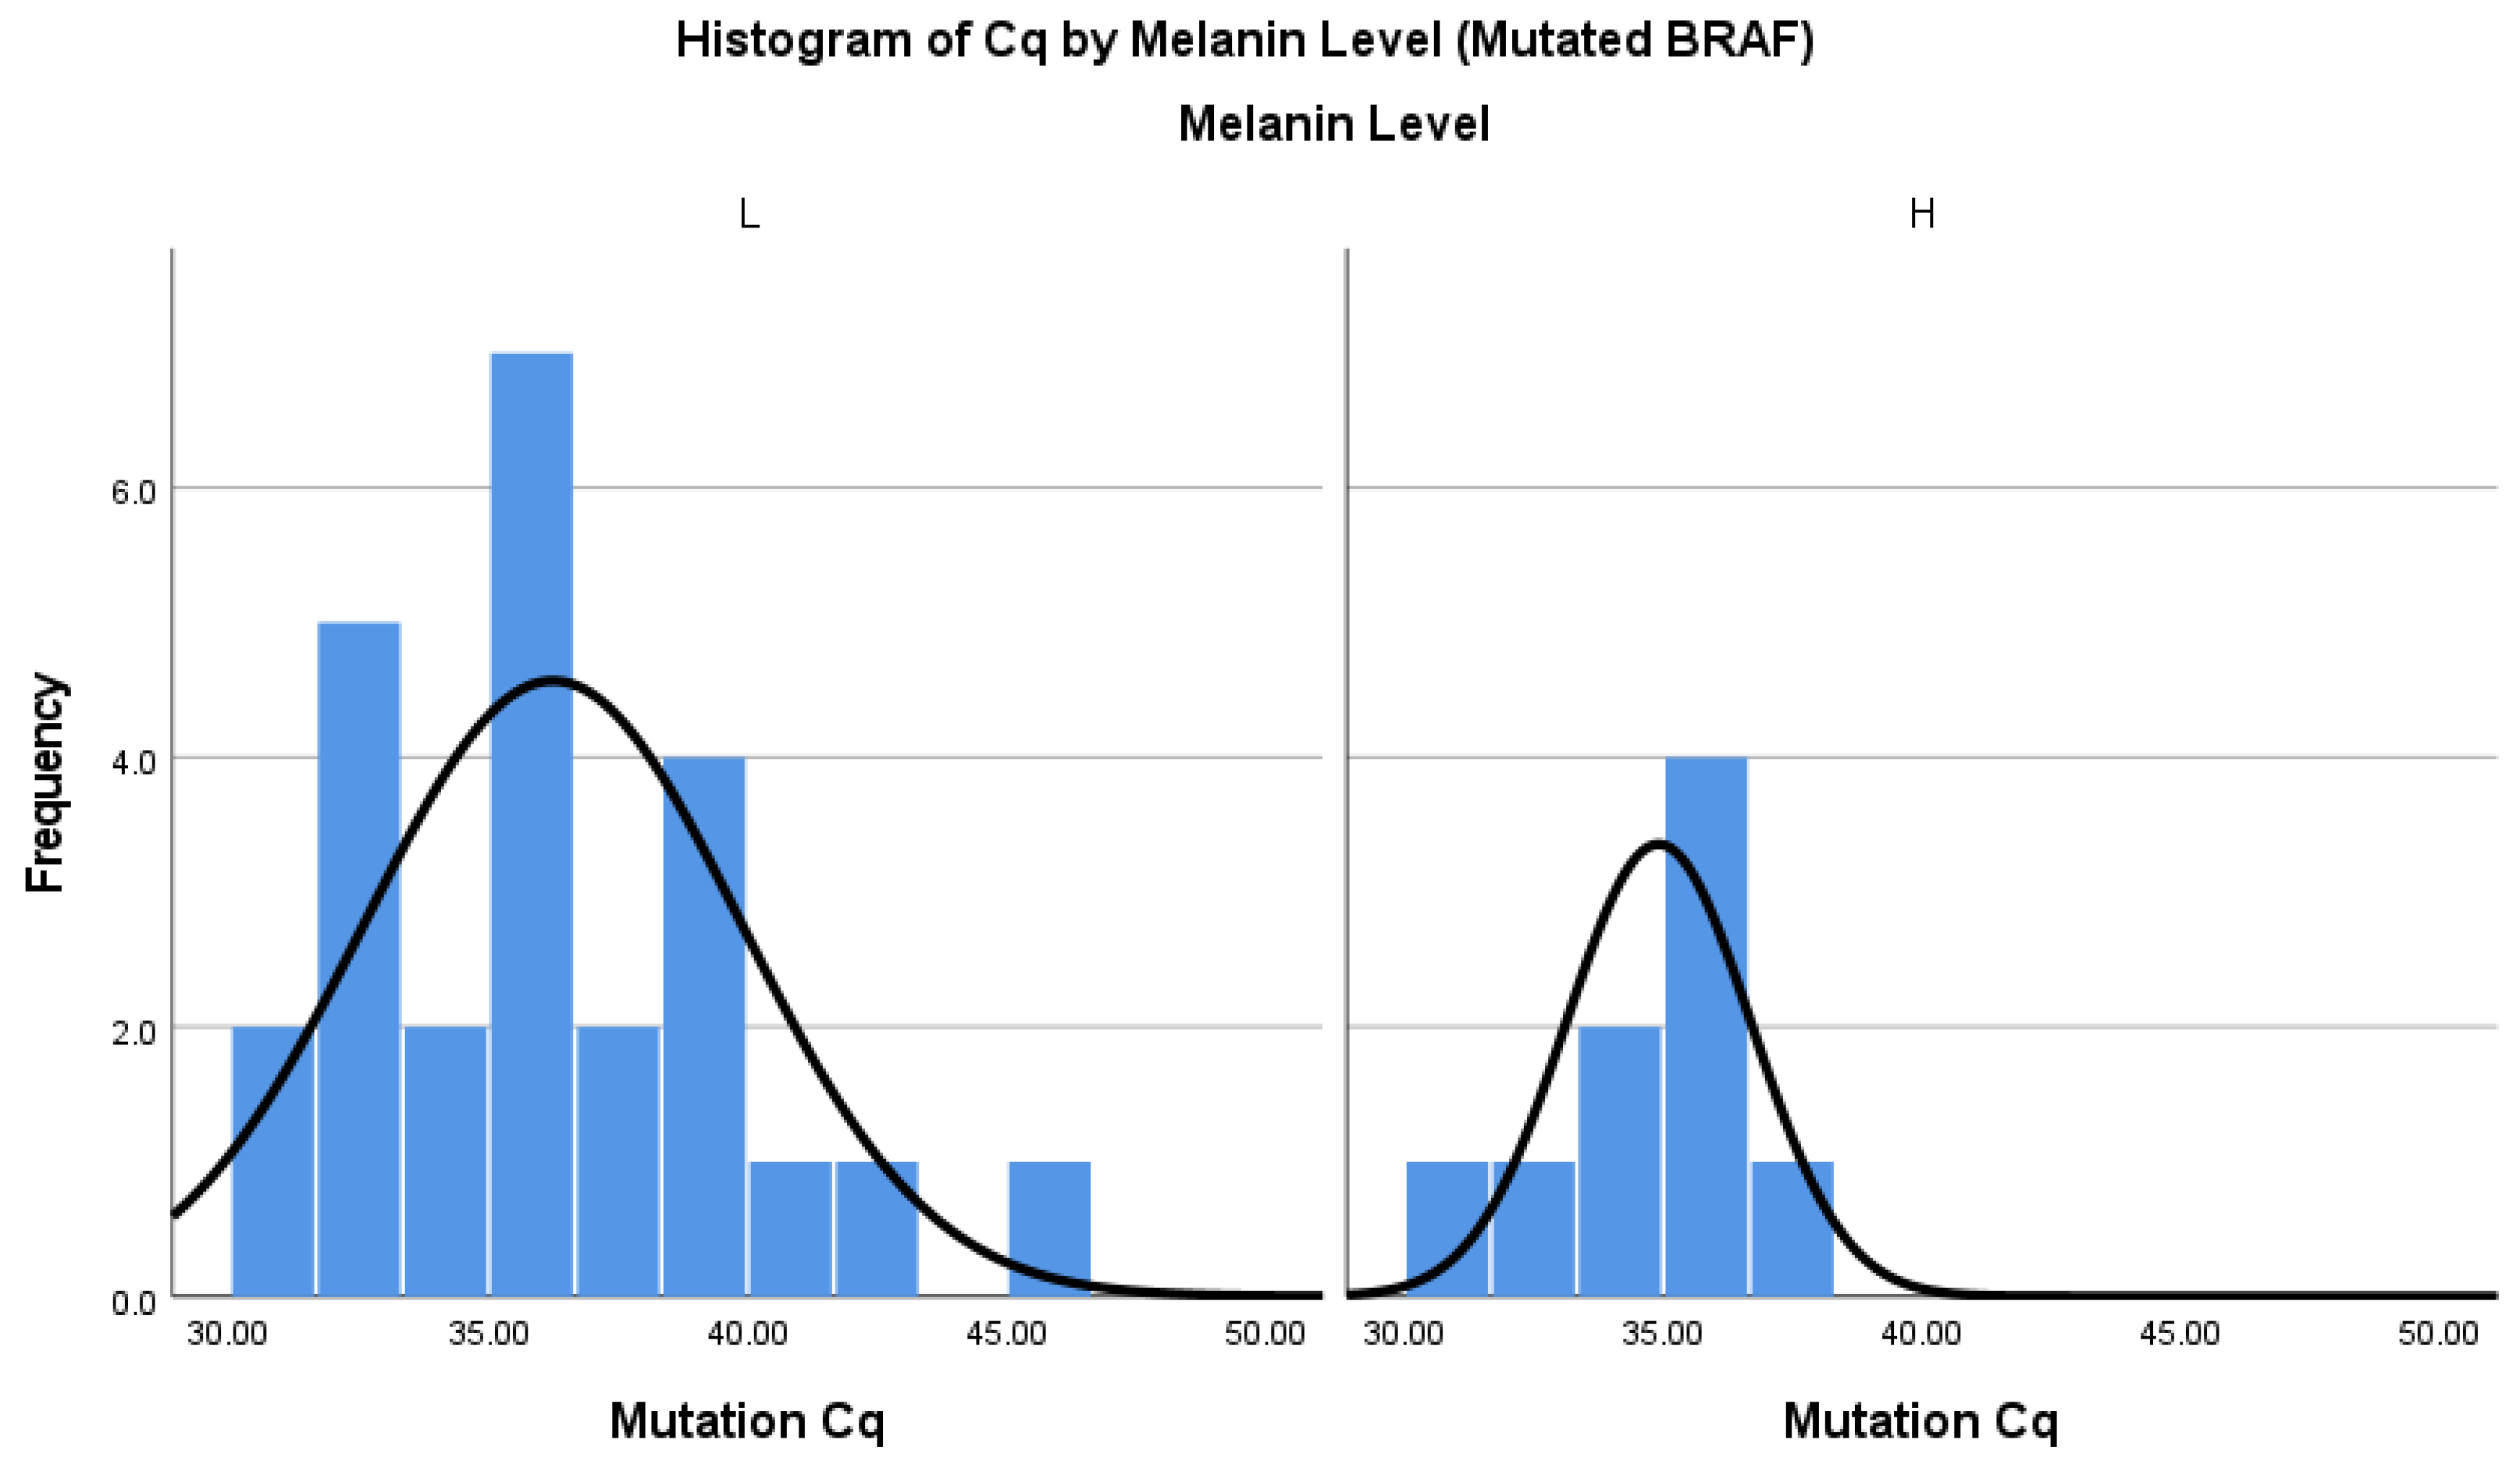
Figure 1 and
Figure 2 display the distribution of Cq values categorised by melanin content for wild type runs in chamber A (
Figure 1) and mutation positive runs in chambers B or C (
Figure 2) of the Idylla™ BRAF Mutation Test, each accompanied by normal curve overlays. Along the x-axis of both figures, histogram bins represent distinct Cq value ranges, grouped by the melanin content categories (‘no’, ‘low’, and ‘high’). The y-axis in each figure represents the frequency count, indicating the occurrences of Cq values within these melanin categories. Normal curve overlays in both figures serve to illustrate the anticipated distribution patterns of Cq values in relation to varying melanin content levels. Additionally, the normal distribution in the data supports the application of parametric statistical tests.
The assumption of normality was evaluated visually with histograms (
Figure 1 and
Figure 2) and Q-Q plots and was found to be tenable for each melanin group. The Kolmogorov-Smirnov test was employed to further evaluate statistically significant deviation from a normal distribution. The obtained
p-values for the ‘High’, ‘Low’, and ‘No’ melanin categories were 0.2, indicating the results are consistent with a normal distribution, according to this test, at a standard significance level of 0.05.
A one-way analysis of variance (ANOVA) was conducted using SPSS Statistics software, comparing the three melanin level groups, to test the null hypothesis that there is no difference between Cq value based on melanin level (N = 98) for detection of wild type BRAF. The independent variable, melanin level included three groups: No (M = 31.07, SD = 1.18, n = 5), Low (M = 31.89, SD = 2.14, n = 74), and High (M = 32.70, SD = 1.79, n = 19). The same test was run for samples with detected mutant BRAF to test for a difference between mutation Cq values (N = 34). No (n = 0), Low (M = 36.24, SD = 3.64, n = 25), and High (M = 34.91, SD = 1.78, n = 9).
The assumption of homogeneity of variances was tested. Levene’s test showed the variances between the groups were not significantly different at the 5% level for the wild type runs, F(2, 95) = 1.21, p = 0.293. Neither was it significant for the positive mutation runs F(1, 32) = 3.09, p = 0.088. This is a critical assumption for the validity of the ANOVA tests. The ANOVA was not significant for the wild type runs F(2, 95) = 1.74, nor for the positive mutation runs, p = 0.182. F(1, 32) = 1.08, p = 0.305. Therefore, this result supports the null hypothesis, meaning that there was no impact observed on the Cq values with high, low, and no melanin levels in the samples. The overall interpretation is that differences in melanin levels do not introduce significant variability in Cq values, reinforcing the overall analysis in evaluating the impact of melanin on the test results.
The PCR curves were utilised as the next method to investigate any potential influence of melanin on the system. In the process of PCR, the amplification products accumulate because of DNA replication, leading to an increase in the fluorescence signal. This fluorescence signal, measured after each thermal cycle, forms the basis for generating a characteristic sigmoidal curve, indirectly representing the amplification progress [
26,
27]. The x-axis of the curve signifies the number of thermal cycles, indicating the progression of the PCR reaction, while the y-axis depicts the strength or intensity of the fluorescence signal, in our system measured in nanowatts. Thus, the examination of PCR curves serves as a fundamental method for visually assessing the progression and efficiency of DNA amplification. Analysing these curves aids in understanding the amplification process; in this context for interference on the test based on melanin content.
Figure 3 shows the sample processing control curves from all runs for chambers A, B, and C (from left to right respectively). These control samples are processed by the test alongside the target samples and should yield expected and consistent results. Irregularities in the control curves can indicate potential issues, such as contamination, inadequate DNA extraction, or problems with the amplification process. In the figure, the low melanin samples are coloured red, high melanin samples are coloured green, and no melanin samples are coloured blue. The observed equal spread of the high, low, and no melanin amplification curves supply additional evidence that the degree of amplification does not correlate with the melanin content of the FFPE sample.
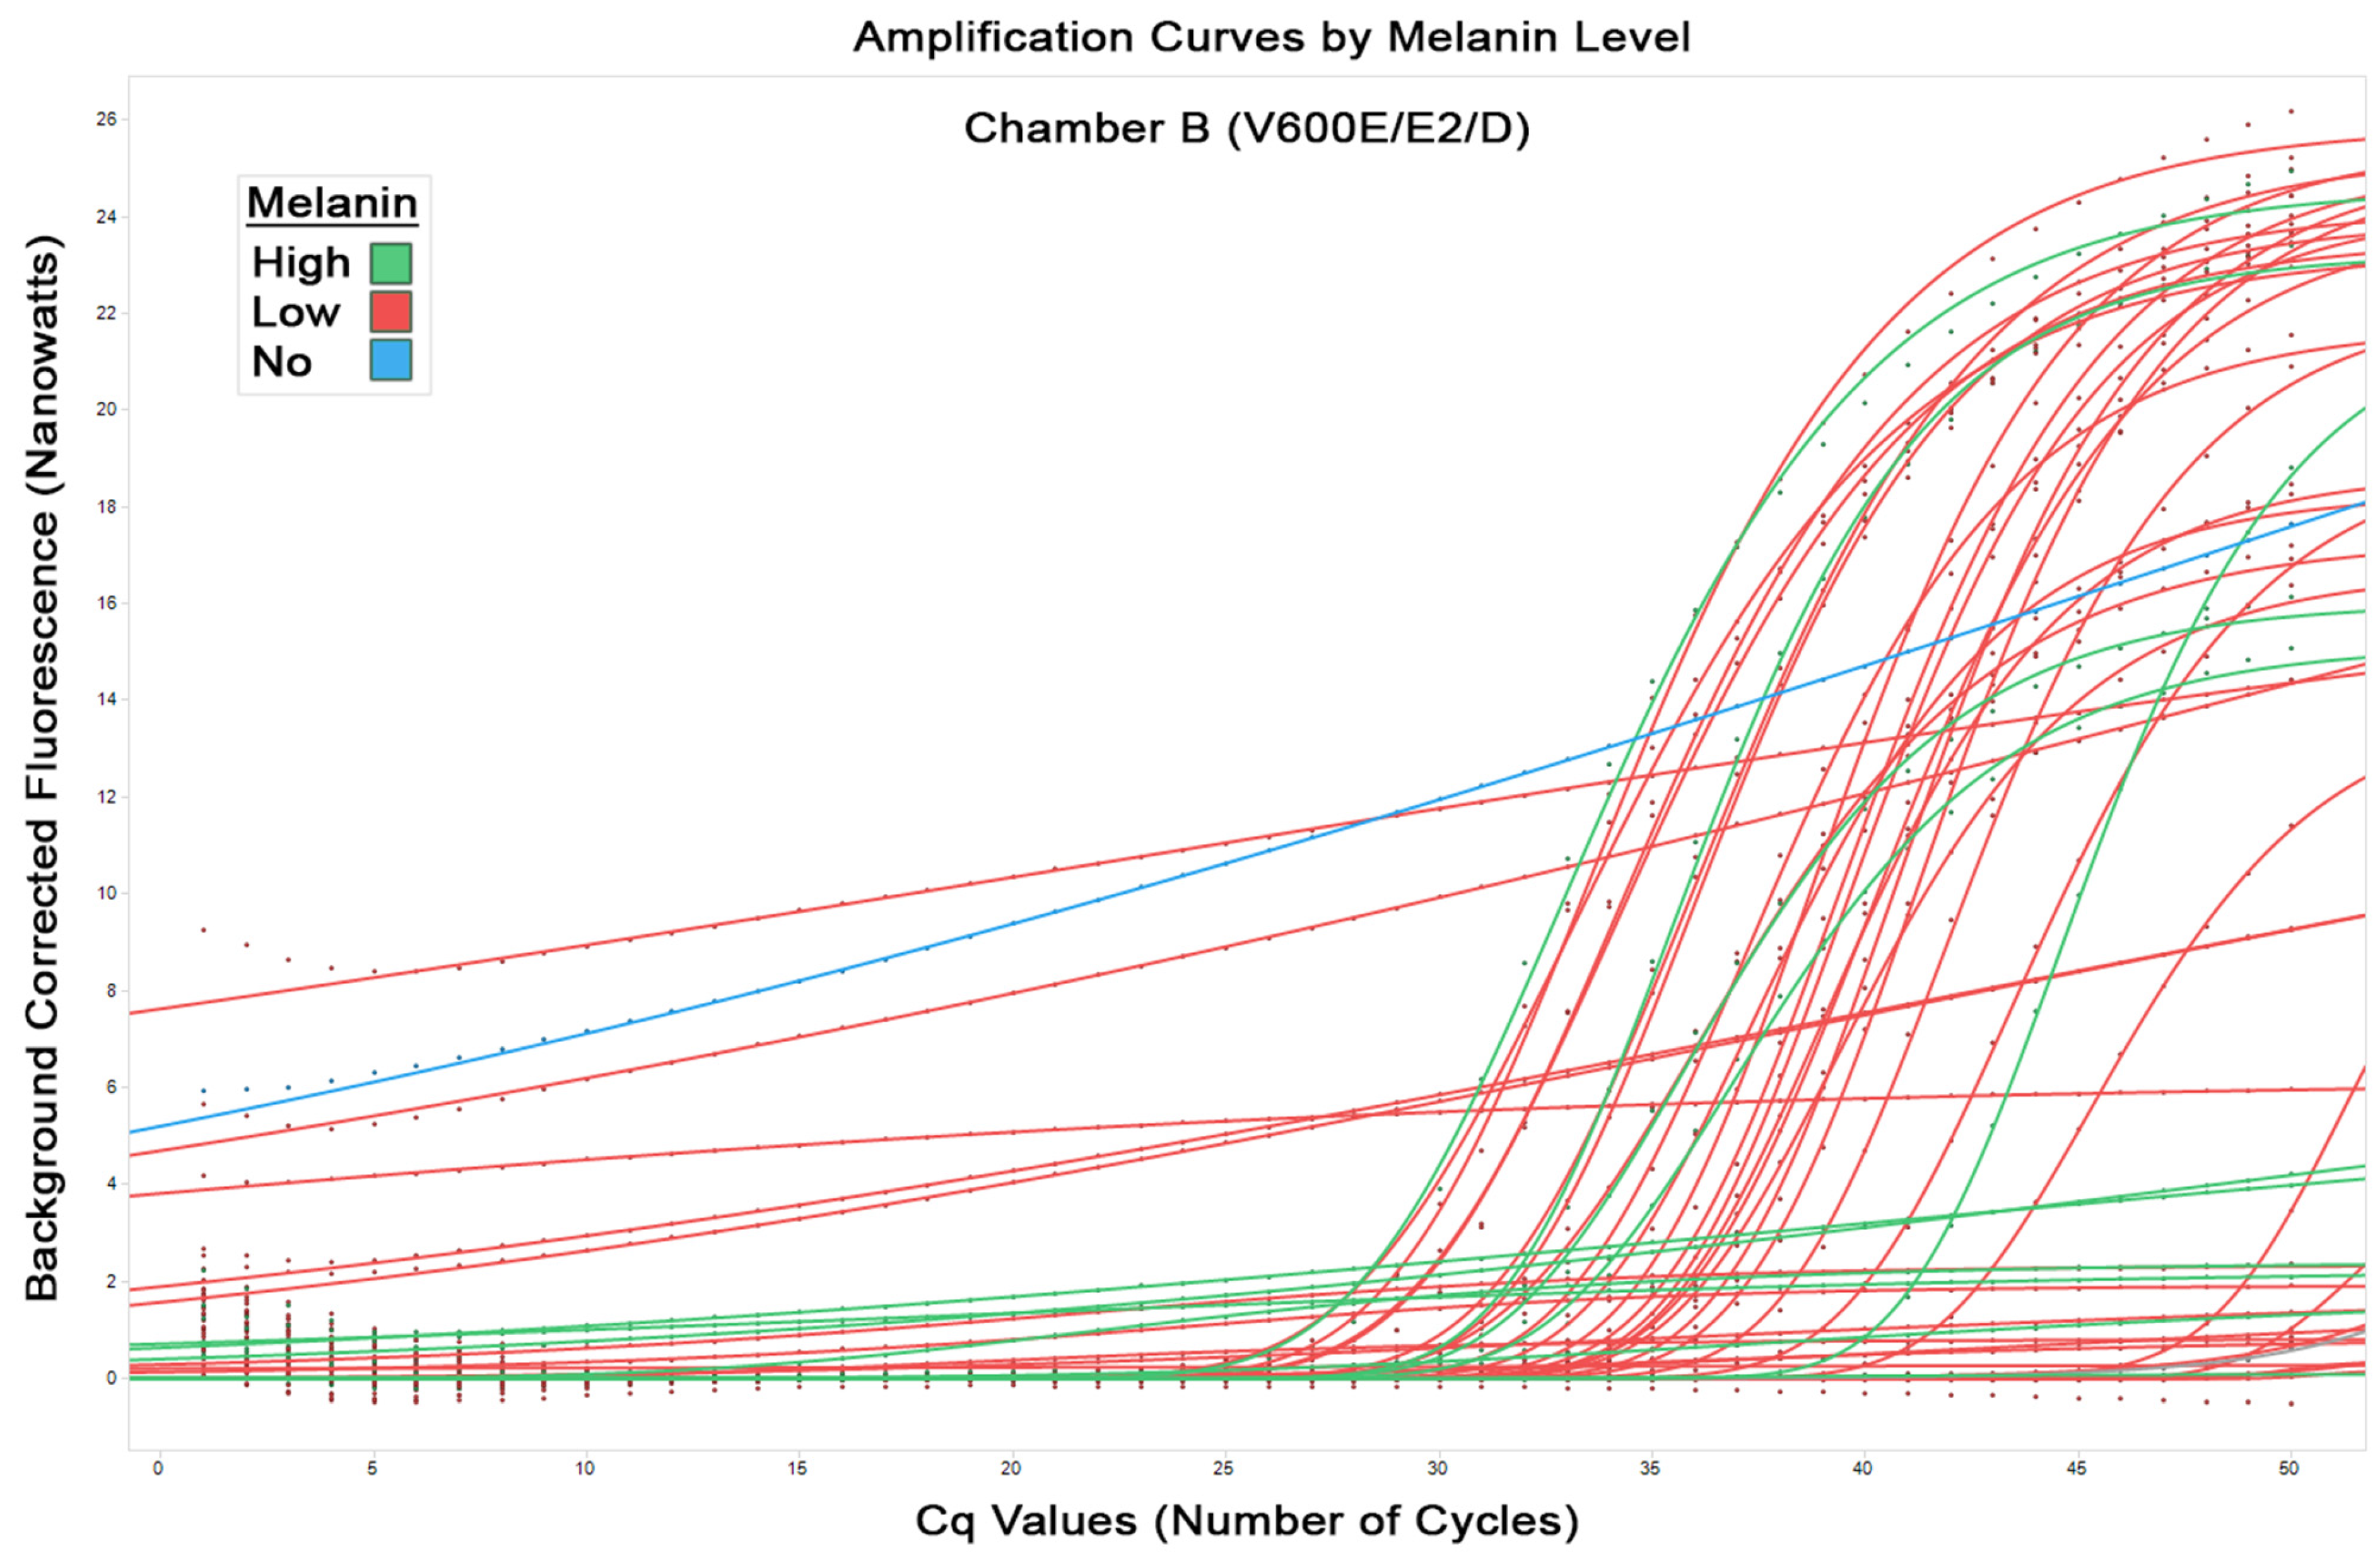
The aim of this study was to investigate interference of melanin specifically on the amplification of the relevant mutations.
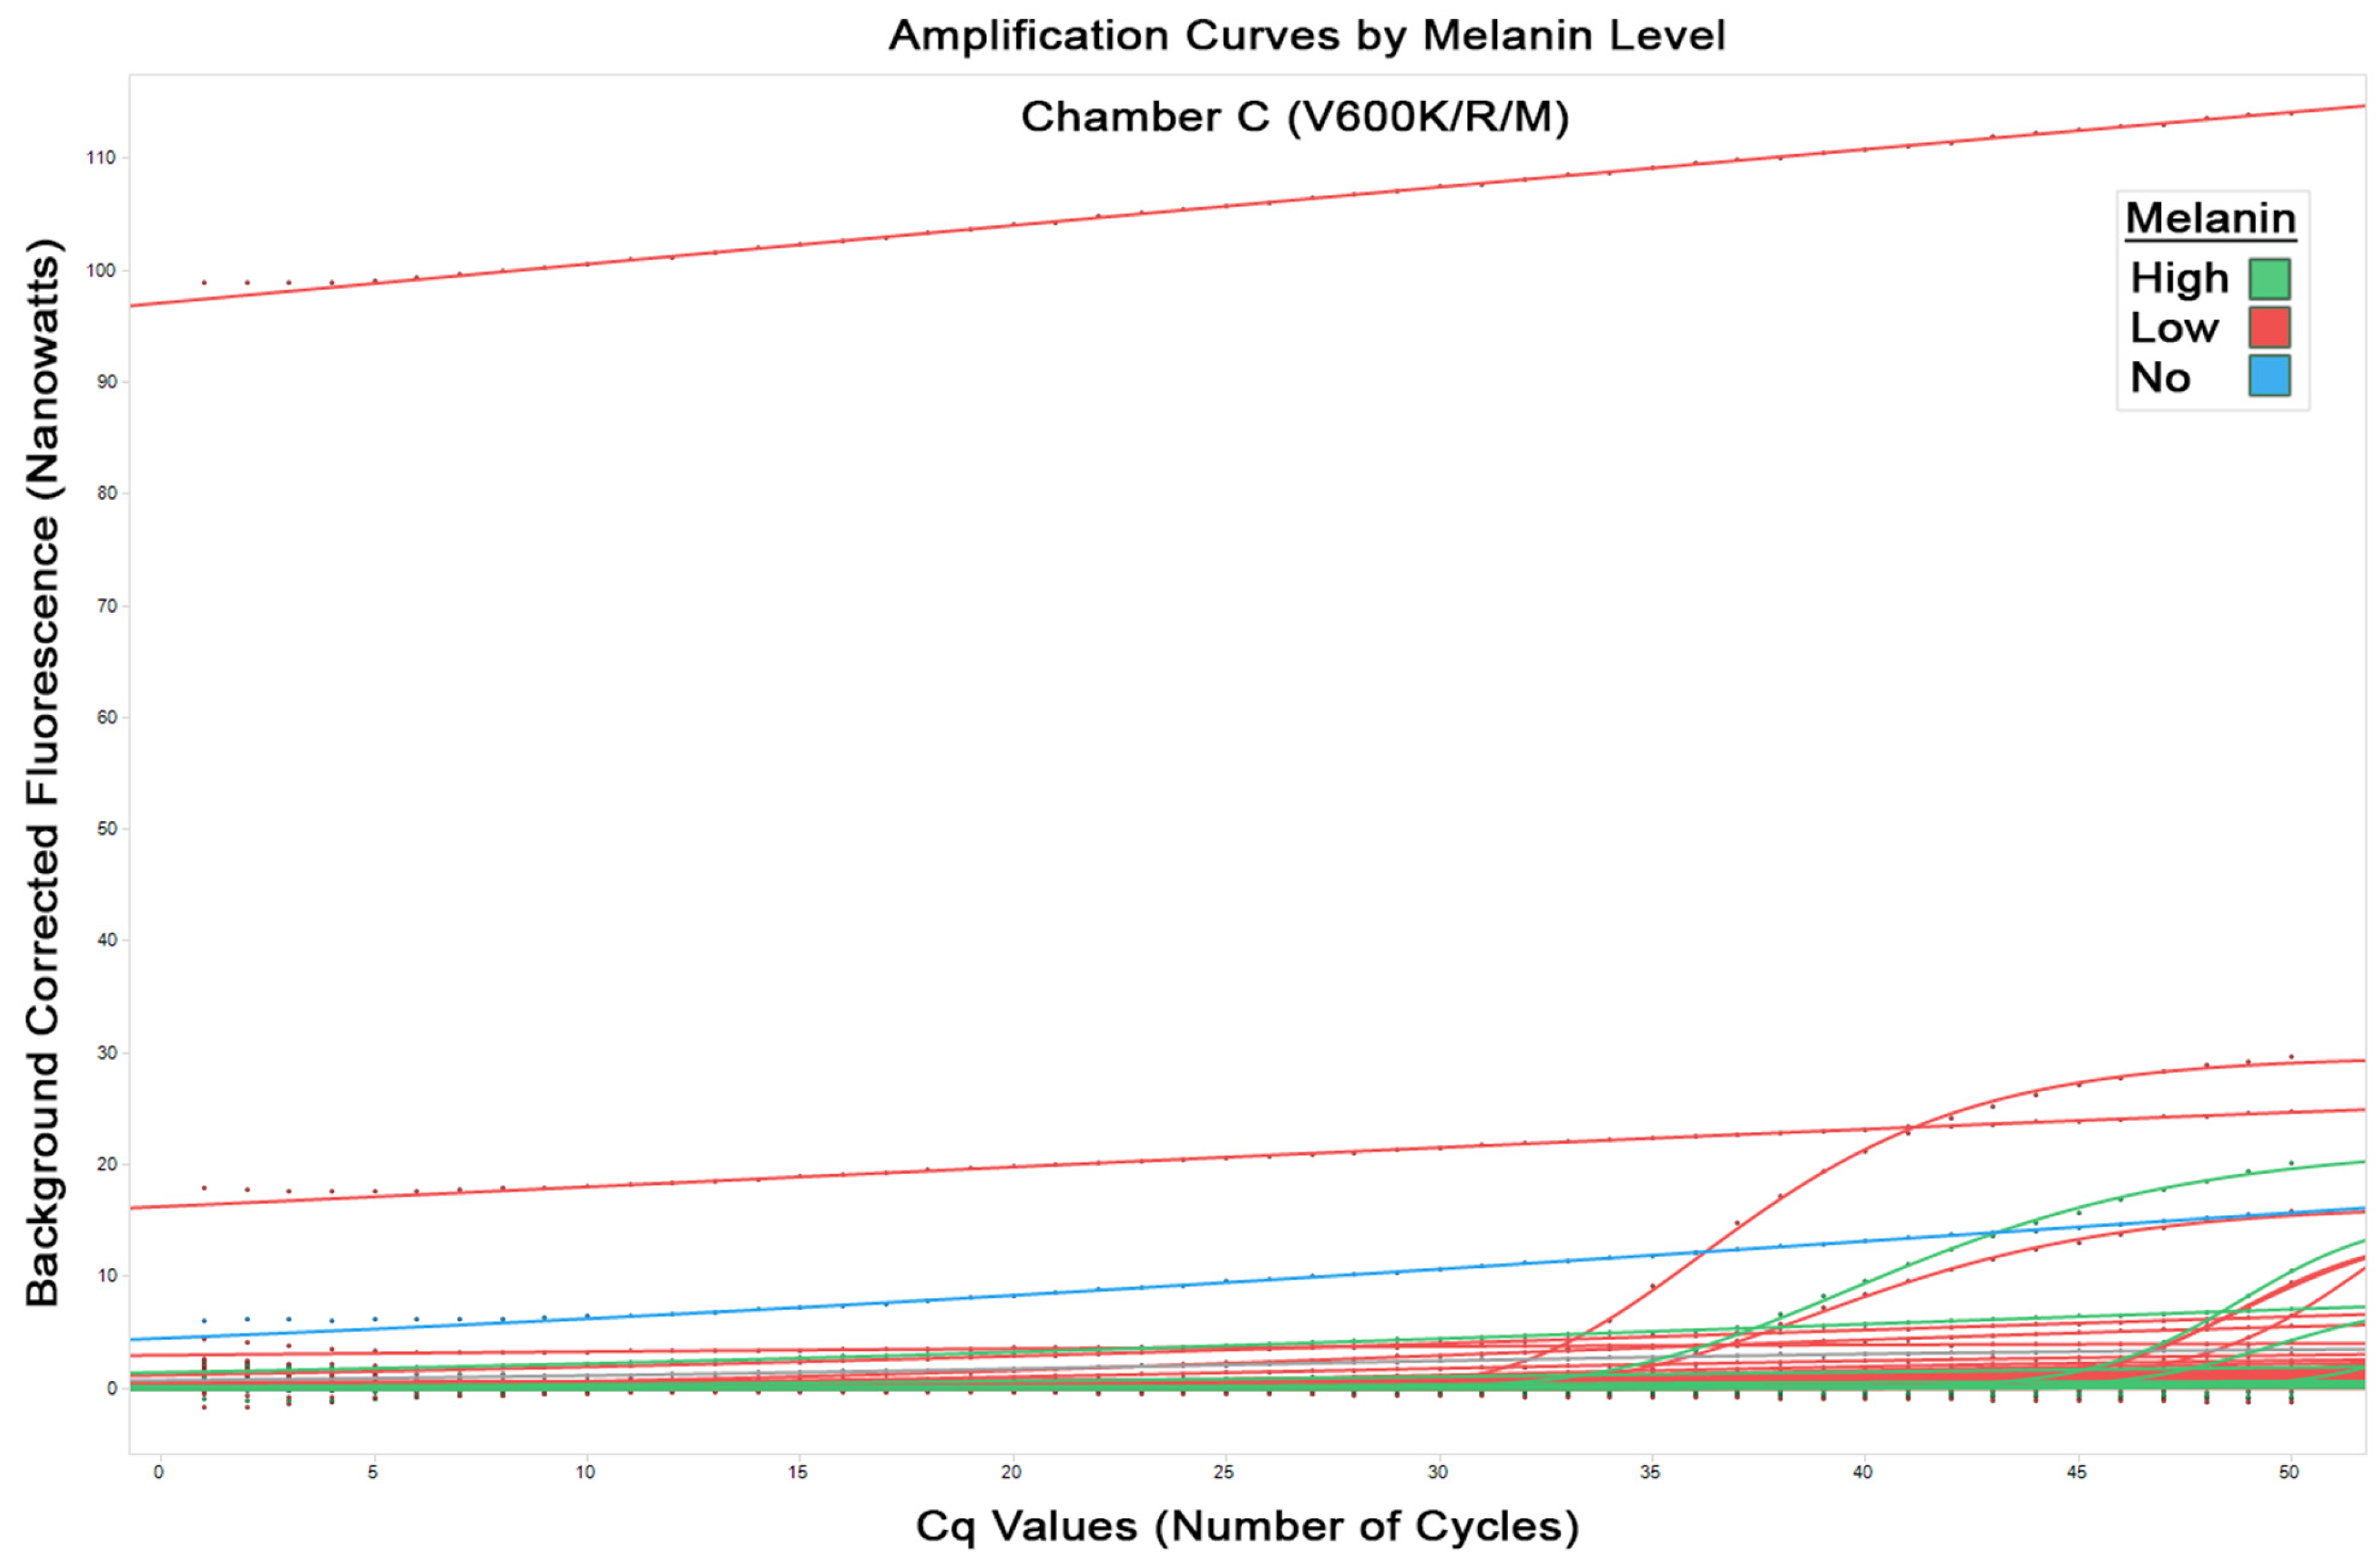
Figure 4 shows the amplification curves from all runs in chamber B for detected mutations (including V600E/E2/D). Again, seen here is the equal distribution of the amplification curves for both low and high melanin that indicates no evidence of inhibition of PCR correlating with melanin content. This is seen similarly in
Figure 5 for chamber C (V600K/R/M mutations). It should be noted the flat lines seen are due to an anomaly in the classification software and these represent no fluorescence detected, and therefore no amplification.
In summary, the consistent distribution of the amplification curves across melanin content categories, seen in the control curves and chamber amplification curves serve as a visual indication that there is no clear, discernible clustering, grouping, or bias in a particular direction across the melanin categories. The absence of noticeable grouping or bias in the PCR curves suggests that any potential interference or effect attributed to melanin content does not appear to significantly influence the amplification process.
Finally, the data was examined for concordance between NGS and the Idylla™ BRAF Mutation Test in the context of melanin level. Of the samples tested on the Idylla™ BRAF Mutation Test, there were a total of five results discordant with NGS testing. Of these, three of the Idylla™ results failed to detect a mutation that was found by NGS. Additionally, for two Idylla™ results the mutation did not agree (in terms of amino acid substitution) with the result found by NGS. Further investigation into the cause of these discordant outcomes showed some of the results were caused by low tumour nuclear content due to the use of non-macro dissected samples. These Idylla™ results were subsequently found to be concordant with NGS after subsequent microdissection and re-running the test. The rest of the discordant results were discordant by design—meaning NGS picked up a mutation other than V600E/E2/D/K/R/M [
24]. This clearly highlights the importance of understanding the advantages and limitations of each testing method. Of the five discordant results, four occurred in the low melanin category and one in the high melanin category. The preponderance of discordant results in the low melanin category tentatively supports the idea that melanin, within the range studied, is not having a significant impact on the Idylla™ BRAF Mutation Test.
A study with a similar aim was conducted by Petty et al. to assess the impact of melanin on the performance of the Idylla™ BRAF Mutation Test [
28]. Their study included 23 melanoma samples and similarly employed a three-tier ‘pigment score’ ranging from 0 to 2: none (
n = 6), mild-moderate (
n = 10), or abundant (
n = 7). The findings revealed that the BRAF mutation results were concordant with reference laboratory testing, leading to the authors’ conclusion that melanin does not have a significant impact on the Idylla™ BRAF Mutation Test. Petty et al.’s study contributes valuable evidence towards addressing the question of melanin interference, adopting a discordance standpoint. In the context of our study, which is the subject of this paper, we further built upon these findings, firstly with a significantly larger sample size. Additionally, we focused not only on discordance but also on the analysis of PCR curves and of Cq values to provide further robust evidence that the Idylla™ BRAF Mutation Test remains unaffected by melanin.
Regarding the limitations of the present study. The sample size of 98 confirmed melanoma samples, and the fact they were derived from a single centre, may limit the generalisability of the findings. Therefore, a larger and more diverse cohort would yield more robust results. Another limitation of the study is the inherent subjectivity of the classification of melanin levels by the authors. Although efforts were made to standardise melanin categorisation and minimise subjectivity through the design of the three-tier system, potential observer bias may have influenced the classification process. Other substances, such as tissue marking dyes for surgical margins were not accounted for. These might theoretically interfere with the reaction, but were minimally present in most samples. Finally, the study’s comparison of the Idylla™ BRAF Mutation Test with NGS results assumes NGS as the gold standard. However, NGS has limitations that potentially affect the accuracy of mutation detection.
To strengthen future research, larger and diverse sample sizes and prospective study designs should be considered. Validation with alternative mutation detection methods and exploration of the mutation detection threshold of the Idylla™ BRAF Mutation Test would enhance precision and validity. Efforts to minimize observer bias through further structured training and inter-observer agreement assessments could enhance the reliability of melanin categorisation. Other approaches to minimise bias in the categorisation of the slides could be explored, for example by employing computational algorithmic methods to classify digital slide images [
29]. Such methods may in theory provide more standardised means of assessing and quantifying the melanin content of each sample, or even be able to provide a specific numerical value to the melanin content of each slide rather than grouping them.


