Proceeding Paper

Green Synthesis of Magnetite Nanoparticles Using Waste Natural Materials and Its Application for Wastewater Treatment †

by
Hussein M. Ahmed
1,*,
Mohamed A. El-khateeb
2,
Neama A. Sobhy
1,
Mohamed M. Hefny
3 and
Fatehy M. Abdel-Haleem
4
1
Housing and Building Research Center (HBRC), Sanitary and Environmental Institute, Giza 12613, Egypt
2
Water Pollution Research Department, National Research Centre, Giza 12622, Egypt
3
Chemistry Department, Faculty of Science, Cairo University, Giza 12613, Egypt
4
Centre for Hazard Mitigation and Environmental Studies and Research (CHMESR), Cairo University, Giza 12613, Egypt
*
Author to whom correspondence should be addressed.
Presented at the 7th International Electronic Conference on Water Sciences, 15–30 March 2023; Available online: https://ecws-7.sciforum.net/.
Environ. Sci. Proc. 2023, 25(1), 99; https://doi.org/10.3390/ECWS-7-14181
Published: 14 March 2023
(This article belongs to the Proceedings of The 7th International Electronic Conference on Water Sciences)

Abstract

:
In this study, a simple, environment-friendly, and cost-effective method is developed to synthesize metallic nanoparticles (NPs) from natural waste residues, such as onion, potato, tea, and moringa, and the effect of extract residues on efficiency, yield, size, shape, and morphology of the magnetite nanoparticle is discussed. The synthesized nanoparticle was characterized by a Fourier transform infrared spectrometer (FT-IR), X-ray diffraction (XRD), X-ray fluorescence (XRF), and energy dispersive spectroscopy (EDX). The promising applications of nanotechnology are their efficiency in wastewater treatment, including the removal of chemical and physical parameters. The study proposes that magnetite NPs can be synthesized using onion, potato, tea, and moringa residues’ extract as the reducing agent. The results of the XRD pattern confirmed the synthesized magnetite NPs using onion, potato, tea, and moringa as the crystalline phase of α-Fe2O3. EDX spectroscopy showed the presence of elemental iron and oxygen, indicating that the nanoparticles were essentially present in oxide form. UV absorption in the range of 190–340 nm confirmed the formation of Fe/NP, and a Fourier transform infrared spectrometer (FT-IR) indicated the formation of iron oxide crystalline NPs in which reducing and capping agents, such as flavones, and the intensity of the absorption peak in the FT-IR spectrum depends on the type of extract. The synthesized Fe/NPs were tested for treatment of wastewater under different conditions such as contact time (0–60) min and dose (0.1–0.5) g; the results indicate that magnetite NPs of moringa and onion are more effective in degradation and adsorption processes at optimum dose (0.4 g, and time 45 min).

1. Introduction

Recently, there has been a great development in the use of nanotechnology in many applications such as medical and environmental fields, which have made many people, believe that this technology can improve their current standard of living [1,2]. The nanoparticles are characterized by many characteristic approaches, such as shape and size, which allow these particles to be used in many life applications including water treatment [2]. The particles are called nanomaterials at particles sizes ranging from 1 to 100 nm [3]. The nanoparticles are characterized by a large surface area, which distinguishes them from the other bulk materials with the same composition, which made this technology improve properties and features such as catalytic activity, electrical conductivity, hardness, and antimicrobial [3]. The nanoparticles are used in water treatment due to these particles having a large functional surface area capable of binding, absorbing, and carrying other compounds [2]. Among the nanoparticles that are widely used in water treatment, such as iron particles with magnetic properties, these particles are characterized by unique properties such as surface area; these properties of Fe/NPs make them applicable in various areas, such as catalysis, magnetic storage media, biosensors, magnetic resonance, and wastewater treatment [2,4].
The preparation of raw materials is carried out by various methods including physical, chemical, enzymatic, and biological. Physical methods are divided into the grinding of large particles, thermal evaporation, plasma arcing, spray pyrolysis, spray deposition, and layer-by-layer growth. Chemical methods are divided into the sol–gel method, electrophoresis, chemical vapor deposition, chemical solution deposition, and hydrolysis. The biological method, which uses a one-step biological extraction method, is environmentally friendly, as it uses environmentally friendly materials such as plant materials, bacteria, fungi, microalgae, and is called the green synthesis method [3,5].
Green synthesis uses plants and microorganism; the synthesis of nanoparticles is an environmentally friendly, economically viable method for large-scale production and a cost-effective method without any harmful and expensive chemicals. The green synthesis of nanoparticles is produced by the biological method in order to overcome the problems with more efficiency than physical and chemical methods due to the length of time and the multiplicity of steps during the preparation process [6]. The green synthesis method depends on the mechanism of the bio-reduction of nanoparticles due to many bio-molecules (vitamins, amino acids, proteins, phenolic acids, and alkaloids) in plant and microorganisms. Phenolic acids are powerful antioxidants, possessing hydroxyl and carboxyl groups that are able to bind metals. The active hydrogen may be responsible for the reduction of metal ions in the formation of nanoparticles [2,3,4,7].
Iron nanoparticles are prepared from plant extracts such as fruit and vegetable extracts. Iron nanomaterials are considered effective materials in water treatment because of their magnetic properties. Iron particles are found in the forms of Fe2O3 and Fe3O4 [3,8,9].
Iron nanoparticles have recently gained great research interest in environmental applications since they offer high surface reactivity due to the high surface area. Environmental applications of iron nanoparticles include the detection and elimination of pollutants in wastewater treatment. The application of iron nanoparticles in the environment offers advantages such as improved performance, lower energy consumption, and reduction in residual waste. Iron nanoparticles are one of the most researched and efficient nanoparticles for the removal of pollutants from wastewater [10,11].
The prepared nanoparticles are characterized to know the extent of their formation through many methods such as scanning electron microscopy (SEM), X-ray diffraction (XRD), Fourier transform infrared spectroscopy (FT-IR), and visible and ultraviolet spectroscopy [3,12,13,14].
In this study, the preparation of iron nanoparticles (Fe/NPs) was based on the green synthesis method, where extracts of different natural materials such as moringa leaves, potato peels, tea waste, and onion peels used for the synthesis of iron nanoparticles (Fe/NPs). The iron nanoparticles were characterized using different techniques such as X-ray diffraction (XRD), Fourier transform infrared spectroscopy (FT-IR), and visible and ultraviolet spectroscopy (UV spectrum). The particle size, magnetic properties, and morphology of Fe/NPs depended on the conditions of the materials used, such as the extract of onion peels, potato peels, tea waste, and moringa leaves; the obtained nanoparticles had different particle sizes, morphologies, yields, and magnetic properties. These Fe/NPs were used in wastewater treatment; the different parameters were applied to determine the efficiency of iron nanoparticles, such as contact time (0–60) min and dose (0.1–0.5) g/L, using this technology after the sedimentation stage of raw wastewater.

2. Materials and Methods

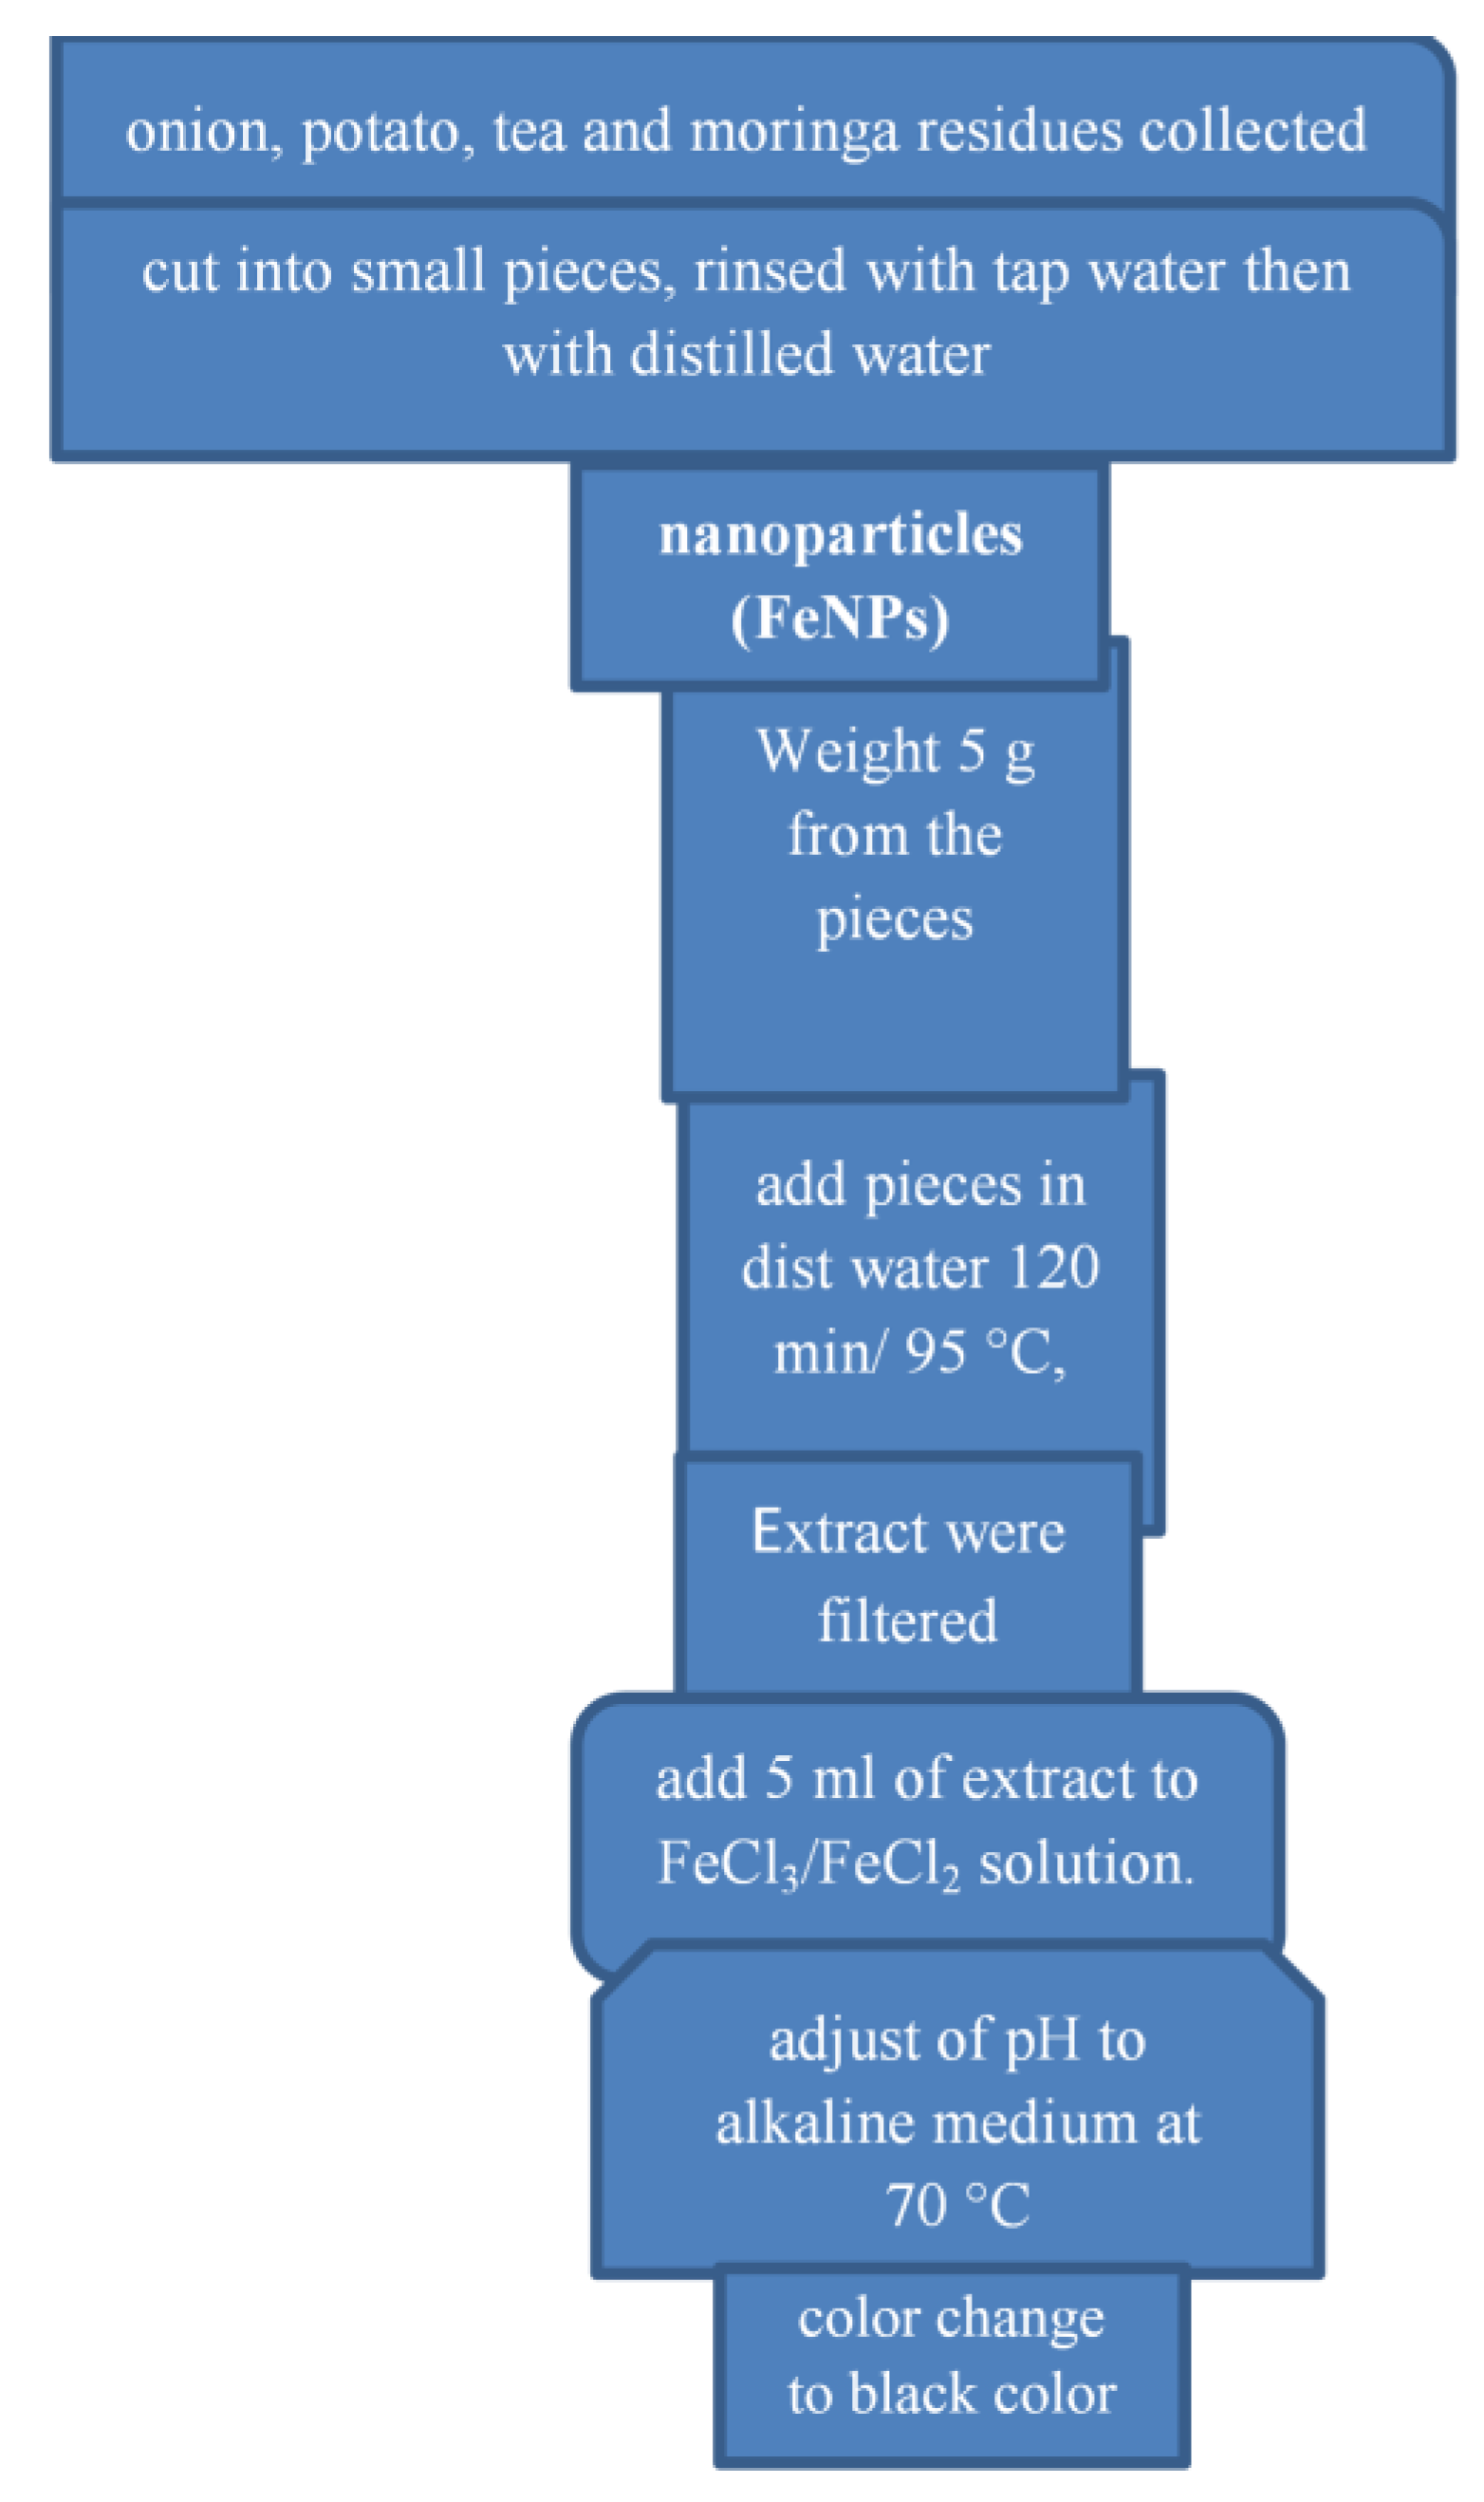
2.1. Preparation of the Extracts of Waste Natural Materials and Iron Nanoparticles

This work aims to prepare iron nanoparticles from extracted waste natural materials (WNMs), as shown in Figure 1. The magnetic iron nanoparticles were synthesized using a mixture of FeCl3·6H2O and FeCl2·4H2O, aided with onion, potato, tea, and moringa extracts. These materials were obtained from the local markets, Giza, Egypt. They were prepared by washing onion peels, potato peels, tea waste, and moringa leaves several times using tap water to remove any dust, and then they were rinsed and dried at room temperature. The onion peels, potato peels, and moringa leaves were cut into small pieces. Then, approximately 50 g of every waste extract was weighed and boiled in 500 ml of tap water for 30 min. The filtrate of the extract was kept at 4 °C in the refrigerator [4,15]. The magnetite nanoparticles were prepared from the extracts by adding 5 ml of extract to a bottle of iron solution with the simultaneous drop-wise addition of NaOH (I N) solution (this process was carried out at 80 °C, and the solution was mixed at 1000 rpm for 2 h) [16]. The synthesis of nanoparticles was observed by the changing color of the solution from orange to black; the formation of Fe/NP was confirmed by the appearance of a black precipitate [15]. Fe/NPs were separated by centrifugation at 1000 rpm/min, collected, and dried in a dry oven at 50 °C for 48 h [11].

2.2. Characterization of the Synthesized Fe/NPs

The prepared magnetite nanoparticle (Fe/NPs) compounds were characterized using several instruments. For example, a UV–visible spectrophotometer (T-70 spectrophotometer at the Housing and Building Research Center, Chemistry Lab) was used for the analysis of synthesized Fe/NPs periodically as a function of time in the wavelengths ranging from 190–340 nm with a resolution of 0.5 nm. Crystallographic study of Fe/NPs was carried out using X-ray diffraction (XRD 6100, Shimadzu, Tokyo, Japan) with CuK α radiation from 40 kV/30 mA using the 2θ range of 20–70°. Chemical functional group identification on Fe/NPs was determined using FT-IR (FT-IR 8400S, Shimadzu, Tokyo, Japan) in the spectral range of 400–4000 cm−1 and elemental analysis was carried out in the Na-U channel using EDX (EDX 720, Shimadzu, Tokyo, Japan).

2.3. Characteristics of Raw Wastewater

2.3.1. Sample Sites and Analysis of Raw Samples

The grey water (collected from the Orasqualia station for wastewater treatment), characteristics indicated that such wastewater was relatively strong, as exhibited by the ammonia, COD, BOD, TDS, EC, pH, PO4, TP, TN, TKN, NH3, NO3, TSS, and phosphate. The characteristics of grey water are shown in Table 1 compared with the Egyptian Environmental Association Affair (EEAA) [17]. The COD and BOD were 560 and 302 mg/L, respectively. The PO4, TP, TN, TKN, NH3, and NO3, were 3.3, 0.66, 33.6, 28.2, 13.2, and 5.4. The pH, EC, TSS, and TDS were 7.2, 1099, 330, and 611 mg/L; turbidity was 89.5 NTU. ORP was −19.7 mV, respectively.

2.3.2. Reagents

All chemicals were of analytical grade. The chemical reagents used included phosphoric acid (H3PO4, 85.0%, Fischer scientific, Loughborough, UK), potassium dichromate (K2Cr2O7, 99.0%, Merck, Darmstadt, Germany), boric acid (H3BO3, 99.5%, LOBA Chemie, Mumbai, India), hydrochloric acid (HCl, 37.0%, Fischer scientific, Loughborough, UK), nitric acid (HNO3, 70.0%, sodium hydroxide (NaOH, 99.0%, Merck, Darmstadt, Germany), and ammonia solution (NH3, 35.0%, Fischer scientific, Loughborough, UK).

2.3.3. Instruments and Characterization Techniques

The following instruments were used through this work: a furnace, the drying oven (Fisher Scientific Equipment, American provisioner of scientific instruments, Waltham, MA, USA), digital electronic balance (PCE-BSK 310, PCE Instruments, Southampton, UK), and DIW system (Millipore, Darmstadt, Germany) were used. The pH measurements of the samples were achieved using a pH meter (AD110, ADWA, Szeged, Hungary). Fourier transform infrared spectroscopy (FT-IR) (Thermo Fisher Scientific, Oxford, UK), an orbital shaker instrument (Thermo Fisher Scientific, Waltham, MA, USA), a COD digestor instrument (auto time-controlled, MAC, Udaipur, India), a BOD5 incubator (Airco, Mumbai, India), UV–Vis spectrophotometers (PG Instruments, Lutterworth, UK), an incubator (Thermo Fisher Scientific, Oxford, UK), a portable multiparameter water-quality measurement (HORIBA company, Irvine, CA, USA), and a Kjeldahl digestion instrument (ESEL, India) were used. Samples of raw bone waste materials were analyzed by a scanning electron microscope (SEM) model (Quanta 250 FEG—field emission gun—attached with accelerating voltage 30 kV (FEI Company, Eindhoven, Netherlands) [18].

2.4. Batch Experiments Fe/NPs

The treatment wastewater experiments were carried out in 1L treated by Fe/NPs optimized by varying the dose (0.1, 0.3, 0.4, and 0.5 g/L agitated 30 min) and contact time (0, 15, 30, 45, and 60 min agitated with 0.4 g). All experiments were carried out in a jar test at 100 rpm. The same set of the experiment was repeated three times. All experiments were conducted at room temperature. The residual concentration of pollutants in the filtrate was detected using the EPA method. The removal efficiency (R%) was calculated from the Equation (1) [9,19,20]:
R % = C 0 C e C 0 × 100
where R% is the removal efficiency, C0 is the initial concentration (mg/L), and Ce is the concentration after adsorption (mg/L).

3. Results and Discussion

3.1. Characterization

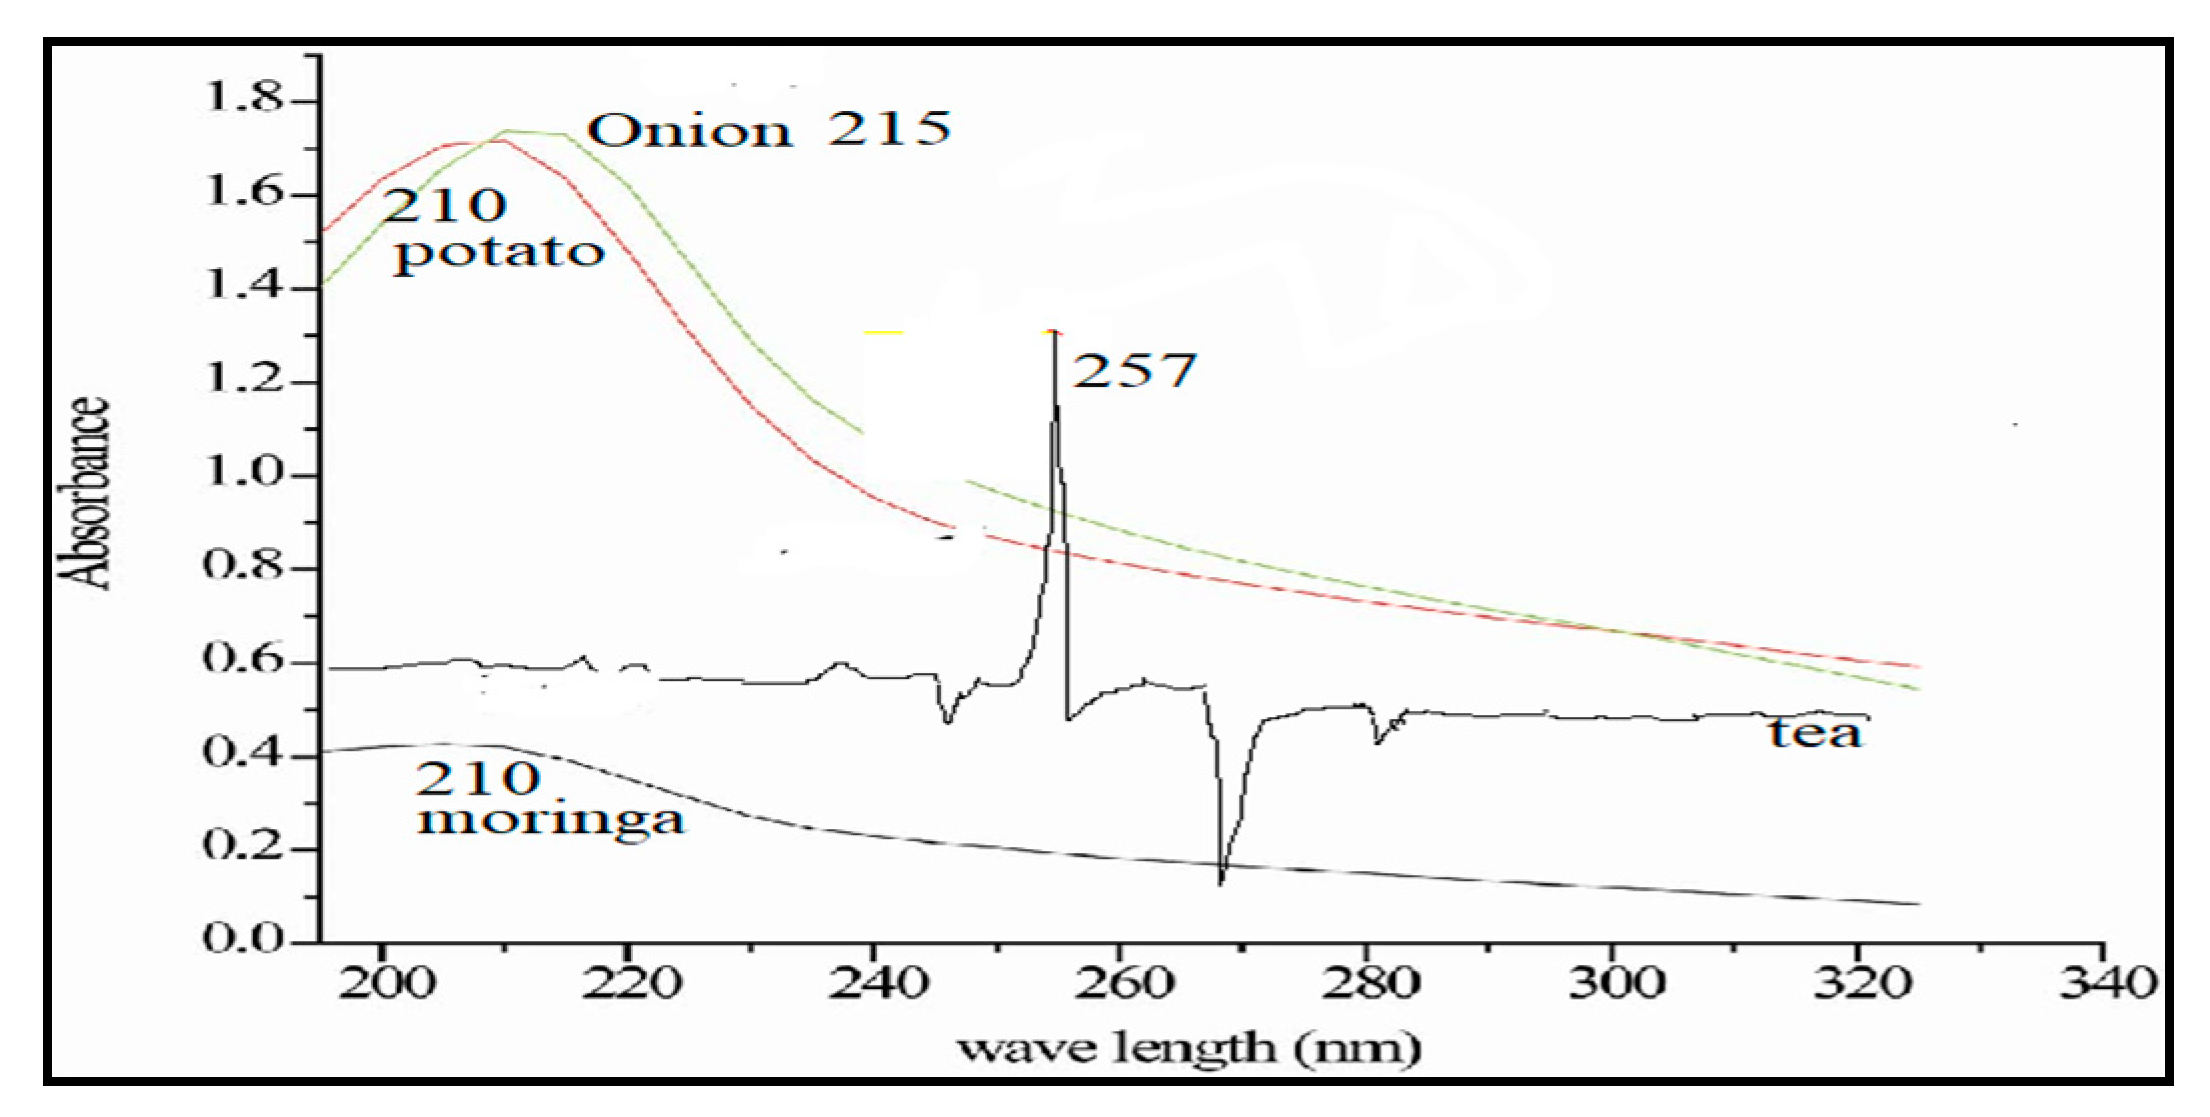
3.1.1. UV–Vis Spectral Analysis of Fe/NPs

Fe/NPs formations were confirmed by the color change that immediately occurred after the addition of the plant extract iron solution and the adjusted pH. The dark color was a result of surface plasmon excitation vibrations in the Fe/NPs [11]. The absorption peaks were at 215, 210, 257, and 210 nm for onion, potato peels, tea waste, and moringa, respectively. This indicates the presence of Fe/NPs [2]. Figure 2 shows the UV–visible absorption spectrum of Fe/NPs synthesized using each extract waste residue. The formation of Fe/NPs is known to take place through complexation of Fe salts followed by the capping of Fe with phenolic compounds [11].

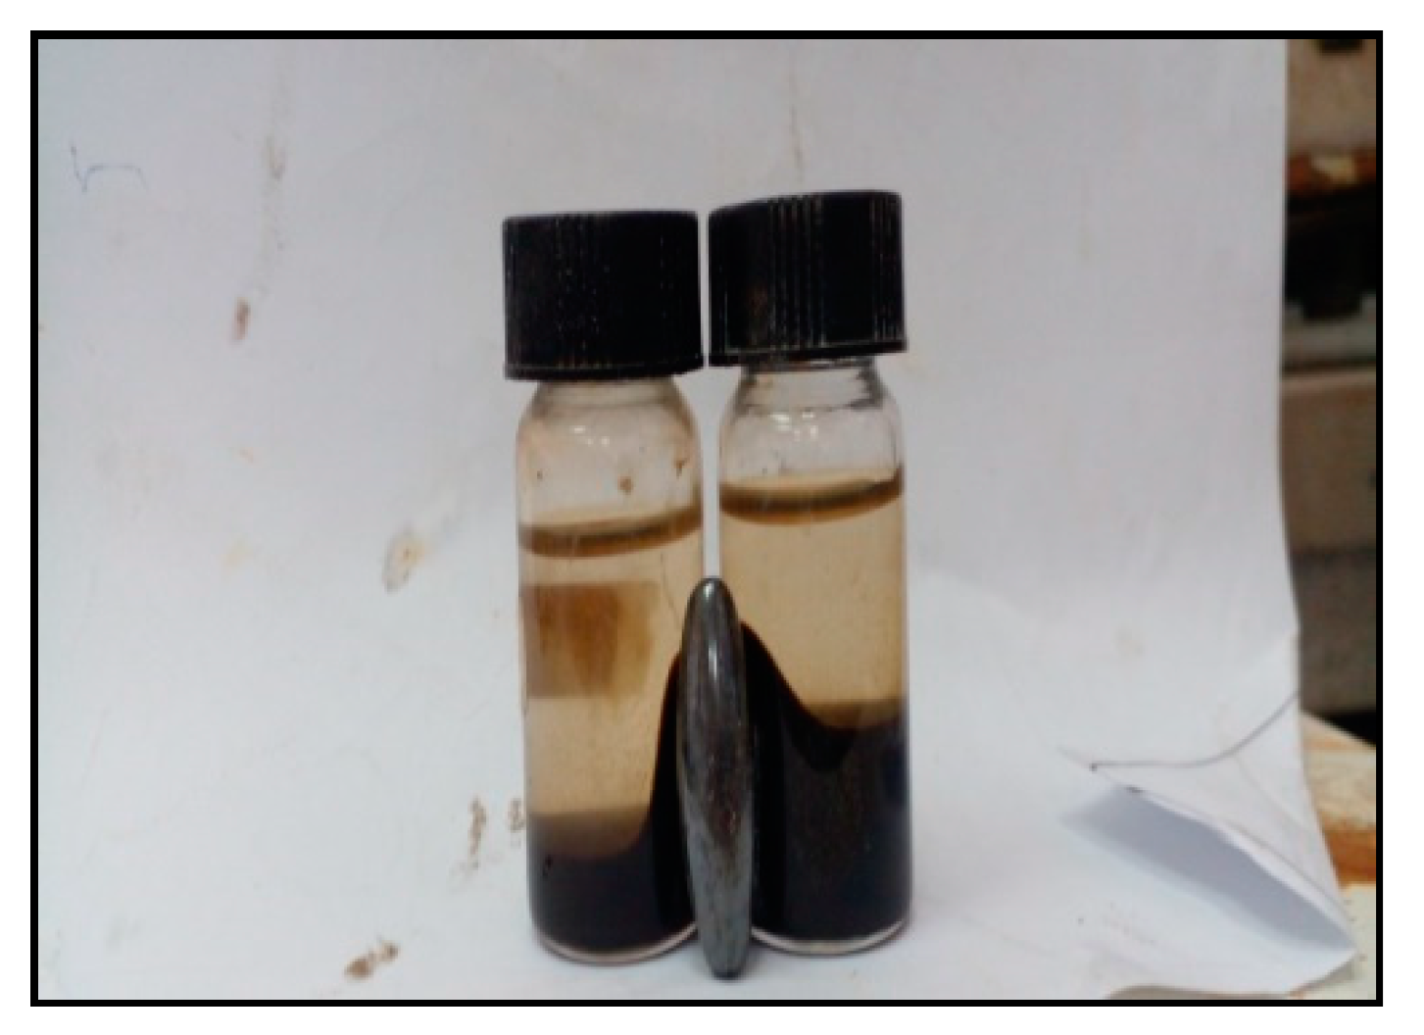
3.1.2. Appearance of Synthesized Fe/NPs

The appearance of the black color of the Fe/NPs solution indicates the formation of Fe/NPs with the increasing time; this is shown in Figure 3. The color changes arise due to the excitation of the surface plasma resonance phenomenon typically of Fe/NPs [2]. The nanoparticles’ formation was confirmed by the color immediately converted from transparent brown to black in a few seconds, demonstrating the synthesis of iron nanoparticles [11].

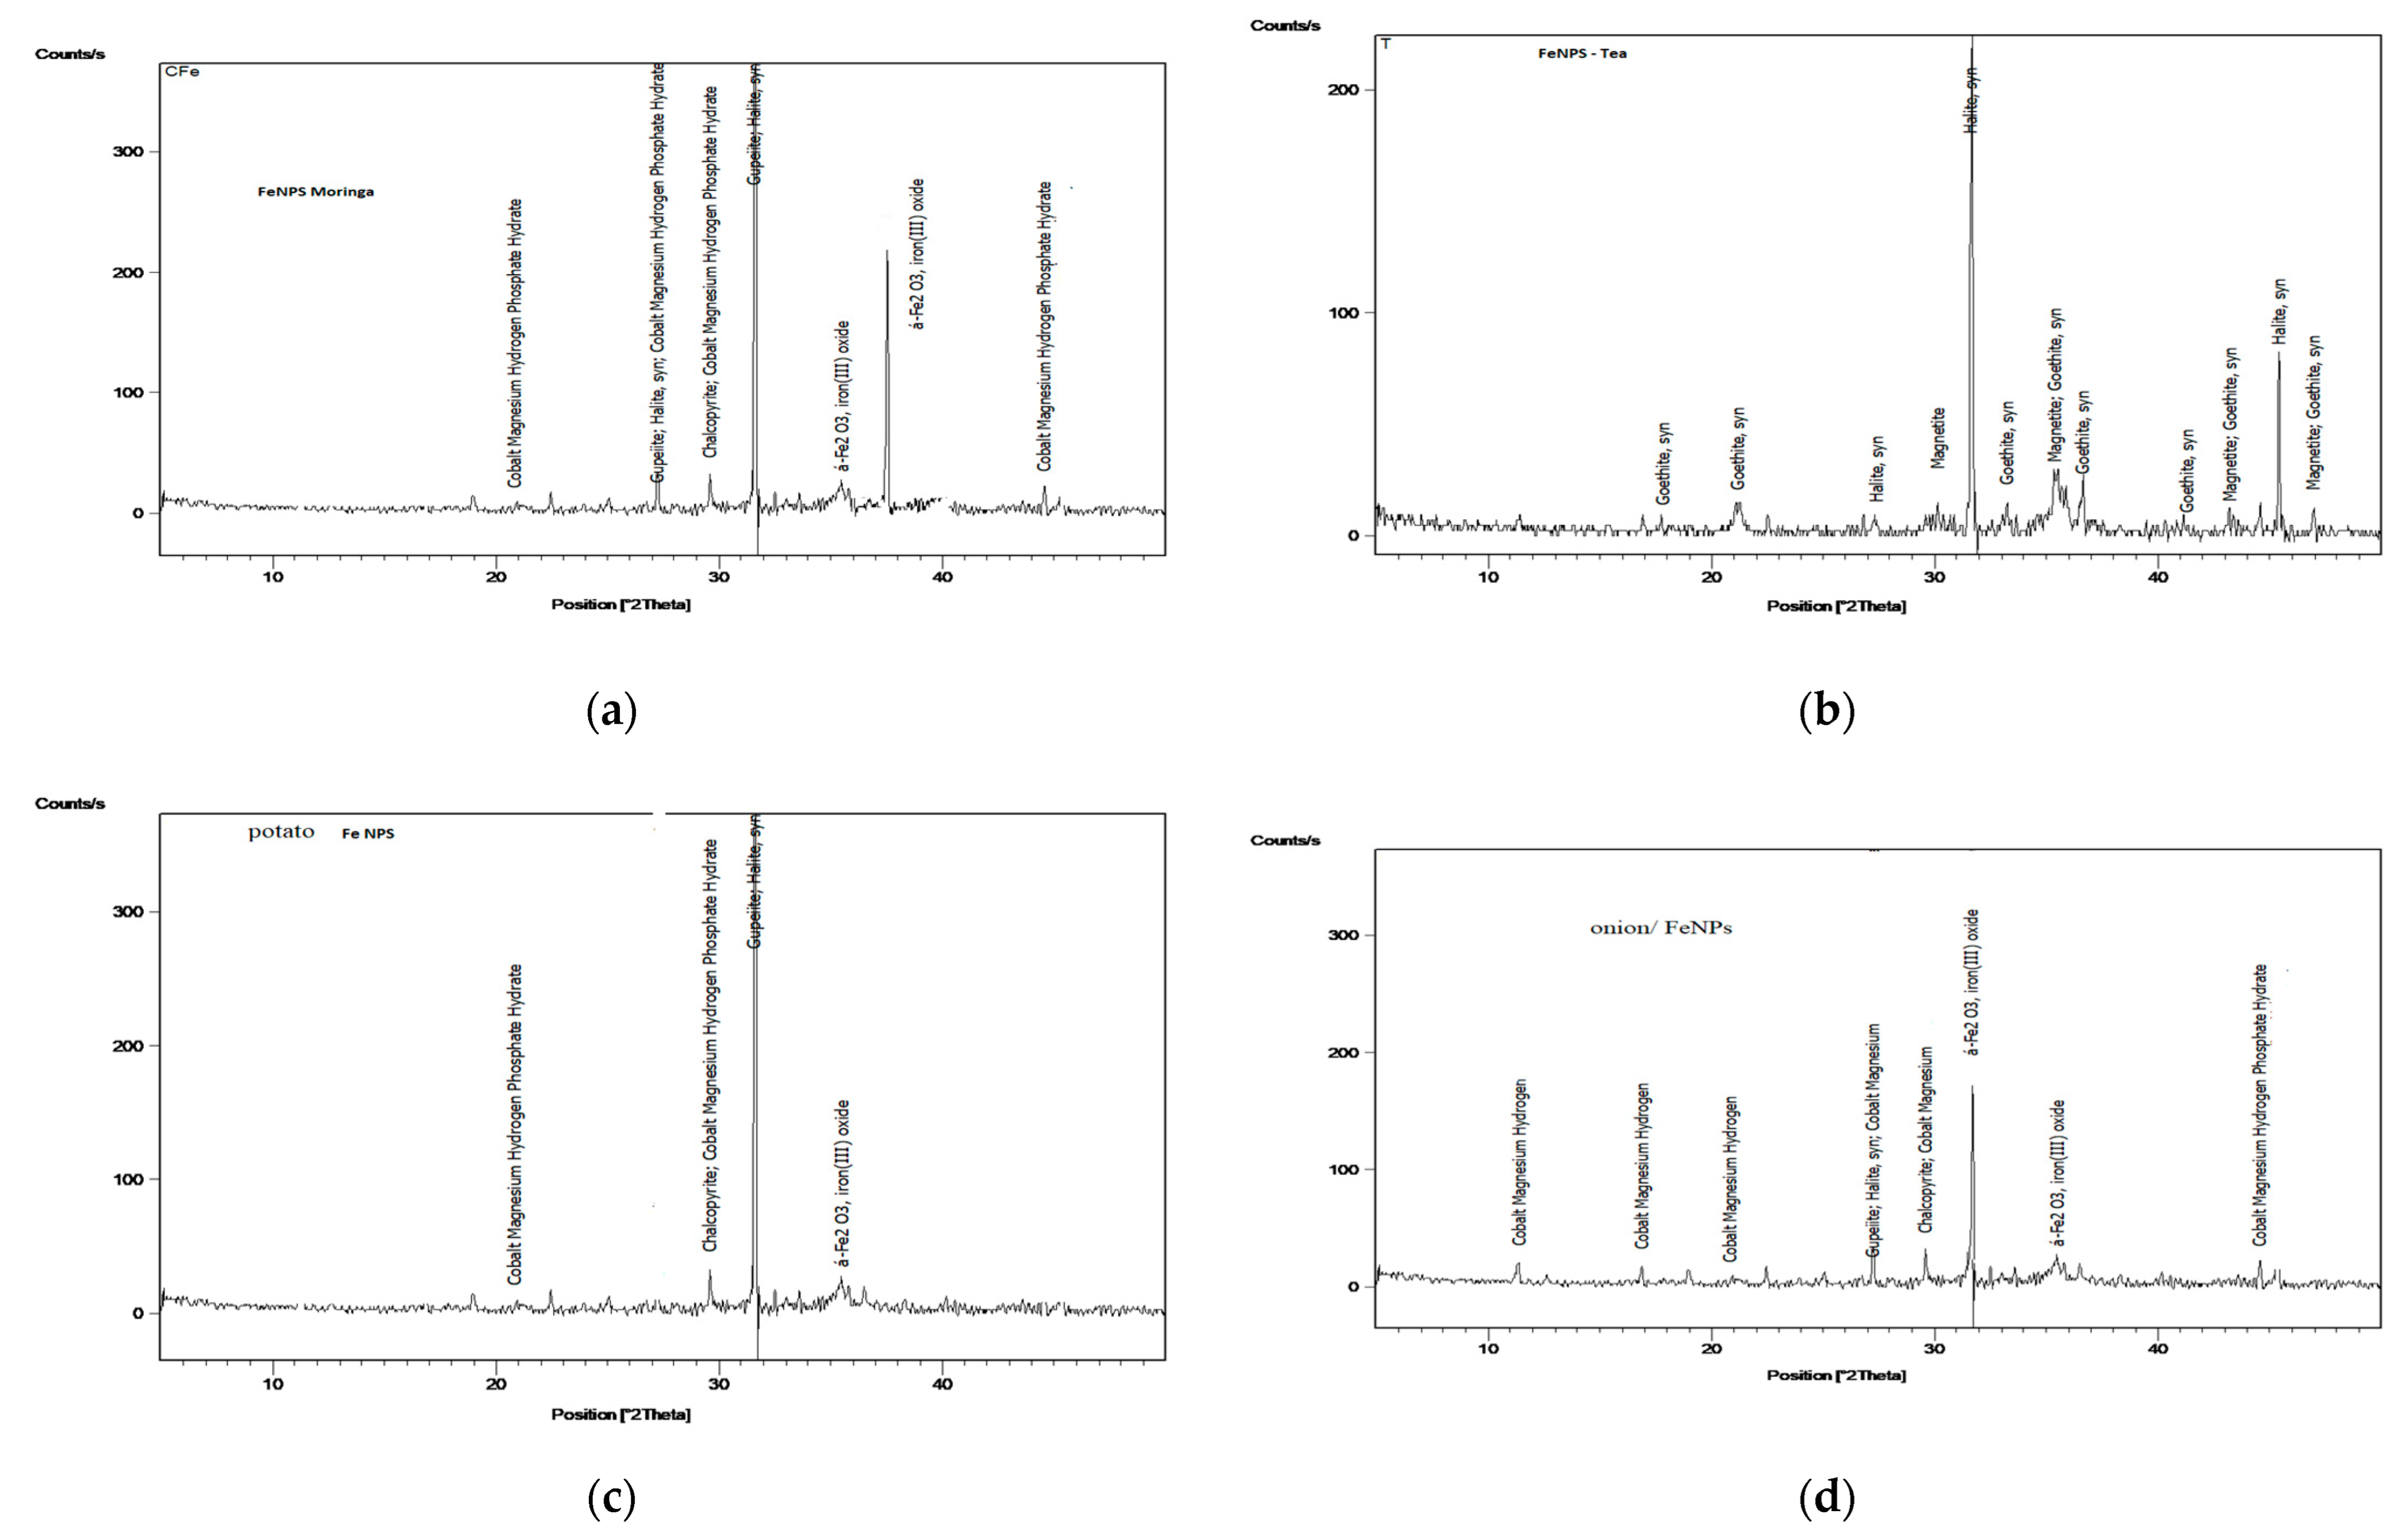
3.1.3. XRD Pattern Analysis of Fe/NPs

The XRD was obtained to investigate the presence of nanoparticles on moringa, potato, onion, and tea surface. The XRD pattern of the synthesized adsorbent was in the angle range of 2θ, applying Cu kα radiation (λ = 1.5 Å). The XRD technique was used to identify the structure of the prepared iron nanoparticles and is depicted in Figure 4.
The characteristic nanoparticle peak occurred at approximately 2θ = (10° – 60°). The analysis of the spectrum XRD technique was used for particle-size analysis of Fe/NPs; the XRD pattern shows that the peaks the nanoparticle were 44°, 35°, 35–32°, and 30–35–44° for moringa, potato, onion, and tea, respectively. This resulted in no clear reflection peak in potato and onion due to the other crystalline phase, which might be present as impurity. Thus, the nanoparticles essentially consisted of a binary mixture of the two spinel magnetic iron oxides, magnetite-Fe2O3 and solid elements [1,6]. In this pattern, the peak at the angle of 32, 30, 35, and 44° confirmed the presence of Fe2O3 particles in the adsorbent structure. Generally, the XRD analysis confirmed that the Fe2O3 particles were successfully coated on the moringa, potato, onion, and tea surface [11].

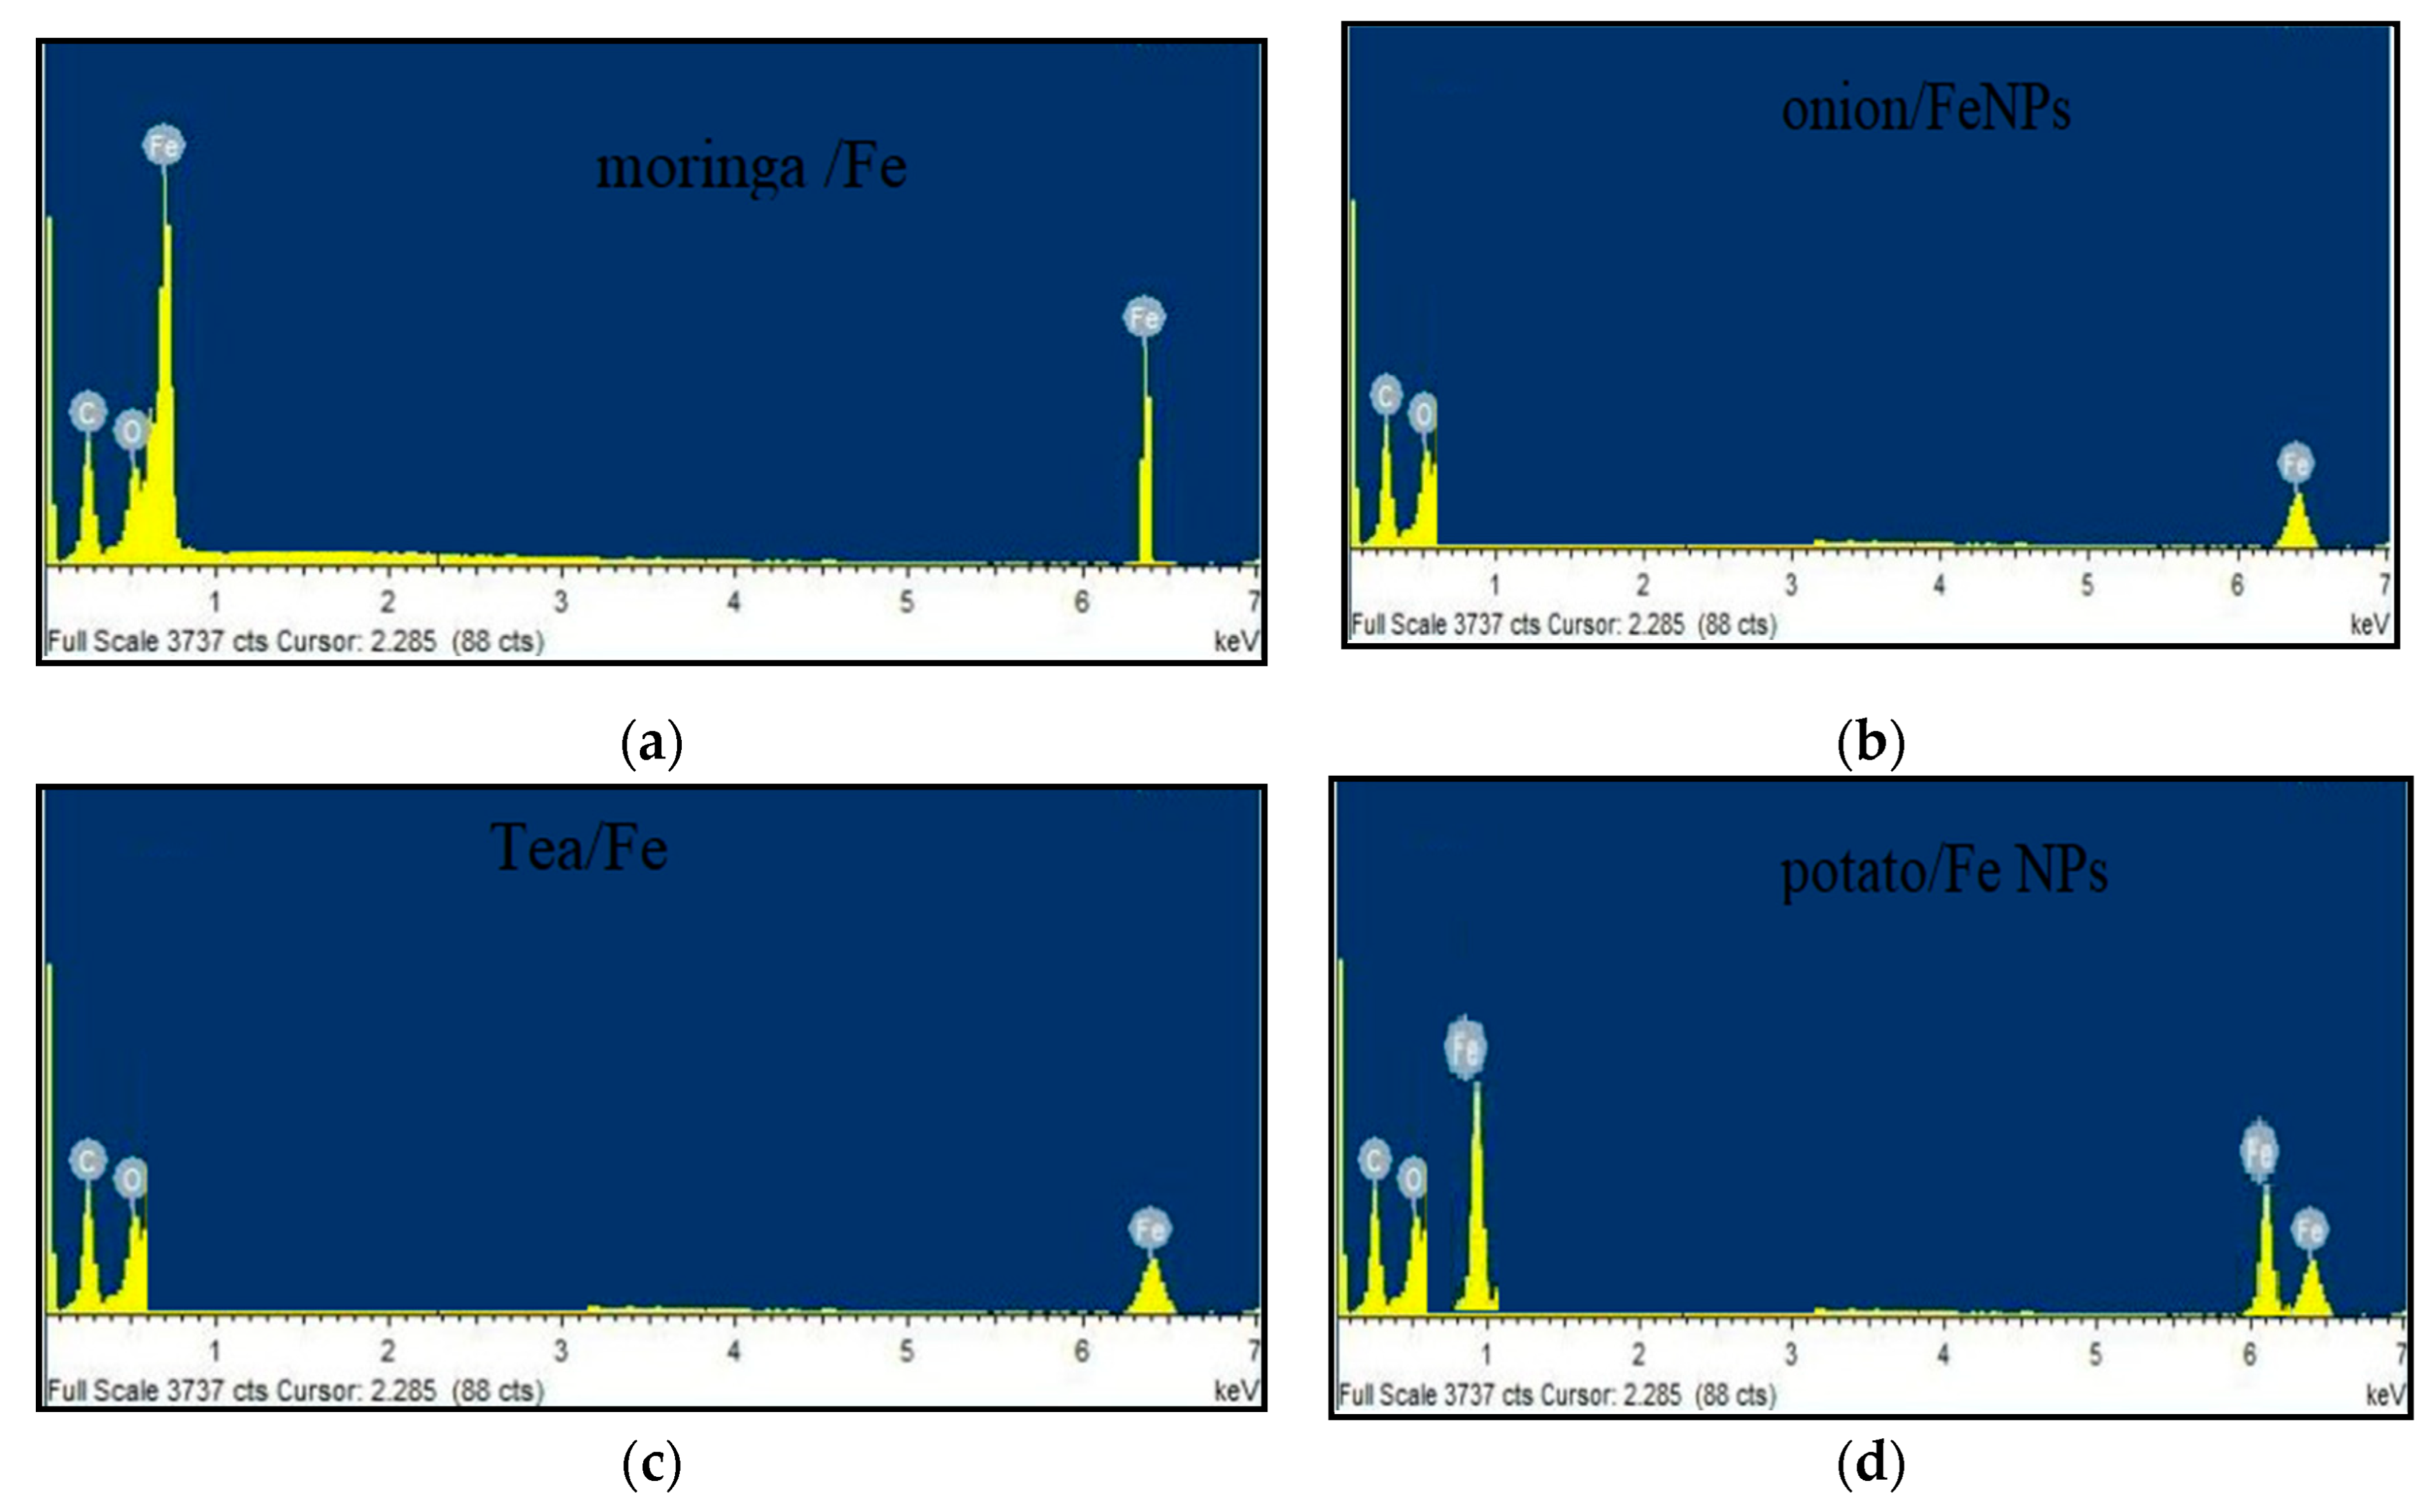
3.1.4. Energy Dispersive X-ray Analysis

EDX analysis was then performed on the surface of the Fe/NPs, as shown in Figure 5; the EDX results of onion, potato peels, tea waste, and moringa magnetite nanoparticles reveals the elemental composition of the prepared nanoparticles. The EDX profile shows intense peak signals of iron with a Kα peak at 6.5 keV, 6.2 keV, 0.9 keV, and 0.7 keV. Other signals observed include that of oxygen and carbon; the presence of C and O peaks were related to polyphenols or any other C and O containing a compound in the natural materials’ extract. The existence of elemental iron and oxygen demonstrate that the nanoparticles were essentially present in oxide form [11]. The percent of detected elements were carbon (C) 12%, iron (Fe) 52%, and oxygen (O) 28%. These results indicate the extract of moringa leaves and potato peels were more highly efficiency than onion and tea for the formation of magnetite iron nanoparticles. Very similar results were reported for Fe nanoparticles prepared with the other leaf [11].

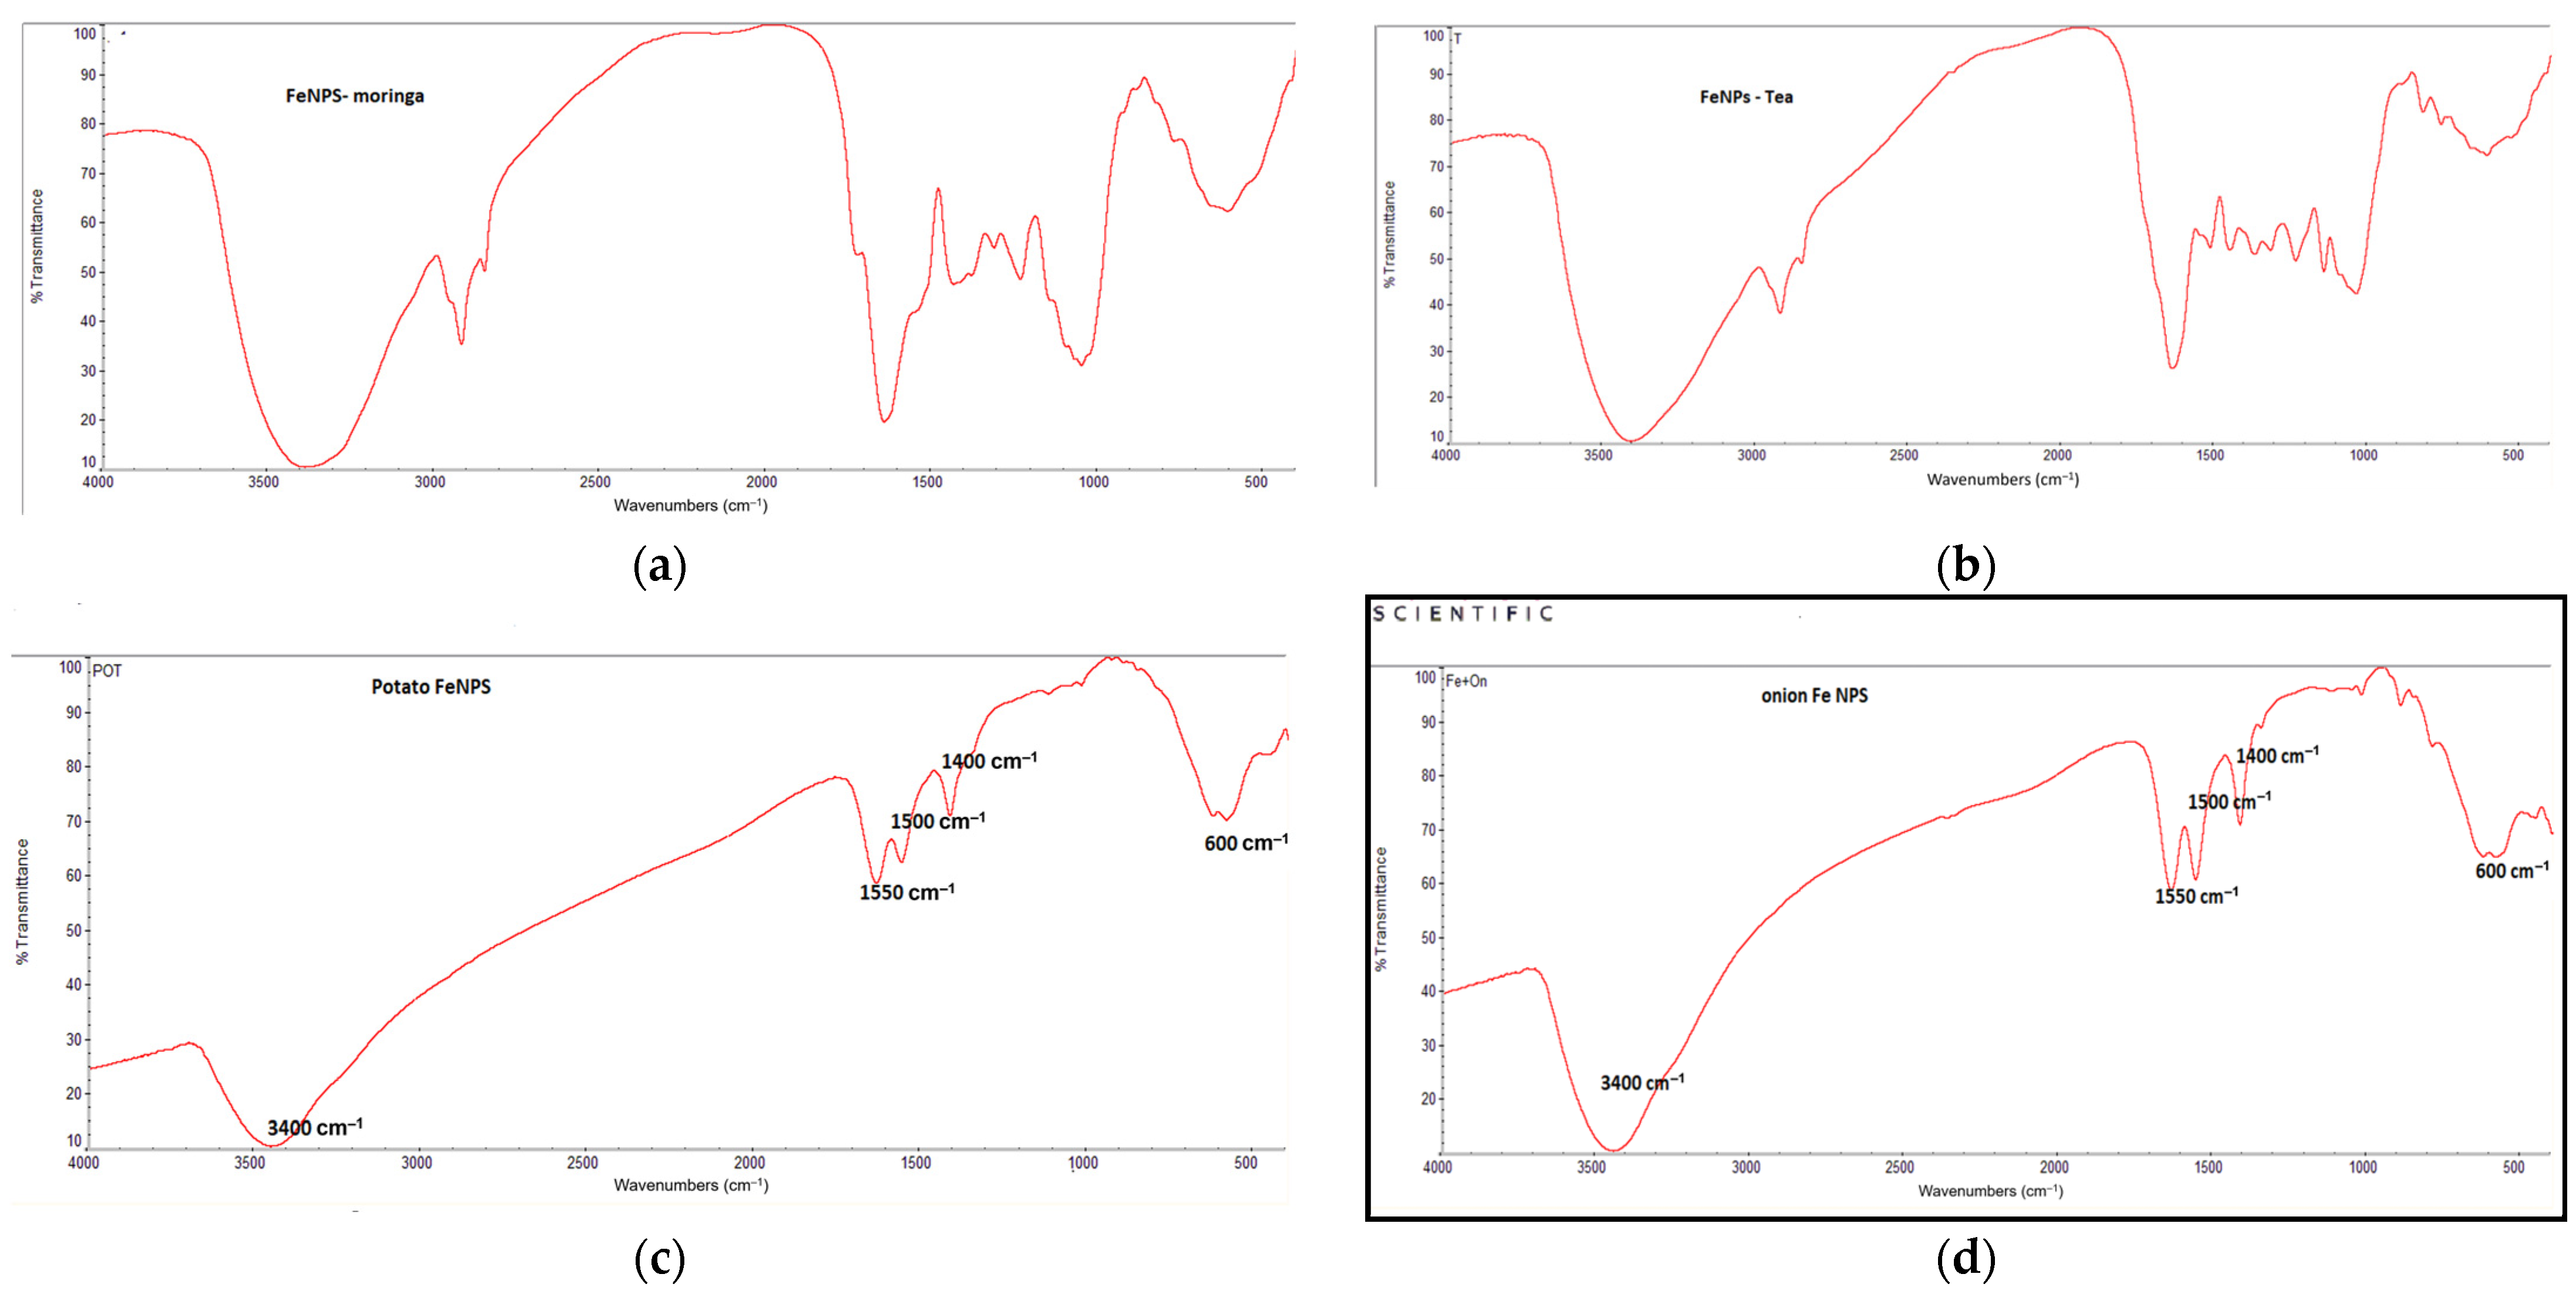
3.1.5. The FT-IR Spectra of Fe/NPs

The FT-IR measurements were carried out to identify the possible bio-molecules responsible for the reduction of ferrous chloride and capping of the reduced Fe/NPs. The FT-IR spectra of Fe/NPs after preparation by the green synthesis method from onion, potato peels, tea waste, and moringa extracts are shown in Figure 6. All of the above peaks which can be detected in the spectrum of synthesized Fe/NPs were subjected to FT-IR that showed various bands; the O-H stretching at approximately 3400 cm−1 showed the presence of hydroxyl groups from the polyols such as flavones, terpenoids, and polysaccharides present in the various extracts. The decrease in intensity of band O-H stretching in onion and potato might be due to the interaction of nanoparticles. The bands at 1645 cm−1 and 1041 cm−1 denote the presence of organic material in the sample, majorly contributed by onion, potato peels, tea waste, and moringa iron magnetite particles (Fe/NPs). These bands confirmed the presence of compounds such as flavonoids and terpenoids and, hence, may be held responsible for the efficient capping and stabilization of the obtained magnetite nanoparticles [11].

3.1.6. XRF Analysis of Banana, Orange, and Pomegranate

The XRF pattern of iron oxide nanoparticle prepared from onion, potato peels, tea waste, and moringa are shown in Table 2. The results show the Fe2O3 composite in onion, potato peels, tea waste, and moringa Fe/NPs. The percent of magnetite nanoparticles (Fe2O3) from onion, potato peels, tea waste, and moringa were 67.3%, 53.92%, 40.86%, and 46.86%, respectively. The Fe2O3 percent in magnetite nanoparticles was onion > potato peels > moringa > tea waste.

3.1.7. Yield of Iron Oxide Nanoparticles

The iron oxide nanoparticles were dried at 50 °C until the magnetite nanoparticles were completely dry. The weight of magnetite nanoparticles related to the type of extract used in the synthesis of nanoparticles. Table 3 shows that the weight of the magnetite nanoparticles for moringa, potato, onion, and tea were 38.235, 19.116, 19.116, and 12.899, respectively.

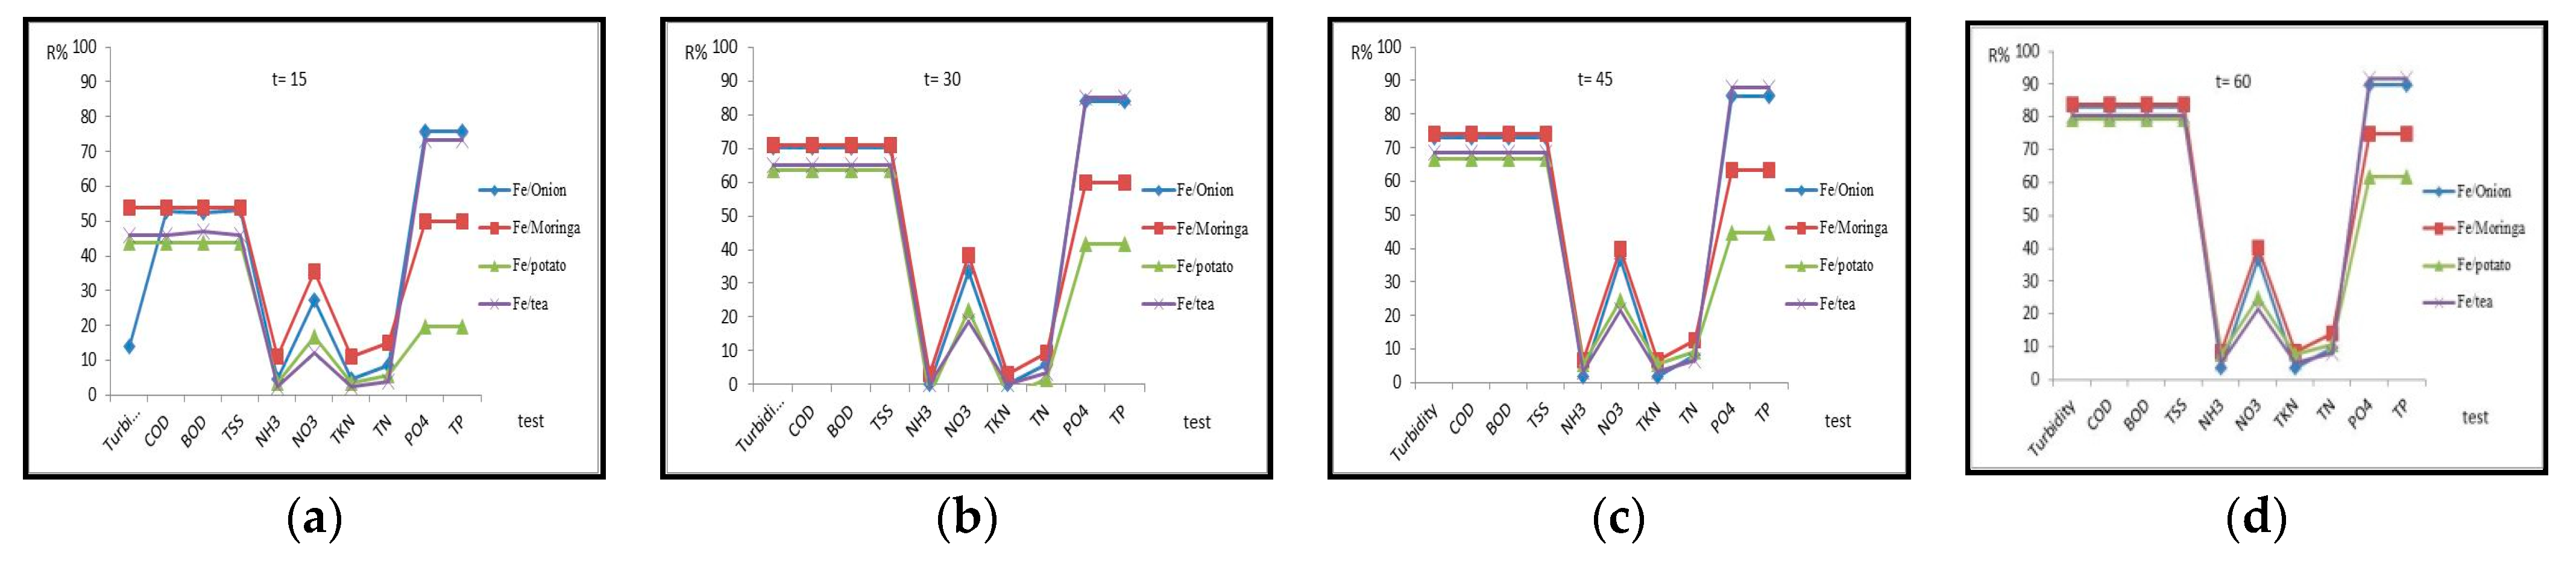
3.2. Effect of Contact Time

Figure 7 illustrates the effect of contact time on the efficiency of magnetite nanoparticles for the removal of pollutants from grey wastewater, The following condition were applied: 0.1 g/L solution of the adsorbent, optimal pH (pH = 7.5 ± 0.1), and the contact time of (0–60) min, as indicated in Table 4; the removal efficiencies were increased sharply up to equilibrium at 45 min and then slightly increased after 45 min until 60 min. The sharp increase in the removal efficiency may be due to the existence of enormous vacant active sites in the surface. However, by raising the contact time, the availability of pollutants to the active sites on the adsorbent surface was limited [21], which makes the adsorption efficiency reduce. In a similar study, this phenomenon was investigated using different adsorbents [1]. Iron nanoparticles were used for removing pollutants from wastewater, due to the interaction between the compounds and the functional groups at the surface of the absorbent. The functional groups served to define the effectiveness, selectivity, capacity, and reusability of an absorbent. Furthermore, in the case of high iron oxide loading at the surface, the higher the rate of reduction in the nitrate and ammonium ion [22]. The results showed that the optimum time for metal removal by magnetic nanoparticles was obtained in 45 min [1,23].

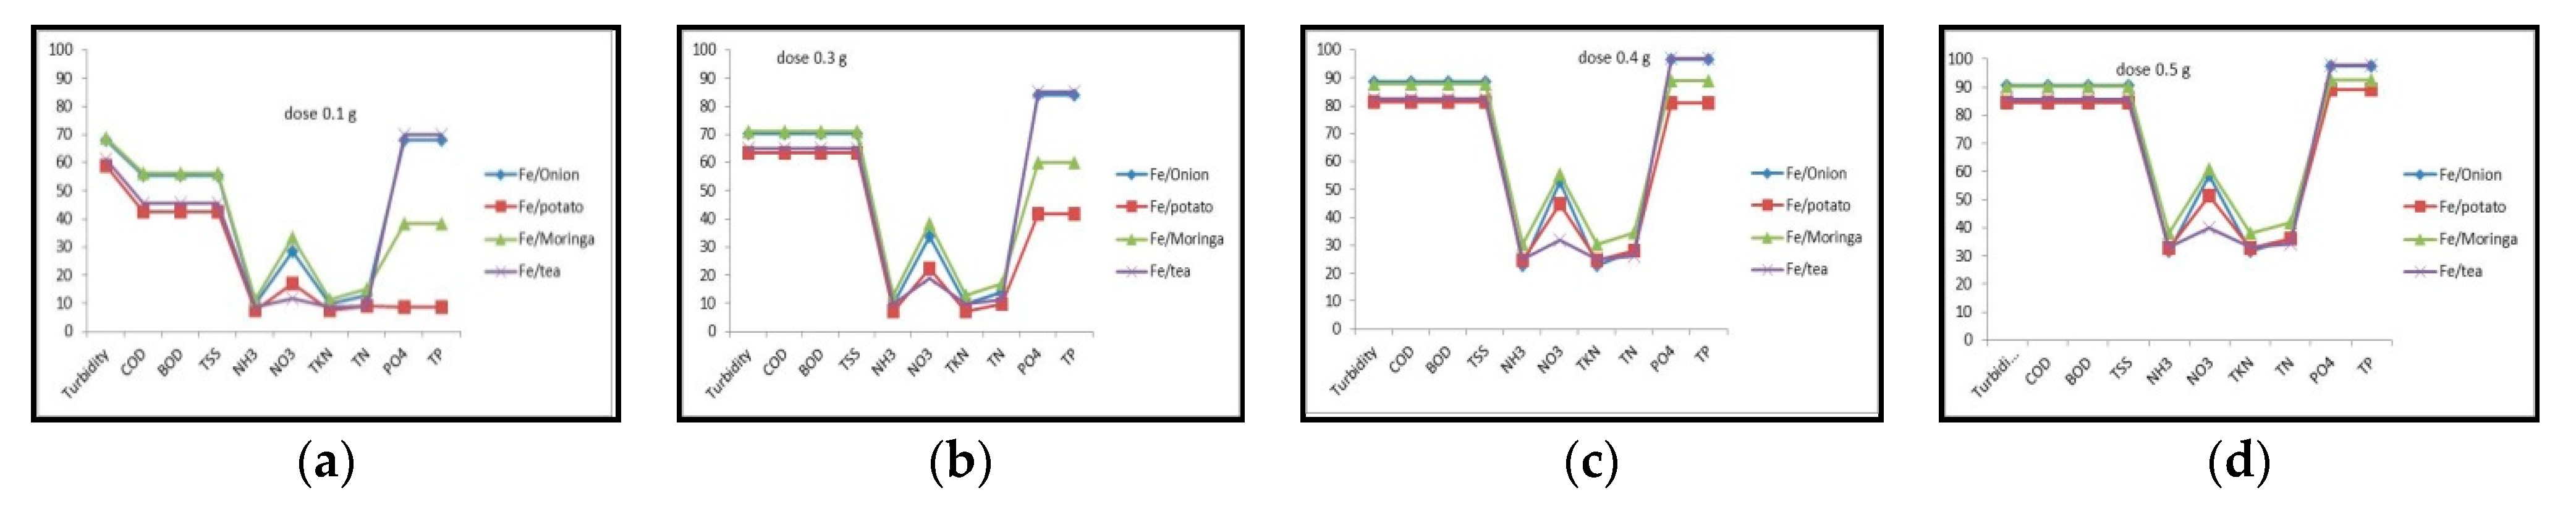
3.3. Effect of Adsorbent Dosage

The effect of amount (0.1–0.5 g/L) of magnetic nanoparticles (Fe/NPs) on the removal of pollutants from wastewater such as chemical oxygen demand, biological oxygen demand, total suspended solid, turbidity, ammonia, Kjeldahl nitrogen, total nitrogen, phosphate, and nitrate were studied in samples before and after treatment. The dosage of nanoparticles affected its ability to sorbent contaminants. As shown in Figure 8, when the magnetic particles’ dosage increased, the removal efficiency increased, as shown in Table 5. Usually, the reduction of pollutant concentration with the increased dose of iron nanoparticles is a surface function. It may be assumed that the availability of active sites on the nanocomposite increases at higher doses [8,23].
The effect of different amounts of Fe/NPs on the adsorption capacity and efficiency under the optimal condition (pH = 7.4, t = 45 min and 200 rpm) is illustrated in Figure 8. It can be observed that, with an increase in the adsorbent dosage from 0.1 to 0.5 g/L, the removal efficiencies at optimum dose (0.4), for onion, potato, moringa, and tea, were from 88.39, 88.39, 88.39, 88.39, 22.86, 52,81, 22.86, 27.94 and 96.66%, 81.25, 81.25, 81.25, 81.25, 24.57, 44.68, 27.98, and 81.06%, 87.85, 87.85, 87.85, 87.85, 30.17, 55.46, 34.45, and 88.93%, 82.5, 82.5, 82.5, 82.5, 24.91, 31.87, 26.09, and 97.06% of COD, BOD, TSS, turbidity, ammonia, TKN, TN, phosphate, and nitrate, respectively. The rise in the adsorption efficiency was related to the increase in the availability of active sites on the adsorbents which can give rise to the adsorption of pollutants. Jung et al. reported that, with an increase in the dosage of various adsorbents, the pollutants’ removal was enhanced. However, a decrease in the adsorption capacity with an increase in the adsorbent dosage was probably due to the instauration of the active sites on the adsorbent surface during the adsorption process. This phenomenon can also be due to the aggregation resulting from high adsorbate concentrations, leading to the decrease in the active surface area of the adsorbent [1,23].

4. Conclusions

In the present study, the synthesized iron nanoparticles aided with natural waste material such as onion, moringa, tea waste, and potato were used as reduction and stabilization agents for the synthesis of iron nanoparticles and as an adsorbent for the treatment of wastewater. The synthetization of iron nanoparticles was confirmed by different characterization techniques such as EDX, XRF, FT-IR, XRD, and UV spectrum. The XRF and XRD pattern of the iron nanoparticles revealed a crystalline structure of the nanoparticles. The results illustrated that the synthesized adsorbent showed that iron magnetite aided with moringa and onion had a high efficiency than magnetite aided with potato and tea. The optimum conditions for the adsorption process were obtained with a contact time of 45 min and a dose of 0.4 g. Moreover, due to the favorable performance of onion and moringa in the removal of pollutants and its feasible separation from the aqueous solutions, it can be used as an efficient adsorbent in the treatment of water and wastewater; after conducting the necessary tests for the outlet samples of water after the treatment process, it was found that there were no negative effects on the water samples.

Author Contributions

Conceptualization, H.M.A. and M.A.E.-k.; methodology, H.M.A.; software, N.A.S.; validation, F.M.A.-H.; formal analysis, M.M.H.; investigation, H.M.A.; resources, H.M.A.; data curation, H.M.A.; writing—original draft preparation, H.M.A. and M.A.E.-k.; writing—review and editing, H.M.A. and M.A.E.-k.; visualization, H.M.A. and M.A.E.-k.; supervision, M.A.E.-k. All authors have read and agreed to the published version of the manuscript.

Funding

This research received no external funding.

Institutional Review Board Statement

Not applicable.

Informed Consent Statement

Not applicable.

Data Availability Statement

The data is unavailable due to privacy or ethical restrictions.

Conflicts of Interest

The authors declare no conflict of interest.

References

  1. Kakavandi, B.; Kalantary, R.R.; Farzadkia, M.; Mahvi, A.H.; Esrafili, A.; Azari, A.; Yari, A.R.; Javid, A.B. Enhanced chromium (VI) removal using activated carbon modified by zero valent iron and silver bimetallic nanoparticles. J. Environ. Health Sci. Eng. 2014, 12, 115. [Google Scholar] [CrossRef] [PubMed]
  2. Kale, R.D.; Barwar, S.; Kane, P.; Bhatt, L. Green Synthesis of Magnetite Nanoparticles using Banana Leaves. Eur. J. Sci. 2018, 1, 26–34. [Google Scholar] [CrossRef]
  3. Kandasamy, S.; Rajendran, S.P. Methods of synthesis of nano particles and its applications. J. Chem. Pharm. Res. 2015, 7, 278–285. [Google Scholar]
  4. Das, G.; Shin, H.-S.; Kumar, A.; Vishnuprasad, C.N.; Patra, J.K. Photo-mediated optimized synthesis of silver nanoparticles using the extracts of outer shell fibre of cocos nucifera L. fruit and detection of its antioxidant, cytotoxicity and antibacterial potential. Saudi J. Biol. Sci. 2021, 28, 980–987. [Google Scholar] [CrossRef] [PubMed]
  5. Abdel-Shafy, H.I.; Mansour, M.S.M. Green Synthesis of Metallic Nanoparticles from Natural Resources and Food Waste and Their Environmental Application. In Green Metal Nanoparticles; Scrivener Publishing: Beverly, MA, USA, 2018; pp. 321–385. [Google Scholar]
  6. Fahmy, H.M.; Mohamed, F.M.; Marzouq, M.H.; Mustafa, A.B.E.; Alsoudi, A.M.; Ali, O.A.; Mohamed, M.A.; Mahmoud, F.A. Review of Green Methods of Iron Nanoparticles Synthesis and Applications. Bionanoscience 2018, 8, 491–503. [Google Scholar] [CrossRef]
  7. Carter, N. Physical Properties of Iron Oxide Nanoparticles. Ph.D. Thesis, Maine University, Orono, ME, USA, 2015. [Google Scholar]
  8. Al-Musawi, T.J.; Mengelizadeh, N.; Al Rawi, O.; Balarak, D. Capacity and Modeling of Acid Blue 113 Dye Adsorption onto Chitosan Magnetized by Fe2O3 Nanoparticles. J. Polym. Environ. 2022, 30, 344–359. [Google Scholar] [CrossRef]
  9. Amany, R.G.; Nagwa, M.S.; Ahmed, S.H.; Abdelmoteleb, Y.A. Biosynthesis, characterization and antimicrobial activity of iron oxide nanoparticles synthesized by fungi. Az. J. Pharm Sci. 2020, 62, 164–178. [Google Scholar]
  10. Badmus, K.O.; Coetsee-Hugo, E.; Swart, H.; Petrik, L. Synthesis and characterisation of stable and efficient nano zero valent iron. Environ. Sci. Pollut. Res. 2018, 25, 23667–23684. [Google Scholar] [CrossRef] [PubMed]
  11. Da’na, E.; Taha, A.; Afkar, E. Green Synthesis of Iron Nanoparticles by Acacia nilotica Pods Extract and Its Catalytic, Adsorption, and Antibacterial Activities. Appl. Sci. 2018, 8, 1922. [Google Scholar] [CrossRef]
  12. Sun, Y.-P.; Li, X.; Cao, J.; Zhang, W.; Wang, H.P. Characterization of zero-valent iron nanoparticles. Adv. Colloid Interface Sci. 2006, 120, 47–56. [Google Scholar] [CrossRef] [PubMed]
  13. Majlesi, M. Preparation and adsorption properties of chitosan-bound Fe3O4 magnetic nanoparticles for phenol removal from aqueous solution. World Rev. Sci. Technol. Sust. Dev. 2016, 12, 371–380. [Google Scholar]
  14. Tiwari, D.; Behari, J.; Sen, P. Application of nanoparticles in waste water treatment. World Appl. Sci. J. 2008, 3, 417–433. [Google Scholar]
  15. Abdul Elah Mohammad, D.; Mohammad Taher, E. Antimicrobial activity of silver nanoparticles fabricated from some vegetable plants. J. Phys. Conf. Ser. 2019, 1294, 062048. [Google Scholar] [CrossRef]
  16. Kheilkordi, Z.; Ziarani, M. Recent advances in the application of magnetic bio-polymers as catalysts in multicomponent. RSC Adv. 2022, 12, 12672–12701. [Google Scholar] [CrossRef] [PubMed]
  17. Egyptian Environmental Association Affair (EEAA). Book, Law 48, 1982, Permissible Values for Wastes in River Nile and Law 44, Law of the Environmental Protection 1994, Updating 2000. Available online: https://faolex.fao.org/docs/pdf/egy18642.pdf (accessed on 1 December 2022).
  18. Ahmed, H.; El-Khateeb, M.; Ahmed, N. Effective Granular Activated Carbon for Greywater Treatment Prepared from Corncobs. Egypt. J. Chem. 2022, 65, 255–263. [Google Scholar] [CrossRef]
  19. Mahmoud, M.A. Thermodynamics and Kinetics Studies of Mn (II) Removal from Aqueous Solution onto Powder Corn Cobs (PCC). J. Chromatogr. Sep. Techol. 2015, 6, 301. [Google Scholar] [CrossRef]
  20. Sadon, F.N.; Ibrahem, A.S.; Ismail, K.N. An overview of rice husk applications and modification techniques in wastewater treatment. J. Purity, Util. React. Environ. 2012, 1, 308–334. [Google Scholar]
  21. Hassan, S.S.M.; Abdel-Shafy, H.I.; Mansour, M.S.M. Removal of pyrene and benzo(a)pyrene micropollutant from water via adsorption by green synthesized iron oxide nanoparticles. Adv. Nat. Sci. Nanosci. Nanotechnol. 2018, 9, 015006. [Google Scholar] [CrossRef]
  22. Nizamuddin, S.; Siddiqui, M.T.; Mubarak, N.M.; Baloch, H.A.; Abdullah, E.C.; Mazari, S.A.; Griffin, G.J.; Srinivasan, M.P.; Tanksale, A. Iron Oxide Nanomaterials for the Removal of Heavy Metals and Dyes From Wastewater. In Nanoscale Materials in Water Purification; Elsevier: Amsterdam, The Netherlands, 2019; pp. 447–472. [Google Scholar]
  23. Khan, S.U.; Zaidi, R.; Hassan, S.Z.; Farooqi, I.H.; Azam, A. Application of Fe-Cu binary oxide nanoparticles for the removal of hexavalent chromium from aqueous solution. Water Sci. Technol. 2016, 74, 165–175. [Google Scholar] [CrossRef] [PubMed]
Figure 1. Schematic diagram of onion, potato, tea, and moringa residues in production of iron nanoparticles.
Environsciproc 25 00099 g001
Figure 2. UV–Vis absorption spectrum of onion, potato peels, tea waste, and moringa magnetite nanoparticles.
Environsciproc 25 00099 g002
Figure 3. Onion, potato peels, tea waste, and moringa magnetite nanoparticles.
Environsciproc 25 00099 g003
Figure 4. The XRD pattern of (a) moringa, (b) tea waste, (c) potato peels, and (d) onion magnetite nanoparticles.
Environsciproc 25 00099 g004
Figure 5. The EDX pattern of (a) moringa, (b) onion, (c) tea waste and (d) potato peels magnetite nanoparticles.
Environsciproc 25 00099 g005
Figure 6. FT-IR spectrum of (a) moringa, (b) tea waste, (c) potato peels and (d) onion magnetite nanoparticles.
Environsciproc 25 00099 g006
Figure 7. Effect of contact time on removal efficiency of iron magnetite nanoparticles at agitation speed 200 rpm, dose 0.1 g/L, and 20 ± 5 °C. (a) 15, (b) 30, (c) 45, and (d) 60 min, iron magnetite nanoparticles such as (FeNPs/moringa, FeNPs/potato, FeNPs/onion and FeNPs/tea).
Environsciproc 25 00099 g007
Figure 8. Effect of different doses on efficiency of iron magnetite nanoparticles (agitation speed 200 rpm, time 45 min, and 20 ± 5°C). (a) 0.1, (b) 0.3, (c) 0.4, and (d) 0.5 g.
Environsciproc 25 00099 g008
Table 1. Physicochemical characteristics of raw grey water.
TestUnit* Average Values of Raw Samples
pH-7.2
TDsmg/L611
ECµs/cm1099
ORPmV−19.7
TurbidityNTU89.5
CODmg/L560
BODmg/L302
TSSmg/L330
NH3mg/L13.2
NO3mg/L5.4
TKNmg/L28.2
TNmg/L33.6
PO4mg/L3.3
TPmg/L0.66
Notes: * Average for three samples, TDS is total dissolved solid, TSS is total suspended solid, COD is chemical oxygen demand, BOD is biological oxygen demand, NH3 is ammonia, NO3 is nitrate, TKN is total Kjeldahl nitrogen, TN is total nitrogen, TP is total phosphorus, and PO4 is phosphate. ORP is oxidation reduction potential.
Table 2. The XRF of onion, potato peels, tea waste, and moringa magnetite nanoparticles.
Sample NameFe2O3Na2OMnOCaOSiO2Al2O3K2OSO3Cr2O3MgOClLOITotal
Fe-Tea40.8619.80.330.470.380.110.030.130.010.0715.622.299.99
Fe-Potato53.9216.10.530.30.370.090.050.090.050.049.6318.899.98
Fe-Onion67.38.390.630.470.380.080.140.050.050.0411.69.5199.94
Fe-Moringa46.6222.10.460.270.360.070.07--0.0414.915.199.99
Table 3. Yield of onion, potato peels, tea waste, and moringa magnetite nanoparticles.
Iron Oxide NanoparticleWeight (g)
Fe-Metal7.625
Fe-Moringa38.235
Fe-Potato19.116
Fe-Onion16.114
Fe-Tea12.899
Table 4. The residual concentration of pollutants and removal efficiency of all adsorbents at optimum time.
ParameterUnitRawResidual Concentration (mg/L) of Pollutants at
Optimum Contact Time 45 min—Turbidity as NTU
Removal Efficiency of Adsorbents (%)
Fe/onionFe/moringaFe/potatoFe/teaFe/onionFe/moringaFe/potatoFe/tea
pH---7.28.38.198.68.4----
TDSmg/L611688745752978----
ECµs/cm1099.81238.413411353.61760.4----
ORPmV−19.7−80−72−95−83----
TurbidityNTU89.524.3123.1929.7528.1572.8574.1066.7868.57
CODmg/L56015214518617672.8574.1066.7868.57
BODmg/L30282.0878.3100.4495.0472.8574.1066.7868.57
TSSmg/L33089.6885.55109.74103.8472.8574.1066.7868.57
NH3mg/L13.212.9812.3412.4512.791.666.515.683.10
NO3mg/L6.44.053.854.825.0336.7139.8424.6821.40
TKNmg/L28.2427.726.426.627.31.666.515.683.10
TNmg/L34.6431.830.231.432.48.1412.679.196.48
PO4mg/L3.30.4891.2051.80.39885.1863.4844.5787.93
TPmg/L0.660.0970.2410.360.07985.1863.4844.5787.93
Notes: TDS is total dissolved solid, TSS is total suspended solid, COD is chemical oxygen demand, BOD is biological oxygen demand, NH3 is ammonia, NO3 is nitrate, TKN is total Kjeldahl nitrogen, TN is total nitrogen, TP is total phosphorus, and PO4 is phosphate.
Table 5. The residual concentration of pollutants, and removal efficiency of all adsorbents at optimum dose 0.4.
ParameterRawResidual Concentration (mg/L) of Pollutants at Optimum Dose 0.4—Turbidity as NTURemoval Efficiency of Adsorbents (%)
Fe/onionFe/potatoFe/moringaFe/teaFe/onionFe/potatoFe/moringaFe/tea
pH7.28.358.68.258.52----
TDS6117037507521005----
EC10991265135013531809----
ORP−19.7−85−105−75−89----
Turbidity89.5101610.1588.3981.2587.8582.5
COD56065105689888.3981.2587.8582.5
BOD3023556365288.3981.2587.8582.5
TSS3303861405788.3981.2587.8582.5
NH314.611.311.0510.21122.8624.5730.1724.91
NO36.43.023.542.854.352.8144.6855.4631.87
TKN31.324.123.621.823.522.8624.5730.1724.91
TN37.727.227.124.727.927.9427.9834.4526.09
PO43.30.110.620.360.09796.6681.0688.9397.06
TP0.660.0220.1250.0730.019496.6681.0688.9397.06
Notes: TDS is total dissolved solid, TSS is total suspended solid, COD is chemical oxygen demand, BOD is biological oxygen demand, NH3 is ammonia, NO3 is nitrate, TKN is total Kjeldahl nitrogen, TN is total nitrogen, TP is total phosphorus, and PO4 is phosphate.
Disclaimer/Publisher’s Note: The statements, opinions and data contained in all publications are solely those of the individual author(s) and contributor(s) and not of MDPI and/or the editor(s). MDPI and/or the editor(s) disclaim responsibility for any injury to people or property resulting from any ideas, methods, instructions or products referred to in the content.

