Proceeding Paper

Estimation of Water Turbidity in Drinking Water Treatment Plants Using Machine Learning Based on Water and Meteorological Data †

by
Vanessa Fernandez Alvarez
*,
Daniela Granada Salazar
,
Cristhian Figueroa
,
Juan Carlos Corrales
and
Juan Fernando Casanova
Department of Telematics, University of Cauca, Popayan 190002, Colombia
*
Author to whom correspondence should be addressed.
Presented at the 7th International Electronic Conference on Water Sciences, 15–30 March 2023; Available online: https://ecws-7.sciforum.net.
Environ. Sci. Proc. 2023, 25(1), 89; https://doi.org/10.3390/ECWS-7-14326
Published: 3 April 2023
(This article belongs to the Proceedings of The 7th International Electronic Conference on Water Sciences)

Abstract

:
In rural areas, water treatment plants use rudimentary techniques to evaluate turbidity. However, the incorrect measurement of turbidity can result in poor water quality and, as a result, health issues for its users because it is a crucial indicator to determine the application of adequate treatment to the water. Aquarisc was a project financed with royalties that sought to strengthen the mechanisms and tools for decision-making of the authorities and territorial institutions related to water supply for human consumption. This project installed sensors to assess turbidity in some plants in rural areas of the department of Cauca, Colombia. However, when the project ended, these sensors were removed. Therefore, it became necessary to create machine learning models to predict turbidity values without sensors, considering only pH, temperature, vapor pressure, and precipitation data captured manually by plant operators. In this study, the Linear Regression, Random Forest Regressor, k-Neighbors Regressor, and Extra Trees Regressor algorithms were trained with data provided by the Aquarisc project and the Institute of Hydrology, Meteorology, and Environment Studies of Colombia (IDEAM). As a result, we selected the Random Forest Regressor since it had the best RMSE among all the models and was also the one that best matched the situation of the studied treatment plants. Furthermore, this model did not consider outliers, resulting in an RMSE of 20.98 and 3.49 for the training and test dataset, respectively. Finally, we determined that this algorithm was able to estimate the water’s turbidity acceptably and supports the operators in making decisions for the application of adequate treatment to drinking water.

1. Introduction

The quality of water supplied by potable water treatment plants is crucial for ensuring consumers’ health. Turbidity is one of the most critical parameters to determine this quality, as it indicates the presence of colloidal, mineral, and organic substances in the water [1].
The presence of turbidity in water stimulates the proliferation of bacteria and provides coverage and food for pathogens in the water. Moreover, it hinders proper water disinfection and risks consumer health [2]. For this reason, entities supplying water for human consumption in Colombia must ensure compliance with the water quality standards established in Resolution 2115 of 2007, which establishes that turbidity should not exceed 2 Nephelometric Turbidity Units (NTU) [3].
Currently, there are various pieces of equipment and instruments, such as turbidity tubes, Secchi disks, and spectrophotometers, which are used to measure the turbidity of water. However, according to studies carried out by [4,5], and the project “Vulnerability and Risk in Drinking Water Systems of Cauca–Aquarisc”, it has been demonstrated that some municipal water treatment plants in Colombia face difficulties in determining the physicochemical conditions of the water. These limitations prevent treatment plants from measuring raw water parameters, including turbidity. It is essential to know the turbidity, as this parameter is crucial for establishing the criteria required at each stage of the purification process and carrying out a planned and precise water purification process [6].
An effective strategy to address this limitation is establishing a model for estimating source water turbidity to support operators in decision-making. Several studies support this assertion, including those conducted in [7,8,9,10], where artificial neural networks were developed to predict or estimate turbidity concentrations and other water quality parameters. In addition, studies such as [11,12] performed regression analyses considering satellite images and data acquired by citizen scientists for turbidity prediction. Moreover, more research related to the topic was found, but it was noted that research of this type was scarce in tropical zones.
The lack of exploration in these areas creates a gap in the analysis of the behavior of meteorological variables in the type of climate that occurs and the impact it has on water quality parameters, such as turbidity. Colombia is one of the countries belonging to the tropical zone, so it has a relatively varied climatic classification due to the lack of seasonality. Therefore, creating a local experience based on what has been evaluated by countries with different climatic zones than Colombia would contribute to research in analyzing the behavior of meteorological and hydrological variables about the turbidity parameter.
Therefore, this study evaluates the performance of models that have not been implemented in tropical zones and compares them to determine their applicability in environments with hydrological and meteorological characteristics similar to the local environment, to expand experience in this type of climatic zone for the estimation of turbidity and its relationship with various parameters.

2. Materials and Methods

2.1. Dataset

The Aquarisc project team collected the data using sensors to measure water quality parameters and meteorological variables in some water treatment plants in the department of Cauca (Colombia). The measurement dataset was recorded from January 2020 to January 2021. However, some measurement failures were found in the precipitation parameter when performing an initial analysis. For this reason, we used a meteorological database provided by the Institute of Hydrology, Meteorology and Environment Studies (IDEAM) accessed through the open data portal on its website [13].
The following parameters were used in this study: pH, dissolved oxygen (DO), conductivity, oxidation-reduction potential (ORP), turbidity, temperature (T), relative humidity (RH), vapor pressure (VP), barometric pressure (BP), wind speed, precipitation (P), and radiation.

2.2. Data Modeling

2.2.1. Data Pre-Processing

The dataset preparation process consisted of three phases: data structuring, cleaning, and fusion.
  • Structuring phase: The first step in the process of structuring the dataset was to organize the information in a single format since there were two datasets, one of the hydrological parameters and the other of meteorological parameters. The meteorological dataset had shifted columns and needed to be organized to execute the analysis correctly.
  • Data cleaning phase: Considering the technical specifications of the different sensors, it was determined which data were outside the specified range for each measurement tool. We continued reviewing which treatment plants had sufficient turbidity data, which resulted in a dataset consisting of one treatment plant in the urban area and three treatment plants in the rural area.
  • Data fusion phase: Once the data were organized and cleaned, a data fusion was performed with the dataset taken by IDEAM. Since both sets did not have the same time scale, a temporal adaptation was made to the IDEAM dataset to match each point in the database obtained from the previous phases.

2.2.2. Exploratory Analysis of Data

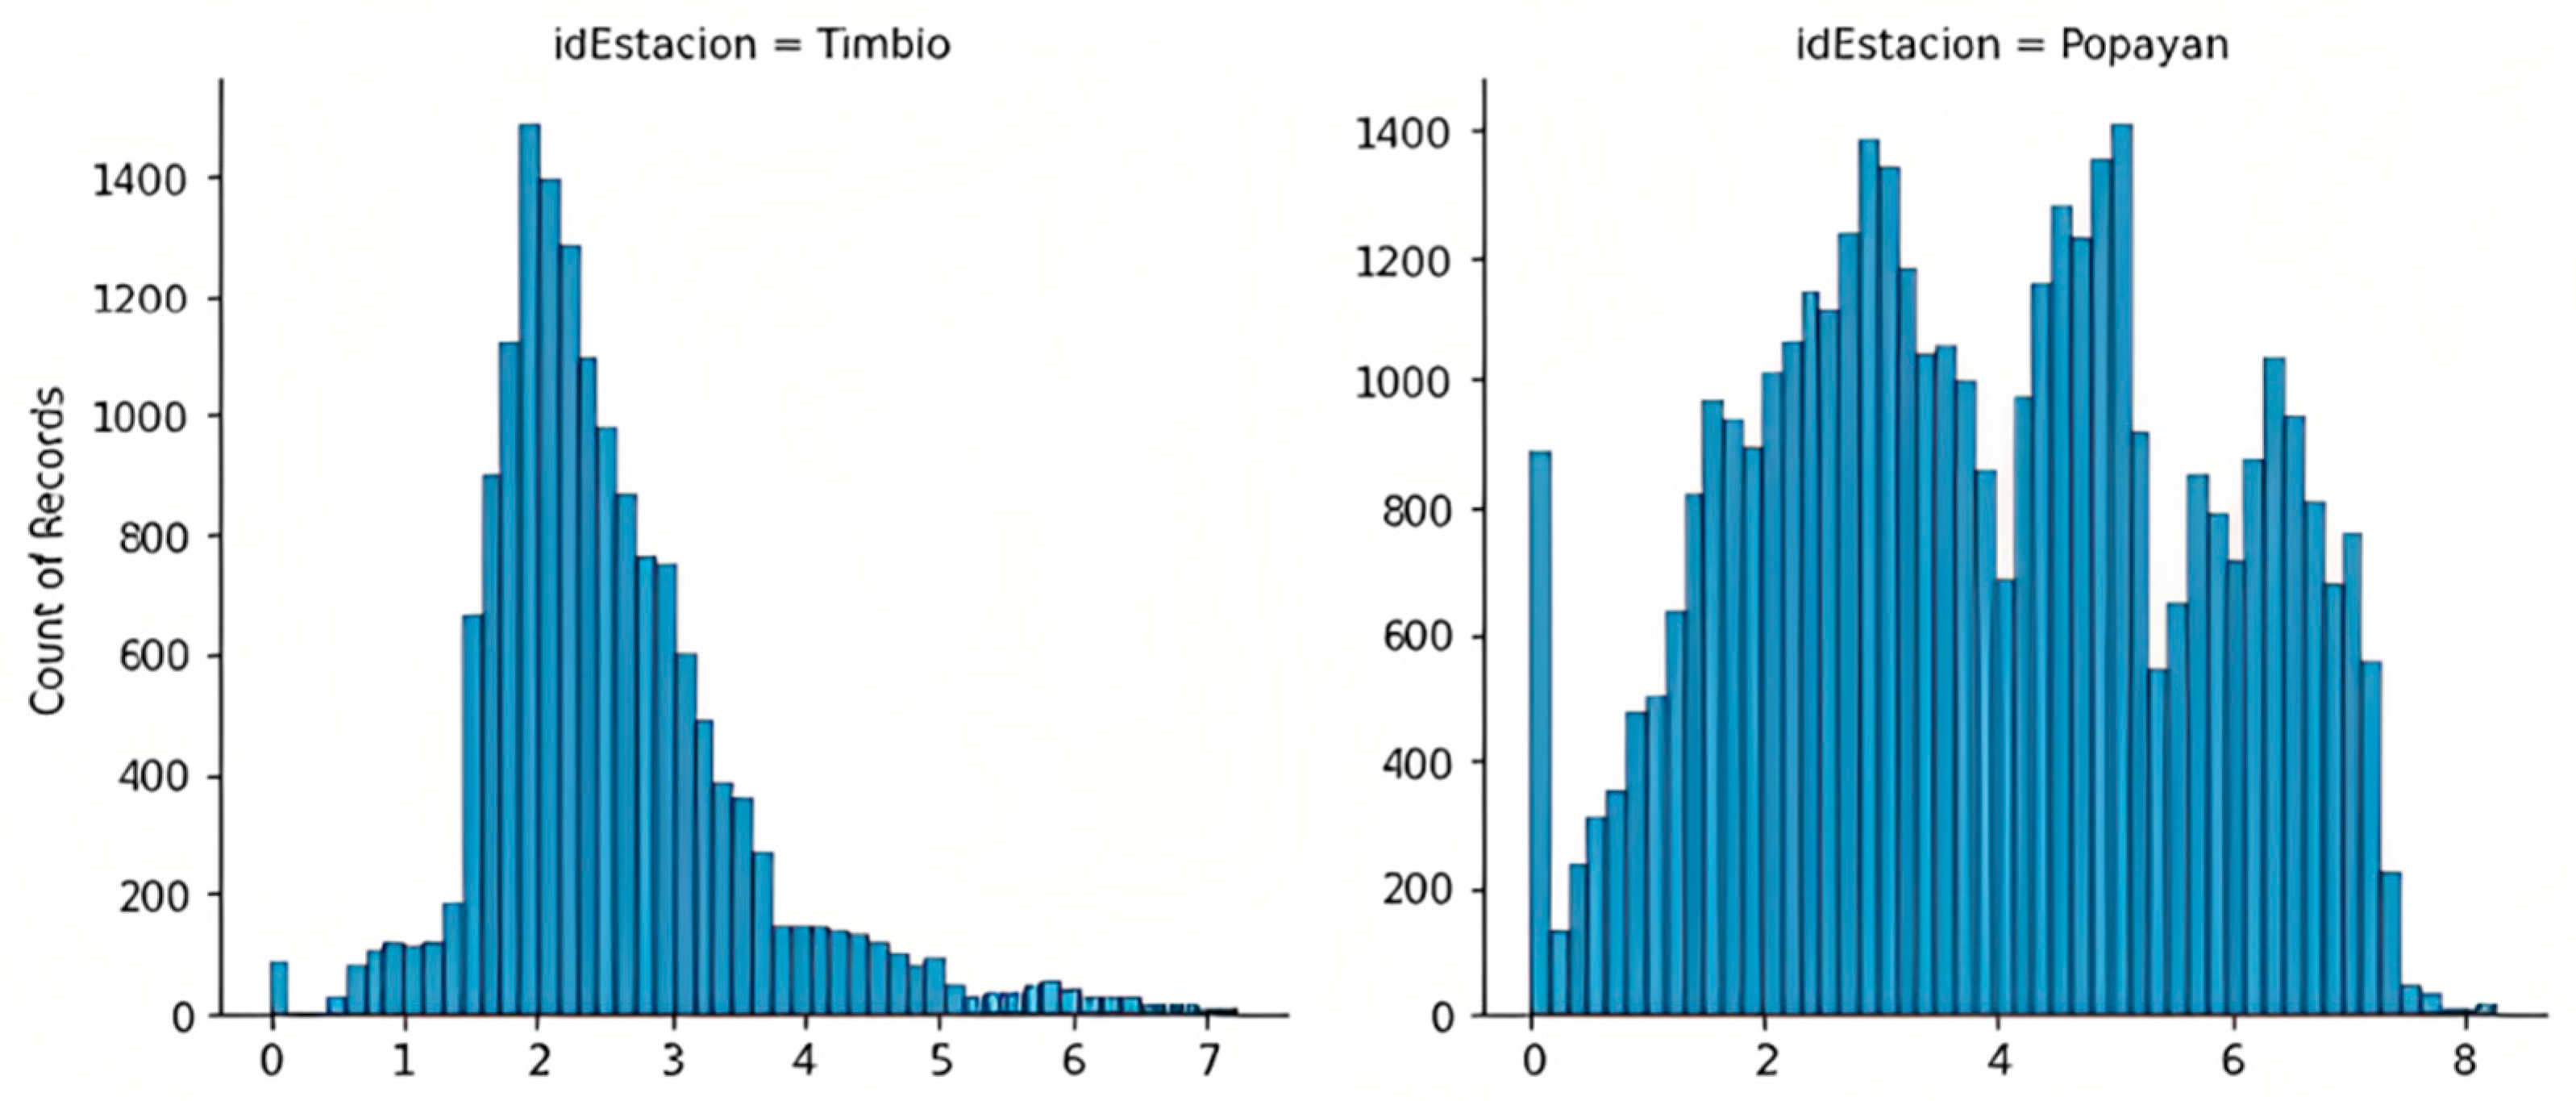
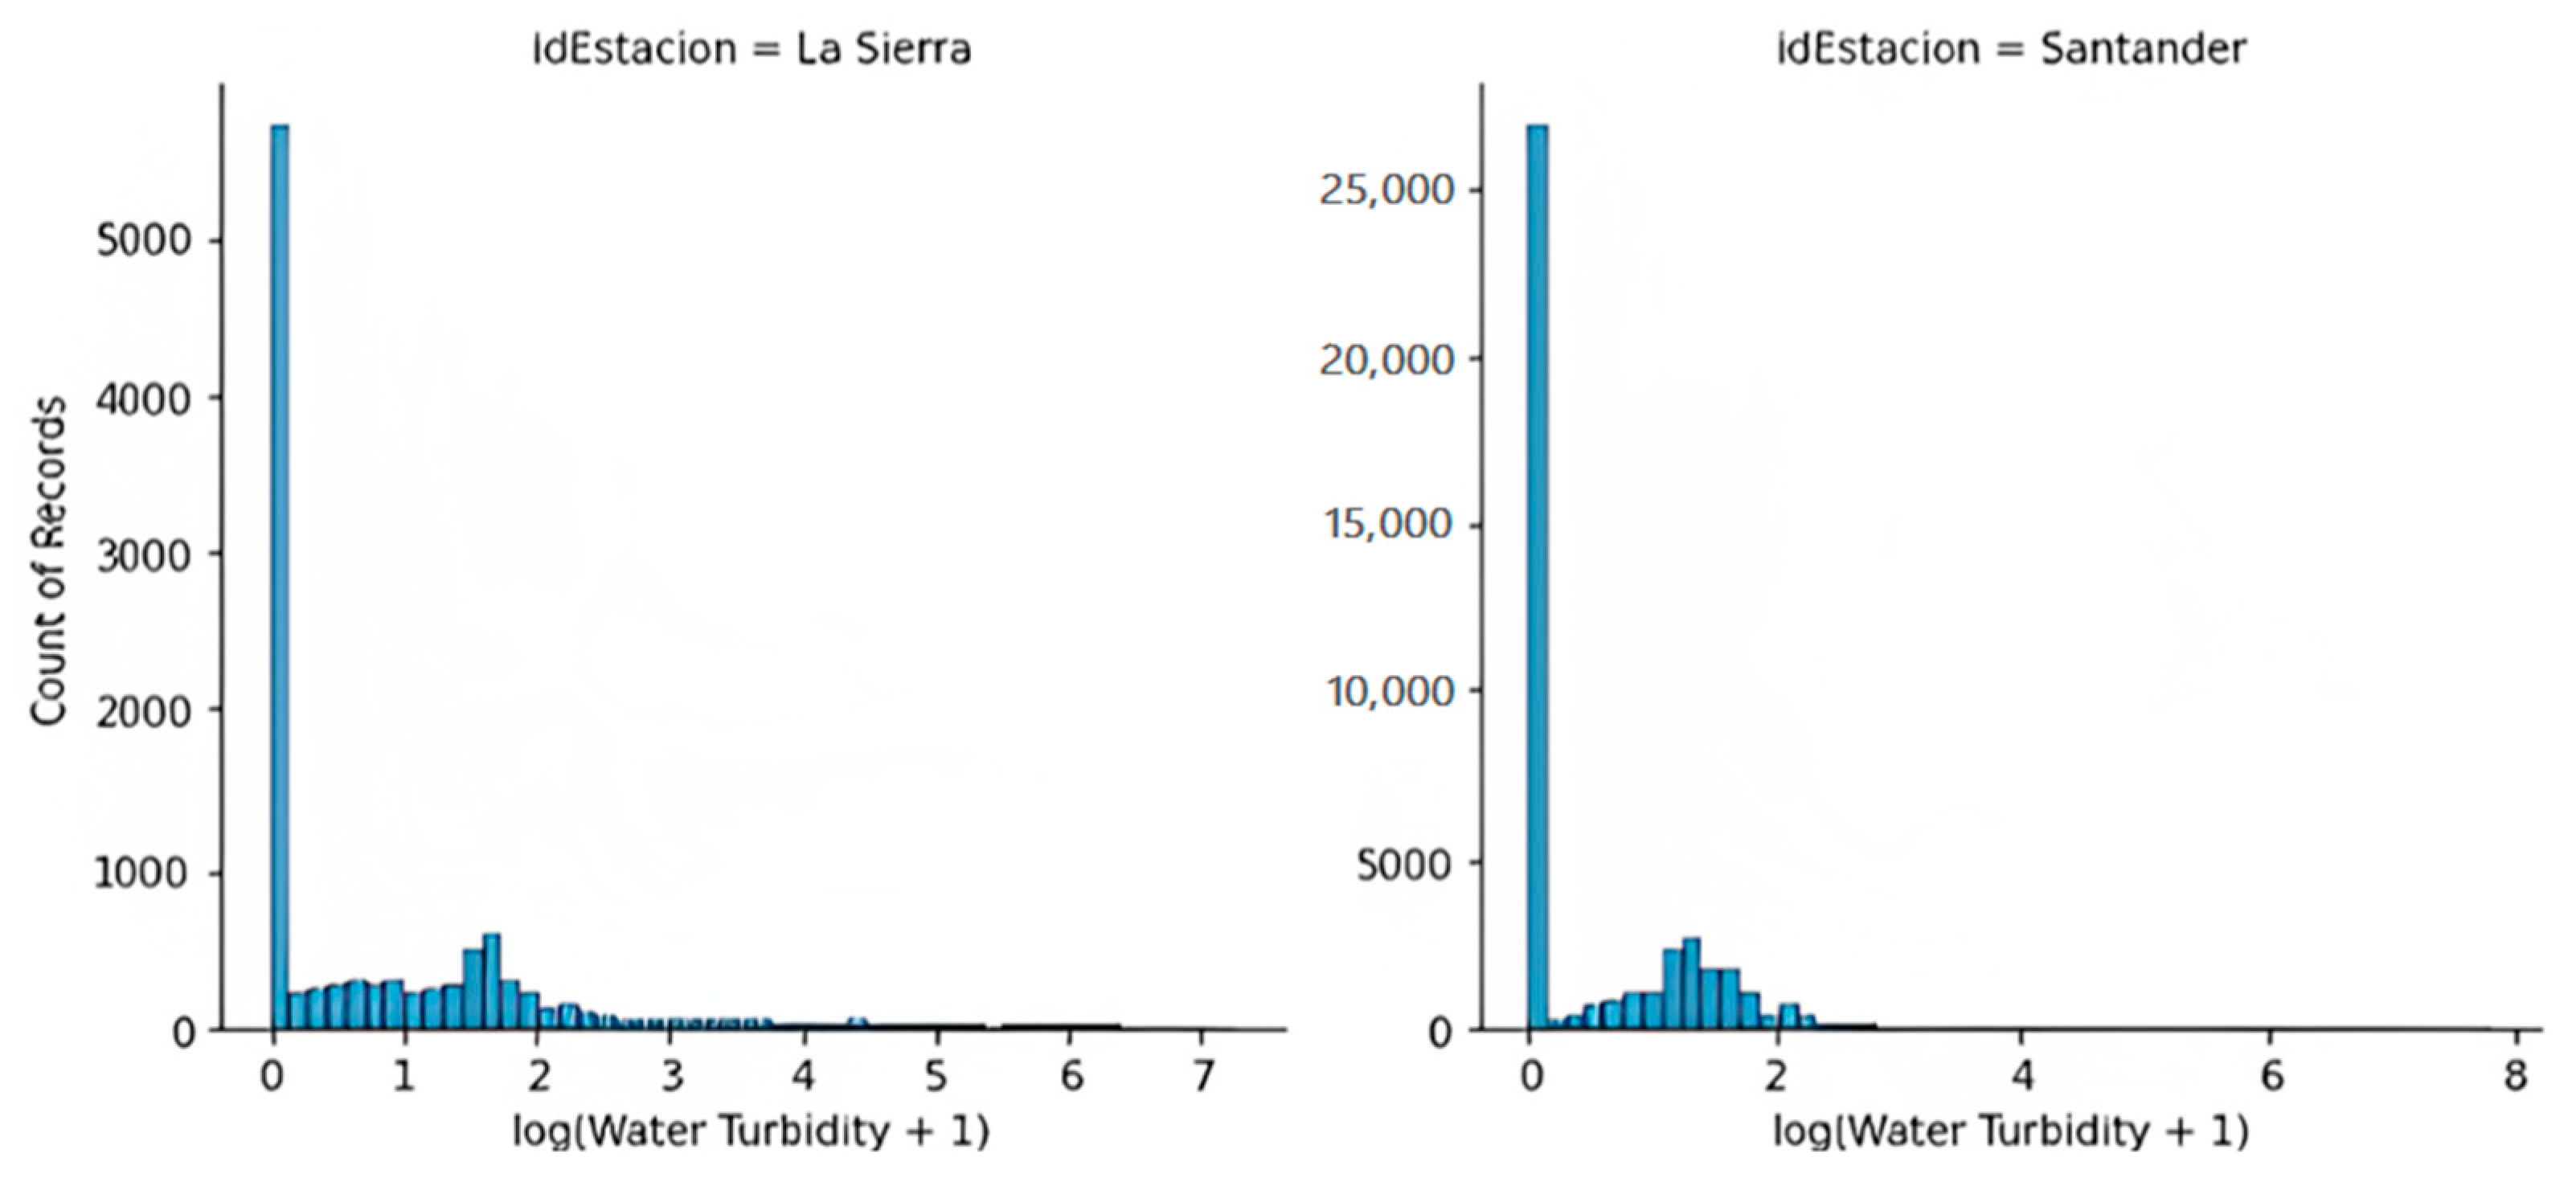
  • Distribution of water turbidity: When evaluating the distribution of turbidity in the four treatment plants, distributions with long skews to the right are found. To correct the variable’s asymmetry and to obtain a better view of its distribution, a logarithmic transformation was applied to make the water turbidity as close as possible to the normal distribution. Given the large number of zero values in the turbidity measurements, an additional unit was added to avoid −∞ values. The following equation was applied for the logarithmic transformation of the water turbidity variable:
logTurbidity = log(turbidity + 1)
We can better understand the distribution of variables by plotting histograms for each station. For example, Figure 1 and Figure 2 show the histograms for the log transformation of water turbidity at four relevant stations.
It can be observed that there is more significant variability in the Popayan station, which is in the urban zone. However, this indicator cannot be taken as a conclusion since other water treatment stations may have even more significant variability and higher generic water turbidity levels, but the data are simply insufficient.
  • Analysis of the relationship of variables with turbidity: A correlation analysis was conducted to investigate the possible relationship between turbidity and various water variables at all stations. In the initial phase of the study, no significant correlation was found between turbidity and variables, such as pH, DO, conductivity, and ORP. Thus, we performed an additional analysis to improve the correlation, consisting of the logarithmic transformation of the turbidity variable and the correlation with the water variables from the first analysis. Although an increase in correlation coefficients was observed, they were still considered low, indicating no linear relationship between turbidity and the examined water variables. This result suggests the need for a non-linear model to capture the complexity of the relationship between these variables. Otherwise, models could generate inaccurate data or significant error metrics, making interpretation and decision-making difficult.

2.2.3. Data Modeling

For data modeling, a process of experimentation was carried out in which the following variations were considered:
  • Linear and non-linear models (linear regression, tree-based models).
  • With or without outliers.
  • With random or temporal division.
  • With all stations, with Popayan information only, or with all stations except Popayan.
  • With dummy variables that categorize the station.
  • With all parameters or only with the most important ones.
The metric used to determine the best model was the RMSE.

3. Results and Discussion

During the linear modeling process, the database of the four stations was considered, and some variations were performed to determine which model offered better performance. The results obtained are presented in Table 1.
Upon analyzing the results obtained from linear modeling, it was observed that high RMSE values were obtained, suggesting no clear linear relationship between the parameters and the turbidity variable. Consequently, alternative models that could better fit the data were sought, and a non-linear analysis was conducted using different algorithms.
The k-Neighbors Regressor algorithm was employed as the first non-linear model, and the database composed of the four stations was considered. The second model was based on the extra Trees Regressor algorithm and evaluated solely at the Popayan station. Finally, the best-performing model was based on the Random Forest algorithm and evaluated in the database of the three rural stations.
For all three models, all parameters were used as predictors, and it was found that their performance significantly improved when a temporal data split was performed, using the month of December as the test set. Table 2 summarizes the results of these models and their corresponding performance metrics.
Based on the obtained results, it has been verified that the random forest model performs best in predicting water turbidity. On the other hand, the K-Neighbors-based model showed overfitting during data training, while the Extra-Trees-based model yielded a high RMSE value. As a result of these findings, a more detailed evaluation of the best-performing model was carried out to reduce the number of predictors and adapt it to the limited instrumentation used in rural water treatment plants.
As a result of this evaluation, a model that only uses predictors of pH, T, VP, and P has been obtained, which has been the most effective in predicting water turbidity. In addition, the selection of these predictors has reduced the number of parameters considered in the model without compromising the accuracy of the predictions. It is important to note that, during the evaluation, it was observed that meteorological parameters significantly influence the variation of water turbidity, suggesting that the weather conditions in the area significantly impact water turbidity.
In summary, the research results have demonstrated the possibility of obtaining a non-linear predictive model of water turbidity with fewer predictors, which is particularly beneficial in rural areas where instrumentation is limited. Furthermore, the importance of including meteorological parameters as input variables in the model have been emphasized. Their significant impact on water turbidity can be crucial in predicting the parameter and, therefore, helping to make decisions for appropriate water treatment.

4. Conclusions

Implementing machine learning models enables the analysis of water turbidity behavior and facilitates decision-making in treatment plants with limited instrumentation. The results indicate no linear relationship between the database parameters and turbidity, which led to the evaluation of non-linear models that better estimate water turbidity. Although these models show slightly lower performance when reducing the number of predictors, they allow for the appreciation of climatic influence and can be applied more efficiently in treatment plants with limited resources. In addition, by setting a limit on turbidity to exclude outlier values, the performance of the models was improved. The evaluation of models that consider outlier values and achieve better performance could be the subject of future research.

Author Contributions

Conceptualization, J.F.C. and J.C.C.; methodology, C.F., V.F.A. and D.G.S.; software, V.F.A.; formal analysis, V.F.A.; investigation, V.F.A. and D.G.S.; resources, J.F.C.; writing—original draft preparation, V.F.A. and D.G.S.; writing—review and editing, V.F.A., D.G.S. and C.F.; supervision, C.F.; project administration, V.F.A. All authors have read and agreed to the published version of the manuscript.

Funding

This research received no external funding.

Institutional Review Board Statement

Not applicable.

Informed Consent Statement

Not applicable.

Data Availability Statement

Data Availability Statements are available in section “water treatment plant” at https://www.kaggle.com/datasets/jvanessafernandez/water-treatment-plant, accessed on 2 April 2023.

Acknowledgments

We would like to express our gratitude to the Aquarisc project for their valuable collaboration in providing data for the development of this project.

Conflicts of Interest

The authors declare no conflict of interest.

References

  1. Miljojkovic, D.; Trepsic, I.; Milovancevic, M. Assessment of physical and chemical indicators on water turbidity. Phys. A Stat. Mech. Its Appl. 2019, 527, 121171. [Google Scholar] [CrossRef]
  2. World Health Organization. Water quality and health-review of turbidity: Information for regulators and water suppliers. 2017. Available online: https://apps.who.int/iris/handle/10665/254631. (accessed on 10 January 2023).
  3. Ministerio de Ambiente, Vivienda y Desarrollo Territorial Y Ministerio de Protección Social. Decreto no 2115 de 2007. (June 2007). Available online: https://minvivienda.gov.co/sites/default/files/normativa/2115%20-%202007.pdf (accessed on 10 January 2023).
  4. Marimon, W.; Jimenez, N.; Jiménez, C.; Chavarro, J.; Domínguez, E. Comparative Analysis of Water Quality Indices and Their Relationship with Anthropogenic Activities, Case Study: Bogotá River. Res. Square 2021. [Google Scholar] [CrossRef]
  5. García-Rentería, F.-F.; Nieto, G.A.C.; Cortez, G.H. Evaluation of wastewater discharge reduction scenarios in the Buenaventura Bay. Water 2023, 15, 1027. [Google Scholar] [CrossRef]
  6. Anexo 1. Available online: http://cinara.univalle.edu.co/images/convocatorias/Convocatoria2/Anexos/ANEXO%201 (accessed on 13 January 2023).
  7. Khairi, M.T.M.; Ibrahim, S.; Yunus, M.A.M.; Faramarzi, M.; Yusuf, Z. Artificial neural network approach for predicting the water turbidity level using optical tomography. Arab. J. Sci. Eng. 2015, 41, 3369–3379. [Google Scholar] [CrossRef]
  8. El Din, E.S.; Zhang, Y.; Suliman, A. Mapping concentrations of surface water quality parameters using a novel remote sensing and artificial intelligence framework. Int. J. Remote Sens. 2017, 38, 1023–1042. [Google Scholar] [CrossRef]
  9. Kim, S.E.; Seo, I.W. Artificial neural network ensemble modeling with conjunctive data clustering for water quality prediction in rivers. J. Hydro-Environ. Res. 2015, 9, 325–339. [Google Scholar] [CrossRef]
  10. Delpla, I.; Florea, M.; Rodriguez, M. Drinking water source monitoring using early warning systems based on data mining techniques. Water Resour. Manag. 2019, 33, 129–140. [Google Scholar] [CrossRef]
  11. Sharaf El Din, E. Enhancing the accuracy of retrieving quantities of turbidity and total suspended solids using Landsat-8-based-principal component analysis technique. J. Spat. Sci. 2019, 66, 493–512. [Google Scholar] [CrossRef]
  12. Miguel-Chinchilla, L.; Heasley, E.; Loiselle, S.; Thornhill, I. Local and landscape influences on turbidity in urban streams: A global approach using citizen scientists. Freshw. Sci. 2019, 38, 303–320. [Google Scholar] [CrossRef]
  13. DHIME. Available online: http://dhime.ideam.gov.co/webgis/home (accessed on 25 October 2022).
Figure 1. Distribution of the logarithmic transformation of the water turbidity variable in the four stations with available data (Timbio and Popayan) after data cleaning.
Environsciproc 25 00089 g001
Figure 2. Distribution of the logarithmic transformation of the water turbidity variable in the four stations with available data (La Sierra and Santander) after data cleaning.
Environsciproc 25 00089 g002
Table 1. Summary of linear modeling.
DatabaseData DivisionOutlier Limit (NTU)RMSE—In the SampleRMSE: Sample Output
Stations (dummies), predictors: all parameters, turbidity predictionRandom-202.30206.93
Stations (dummies), predictors: all parameters, box cox transformation and, log-turbidity predictionRandom-225.83223.54
Stations (cat codes), predictors: pH, conductivity, potOxyReduction, PA, T and P, turbidity prediction, and data normalization.Random-202.16203.39
Stations (cat codes), predictors: pH, conductivity, potOxyReduction, PA, T and P, turbidity prediction, and data normalization.Random62.68.858.85
Table 2. Summary of non-linear modeling.
ModelOutlier Limit (NTU)RMSE—In the SampleRMSE: Sample Output
Stacking-Estimator K-Neighbors-Regressor3000.08.0
Stacking-Estimator Extra-Trees-Regressor-7.389.26
Make-union Extra-Trees-Regressor30017.9483.56
Make-union Extra-Trees-Regressor-79.68118.61
Stacking-Estimator Random-Forest-Regressor3001.832.37
Stacking-Estimator Random-Forest-Regressor-20.923.76
Disclaimer/Publisher’s Note: The statements, opinions and data contained in all publications are solely those of the individual author(s) and contributor(s) and not of MDPI and/or the editor(s). MDPI and/or the editor(s) disclaim responsibility for any injury to people or property resulting from any ideas, methods, instructions or products referred to in the content.

