1. Introduction
Climate change is becoming more and more relevant for the agricultural sector, and its most catastrophic events are causing huge losses in crop productivity. A chance to effectively react to such extreme events and adapt to a constantly changing scenario is offered by innovative Agri-Tech technologies. Unfortunately, such solutions are mostly adopted only in large-scale production industries, whereas smaller companies often lack technological expertise, aptitude for innovation, or enough financial resources for the initial investments. The goal of this project is to study and develop a specific solution capable of monitoring the health of a crop field in an automatic and non-invasive way and that does not need a high economic effort nor advanced technical skills to be applied. This study focuses on Italian vineyards since they are usually part of small–medium-sized companies, forming a fragmented economic context based on traditional techniques and with a generally low diffusion of technological innovation. Vineyards are now facing the impact of climate change and, due to their peculiar characteristics, are more prone to its consequences. A further objective is to foster the integration of the traditional know-how of older farmers with the technological expertise of younger ones, thus increasing the resilience towards future environmental scenarios.
One effective parameter to monitor the health status of vineyards is the Crop Water Stress Index (CWSI), a quantitative estimation of a plant’s need for water. In detail, water availability is a key parameter influencing the quantity and quality of vineyard production. The knowledge of water stress is an important feature for controlling the optimal water conditions needed to achieve the desired characteristics of production. Hence, the aim of this study is to design and implement an intelligent autonomous system to measure the spatial and temporal distribution of CWSI on a crop field, offering a valuable instrument to have precise insight into the health of vineyards and to schedule targeted interventions to recover optimal values. Furthermore, geospatial and historical analysis of CWSI can be performed to gain insight into the characteristics of the crop field and infer connections with the productivity of the harvest.
Some solutions for the monitoring of vine water stress are available, but their application is still at an early stage and the technology is not yet refined [
1]. To the best of our knowledge, no water resource optimization system, via active and adaptive crop monitoring, is available on the market at affordable prices.
The potentialities of the proposed solution have been tested in a data collection session in a vineyard owned by “Azienda Agricola Balladore Pallieri” (Asti, Italy) through a low-cost prototype. For this purpose, miniaturized sensors have been assembled on a Raspberry Pi. This on-field campaign helped us to verify the validity of the concept and its implementation to collect climatic parameters and elaborate the data into real CWSI heatmaps. Moreover, it contributed to highlighting its advantages and the further improvements of the design.
The system provides almost real-time information on the hydration condition of the field at near-real-time with a great level of geographic detail, enabling wise water management and boosting plant care. Thanks to the CWSI maps of the field, it is possible to focus watering only on the areas of the vineyard needing water, thus reducing water use.
The system fits well with the current state of society, responding to one of the most urgent challenges: climate change. The proposed solution increases the resilience of the economic system to climate change as it improves the farmer’s ability to control and optimize the water usage in their fields. Moreover, the flexibility of the proposed sensing system and its software suite allows for adaptive and evolving technology. Indeed, the project could successively be adapted to fit the needs of other kinds of crops, thus expanding its market and impact on the agriculture industry.
2. Background, Parameters, and Methods
The Crop Water Stress Index [
2,
3], or CWSI, is chosen as the key vegetation index in this work as it is strongly related to the water status of the crop. It measures the ability of the plant to exploit the available water in the soil. It is related to the health of the plant because it describes the ability to successfully bring water from the roots to the leaves and fruit. Instead of measuring it directly through the evaluation of stomatal pressure, which would require complex instrumentation, it can be evaluated through climatic and atmospheric data in the area surrounding the plant as it is defined as:
where ET and PET are measures of evapotranspiration potential, closely linked to the water potential of the plant. A way to calculate this index based on meteorological data was proposed by [
3]:
where:
is the psychometric constant;
are the canopy and aerodynamic resistances;
is the slope of saturated vapor pressure-temperature relation;
is the saturated vapor pressure;
is the vapor pressure;
is the heat capacity of air;
is the air density;
is the net solar radiation;
is the canopy temeprature;
is the air temeprature.
The value of CWSI ranges from 0 to 1, where 0 stands for a healthy plant with no water stress, while 1 represents a critical situation of water deprivation. CWSI values can be subdivided into four ranges of plant conditions (
Table 1), exploiting the correlation between CWSI and Leaf Water Potential available in the literature [
4].
2.1. Satellite Data
The input meteorological data were all taken from the European Database Copernicus, which provides time series with hourly precision over specific regions of the earth, apart from the canopy temperature, which was downloaded directly from Landsat Satellites through Google Earth Engine as the Land Surface Temperature (LST) parameter. Whereas Copernicus offers hourly data every day, Landsat Satellite only detects the data over a specific route once every 15 days, so we filtered the Copernicus data only for the days where we could also have the LST to ensure the best compatibility of the data coming from two different sources.
2.2. Design of the System
The system has two main parts: the sensing part collects information on the vines and the vineyard status, while the analysis part computes the Crop Water Stress Index (CWSI) and generates maps that can be used to monitor the current status of the vineyard in detail, as well as to make predictions about the future development of the grapes and the plants.
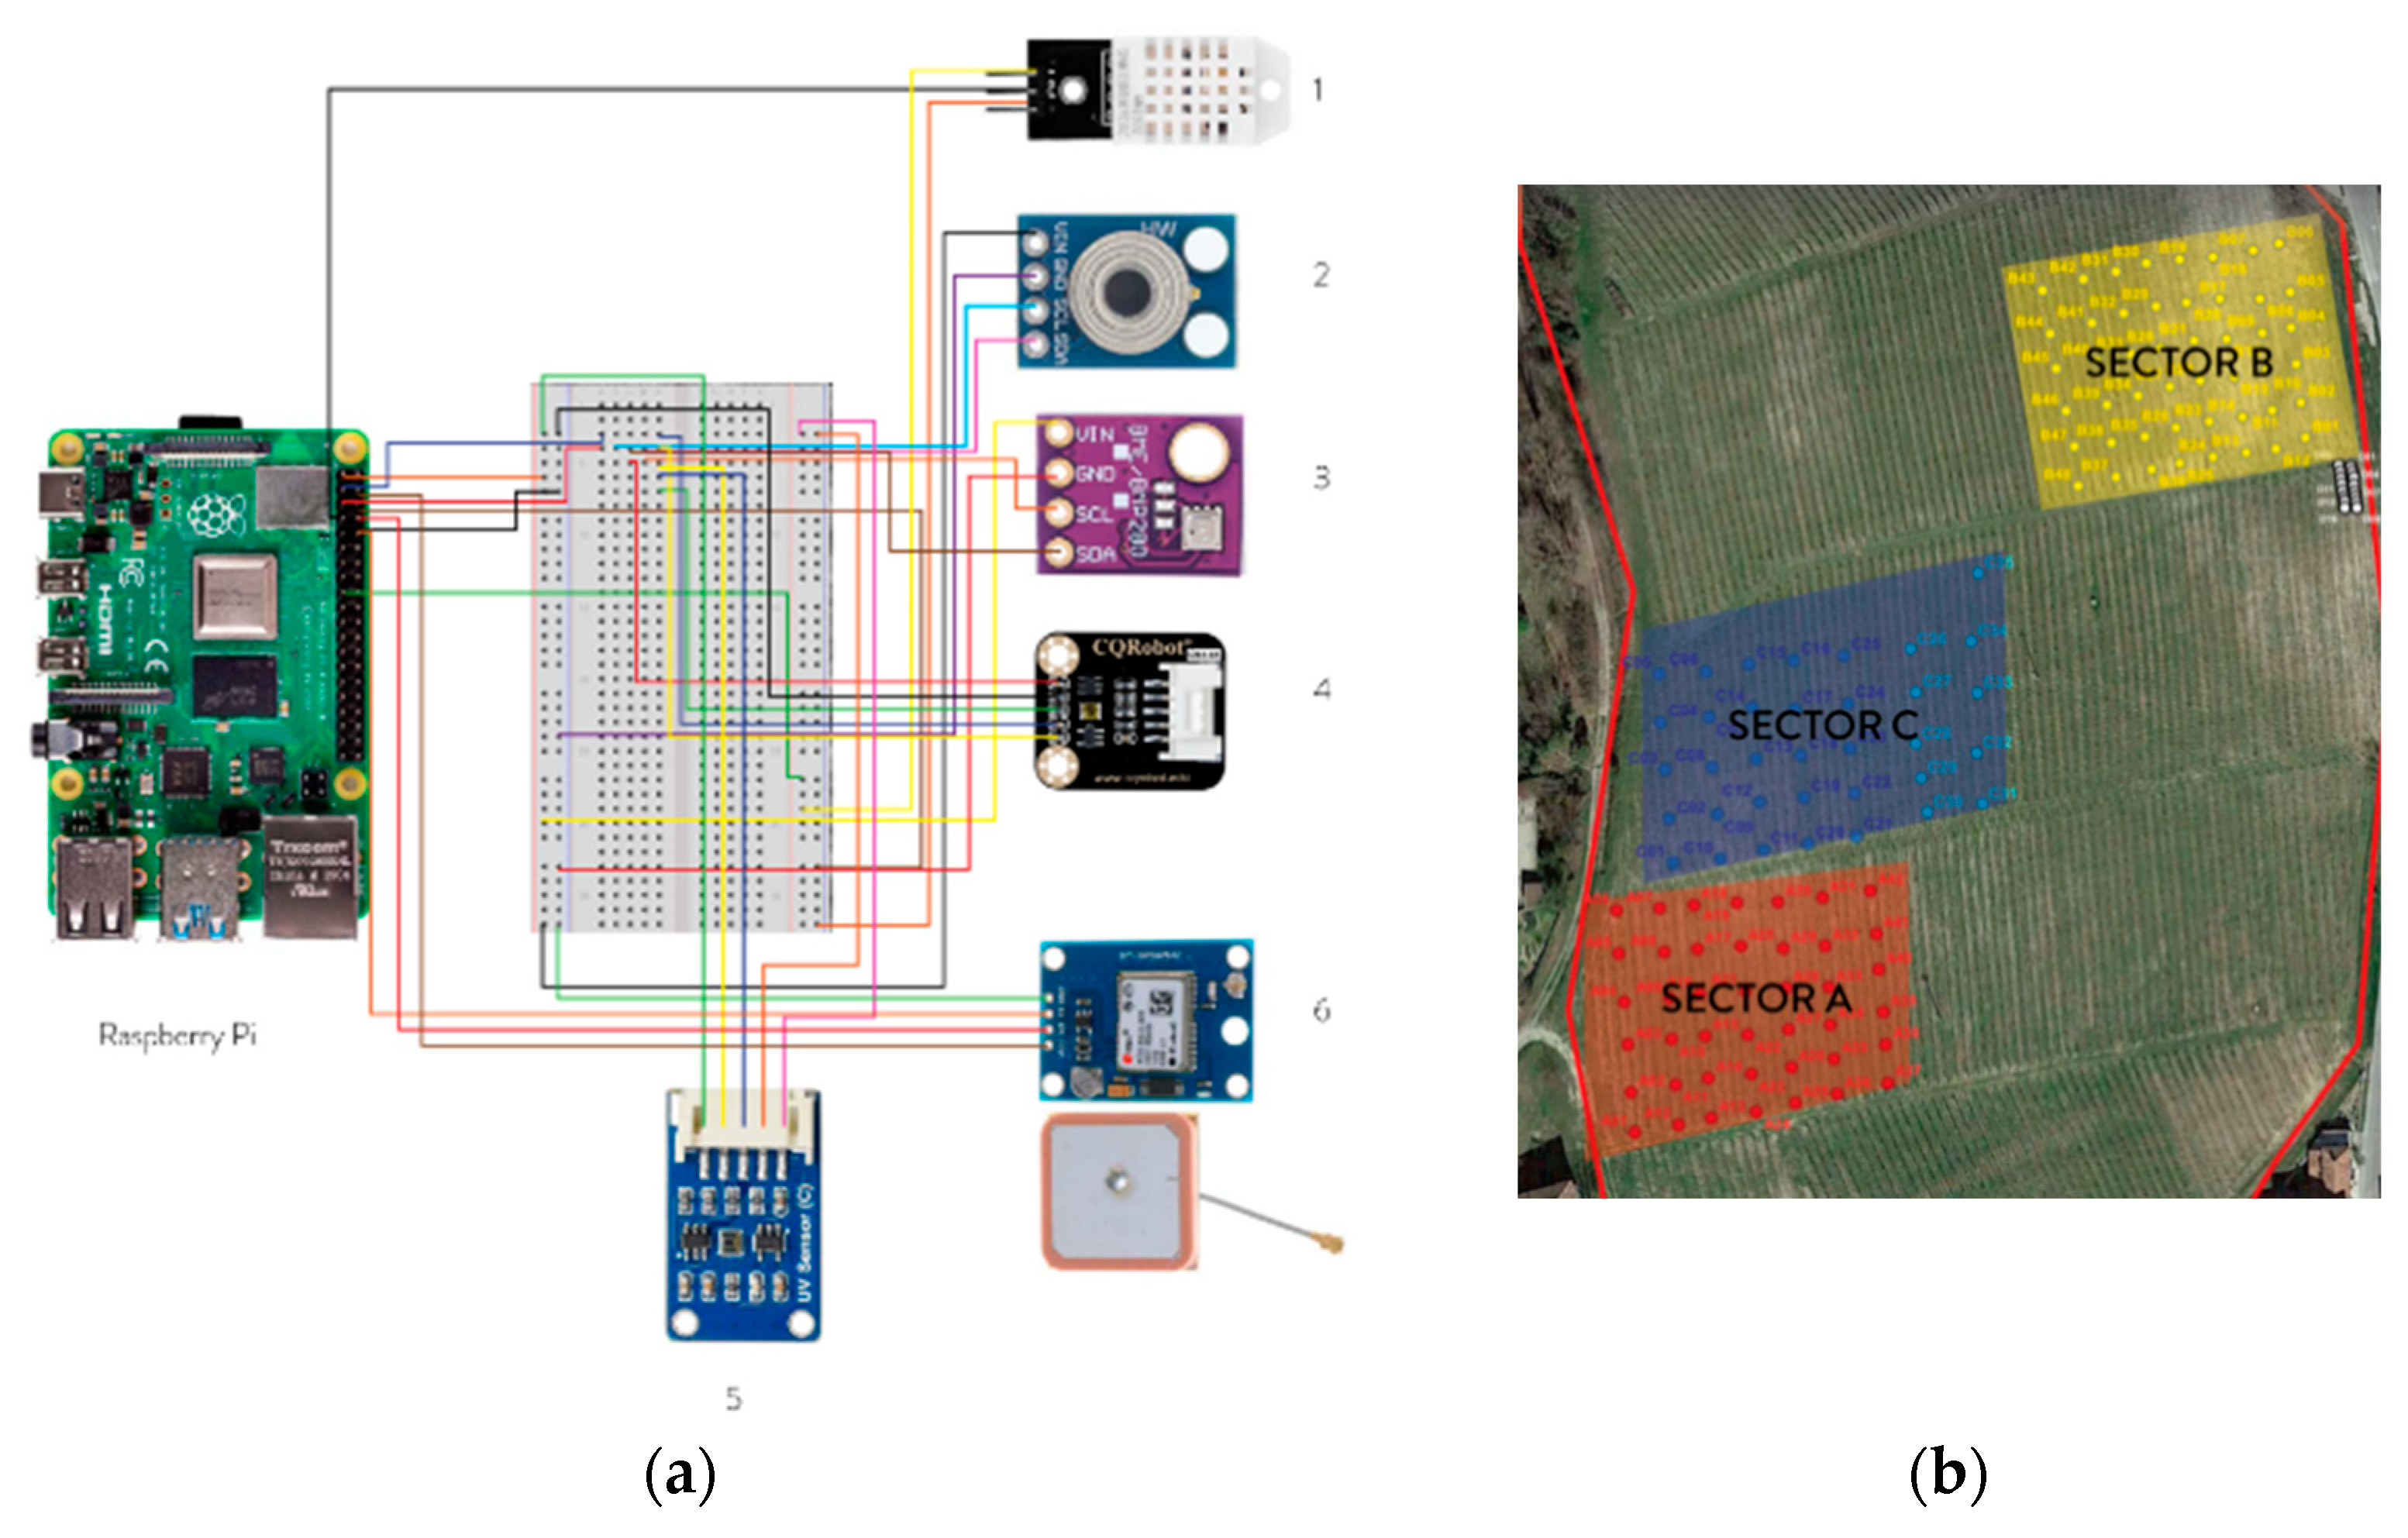
The sensing subsystem is a battery-powered module composed of specific sensors interfaced with a Raspberry Pi 4 Model B. To collect climatic parameters and elaborate the data into real CWSI heatmaps, the following sensors were adopted (
Figure 1a):
Temperature and Humidity sensor (DHT22);
Surface Temperature sensor (MLX90614-GY906);
Pressure, Temperature and Humidity sensor (BME280);
Ambient Light and InfraRed intensity sensor (TSL2591);
Ultraviolet intensity sensor (LTR390);
Global Positioning System (GY-NEO6MV2 NEO-6M GPS);
External anemometer (BT-100-WM), not shown in the figure.
2.3. Data Collection
In order to verify the validity of the proposed concept, an on-field data collection session in a vineyard owned by “Azienda Agricola Balladore Pallieri” in Calosso (Asti, Italy, see
Figure 1b) was carried out on 4 June 2022. The location is characterized by a mild climate, scarcity of droughts, and strong hailstorms. The test was carried out in late spring to investigate the status of mature vines, and the good weather conditions ensured a more reliable measurement of irradiation.
Precise waypoints were chosen in the crop to create a network of measurements roughly every 10 m, to increase the resolution of the CWSI map with respect to the satellite measurements (
Figure 1b). The waypoints were divided into three sections in different zones of the crop (A, B, C, D) to investigate the side-by-side areas variation of CWSI linked to changes in slope, which lead to different water drainage.
3. Results
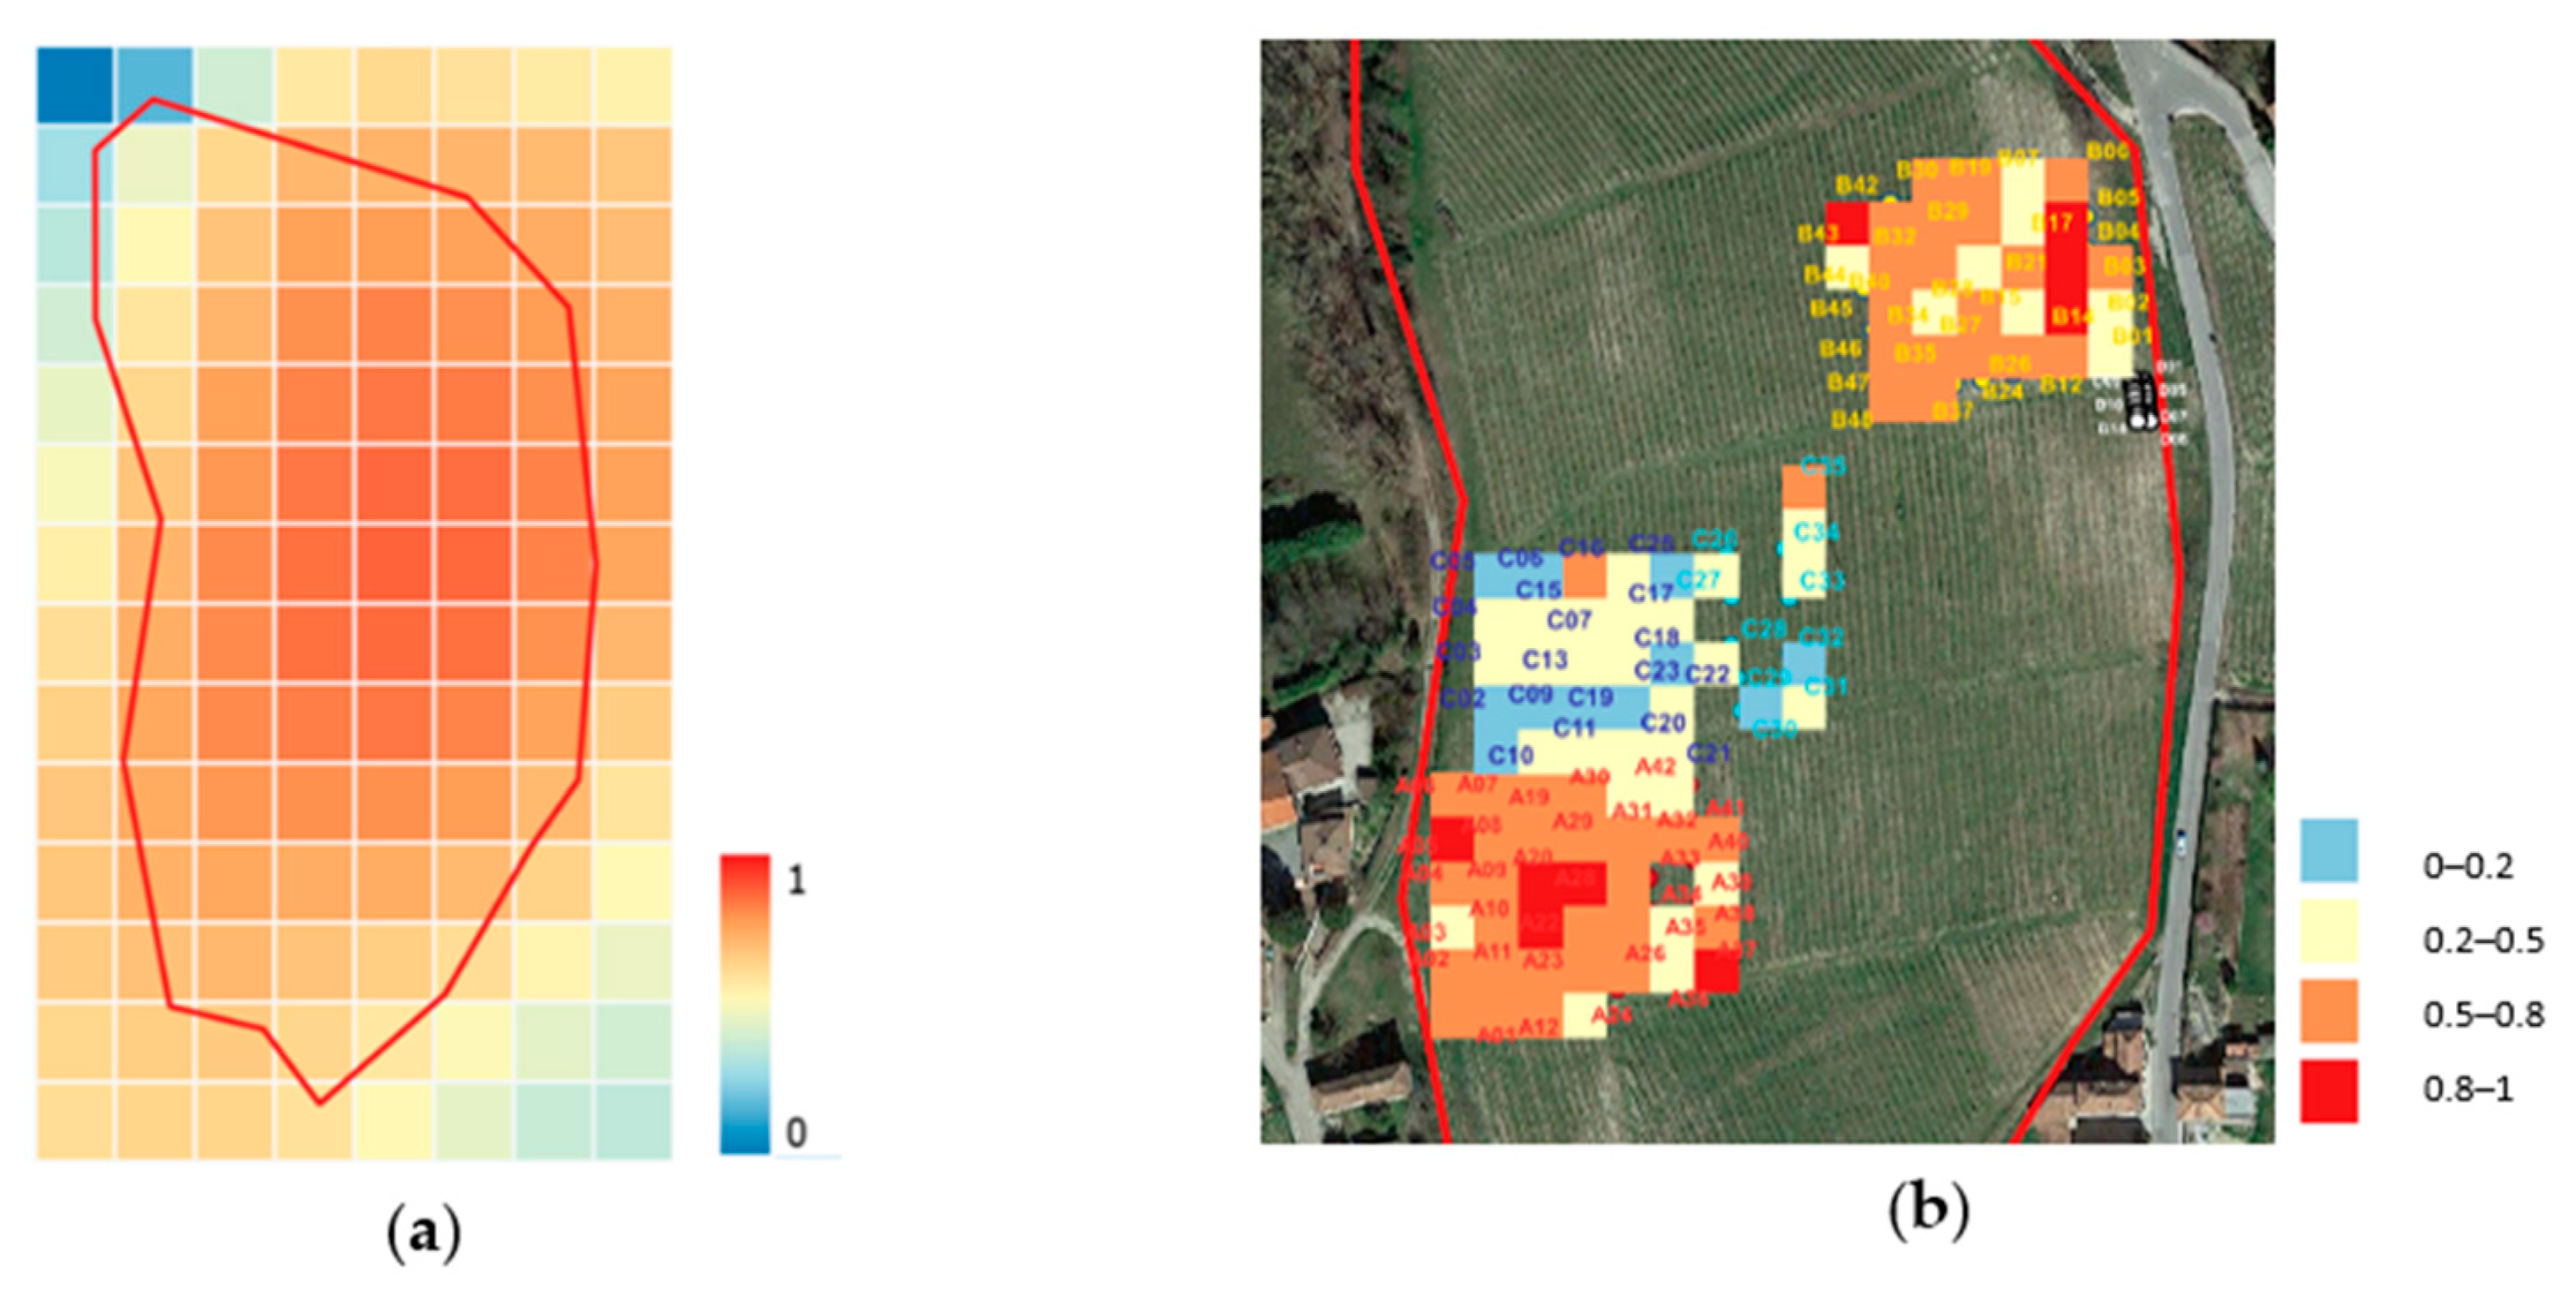
The data collected are presented by thematic maps. From the atmospheric and climatic data collected on the field, the CWSI for each waypoint has been evaluated and associated with its geographical coordinates in GeoTIFF format. This way, the georeferenced CWSI map can be layered on the crop area through a Geographic Information Software (QGIS).
The map from satellite data is plotted to show the different values of the CWSI among the different regions in the field.
Figure 2a shows that the CWSI is quite homogeneous and ranges from 0.4 to 0.9 over the whole field. The distribution of CWSI values based on the ground-collected data is more irregular and uneven. Areas A and B show values of CWSI ranging mainly from 0.5 to 1, with few squares having an index value below 0.5, while areas C and D show values ranging from 0 to 0.2.
As pointed out in
Table 1, the values of CWSI can be grouped into four classes that differentiate between 0, “no water stress”, up to 1, “critical water stress”. The map in
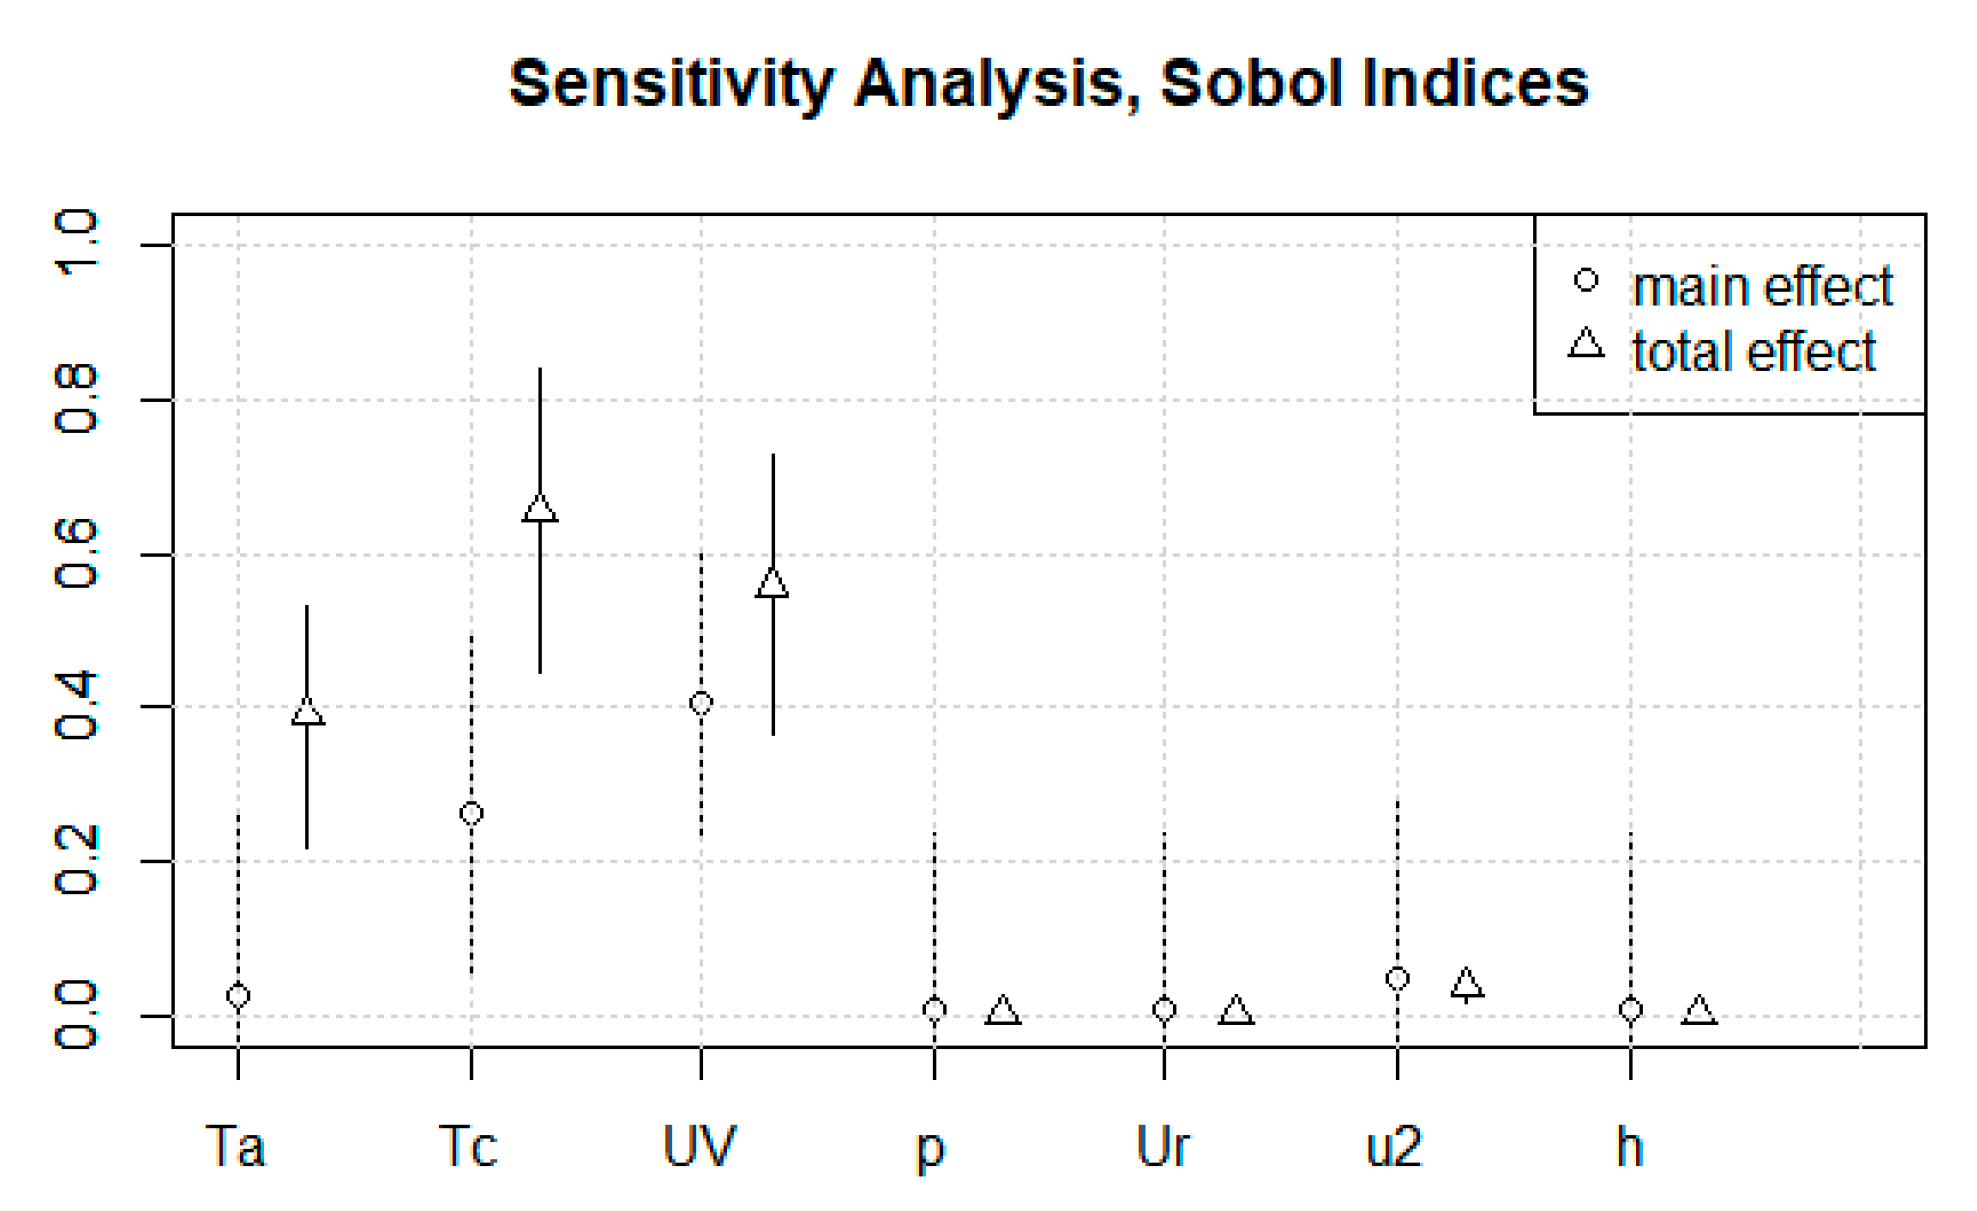
Figure 2b highlights that grouping. To further inspect the importance of each factor to the CWSI value, we have performed a Global Variance Based Sensitivity Analysis [
5], computing the main and total effects of the contribution of each variable to the variance of the output. The results are displayed in
Figure 3.
4. Discussion
The two maps shown in
Figure 2 are both informative, but a comparison between the kind of information that they provide represents a valuable outcome. The map based on the satellite-collected data provides information about a larger area, and virtually it can provide information about any portion of ground on the planet. However, there are some issues related to this source. First, the satellites cannot always provide pictures of a specific portion of the ground, and therefore a field cannot be continuously monitored through satellite images and satellite-collected data. Second, the resolution of the satellite images is quite low, meaning that a value of CWSI can be computed for each portion of dimension 30 × 30 m. On the other hand, on-field sensors can hypothetically monitor the field 24/7, and the resolution for CWSI maps based on the on-field collected data is quite high, with portions of dimension 1 × 10 m. Such dimensions can be further reduced if the waypoints are placed closer to each other. Therefore, on-field data collection for CWSI maps computation represent a much more reliable source of information on the water stress and health of the plants. It is worth noting that large fields on a homogenous terrain are unlikely to present considerable differences in CWSI values between neighboring areas, but small fields and fields with non-homogenous terrain require a much finer resolution to properly consider the local variation of CWSI in the management of the resources and of the field.
The sensitivity analysis by total effects (
Figure 3) points out that the most influential parameters are the air temperature (Ta), the UV radiation (UV) and the canopy temperature (Tc). It clearly shows that the accuracy of the corresponding sensors needs particular attention to improve their reliability and lower their uncertainty of CWSI measures.
5. Conclusions
Careful resource management is becoming more and more relevant due to frequent extreme meteorological events, such as droughts. Therefore, a non-invasive system of sensors that can inspect the conditions of the plants in near-real time, with high resolution and reliability, represents a valid tool to optimize resource consumption.
The extensive monitoring of the plant’s health can be achieved through climatic data detection, which can, in turn, be exploited to evaluate the Crop Water Stress Index, a vegetation index related to the ability of the plant to exploit the available water. The focus on CWSI is dictated by the current desertification trend that leads to hotter and drier summers, especially in the temperate regions where viticulture is extensively diffused (e.g., Italy and France). Due to this change in climate, equipping crops with irrigation systems balancing the lack of rainfall and keeping the crop in the optimal condition of Water Stress will become fundamental, and a close monitoring of the critically stressed areas could lead to better resource management.
Through this non-invasive monitoring system, it is possible to draw maps of georeferenced CWSI on crop areas. The maps offer a resolution, precision, time and operational cost more convenient than a human operator or a satellite without altering the vineyard structure or obstructing the cultivation operations.
With an on-field data collection session, the working principle of the system has been validated through a prototype, and high-resolution CWSI maps have been obtained. Through sensitivity analysis, it has been possible to determine which climatic variables affect the CWSI the most: these variables need to be detected with the most reliable sensors and with the highest possible resolution. The sensitivity analysis has offered an insight into system improvements that would entail both fixed and moving sensors: the former for the variables that can be taken as an average over the whole crop and the latter for the variables that need a higher resolution.
Further validation is needed to better study the correlation between the values of CWSI obtained with the on-field sensors and the ones obtained through satellite data taken by the Copernicus database and Landsat Satellite. Furthermore, the moving sensors could be mounted on autonomous drones to completely automatize the data collection step and create a full system that collects and analyses the data and offers as an output an easy-to-read map of the crop.
Finally, if the system is implemented on a crop for a long enough time span, a new intriguing possibility could be the correlation of the CWSI trend with the seasonal vineyard productivity and final grapes’ organoleptic quality. These future developments are beyond the scope of this paper and will be investigated in further studies.
Author Contributions
Conceptualization, all; methodology, P.B.d.P., G.B., A.B., C.G., L.M., M.M. and G.N.; software, C.G., L.M. and G.N.; validation, P.B.d.P., G.B., A.B., C.G., L.M., M.M. and G.N.; data curation, C.G. and G.N.; writing—original draft preparation, P.B.d.P., G.B., A.B., C.G., L.M., M.M. and G.N.; writing—review and editing, all; visualization, L.M.; supervision, V.C., C.C., S.I. and S.M.; project administration, L.M. and S.M.; funding acquisition, V.C., C.C., S.I. and S.M. All authors have read and agreed to the published version of the manuscript.
Funding
The financial support by Alta Scuola Politecnica to the Multidisciplinary Project “AIS4SIA: Artificial Intelligent Systems for a Smart and Innovative Agriculture” is gratefully acknowledged.
Institutional Review Board Statement
Not applicable.
Informed Consent Statement
Not applicable.
Data Availability Statement
The data presented in this study are available on request from the corresponding author.
Conflicts of Interest
The authors declare no conflict of interest.
References
- Zhou, Z.; Majeed, Y.; Naranjo, G.D.; Gambacorta, E.M. Assessment for crop water stress with infrared thermal imagery in precision agriculture: A review and future prospects for deep learning applications. Comput. Electron. Agric. 2021, 182, 106019. [Google Scholar] [CrossRef]
- Anda, A. Irrigation Timing in Maize by Using the Crop Water Stress Index (CWSI). Cereal Res. Commun. 2009, 37, 603–610. [Google Scholar] [CrossRef]
- Jackson, R.D. Canopy Temperature and Crop Water Stress. In Advances in Irrigation; Elsevier: Amsterdam, The Netherlands, 1982; Volume 1, pp. 43–85. [Google Scholar]
- Deloire, A.; Pellegrino, A.; Rogiers, S. A Few Words on Grapevine Leaf Water Potential. In IVES Technical Reviews, Vine and Wine; International Viticulture and Enology Society: Bordeaux, France, 2020. [Google Scholar]
- Sobol, I.M. Sensitivity Analysis for Non-Linear Mathematical Models. Math. Model. Comput. Exp. 1993, 1, 407–414. [Google Scholar]
| Disclaimer/Publisher’s Note: The statements, opinions and data contained in all publications are solely those of the individual author(s) and contributor(s) and not of MDPI and/or the editor(s). MDPI and/or the editor(s) disclaim responsibility for any injury to people or property resulting from any ideas, methods, instructions or products referred to in the content. |
© 2023 by the authors. Licensee MDPI, Basel, Switzerland. This article is an open access article distributed under the terms and conditions of the Creative Commons Attribution (CC BY) license (https://creativecommons.org/licenses/by/4.0/).


 ,
, 


