1. Introduction
Hydrological processes including water movement, generation of surface runoff, etc., rely upon the topography of the surface. A Digital Elevation Model (DEM) represents the bare topographic Earth surface excluding buildings, vegetation and any other objects on the surface. Some of the widely used and notable DEMs are MERIT DEM, FABDEM, etc. DEM is essential digital data for geomorphological study. Studies have been conducted for analysis of accuracy assessment of individual DEM datasets, but very limited work has been conducted wherein comparison of more than one DEM of different resolutions to analyze morphometric parameters derived from them [
1]. It is, therefore, important that various openly accessible DEMs must be assessed for their suitability for morphometric analysis. Generally, it is accepted that the higher the resolution of a DEM, the more precise it is, which also indicates better accuracy and finer extraction of components of land surface and the drainage lines present [
2].
A morphometric study of a watershed can be used to determine the ways in which different characteristics of an area are related. Morphometric parameter analysis is impacted by the source and resolution of DEMs [
3]. Morphometric analysis of watersheds helps us to determine various aspects of linear, areal and relief parameters [
4]. These parameters are used as an input for different hydrological applications, flood modelling and management of watersheds. Surface water potential, areas where land degradation occurs, and flood risk can be understood through morphometric parameter analysis [
5].
In the present study, we perform comparison between two openly accessible multi-resolution DEMs for their efficiency in terms of geomorphometric parameters for the chosen study area.
2. Materials and Method
The study area, which includes Kamrup and few neighboring districts in Assam, India is shown in
Figure 1. To carry out this study, we used two openly accessible multi-resolution DEM—MERIT DEM and FABDEM, for delineation of watershed using ArcHydro tools and HecGeoHMS package in ArcMap (v 10.5). The morphometric parameters computed from both the DEMs were then computed and compared to check their efficiency for the chosen study area.
2.1. Pre-Processing of DEM
The specifications of the datasets used in the present study are mentioned in
Table 1. The two DEMs used are the MERIT DEM developed by Dr. Yamazaki, University of Tokyo by removing multiple error components from existing spaceborne DEMs (SRTM and AW3D), which represents the terrain elevations at a 3 sec resolution (~90 m at the equator), and the FABDEM, which is the first global DEM (30 m resolution) that used Machine Learning to remove building and tree height biases from Copernicus GLO 30 DEM. The tiles of MERIT DEM and FABDEM were downloaded from the following websites:
http://hydro.iis.u-tokyo.ac.jp/~yamadai/MERIT_DEM/ (accessed on 13 August 2022),
https://data.bris.ac.uk/data/dataset/25wfy0f9ukoge2gs7a5mqpq2j7 (accessed on 17 August 2022). They were then mosaiced and clipped according to the study area in ArcMap.
2.2. Watershed Delineation
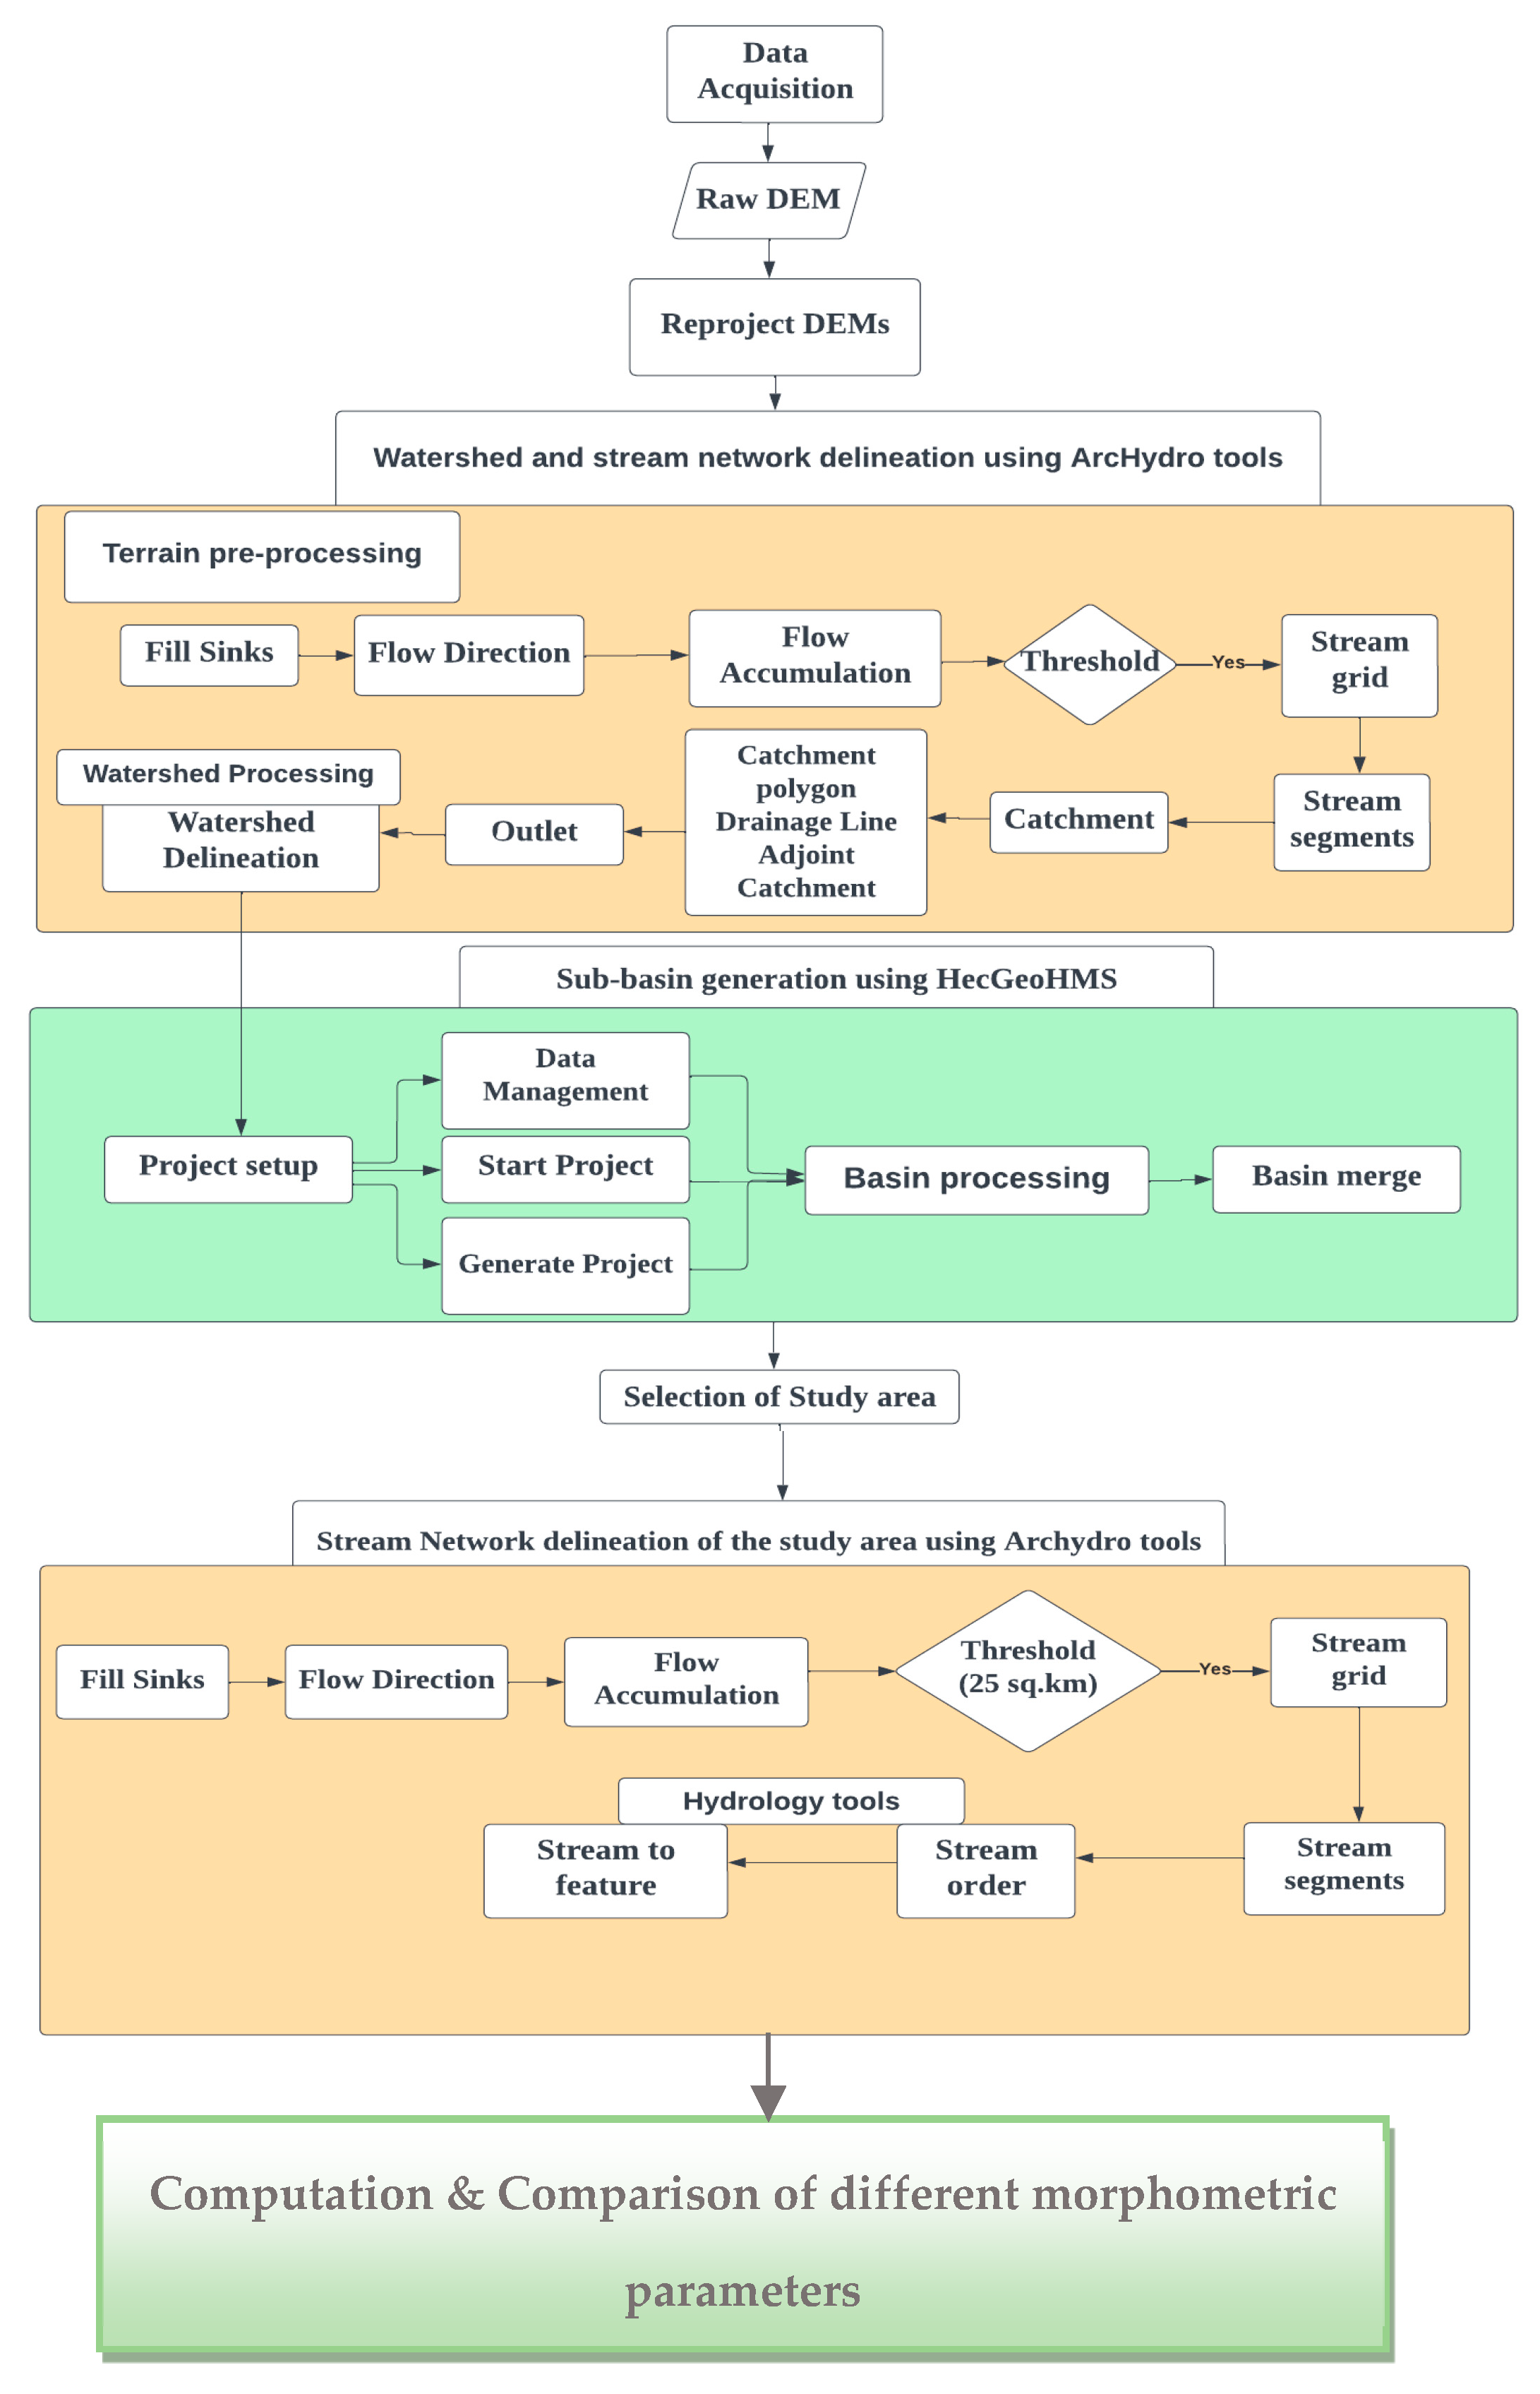
The methodology flowchart used in this study is depicted in
Figure 2.
For the generation of watershed and sub-basins from both the DEMs, the procedure was carried out using ArcHydro tools and HecGeoHMS in ArcGIS (v 10.5).
The below mentioned steps were followed in sequential order for delineation of watershed and generation of sub-basins:
Fill Sinks—depressions, if any, present in the DEMs were eliminated using this tool;
Flow Direction—flow direction was determined using the D8 method;
Flow accumulation—flow accumulation grid was computed using this tool; for each cell in the input grid, it contains the accumulated number of cells upstream of a cell;
Stream definition—the total contributing area of both the DEMs was taken as 25 km2;
Stream segmentation—the streams created were segmented using this tool;
Catchment grid delineation;
All the created raster data were converted to vector format using the following three tools: Catchment polygon processing, Drainage line and Adjoint Catchment tool;
Drainage point—the cell location within each catchment having the maximum flow accumulation value was denoted by this tool;
Batch point generation—the outlet points for the sub-basin generated from each of the DEMs were selected at the same location;
Batch watershed generation—the watershed for the selected area was delineated using this tool.
After completing the above steps, a project was set up in HecGeoHMS using the results obtained from the ArcHydro tools for further computation. As the study area includes Guwahati city and its neighboring districts in Assam, which are highly flood prone and flood occurs in these regions every year; so, out of the 9 major sub-basins extracted using the Basin merging tool, the sub-basin 6 was chosen for further analysis.
2.3. Computation of Different Morphometric Parameters from Both the DEMs
The basic morphometric parameters such as basin area, basin perimeter, etc., were calculated from the attribute table of the sub-basin. Stream order for both the DEMs were computed using Hydrology tools (Spatial Analyst tools). Basin length for the sub-basin was calculated using the measure tool and ArcHydro tool. Other parameters such as stream length, drainage density, relief ratio, ruggedness ratio, form factor, etc., were derived using standard formulas.
3. Results and Discussion
Figure 3 and
Figure 4 show the delineated watershed and derived drainage network from MERIT DEM and FABDEM.
Different linear, areal and relief aspects including basic parameters such as area and perimeter were computed for the study area. The values of these morphometric parameters derived from both the DEMs are shown in
Figure 5. It was observed that the area delineated using MERIT DEM is larger (24,628.2 km
2) compared to FABDEM (21,425.6 km
2). This is likely because in the study area we have chosen, FABDEM was still determined to have random artifacts and pits which were not corrected accurately [
6]. Through visual interpretation, it was observed that the streamlines delineated using MERIT DEM were more accurately aligned compared to FABDEM. The sub-basin derived using MERIT DEM showed that it is governed by highest fifth-order stream, while that derived using FABDEM is governed by sixth-order stream, both indicating a dendritic drainage pattern. Although FABDEM has higher resolution compared to MERIT DEM, the total number of streams of FABDEM (493) is smaller than that of MERIT DEM (545) as the sub-basin’s area delineated for it is smaller.
The bifurcation ratio values derived indicated that there is no disturbance from any geologic structures for the sub-basin. From the elongation and circularity ratio values, it was seen that the basin is oval to circular. The high basin relief values, low ruggedness number values and relatively low drainage density values obtained from both DEMs implies that less erosion occurs in the study area. It also indicates that the area has a coarse drainage texture and is associated with thick vegetation and high resistance or permeable soil. Low overland flow values (11.9 km from MERIT DEM and 13.1 km from FABDEM) computed from both DEMs also signifies that the study area is indicative of flooding conditions during heavy rainfall.
4. Conclusions
This study showed the comparison of the morphometric parameters classified as linear, areal and relief aspects from the two openly accessible multi-resolution DEMs, MERIT DEM and FABDEM. From the parameter values derived from two DEMs, it was concluded that the chosen study area is prone to flooding conditions during heavy rainfall with no disturbance from any geologic structures and the area is associated to thick vegetation with less occurrence of soil erosion. Variation is observed in basic parameters such as area and basin length. Among the linear aspects, parameters such as stream order, stream number and stream length showed significant variation between the two DEMs, whereas both the relief and areal aspects did not show much difference, irrespective of the DEM used. From the results, it was observed that variation among some of the parameters mainly depends on the source and resolution of DEM. It is, therefore, important to consider the type of DEM used for watershed delineation and in studies related to morphometric parameter estimation. It was visually observed from the drainage network generated from the two DEMs that drainage lines of the MERIT DEM seem more naturally close compared to FABDEM for our study area. Thus, from hydrological point of view, MERIT DEM can be used in flat regions and its drainage networks are also clearly represented for the study area. On the other hand, from the resolution point of view, FAB DEM with higher resolution (30 m) can be considered for revealing finer details in areas leading to high accuracy.
Author Contributions
Conceptualization, A.B. (Ashutosh Bhardwaj) and S.R.K.; methodology, A.B. (Ashutosh Bhardwaj); software, A.B. (Ankini Borgohain); validation, V.G., V.K. and A.B. (Ashutosh Bhardwaj); formal analysis, A.B. (Ankini Borgohain); investigation, A.B. (Ashutosh Bhardwaj); resources, A.B. (Ankini Borgohain); data curation, A.B. (Ankini Borgohain); writing—original draft preparation, A.B. (Ankini Borgohain); writing—review and editing, A.B. (Ashutosh Bhardwaj); visualization, A.B. (Ankini Borgohain); supervision, A.B. (Ashutosh Bhardwaj); project administration, A.B. (Ashutosh Bhardwaj). All authors have read and agreed to the published version of the manuscript.
Funding
This research received no external funding.
Institutional Review Board Statement
Not applicable.
Informed Consent Statement
Not applicable.
Data Availability Statement
No new data were created or analyzed in this study. Data sharing is not applicable to this article.
Conflicts of Interest
The authors declare no conflict of interest.
References
- Das, S.; Patel, P.P.; Sengupta, S. Evaluation of different digital elevation models for analyzing drainage morphometric parameters in a mountainous terrain: A case study of the Supin–Upper Tons Basin, Indian Himalayas. SpringerPlus 2016, 5, 1544. [Google Scholar] [CrossRef] [PubMed] [Green Version]
- Anornu, G.K.; Kabo-bah, A.; Kortatsi, B.K. Comparability Studies of High and Low Resolution Digital Elevation Models for Watershed Delineation in the Tropics: Case of Densu River Basin of Ghana. Int. J. Coop. Stud. 2012, 1, 9–14. [Google Scholar] [CrossRef]
- Weydahl, D.J.; Sagstuen, J.; Dick, Ø.B.; Rønning, H. SRTM DEM accuracy assessment over vegetated areas in Norway. Int. J. Remote Sens. 2007, 28, 3513–3527. [Google Scholar] [CrossRef]
- Abboud, I.A.; Nofal, R.A. Morphometric analysis of wadi Khumal basin, western coast of Saudi Arabia, using remote sensing and GIS techniques. J. Afr. Earth Sci. 2017, 126, 58–74. [Google Scholar] [CrossRef]
- Tesema, T.A. Impact of identical digital elevation model resolution and sources on morphometric parameters of Tena watershed, Ethiopia. Heliyon 2021, 7, e08345. [Google Scholar] [CrossRef] [PubMed]
- Hawker, L.; Uhe, P.; Paulo, L.; Sosa, J.; Savage, J.; Sampson, C.; Neal, J. A 30 m global map of elevation with forests and buildings removed. Environ. Res. Lett. 2022, 17, 024016. [Google Scholar] [CrossRef]
| Disclaimer/Publisher’s Note: The statements, opinions and data contained in all publications are solely those of the individual author(s) and contributor(s) and not of MDPI and/or the editor(s). MDPI and/or the editor(s) disclaim responsibility for any injury to people or property resulting from any ideas, methods, instructions or products referred to in the content. |
© 2023 by the authors. Licensee MDPI, Basel, Switzerland. This article is an open access article distributed under the terms and conditions of the Creative Commons Attribution (CC BY) license (https://creativecommons.org/licenses/by/4.0/).


