Proceeding Paper

Short-Term Precipitation Forecasting Based on the Improved Extreme Learning Machine Technique †

1
Department of Soils and Agri-Food Engineering, Université Laval, Quebec City, QC G1V 0A6, Canada
2
Department of Civil Engineering, University of Ottawa, 161 Louis Pasteur Private, Ottawa, ON K1N 6N5, Canada
3
School of Engineering, University of Guelph, Guelph, ON N1G 2W1, Canada
*
Author to whom correspondence should be addressed.
Presented at the 7th International Electronic Conference on Water Sciences, 15–30 March 2023; Available online: https://ecws-7.sciforum.net/.
Environ. Sci. Proc. 2023, 25(1), 50; https://doi.org/10.3390/ECWS-7-14237
Published: 16 March 2023
(This article belongs to the Proceedings of The 7th International Electronic Conference on Water Sciences)

Abstract

:
In this study, an improved version of the Extreme Learning Machine, namely the Improved Weighted Regularization ELM (IWRELM), is proposed for hourly precipitation forecasting that is multi-steps ahead. After finding the optimal values of the proposed method, including the number of hidden neurons, the activation function, the weight function, the regularization parameter, and the effect of orthogonality, the IWRELM model was calibrated and validated. Thereafter, the calibrated IWRELM model was used to estimate precipitation up to ten hours ahead. The results indicated that the proposed IWRELM (R = 0.9996; NSE = 0.9993; RMSE = 0.015; MAE = 0.0005) has acceptable accuracy in short-term hourly precipitation forecasting up to ten hours ahead.

1. Introduction

As a fundamental hydrological variable, precipitation significantly contributes to the land surface and atmospheric processes. Recently, there have been many applications for precipitation forecasting, such as pollutant concentration level monitoring, flood forecasting, and more. Forecasting precipitation is challenging for meteorological scientists due to precipitation timing and quantity variability. As a result of its persistence and complexity, rainfall forecasting has piqued the interest of academics. Moreover, potential flooding as the result of snow melt and heavy precipitation in early Spring in Canada [1,2] may cause significant fatalities and economic damage. Therefore, a quantitative and accurate precipitation forecast can be helpful in formulating appropriate measures and reducing the risk of floods and landslides leading to property damage and loss of life.
It is recognized that existing models use complex statistical models, which are often neither computationally nor economically feasible; downstream applications may also not affected by them. The use of machine learning algorithms in combination with the time series concept is therefore being explored as a possible solution to these shortcomings. The most well-known form of machine learning (ML) is an Artificial Neural Network (ANN) trained with the backpropagation (BP) training algorithm. Although this method has been used by many scholars, it has limitations, such as slow convergence, a time-consuming training process, being stuck in local minima, overfitting, and low generalization proficiency [3,4,5,6]. The Extreme Learning Machine (ELM) was introduced by Huang et al. [7] as a single-layer feed-forward neural network designed to overcome the classical ANN. The main advantages of the ELM are its high generalization capability [7,8], rapid training process, and low number of adjustable parameters by the user.
Along with all these advantages, the random determination of more than 66% of the parameters related to the final model (i.e., two matrices of bias consisting of hidden neurons and input weights) [9] is one of the limitations of this method. Ebtehaj et al. [9] suggested a simple iterative process to reduce the effect of random initialization of these two matrices. Moreover, Deng et al. [9] considered the regularization term in the loss function of the ELM. They defined a weighting process to improve the ELM’s generalizability in the presence of outliers, resulting in the Weighted Regularized ELM (WRELM). A comparison of the WRELM with the first version of the ELM introduced by [7] proved the higher ability of the WRELM [8,10]. To the authors’ best knowledge, no study has been carried out on the application of the WRELM in hourly precipitation forecasting.
In the current study, a computer program was coded in a MATLAB environment to develop an improved version of the WRELM (i.e., IWRELM) by taking advantage of the iterative process introduced in [9] and the WRELM [10]. The introduced IWRELM is applied for hourly precipitation forecasting. The different parameters of the IWRELM, including the effect of orthogonality, the regularization parameter, the weight function, the activation function, and the number of hidden neurons, have been optimized through different defined models. Moreover, various models have been defined for multi-step-ahead forecasting of the precipitation in Quebec City, Canada.

2. Materials and Methods

2.1. Study Area

The data used in the current study were recorded hourly at the Sainte- Catherine-de-la-Jacques-Cartier station from 12/14/1994 to 10/31/2022 (latitude of 46.8378 and longitude of −71.6217). The collected data were divided into training and testing stages at a 50:50 ratio. The minimum, average, standard deviation, and maximum values of the dataset are 0, 0.0843, 0.5574, and 18.4 mm/h, respectively. All measurements in the dataset were made by the “Ministère de l’Environnement et de la Lutte contre les changements climatiques, de la Faune et des Parcs” [11] of Quebec, Canada.

2.2. Improved Weighted Regularized Extreme Learning Machine (IWRELM)

Suppose we have a dataset with N training samples, xi (i = 1, 2, …, S) representing the inputs, and yi representing the outputs associated with those inputs. Assuming that the f(x) is used as the activation function and that there are h neurons in the hidden layer, the mathematical relationship specified by the IWRELM to map the input variables to the output variables can be stated as follows:
j = 1 h z j f ( o j x i + A j ) = y i , i = 1 , 2 , .. , S
where zj is the vector of the output weight, f(x) denotes the activation function, oj is the input weight matrix, Ai is the bias of hidden neurons, xi and yi denote the input and output variables, respectively, S denotes the number of samples, and h is the number of hidden neurons.
Based on Equation (1), which consists of S equations, a matrix representation of the equation can be expressed as:
Gz = y
z = [ z 1 , , z S ] T
y = [ y 1 , , y S ] T
G = f ( o 1 x 1 + A 1 ) f ( o h x 1 + A L ) f ( o 1 x S + A 1 ) f ( o h x S + A L ) f S × h
Due to the random definition of the output weight (i.e., O) and the bias of hidden neurons (i.e., A), the matrix G is known. Therefore, the only unknown variable in Equation (2) is z. Because matrix G is, in most cases, not a square matrix, it is not possible to directly calculate z using Equation (2) [7]. To solve this problem, it is easier to use the minimization of the loss function to calculate the optimal least-squares solution. The loss function in the IWRELM is defined as follows:
E = min z C W ( y G z ) 2 2 + z 2 2
where C is the regularization parameter and W is the weight of each sample through the weighting process in the IWRELM. In the weighting process, Equation (6) is considered as Equation (7) with different weights assigned to all samples so that the samples with the least error receive the most weight and vice versa:
E = min z C ( y G z ) 2 2 + z 2 2
The solution of the output weight (i.e., w) from Equation (7) is as follows:
z ^ = G T G + I / C 1 G T y
Here, I is the identity matrix. Moreover, C should not be zero. It could be a positive value less than 1 (0 < C < 1). The applied functions for the weighting process are defined in Table 1. The process of calculating the output weight using Equation (7), the weighting process using the functions provided in Table 1, and the recalculated loss function based on Equation (6) are repeated according to the iteration number defined by the user.

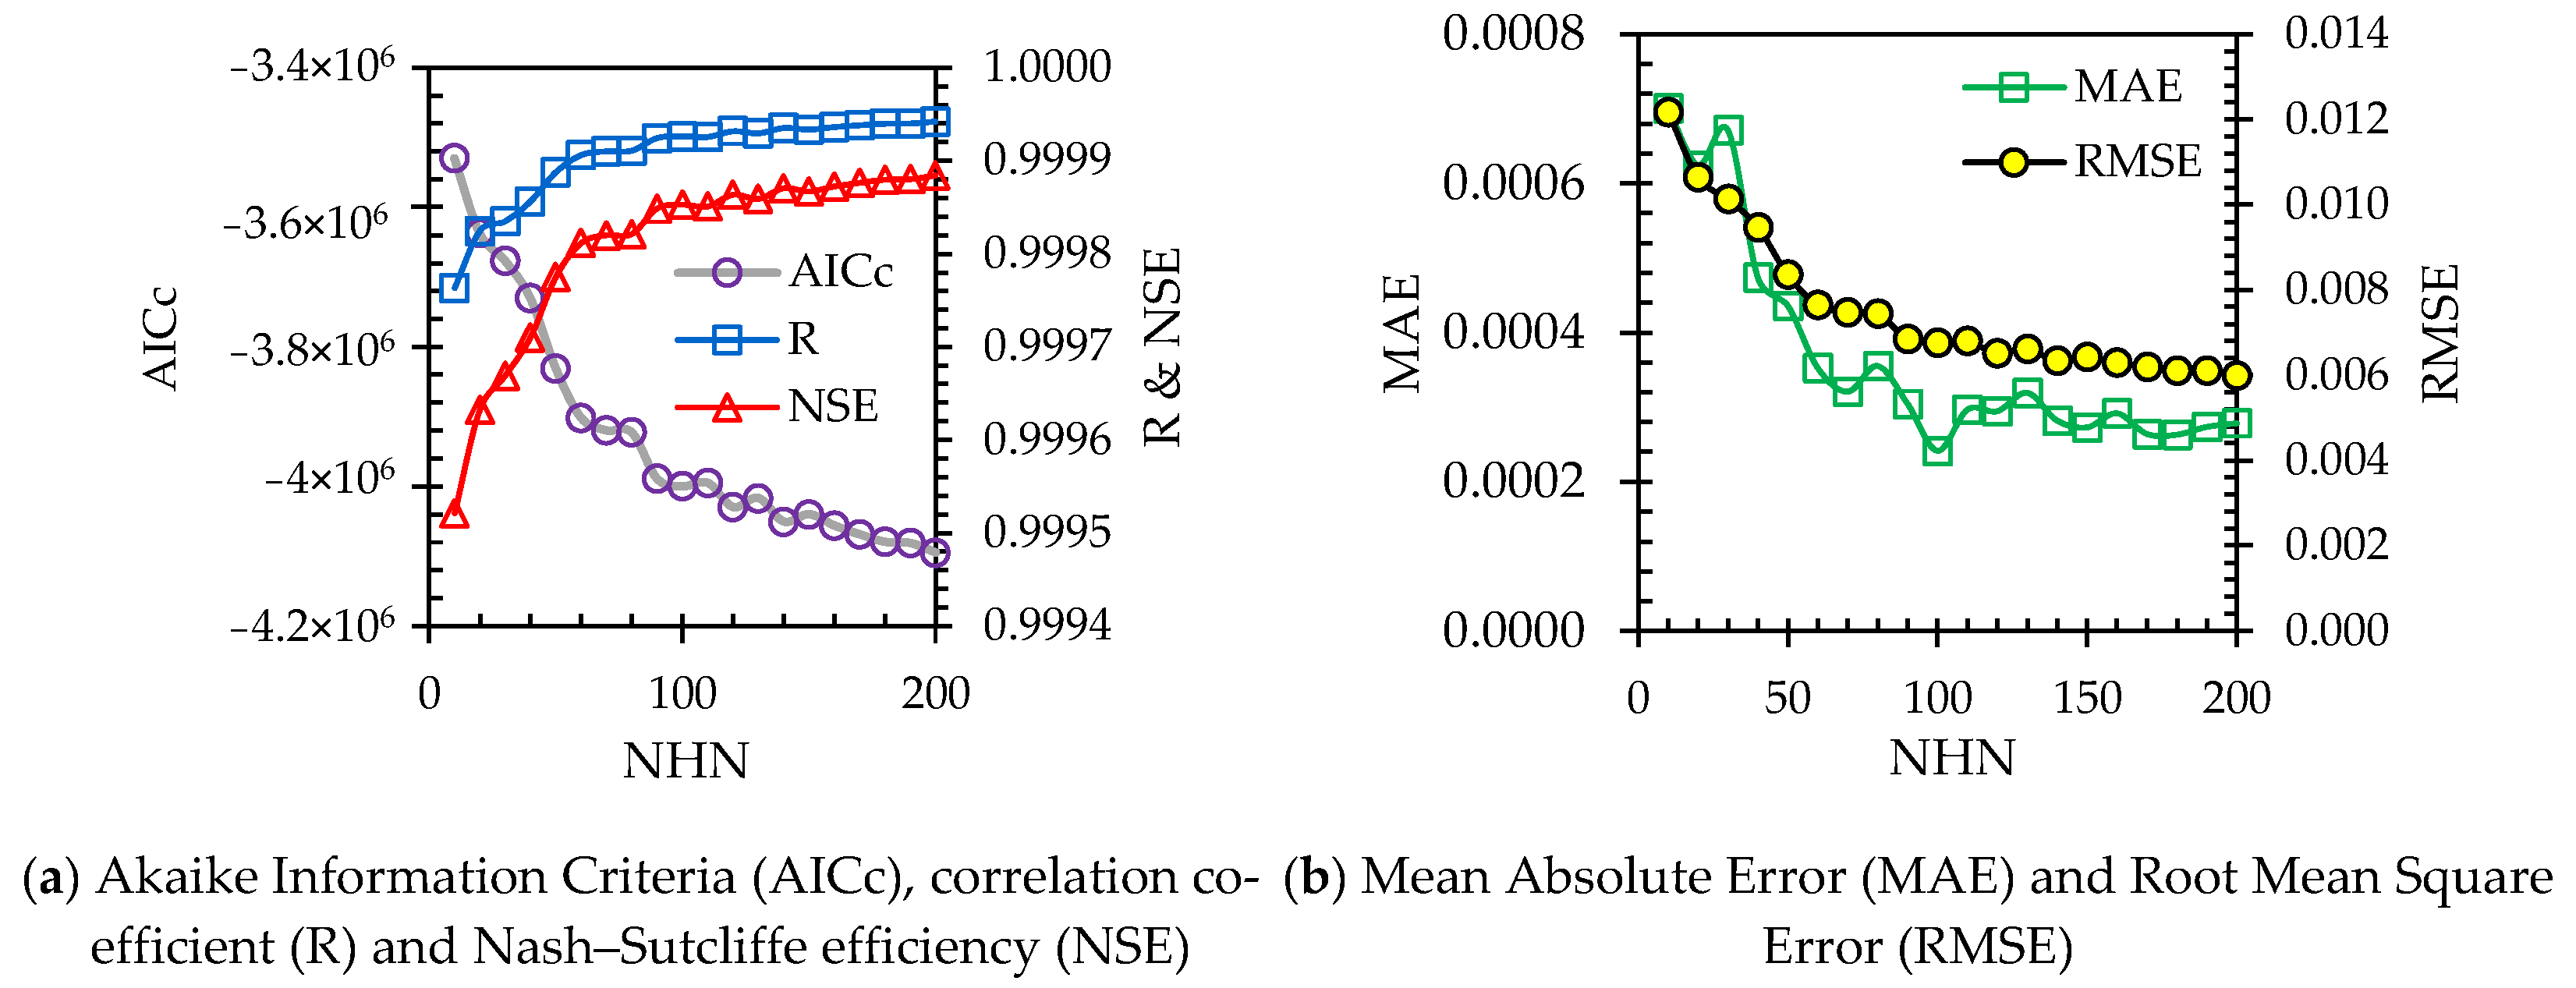
3. Results and Discussion

This section details IWRELM-based modeling that was used to find the optimal parameters, including the number of hidden neurons (NHN), the activation function, the weight function, the regularization parameter, and the effect of orthogonality. Finally, the performance of this model in multi-step-ahead precipitation forecasting is investigated using the found optimal values and functions.
Figure 1 shows the statistical indices of the developed IWRELM in hourly precipitation forecasting. Details of the statistical indices provided in Figure 1, including the correlation coefficient (R), Nash–Sutcliffe efficiency (NSE), Mean Absolute Error (MAE), Root Mean Square Error (RMSE), and Corrected Akaike Information Criteria, can be found in recently published studies [12,13].
Precipitation at the next time point is estimated as follows using the value of this variable considering one to three delays:
Pr(t) = f(Pr(t−1), Pr(t−2), Pr(t−3))
where Pr(t), Pr(t−1), P(t−2), and Pr(t−3) denote the precipitation at time t, t−1, t−2, and t−3, respectively.
The twenty different values in the range of 10 to 200 were checked for the number of hidden neurons. Due to Figure 1b, it can be seen that the R and NSE indices are greater than 0.99, indicating a high level of accuracy in forecasting hourly precipitation with a different number of hidden neurons. Evaluating the effect of NHN in the IWRELM indicates that increasing the number of hidden neurons generally enhances the model’s accuracy. Based on Figure 1b, increasing the number of hidden neurons leads to a significant reduction in MAE and RMSE, especially when the number of hidden neurons is more than 100. For less than 100 hidden neurons, an increase of 10 units in NHN significantly changes the values of MAE and RMSE. For example, the MAE and RMSE of NHN = 10 (RMSE = 0.012 and MAE = 0.0007) are more than 10% and 12% lower than the values of these indices for NHN = 20 (RMSE = 0.0106 and MAE = 0.00062), while the difference between the values of these two indices for NHN = 200 and NHN = 190 is less than 2%. However, in some instances, the increase in NHN did not correspond directly to a decrease in MAE and RMSE. For example, the values of these two indices corresponding to NHN = 110, 130, and 150 are higher than those corresponding to NHN = 100, 120, and 140, respectively. The reason for this could be related to the random determination of input weights and the bias of hidden neurons (the two main matrices in ELM-based methods such as the WRELM), which includes more than 66% of the total number of optimized values [8]. Considering that in the models presented in this study the iteration number is equal to 1000, and when facing such conditions its value is increased to 100,000, the best results related to IWRELMs with different numbers of hidden neurons have been presented.
Considering that the values of regression-based indices in different models are not significantly different (similar to Figure 1), R and NSE are not provided to evaluate other parameters of the IWRELM. Figure 2 shows the statistical indices of the IWRELM used to find the optimal activation function, the weight function provided in Table 1, the regularization parameter (defined in Equation (6)), and the effect of orthogonality on modeling performance. For the activation function, six different functions were compared (i.e., sigmoid (Sig), sine (Sin), tangent hyperbolic (Tanh), radial basis function (Radbas), triangular basis function (Tribas), and hard limit (Hardlim)). The RMSE and MAE of the IWRELM with the activation function Hardlim are more than seven and nine times higher than Sig and Radbas, respectively, representing the only functions that performed better than Hardlim in these two indices.
A comparison of other functions indicated insignificant differences between them, with Sin outperforming the others. For the weight functions provided in Table 1, which are the most crucial features of the IWRELM compared to the classical ELM, the difference between all functions is remarkable, with the RMSE and MAE of function 9 more than four times greater than the respective values for functions 1, 3, 6, 7, and 8. The performance levels of functions 1, 3, 6, 7, and 8 are very close, with function 3 minimally outperforming the others (i.e., functions 1, 6, 7, and 8); this function was chosen as the optimal function. The regularization parameter is selected in the range of 0.0001 to 0.8. The results indicated that the best performance for the IWRELM is achieved with the lowest regularization parameter value (i.e., C = 0.0001). Moreover, the statistical indices provided in Figure 2d prove the importance of using the orthogonality function to define random initialized matrices (i.e., the bias of hidden neurons and input weights).
Figure 3 shows the statistical indices of the IWRELM in forecasting hourly precipitation from one to ten hours ahead. To develop these models, three lags were considered as input variables, as in Equation (3) for one hour ahead (1HA). For two to ten hours ahead, the first inputs are Pr(t−2) to Pr(t−10), the second inputs are Pr(t−3) to Pr(t−11), and the third ones are from Pr(t−4) to Pr(t−12). It can be seen that increasing the time ahead for forecasting precipitation (i.e., from 1HA to 10HA) decreases the values of two correlation-based indices (i.e., R and NSE) and increases the values of the RMSE and MAE indices. Additionally, the index values for 10HA precipitation forecasting, where performance is almost the weakest, are acceptable (R = 0.99965; NSE = 0.99926; MAE = 0.00054; RMSE = 0.015). Based on the results of this study, the method developed here (i.e., the IWRELM) has a high ability to forecast precipitation several hours in advance.

4. Conclusions

In this study, the Improved Weighted Regularization Extreme Learning Machine (IWRELM) was proposed for hourly forecasting of precipitation one to ten hours ahead of time. By calibrating this model for one-hour-ahead forecasting, the optimal number of hidden neurons (100), the optimal regularization parameter (C = 0.0001), the most efficient activation function (Sine function), and the most suitable weighting function (e.g., function 3 in Table 1) were found. Using the optimal values of the different parameters, the model’s performance was checked in terms of forecasting precipitation up to ten hours ahead of time. The results showed that the model’s accuracy decreased as it predicted further into the future, i.e., as time ahead increased from one to ten hours. Nevertheless, the model’s accuracy in forecasting precipitation ten hours ahead of time remains acceptable (R = 0.9996; NSE = 0.9993; RMSE = 0.015; MAE = 0.0005). Since there has been no evaluation of input variables, feature selection can be used in future studies and a comparison of the model’s performance with optimal inputs can also be performed.

Author Contributions

Conceptualization, I.E. and H.B.; methodology, I.E. and H.B.; software, I.E.; validation, I.E. and H.B.; formal analysis, I.E.; investigation, I.E.; data curation, I.E.; writing—original draft preparation, I.E. and H.B.; writing—review and editing, H.B., M.K., and B.G.; visualization, I.E.; supervision, H.B.; project administration, H.B.; All authors have read and agreed to the published version of the manuscript.

Funding

This research was funded by the Natural Sciences and Engineering Research Council of Canada (NSERC), Discovery Grant (#RGPIN-2020-04583), and the “Fond de Recherche du Québec- Nature et Technologies”, Québec government (#B2X–315020).

Institutional Review Board Statement

Not applicable.

Informed Consent Statement

Not applicable.

Data Availability Statement

All data used during the study were provided by a third party. Direct requests for these materials may be made to the provider, as indicated in the Acknowledgements.

Acknowledgments

The authors would like to thank the “Ministère de l’Environnement et de la Lutte contre les changements climatiques, de la Faune et des Parcs” of Quebec, Canada.

Conflicts of Interest

The authors declare no conflict of interest.

References

  1. Ebtehaj, I.; Bonakdari, H. A comprehensive comparison of the fifth and sixth phases of the coupled model intercomparison project based on the Canadian earth system models in spatio-temporal variability of long-term flood susceptibility using remote sensing and flood frequency analysis. J. Hydrol. 2023, 617, 128851. [Google Scholar]
  2. Zaghloul, M.S.; Ghaderpour, E.; Dastour, H.; Farjad, B.; Gupta, A.; Eum, H.; Axhari, G.; Hassan, Q.K. Long Term Trend Analysis of River Flow and Climate in Northern Canada. Hydrology 2022, 9, 197. [Google Scholar] [CrossRef]
  3. Bonakdari, H.; Ebtehaj, I. A comparative study of extreme learning machines and support vector machines in prediction of sediment transport in open channels. Int. J. Eng. 2016, 29, 1499–1506. [Google Scholar]
  4. Bonakdari, H.; Ebtehaj, I.; Samui, P.; Gharabaghi, B. Lake Water-Level fluctuations forecasting using Minimax Probability Machine Regression, Relevance Vector Machine, Gaussian Process Regression, and Extreme Learning Machine. Water Resour. Manag. 2019, 33, 3965–3984. [Google Scholar] [CrossRef]
  5. Bonakdari, H.; Qasem, S.N.; Ebtehaj, I.; Zaji, A.H.; Gharabaghi, B.; Moazamnia, M. An expert system for predicting the velocity field in narrow open channel flows using self-adaptive extreme learning machines. Measurement 2020, 151, 107202. [Google Scholar] [CrossRef]
  6. Ebtehaj, I.; Bonakdari, H.; Moradi, F.; Gharabaghi, B.; Khozani, Z.S. An Integrated Framework of Extreme Learning Machines for Predicting Scour at Pile Groups in Clear Water Condition. Coastal Eng. 2018, 135, 1–15. [Google Scholar] [CrossRef]
  7. Huang, G.B.; Zhu, Q.Y.; Siew, C.K. Extreme learning machine: Theory and applications. Neurocomputing 2006, 70, 489–501. [Google Scholar] [CrossRef]
  8. Ebtehaj, I.; Bonakdari, H. A reliable hybrid outlier robust non-tuned rapid machine learning model for multi-step ahead flood forecasting in Quebec, Canada. J. Hydrol. 2022, 614, 128592. [Google Scholar] [CrossRef]
  9. Ebtehaj, I.; Soltani, K.; Amiri, A.; Faramarzi, M.; Madramootoo, C.A.; Bonakdari, H. Prognostication of shortwave radiation using an improved No-Tuned fast machine learning. Sustainability 2021, 13, 8009. [Google Scholar] [CrossRef]
  10. Deng, W.; Zheng, Q.; Chen, L. Regularized extreme learning machine. In Proceedings of the 2009 IEEE Symposium on Computational Intelligence and Data Mining, Nashville, TN, USA, 30 March–2 April 2009; IEEE: Piscataway, NJ, USA, 2009; pp. 389–395. [Google Scholar]
  11. Ministère de l’Environnement et de la Lutte contre les changements climatiques, de la Faune et des Parcs. Données du Réseau de surveillance du climat du Québec, Direction de la qualité de l’air et du climat, Québec. 2022. Available online: https://www.environnement.gouv.qc.ca/ (accessed on 23 November 2022).
  12. Walton, R.; Binns, A.; Bonakdari, H.; Ebtehaj, I.; Gharabaghi, B. Estimating 2-year flood flows using the generalized structure of the Group Method of Data Handling. J. Hydrol. 2019, 575, 671–689. [Google Scholar] [CrossRef]
  13. Zeynoddin, M.; Ebtehaj, I.; Bonakdari, H. Development of a linear based stochastic model for daily soil temperature prediction: One step forward to sustainable agriculture. Comput. Electron. Agric. 2020, 176, 105636. [Google Scholar] [CrossRef]
Figure 1. Performance evaluation of the WRELM with different numbers of hidden neurons.
Environsciproc 25 00050 g001
Figure 2. Investigation of the effects of (a) the activation function, (b) the weight function, (c) the regularization parameter, and (d) orthogonality on IWRELM performance.
Environsciproc 25 00050 g002
Figure 3. Assessment of the WRELM’s ability in multi-step-ahead precipitation forecasting.
Environsciproc 25 00050 g003
Table 1. Weight functions applied in the IWRELM.
No.Function Definition
1 w i = 1 1.349 × ( y G z ) / IQR 2.5 2 × ( 3 1.349 ( y G z ) / IQR ) 2.5 1.349 × ( y G z ) / IQR 3 10 4 Otherwise
2 w = ( abs ( r ) < 1 × ( 1 r 2 ) 2 ;   r = ( 1.349 × ( y G z ) ) / ( 4.685 × IQR )
3 w = 1 / max ( 1 , a b s ( r ) ) ;   r = ( 1.349 × ( y G z ) ) / ( 1.345 × I Q R )
4 w = ( a b s ( r ) < p i ) × sin ( r ) / r ;   r = ( 1.349 × ( y G z ) ) / ( 1.339 × I Q R )
5 w = 1 / ( 1 + a b s ( r ) ) ;   r = ( 1.349 × ( y G z ) ) / ( 1.4 × I Q R )
6 w = 1 / ( 1 + r 2 ) ;   r = ( 1.349 × ( y G z ) ) / ( 2.385 × I Q R )
7 w = tanh ( r ) / r ;   r = ( 1.349 × ( y G z ) ) / ( 1.205 × I Q R )
8 w = tanh ( r ) / r ;   r = ( 1.349 × ( y G z ) ) / ( 2.795 × I Q R )
9 w = 1 × a b s ( r ) < 1 ;   r = ( 1.349 × ( y G z ) ) / ( 2.985 × I Q R )
10 w = 1 / max ( 0.0001 , a b s ( y G z ) )
IQR is the interquartile range.
Disclaimer/Publisher’s Note: The statements, opinions and data contained in all publications are solely those of the individual author(s) and contributor(s) and not of MDPI and/or the editor(s). MDPI and/or the editor(s) disclaim responsibility for any injury to people or property resulting from any ideas, methods, instructions or products referred to in the content.

