1. Introduction
Evapotranspiration and moisture standards for crops are two important factors limiting the development of agricultural practices. The roots of crops that are submerged or filled with groundwater will be depleted, and the crop will not grow. This will make the crop wither. Lysimeters are used to determine how much water plants lose through evaporation. They record the amount of precipitation and water that is delivered to the crop through irrigation as well as the amount of water that is lost through the soil due to percolation. This information can be used to determine how much water and how much evapotranspiration the crop needs. Lysimeters are very important instruments, consisting of tanks or vessels that can set limits on how much water can stay in the soil and measure the soil water balance, how much water moves vertically, or how much water is present in the soil.
In agriculture, a crop water requirement is defined as the depth of water required to meet the water loss through evapotranspiration of a disease-free crop growing in large fields under intolerable soil conditions, including soil water and fertility status, and achieving its full grain production potential under the given environmental conditions (including soil water and fertility status). Identifying water requirements and crop coefficients is critical for irrigation scheduling and agricultural water management in field management. The assessment of crop evapotranspiration (ETc), which is dependent on crop features, management techniques, crop development stage, as well as climate and environmental circumstances, is directly related to the crop water requirement. There are two ways for calculating crop evapotranspiration (ETc), direct and indirect. In the direct technique, lysimeters are used to estimate ETc, whereas in the indirect method, reference evapotranspiration (ET) and crop coefficients (Kc) are used indicating the water requirements of the crop [
1].
In terms of crop variation and output, water is the most significant limiting factor. Most of the water resources are devoted to agricultural irrigation. The proper use of irrigation water is becoming increasingly crucial as a means of dealing with the impending water crisis. An irrigation system ensures that plants receive the proper amount of water at the appropriate time for growth. Subsidized irrigation is the most important aspect of irrigation because it is used to augment natural rainfall in locations where rain falls irregularly or infrequently. Irrigation is used in arid places when the soil is extremely fertile and can support crop productivity, but there is little or no rainfall. Total irrigation is the name given to this method of irrigation. Due to a lack of irrigation, crops suffer from water stress, which lowers their yield. Plant nutrients can leach, and runoff and soil erosion can cause pollution of water sources if excessive irrigation is applied. In most cases, factors such as soil texture, rooting pattern, topography, evapotranspiration (ET) rate, rainfall, and crop type and/or development stage are likely to influence the frequency of irrigation. Carrot production can benefit from an efficient use of irrigation water. Irrigation scheduling has the potential to increase the irrigation efficiency, decrease the irrigation costs, and reduce the water opportunity costs. Similarly, a study found that boosting carrot production in a sustainable way relies on appropriate irrigation design, management, and scheduling. Thus, scheduling irrigation in accordance with a crop’s water needs reduces the risk of under- or overwatering. Crop failure and fertilizers leaching beyond the root zone are also reduced, and growers see an increase in their profit when considering well-established crop water need references. The goal of this review study was to extend the knowledge on carrot water requirements, irrigation schedules, and water use efficiency by combining material from various studies on the subject [
2].
The evaluation of the water requirements of a crop begins with the collection of fundamental data, which is represented by the estimation of evapotranspiration (ET). One of the most common approaches to calculating ET is based on what is known as the “crop coefficient”, which is defined as the ratio of total evapotranspiration to reference evapotranspiration, ETo This approach is very popular. The recent standard methods of the FAO have shown that the value of the crop coefficient is connected to canopy factors reflecting the crop growth stage. These variables include canopy height and fractional vegetation cover. This relationship holds true under given climatic conditions [
3].
Soil–plant–atmosphere water cycling includes evapotranspiration (ET), which is a major component. Water-related studies and applications, such as irrigation system design, irrigation scheduling, water resource planning and management, water allocation, water balance computation, crop yield forecast, and so on, rely heavily on its trustworthy determination. Although a variety of methods exist for measuring ET, they are time-consuming, expensive, and labor-intensive. As a result, it is typically calculated as the product of reference crop evapotranspiration (ETo) and crop coefficient in a well-known two-step approach [
4,
5].
2. Materials and Methods
2.1. Study Area
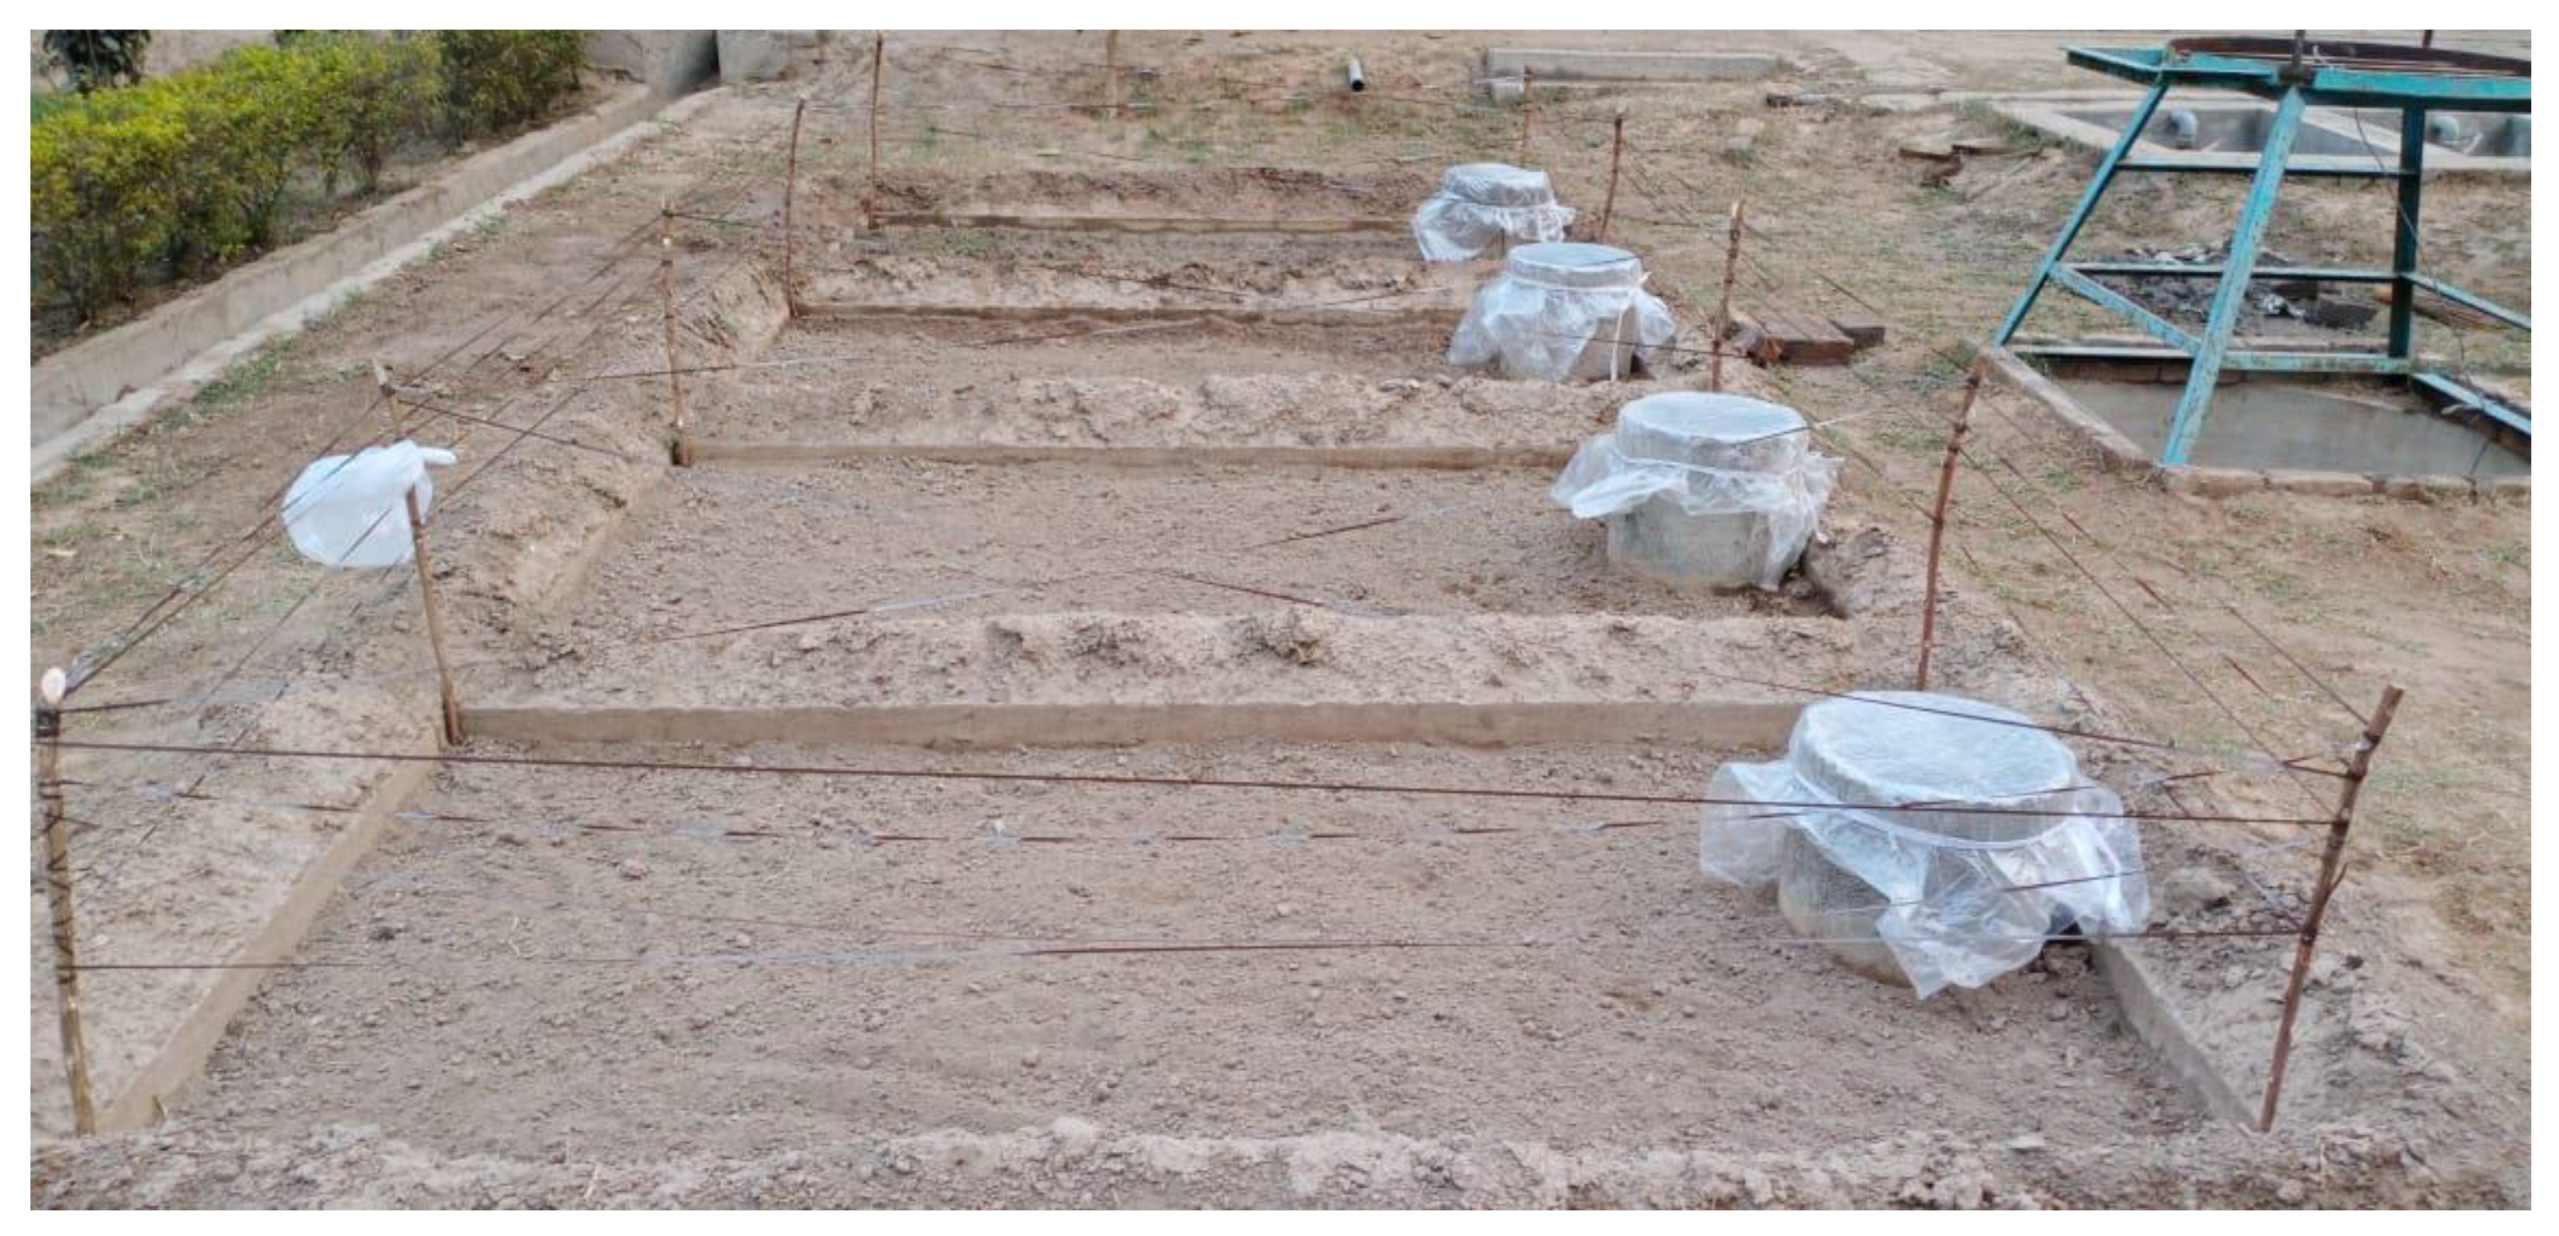
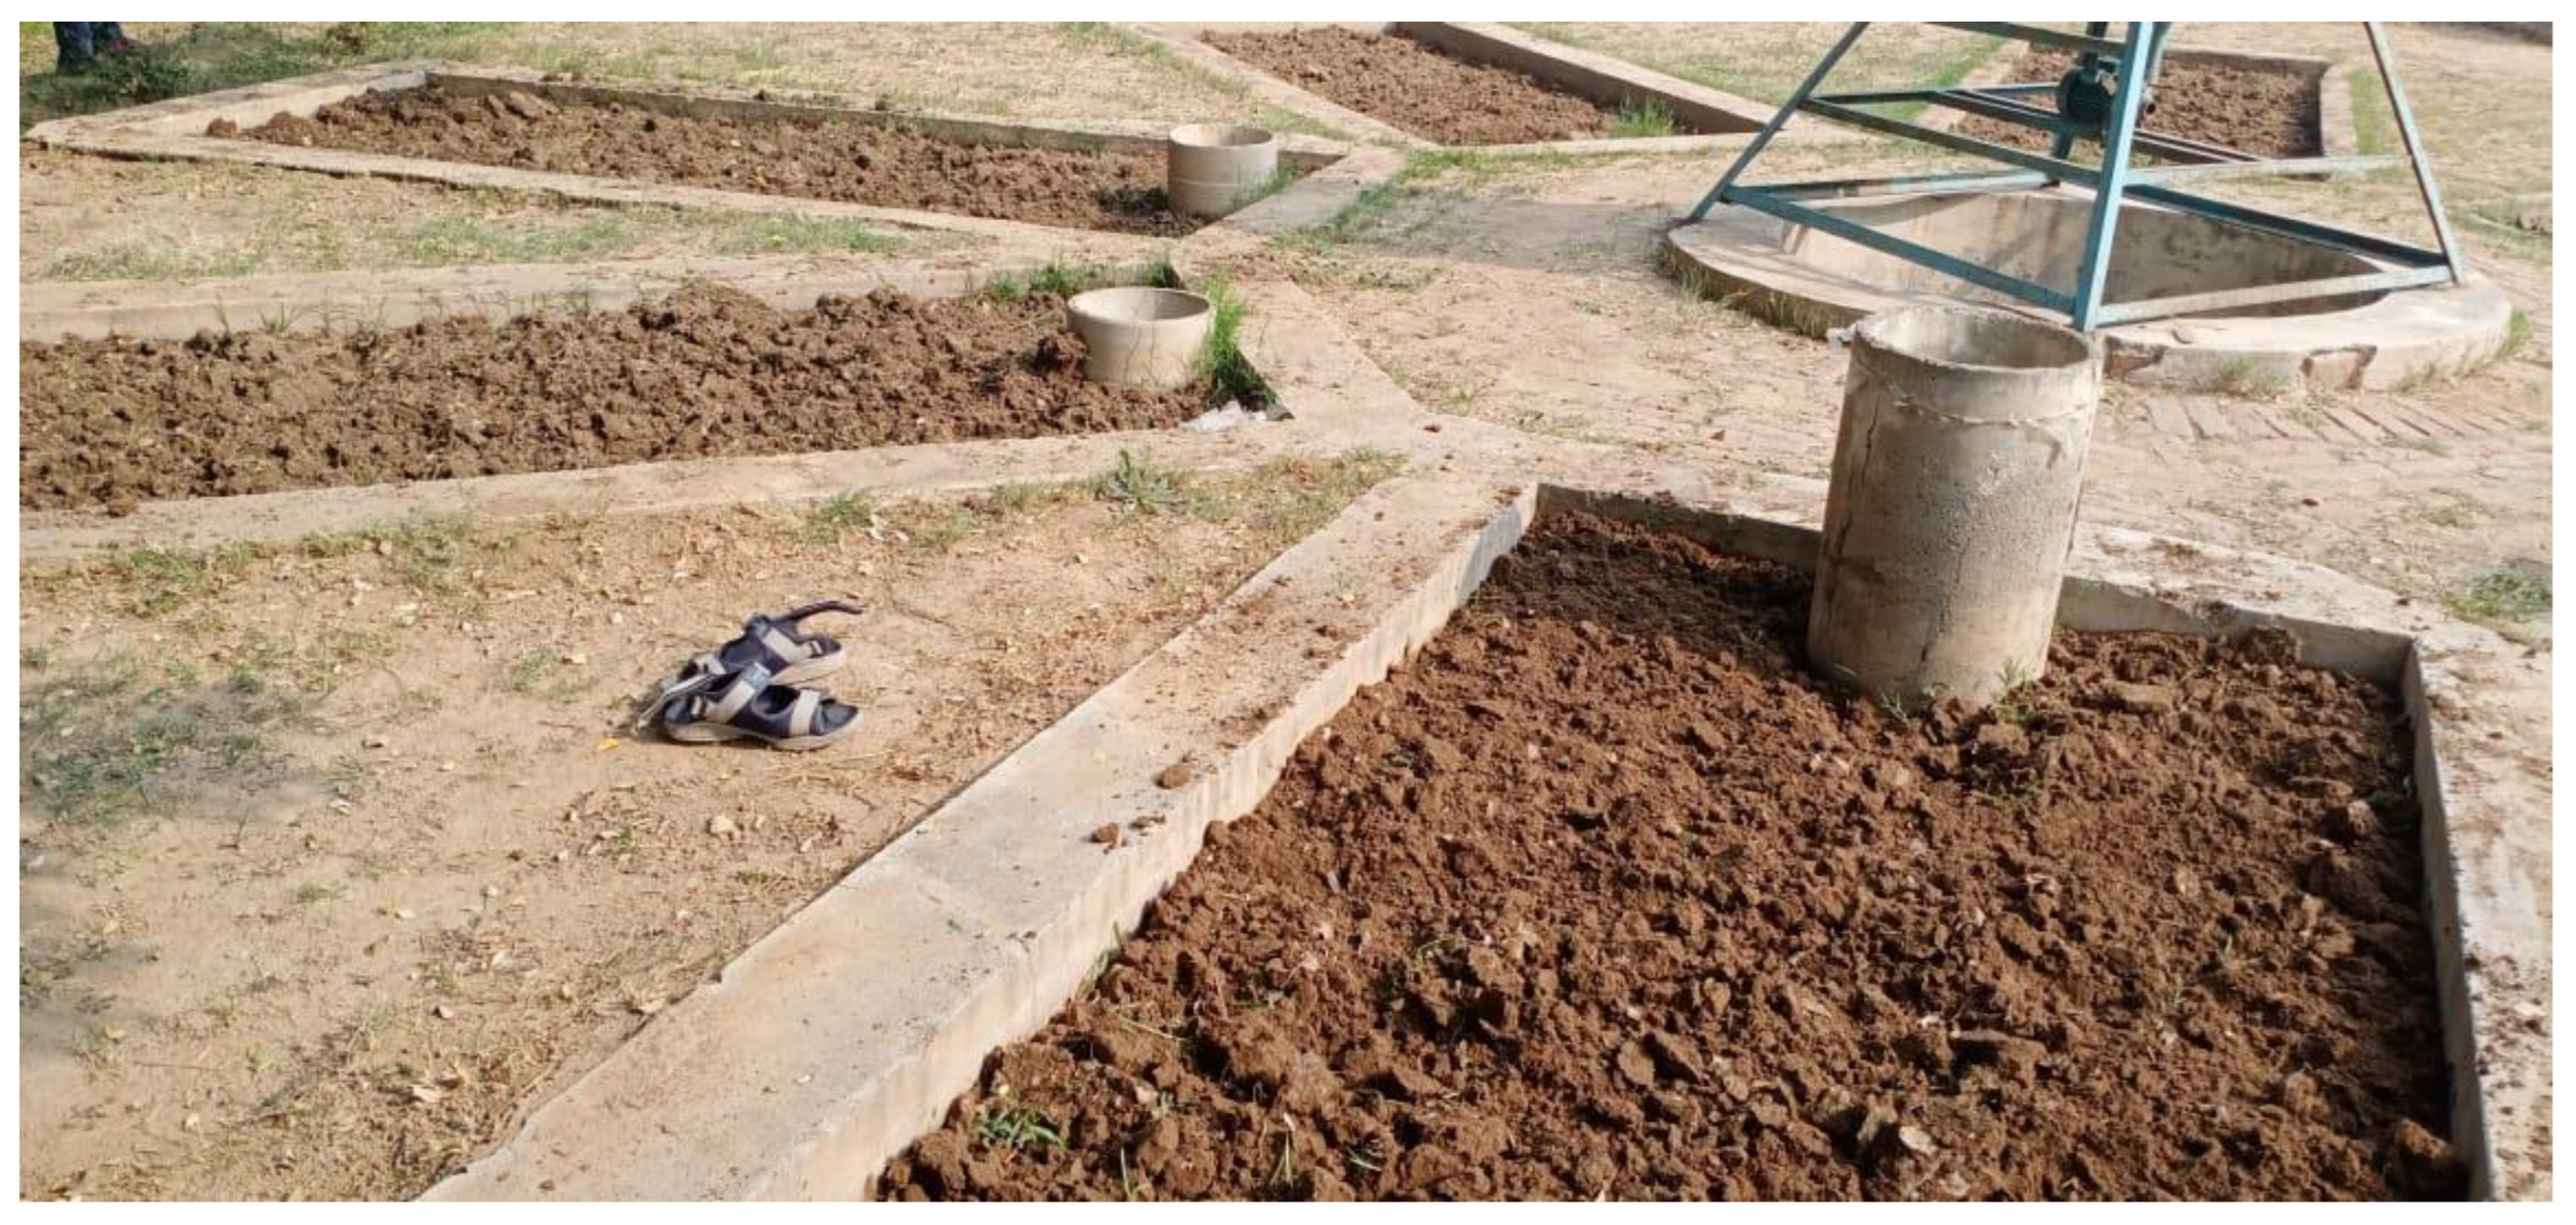
In the semi-arid climate of Faisalabad, experimental research was carried out to determine the water requirements and crop coefficients of wheat, oat, carrot, and maize. For this study, experimental trials were cultivated in the experimental site of the faculty of Agricultural Engineering and Technology of the University of Agriculture, Faisalabad. This study was carried out at an experimental site with 12 lysimeters. The First 4 Lysimeters are in a rectangular geometry as shown in
Figure 1 and the other Eight Lysimeters are in a circular geometry as shown in
Figure 2.
2.2. Data Collection and Analysis
Irrigation Scheduling
Sandy loam was the soil in each site examined with the lysimeters. Sandy loam soil has a field capacity of 22% and a permanent wilting point of 8%. At 50% depletion of soil moisture, each crop is irrigated. In order to re-establish the field capacity, irrigation was applied when the soil moisture levels fell below 15%. Soil moisture sensors detected when irrigation should be applied based on the amount of moisture present in the soil. As a result, irrigation was applied anytime the soil moisture percentage in each lysimeter approached 15%. For irrigation purposes, the depth of water needed to re-establish the field capacity is measured using the following formula:
in which
Flood irrigation has a 30 to 40% efficiency rate, but our field was levelled and tiny; therefore, we supposed that water was applied at a 70 percent efficiency rate. As a result, the actual depth required to reach field capacity was once again an important factor:
In order to determine how long it will take to irrigate a certain area, one simply needs to know the discharge area of a lysimeter and the depth of that area:
T = time required for irrigation
A = area of the lysimeter
d = depth required
Q = discharge of the pump
As a result, the amount of time it takes to re-establish a soil’s field capacity (FC) is obtained with the above equation.
ETo is critical to determine crop coefficients and water requirements. The ETo value for each month or each day might vary based on a variety of factors, including weather, time of the day, and wind velocity. It was from the UAF meteorological observatory that evapotranspiration data by month were collected from 2013 to 2021. As a result, an average of 8 years’ worth of ETo data were utilized to estimate the crop water needs and crop coefficients. The amount of water a crop needs from seeding to harvest is known as the crop water requirement. This water is required by crops at several stages of growth, including planting, maturation, and flowering. It is possible to estimate the amount of water a crop will require by summing all the amounts of irrigation water used to reach the soil capacity and the actual rainfall:
Thus, by the above relation, we calculated the water requirement of each crop sown in the experiment, i.e., wheat, oat, carrot and, maize. The crop coefficient Kc can be calculated by a simple relation between ETc and ETo. The calculation of the crop coefficient is based on the Penman–Monteith Equation:
By using the above relation between ETc and ETo, the Kc for wheat, oat, carrot, and maize were calculated.
3. Results and Discussion
The crop water requirements and crop coefficients for the years 2021–2022 of wheat, carrot, oat, and maize growing in Faisalabad’s semi-arid climate were analyzed using Lysimeters.
3.1. Soil Characterictics
The movement of soil along the water’s surface is determined by the soil’s physical properties. Infiltration rate, field capacity, permanent wilting point, bulk density, and water holding capacity of the soil were considered.
3.2. Soil Bulk Density
In terms of physical properties, bulk density refers to the soil’s composition, the number of pores, and how much organic matter is present. The bulk density of the treated plots was computed using ASAE Norm S269.4, and the results were analyzed. We found that the bulk density ranged between 1.52 and 1.60 g/cm3.
3.3. Soil Infiltration Rate
Before the analysis, the soil penetration intensity was determined at the testing site in September 2021. If runoff is to be avoided, the irrigation rate must be less than or equal to the infiltration rate. The infiltration rates ranged from 0.70 to 0.83 cm/h. Soil infiltration has a direct effect on the movement of water in the soil. A decrease in soil porosity was seen as a result of clay particle dispersion and growth in irrigation water containing high concentrations of Na ions, both of which were caused by irrigation water of low quality.
3.4. Effect of the Climate on ETo
The temperature is increasing throughout the study region, especially in the northern parts of the country. Pakistan has an agrarian economy, and climate change and the consequent threat of global warming have become a great challenge. The principal weather parameters affecting evapotranspiration are radiation, air temperature, humidity, and wind speed. In a warming climate, increased evapotranspiration may shift the fraction of precipitation that runs off as surface water or infiltrates the subsurface as recharge.
3.5. Determination of Effective Rainfall
The amount of rainfall water that is accessible for use by plants is referred to as “effective rainfall.” Results regarding the effective rainfall have been presented in
Table 1. The formulas provided by FAO were used to determine this value:
3.6. Water Requirement and Kc of the Wheat Variety Fakhre Bhakkar
Wheat was sown on 1 December 2021 and harvested on 28 April 2022. The water required by wheat during this season was 361.8 mm as the same results achieved by [
6]. The Kc value for the wheat variety Fakhre Bhakkar varied from 0.79 to 1.19 during the whole crop season. Results regarding the crop coefficients of the wheat variety Fakhare Bhakhar is shown in
Figure 3.
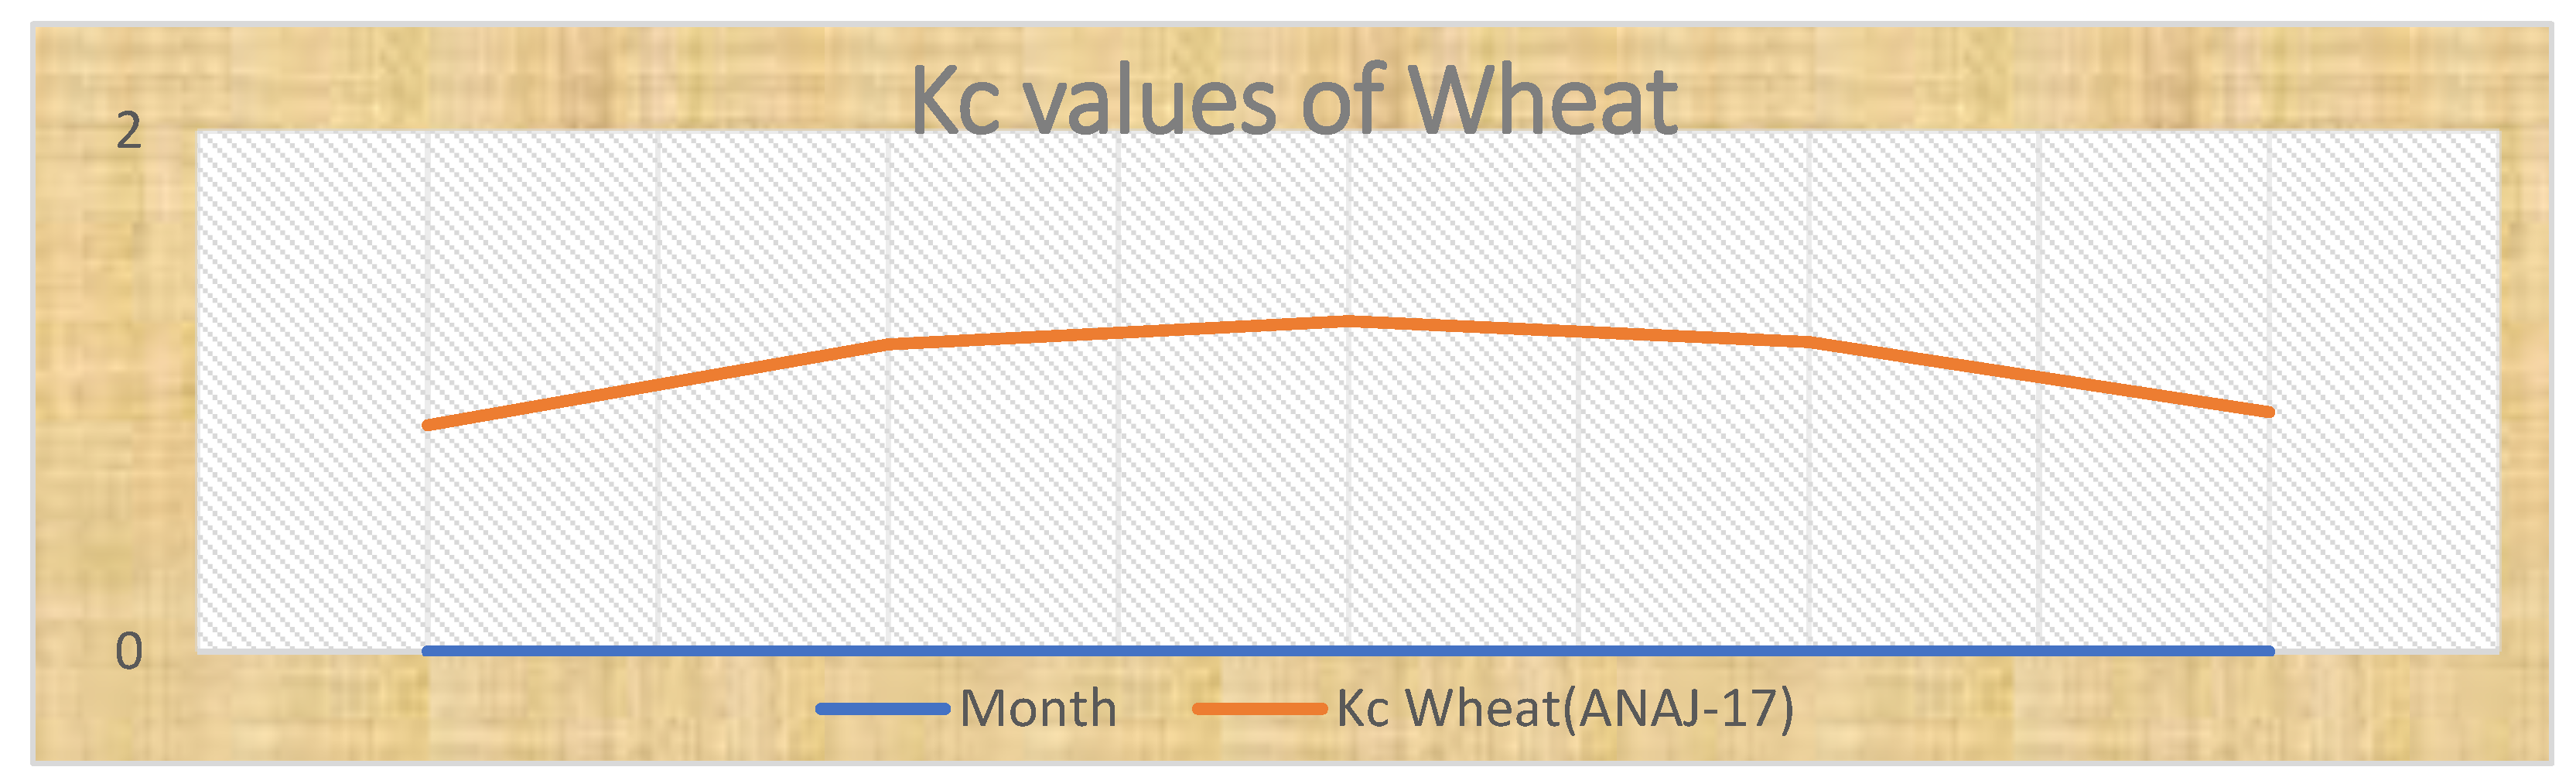
3.7. Water Requirement and Kc of the Wheat Variety Anaj-17
Wheat was sown on 1 December 2021 and harvested on 28 April 2022. The water required by wheat during this season was 379.5 mm, and its Kc value was between 0.87 and 1.27 as the results match to this research [
7,
8]. Results regarding the crop coefficients of the wheat variety Anaj-17 is shown in
Figure 4.
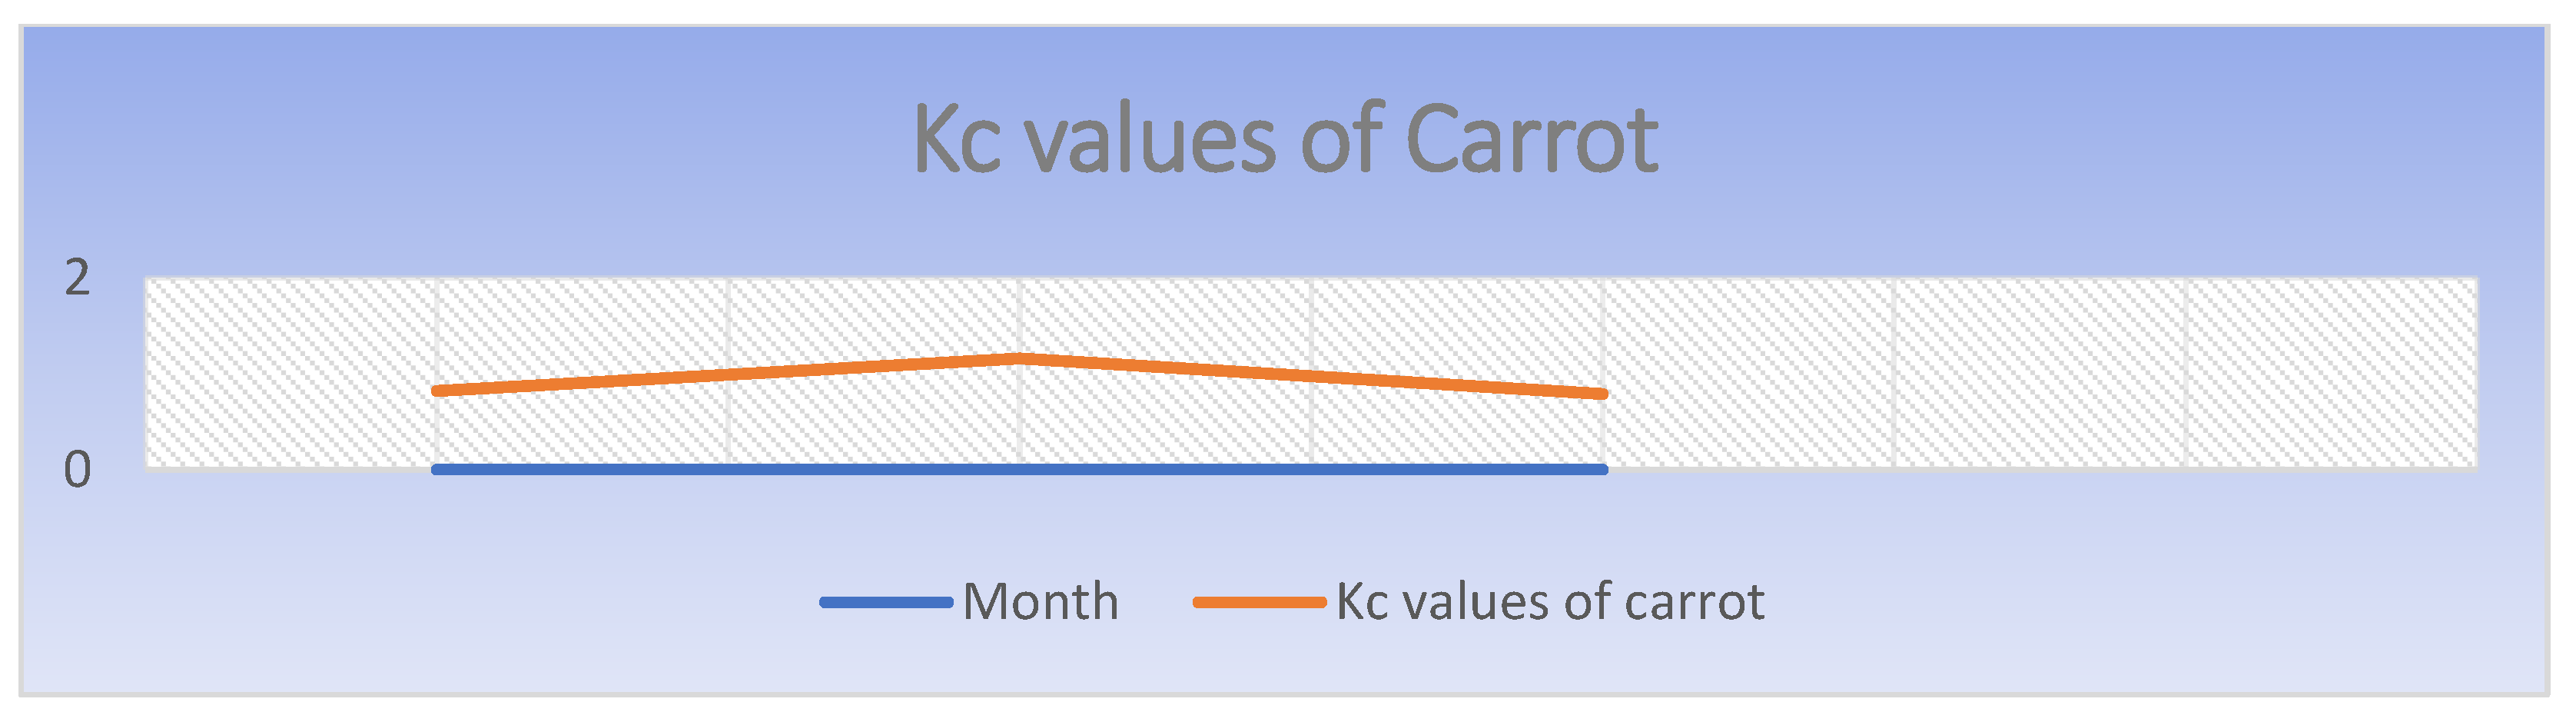
3.8. Water Requirement and Kc of Carrot
Carrot was sown on 1 December 2021 and harvested on 20 February 2022. The water required by carrot during this season was 94.41 mm, and the Kc value was between 0.79 and 1.16. Results regarding the crop coefficients of carrot is shown in
Figure 5.
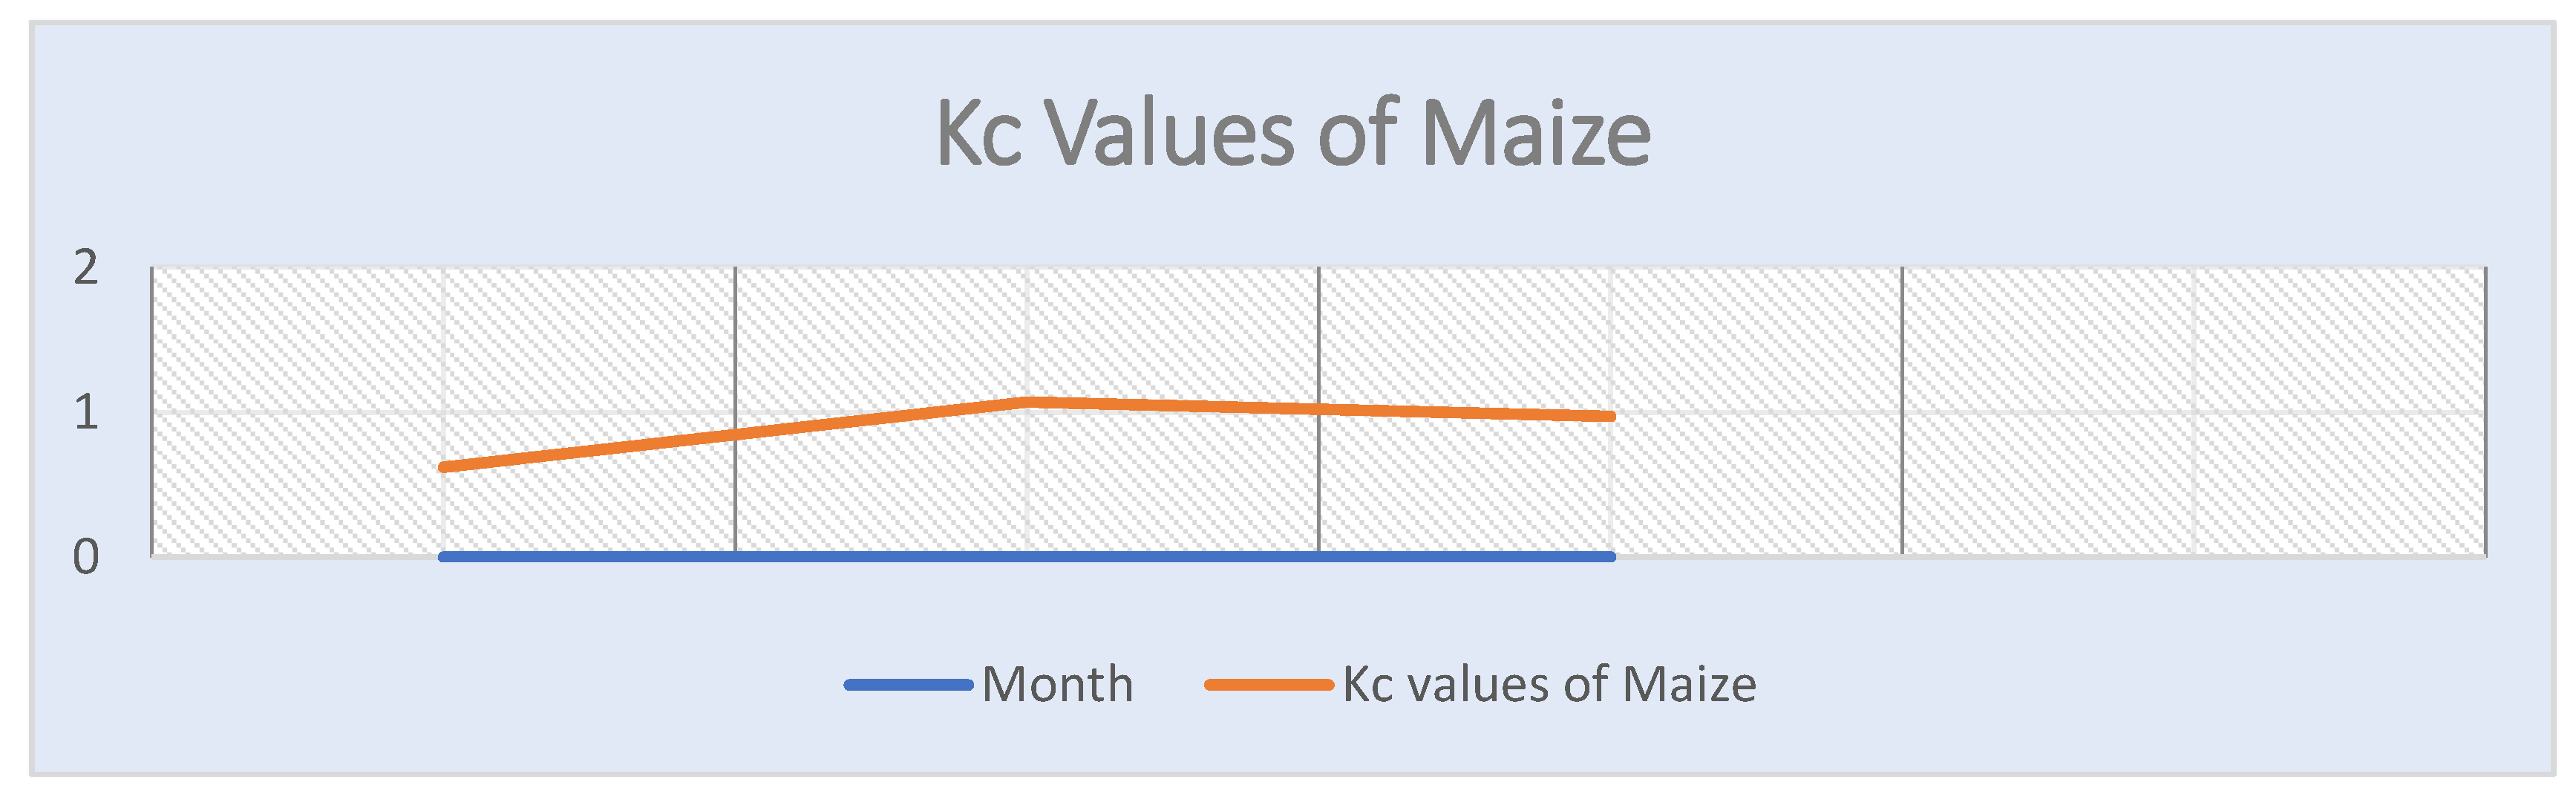
3.9. Water Requirement and Kc of Maize
Maize was sown on 1 March 2022 and harvested on 15 July 2022. The water required by maize during this season was 403.07 mm, and the Kc value was between 0.62 and 1.09. as the conclusion and results were helped out form this research [
9,
10,
11]. Results regarding the crop coefficients of Maize is shown in
Figure 6.
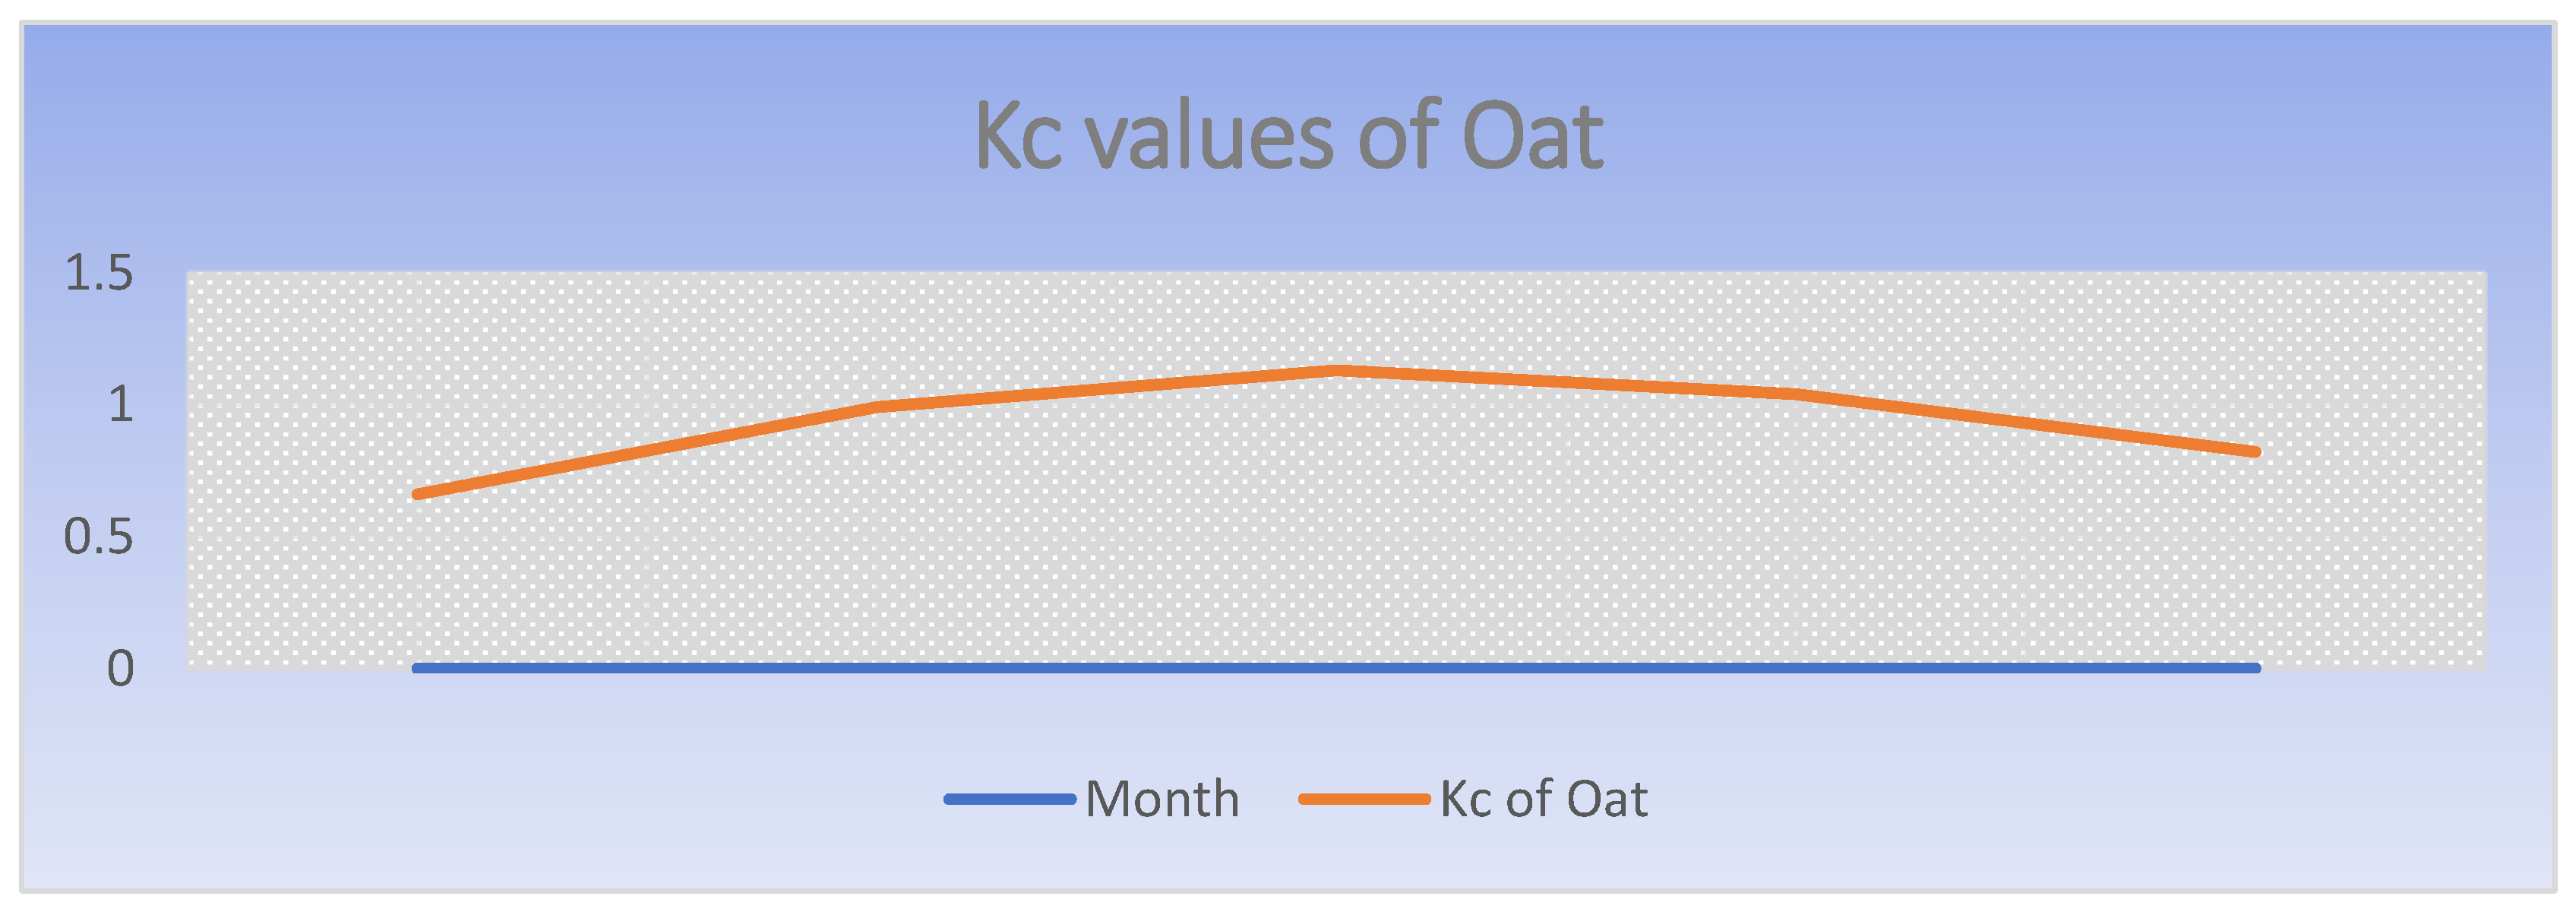
3.10. Water Requirement and Kc of Oat
Oat was sown on 1 December 2021 and harvested three times, as it germinated again after each harvest. The last harvest was carried out on 28 April 2022. The water required by oat during this season was 331.89 mm, and the value of Kc was between 0.66 and 1.13. As the results are same from this level of research my results are most relative to that research [
12,
13,
14]. Results regarding the crop coefficients of Oat is shown in
Figure 7.
4. Conclusions
In this study, we determined that the water needs of the wheat varieties Fakhre Bhakhar and Anaj-17 were 361.81 mm and 379.5 mm, respectively. The crop coefficients (Kc) of the Fakhre Bhakhar variety were between 0.79 and 1.19. The crop coefficient (Kc) of the Anaj-17 variety was between 0.87 and 1.27. These values are in the range of Kc values (0.2–1.5) suggested by FAO. The yields from these two experiments were different, nevertheless. The Anaj-17 output was larger than that of Fakhre Bhakhar, using similar farming techniques. The Anaj-17 yield was 491 g per m2 and was greater than the Fakhre Bhakhar yield, which was 491 g per m2. The water required by carrot was 94.41 mm, and its crop coefficient resulted to be between 0.79 and 1.16. The water demand of the maize hybrid variety examined was found to be 403.07 mm, and its crop coefficient was between 0.62 and 1.07. The water required by oat throughout its growing season was 331.89 mm, and its crop coefficient was between 0.66 and 1.13, values that are in the range of Kc values (0.9–0.85) recommended by FAO.
Author Contributions
Conceptualization, F.H. and M.A.S.; Introduction, S.A., M.S.I.Z. and M.A.S.; materials and methods, F.H. and M.D.M.; data collection; F.H.; results and discussions, F.H., M.A.S. and M.D.M.; conclusions and recommendations, S.A. and M.A.S.; writing original draft preparation, F.H.; editing, F.H. and M.D.M. All authors have read and agreed to the published version of the manuscript.
Funding
This research received funding from Agricultural Remote sensing Lab University of Agriculture Faisalabad, 38000.
Institutional Review Board Statement
Not applicable.
Informed Consent Statement
Not applicable.
Data Availability Statement
Not applicable.
Conflicts of Interest
The authors declare no conflict of interests.
References
- Shahrokhnia, M.H.; Sepaskhah, A.R. Single and dual crop coefficients and crop evapotranspiration for wheat and maize in a semi-arid region. Theor. Appl. Climatol. 2013, 114, 495–510. [Google Scholar] [CrossRef]
- Beshir, S. Review on estimation of crop water requirement, irrigation frequency and water use efficiency of cabbage production. J. Geosci. Environ. Prot. 2017, 5, 59. [Google Scholar] [CrossRef]
- D’Urso, G.; Calera Belmonte, A. Operative approaches to determine crop water requirements from Earth Observation data: Methodologies and applications. AIP Conf. Proc. 2006, 14, 852. [Google Scholar]
- Allen, R.G.; Pereira, L.S.; Raes, D.; Smith, M. Crop Evapotranspiration Guidelines for Computing Crop Water Requirements; Food and Agriculture Organization of the United Nations: Rome, Italy, 1998. [Google Scholar]
- Liu, X.; Xu, C.; Zhong, X.; Li, Y.; Yuan, X.; Cao, J. Comparison of 16 models for reference crop evapotranspiration against weighing lysimeter measurement. Agric. Water Manag. 2017, 184, 145–155. [Google Scholar] [CrossRef]
- Mahmoud, M.; El-Bably, A. Crop water requirements and irrigation efficiencies in Egypt. In Conventional Water Resources and Agriculture in Egypt; Springer: Cham, Switzerland, 2017; pp. 471–487. [Google Scholar]
- Abid, S. Forecasting wheat production using time series models in Pakistan. Asian J. Agric. Rural. Dev. 2019, 8, 172–177. [Google Scholar]
- Mehta, R.; Pandey, V. Crop water requirement (ETc) of different crops of middle Gujarat. J. Agrometeorol. 2016, 18, 83–87. [Google Scholar] [CrossRef]
- Abideen, Z.U. Comparison of Crop Water Requirements of Maize Varieties Under Irrigated Condition in Semi-Arid Environment. J. Environ. Earth Sci. 2014, 4, 2224–2226. [Google Scholar]
- Anapalli, S.S.; Ahuja, L.R.; Gowda, P.H.; Ma, L.; Marek, G.; Evett, S.R.; Howell, T.A. Simulation of crop evapotranspiration and crop coefficients with data in weighing lysimeters. Agric. Water Manag. 2016, 177, 274–283. [Google Scholar] [CrossRef]
- Sun, H.; Zhang, X.; Liu, X.; Liu, X.; Shao, L.; Chen, S.; Wang, J.; Dong, X. Impact of different cropping systems and irrigation schedules on evapotranspiration, grain yield and groundwater level in the North China Plain. Agric. Water Manag. 2019, 211, 202–209. [Google Scholar] [CrossRef]
- Ali, M.H. Fundamentals of Irrigation and On-Farm Water Management; Springer: Heidelberg, Germany, 2010; Volume 1, pp. 453–487. [Google Scholar]
- Pereira, L.; Paredes, P.; Jovanovic, N. Soil water balance models for determining crop water and irrigation requirements and irrigation scheduling focusing on the FAO56 method and the dual Kc approach. Agric. Water Manag. 2020, 241, 106357. [Google Scholar] [CrossRef]
- da Silva, G.H. Biodegradable mulch of recycled paper reduces water consumption and crop coefficient of pak choi. Sci. Hortic. 2020, 267, 109315. [Google Scholar] [CrossRef]
| Disclaimer/Publisher’s Note: The statements, opinions and data contained in all publications are solely those of the individual author(s) and contributor(s) and not of MDPI and/or the editor(s). MDPI and/or the editor(s) disclaim responsibility for any injury to people or property resulting from any ideas, methods, instructions or products referred to in the content. |
© 2023 by the authors. Licensee MDPI, Basel, Switzerland. This article is an open access article distributed under the terms and conditions of the Creative Commons Attribution (CC BY) license (https://creativecommons.org/licenses/by/4.0/).


