Proceeding Paper

Determination of the Impact of Urbanization in Istanbul Northern Forests by Remote Sensing †

by
Büşra Sarıbaş
1,* and
Filiz Bektaş Balçık
2
1
Institute of Informatics, Istanbul Technical University, Istanbul 34469, Turkey
2
Geomatics Engineering Department, Civil Engineering Faculty, Istanbul Technical University, Istanbul 34469, Turkey
*
Author to whom correspondence should be addressed.
Presented at the 3rd International Electronic Conference on Forests—Exploring New Discoveries and New Directions in Forests, 15–31 October 2022; Available online: https://iecf2022.sciforum.net/.
Environ. Sci. Proc. 2022, 22(1), 57; https://doi.org/10.3390/IECF2022-13059
Published: 15 October 2022

Abstract

:
Urban forests provide many benefits for the city’s resilience to climate change by improving the degree of shading, evaporative cooling, rainwater interception, and storage and filtration functions. With the increasing population and unplanned urbanization, the Northern Forests, which play a major role in Istanbul, are being destroyed over time. In this study, forest area changes were determined by using object-based classification and landscape metrics. Landsat TM and Landsat OLI and TIRS images dated from 2009 and 2019 were used to detect the forest area changes in the selected area. Selected landscape metrics such as the aggregation index, edge density, the largest patch index, and patch density were calculated from the classification results to understand the devastation of urbanization in forest areas. According to the results, forest areas decreased from 318.2 km2 to 292.1 km2, and were fragmented from whole and large pieces to smaller pieces.

1. Introduction

Especially in large metropolitan areas, the increase in land uses such as trade, industry, residence, recreation, and tourism, and the increasingly widespread use of transport networks connecting these land uses, cause distortion, fragmentation, and changing of habitats. The results of this rapid urbanization can sometimes reach an irreversible depletion of natural resources [1]. A substantial decrease in global forest area from unprecedented human disturbance causes a huge loss of biodiversity [2].
Land use and land cover patterns are considered to have an important contribution to make to ecosystem functioning [3]. Land use and land cover patches may have various spatial arrangements such as size, shape, and connectivity in urban settings. Studying the relationship between urbanization and landscape patterns using remotely sensed data can provide support for urban ecological management [4]. Remotely sensed data, such as Landsat, have been explored extensively for land cover mapping because the data are freely available and contain a broad range of suitable spectral bands [5].
The increasing population density of Istanbul is pushing urbanization toward the northern regions. The Northern Marmara Highway, the construction of which started in Istanbul in 2012 and was completed in 2016, has led to the destruction of northern forests. In this study, the effect of urbanization on northern forests was examined. Landsat satellite images dated from 2009 and 2019 were classified with object-based classification. Landscape metrics were calculated from the classification results and the effect of urbanization on forest areas was calculated numerically.

2. Materials and Methods

In developing countries, big cities are exposed to a dynamic urbanization process due to population growth and migration. Depending on the acceleration of the urbanization process, the settlement components that are constantly built cause significant changes in natural areas. These changes generally have a negative impact on the ecosystem. Therefore, regular monitoring of LULC changes due to urbanization and determination of the current situation is important [6].

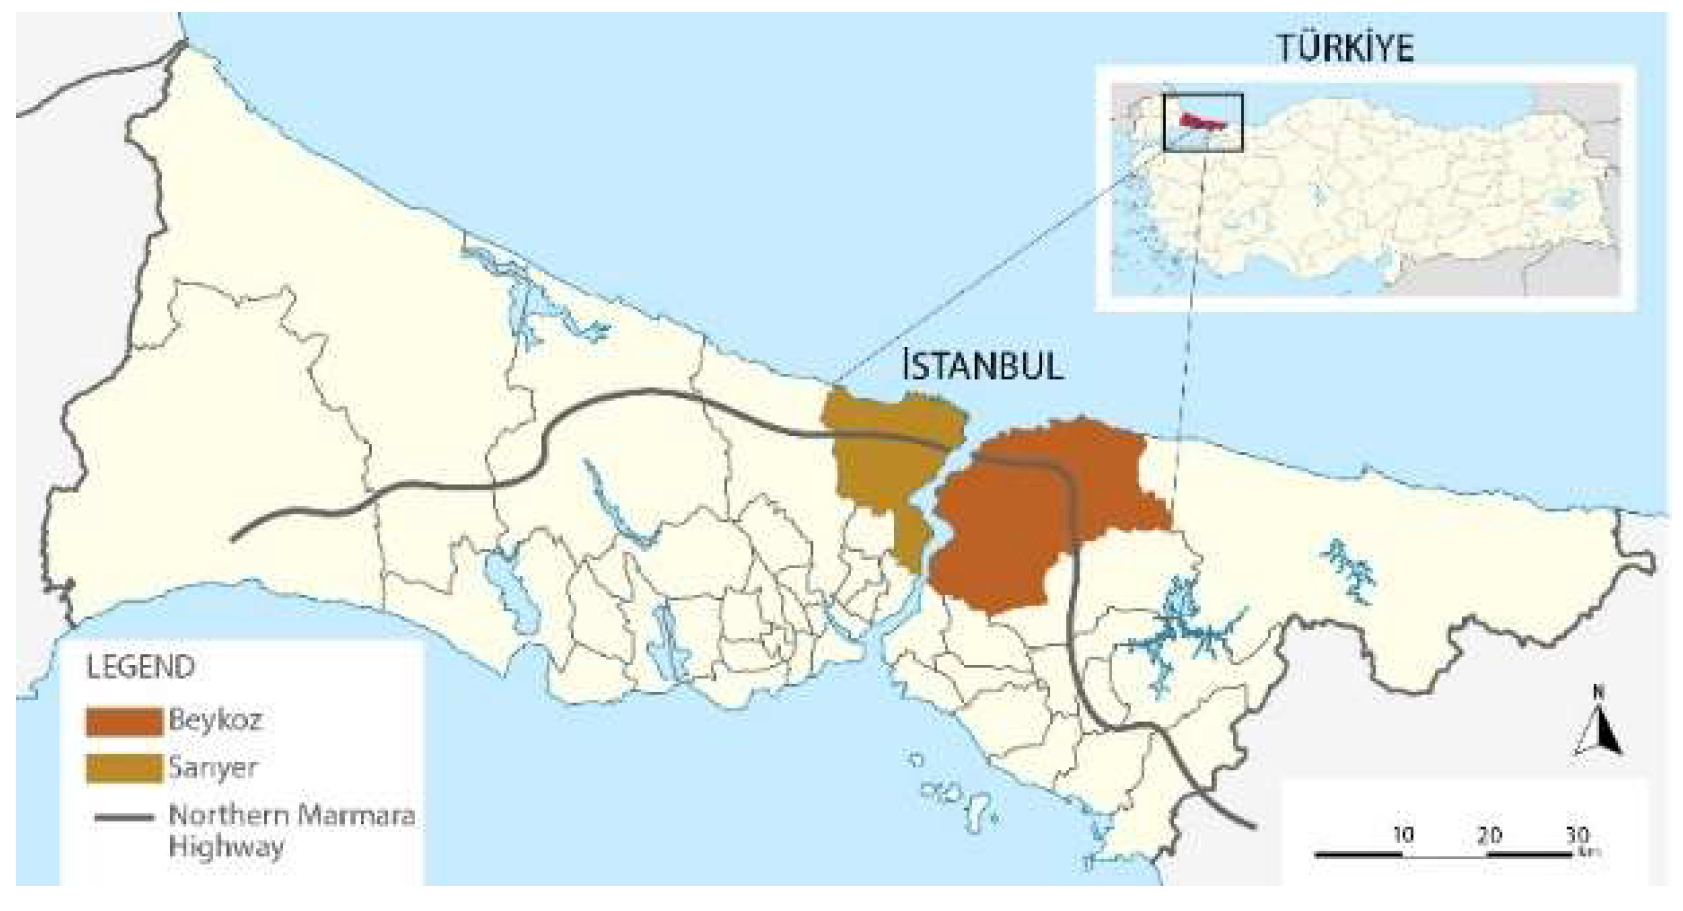
2.1. Study Area and Data

In this study, two selected districts (Sarıyer and Beykoz) of İstanbul, Turkey, were selected as the study area. Sarıyer and Beykoz districts are located on the transition route of the Northern Marmara Highway. Sarıyer and Beykoz, the study area, are districts of the province of Istanbul. The study area is situated at the intersection of the Bosphorus and Black Sea. The study area is shown in Figure 1. Its northern part exhibits a more rural structure, whereas its southern part exhibits an urbanized structure. The natural beauty of the countryside is a magnet for people fed up with the city environment. Therefore, it is a preferred region in the sense of both recreational and settlement area. This very versatile structure of the study area has contributed to its selection in order to make a change analysis.
Land cover data for selected study area were derived from 2009 and 2019 dated Landsat TM and Landsat OLI sensors.

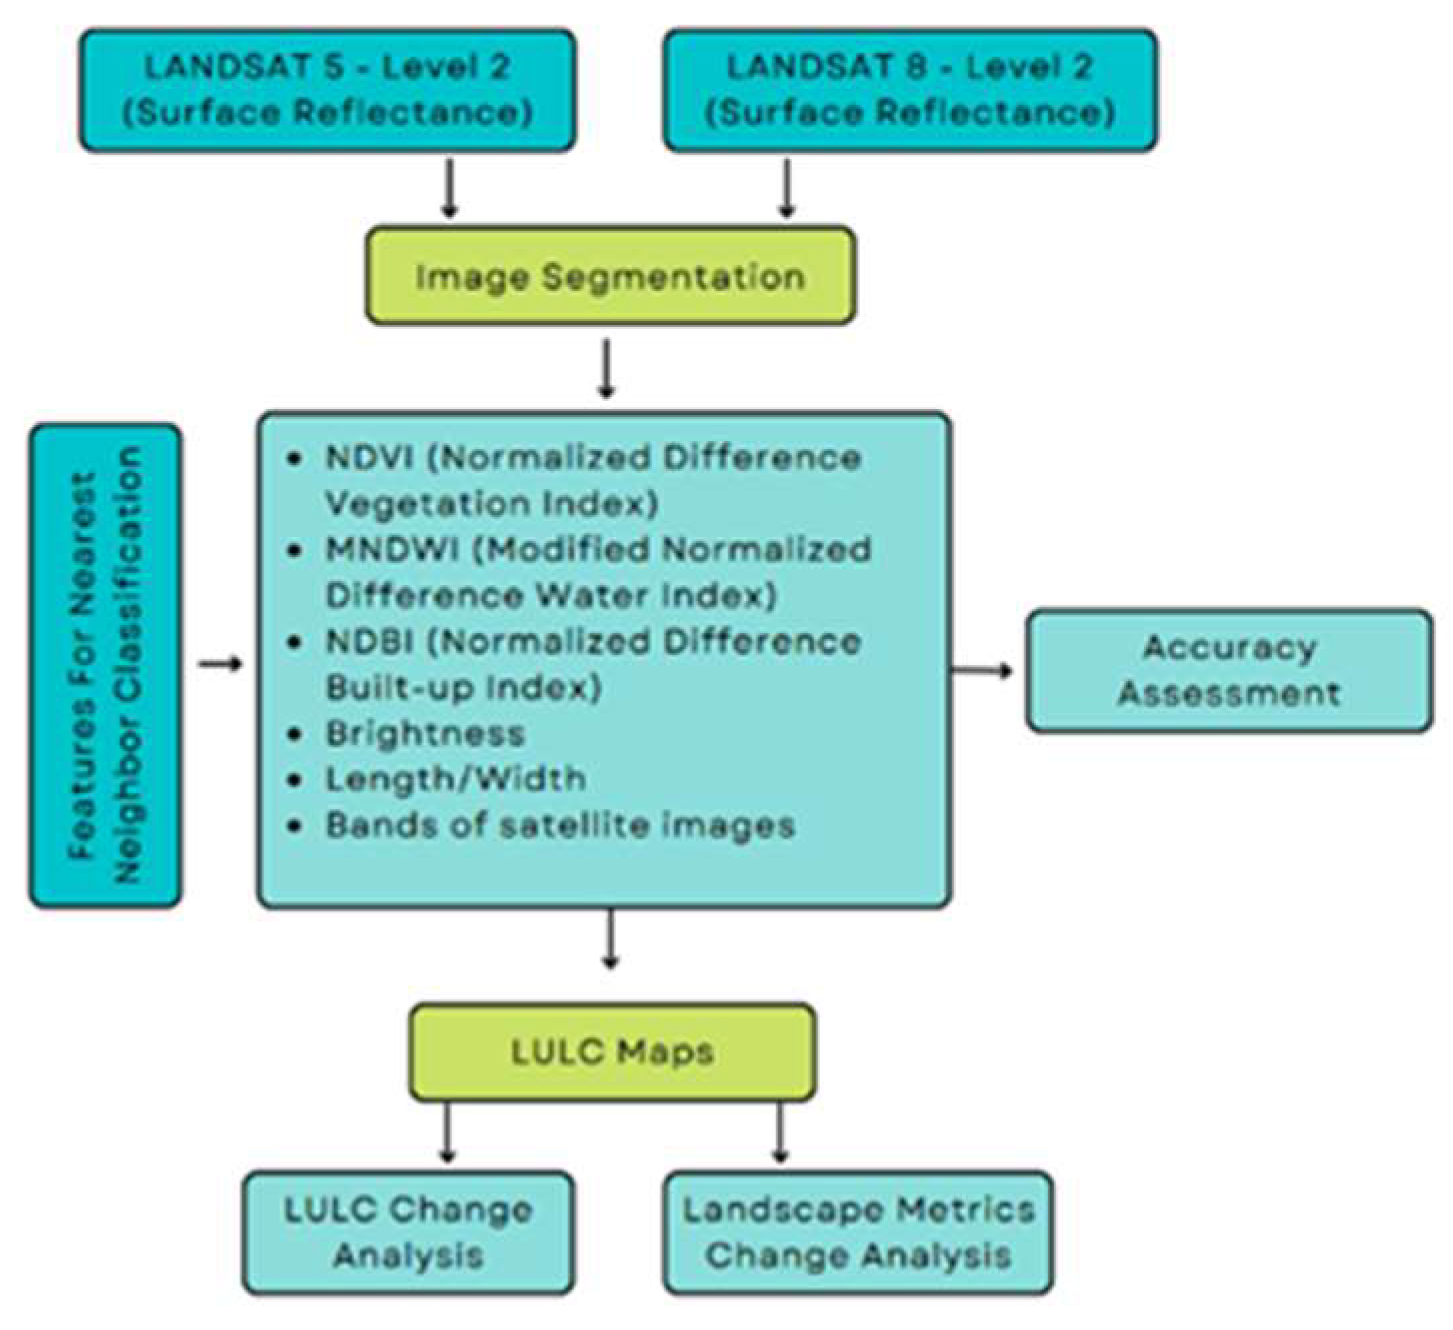
2.2. Object-Based Image Classification

Object-based classification is a classification method that incorporates spectral, shape, textural, dimensional, and contextual information in high-resolution images into the classification process. The flow chart of the study is shown in Figure 2. The method generally consists of image segmentation and classification. In this method, firstly, similar pixels are grouped depending on the condition of meeting a certain homogeneity criterion, and image objects to be used in the classification process are created. This stage is the segmentation stage of the method. After the segmentation process, rule sets for classification are created to extract the desired details from the image. According to these created rule sets, homogeneous object groups are assigned to classes [7]. The segmentation values determined for the study area are shown in Table 1.
For object-based classification, the nearest neighbor method was used. For “NN” classification, visible bands, near and mid-infrared bands, brightness, length/width, NDVI, MNDVI, and NDBI features were used. Selected features are shown in Table 2. The satellite images were classified into six types of land cover/land use: agricultural areas, urban areas, water areas, forest areas, barren areas, and roads.

2.3. Accuracy Assessment

An assessment of the accuracy of land cover classification from satellite imagery is necessary to ensure that the land cover classes identified reflect the actual land cover classes on the ground. The reliability of subsequent analyses (i.e., the size of individual land cover classes, change analysis, and the landscape metric) depends on the degree of accuracy of the identified land cover classes [8].
We selected 500 sampling points within the study area from the Landsat imagery using a stratified random sampling approach, with the strata being the classified land cover types from the imagery. These sample points were then converted into a KML file to be opened on Google Earth. The land cover type at each sample location was identified from the Google Earth imagery and recorded manually. The overall image classification accuracy was computed using the error matrix analysis approach.

2.4. Landscape Metrics

Landscape metrics calculate landscape composition and landscape configuration, which are defined as attributes of the landscape [9]. The purpose of classifying the landscape structure as units and examining it with metrics is to examine the composition and configuration character of the landscape structure and present the change in measurable numerical data [10]. More than one metric is needed to define the landscape pattern. The metric group should describe the pattern variety seen throughout the landscape but should be minimized in use, especially in indexes that are highly related to each other [11]. In this study, the patch density (PD), largest patch index (LPI), edge density (ED), and aggregation index (AI) were used to quantify the landscape pattern of the region and to analyze the changes in the landscape pattern of the study area based on the relevance of previous studies.
Patch density (PD), which describes the fragmentation of the landscape; edge density (ED), which equals the sum of all edges of class in relation to the landscape area; largest patch index (LPI), which is the simple measure of dominance; and aggregation index (AI), which is the dispersion and interspersion metric. The selected landscape metrics are explained in Table 3.

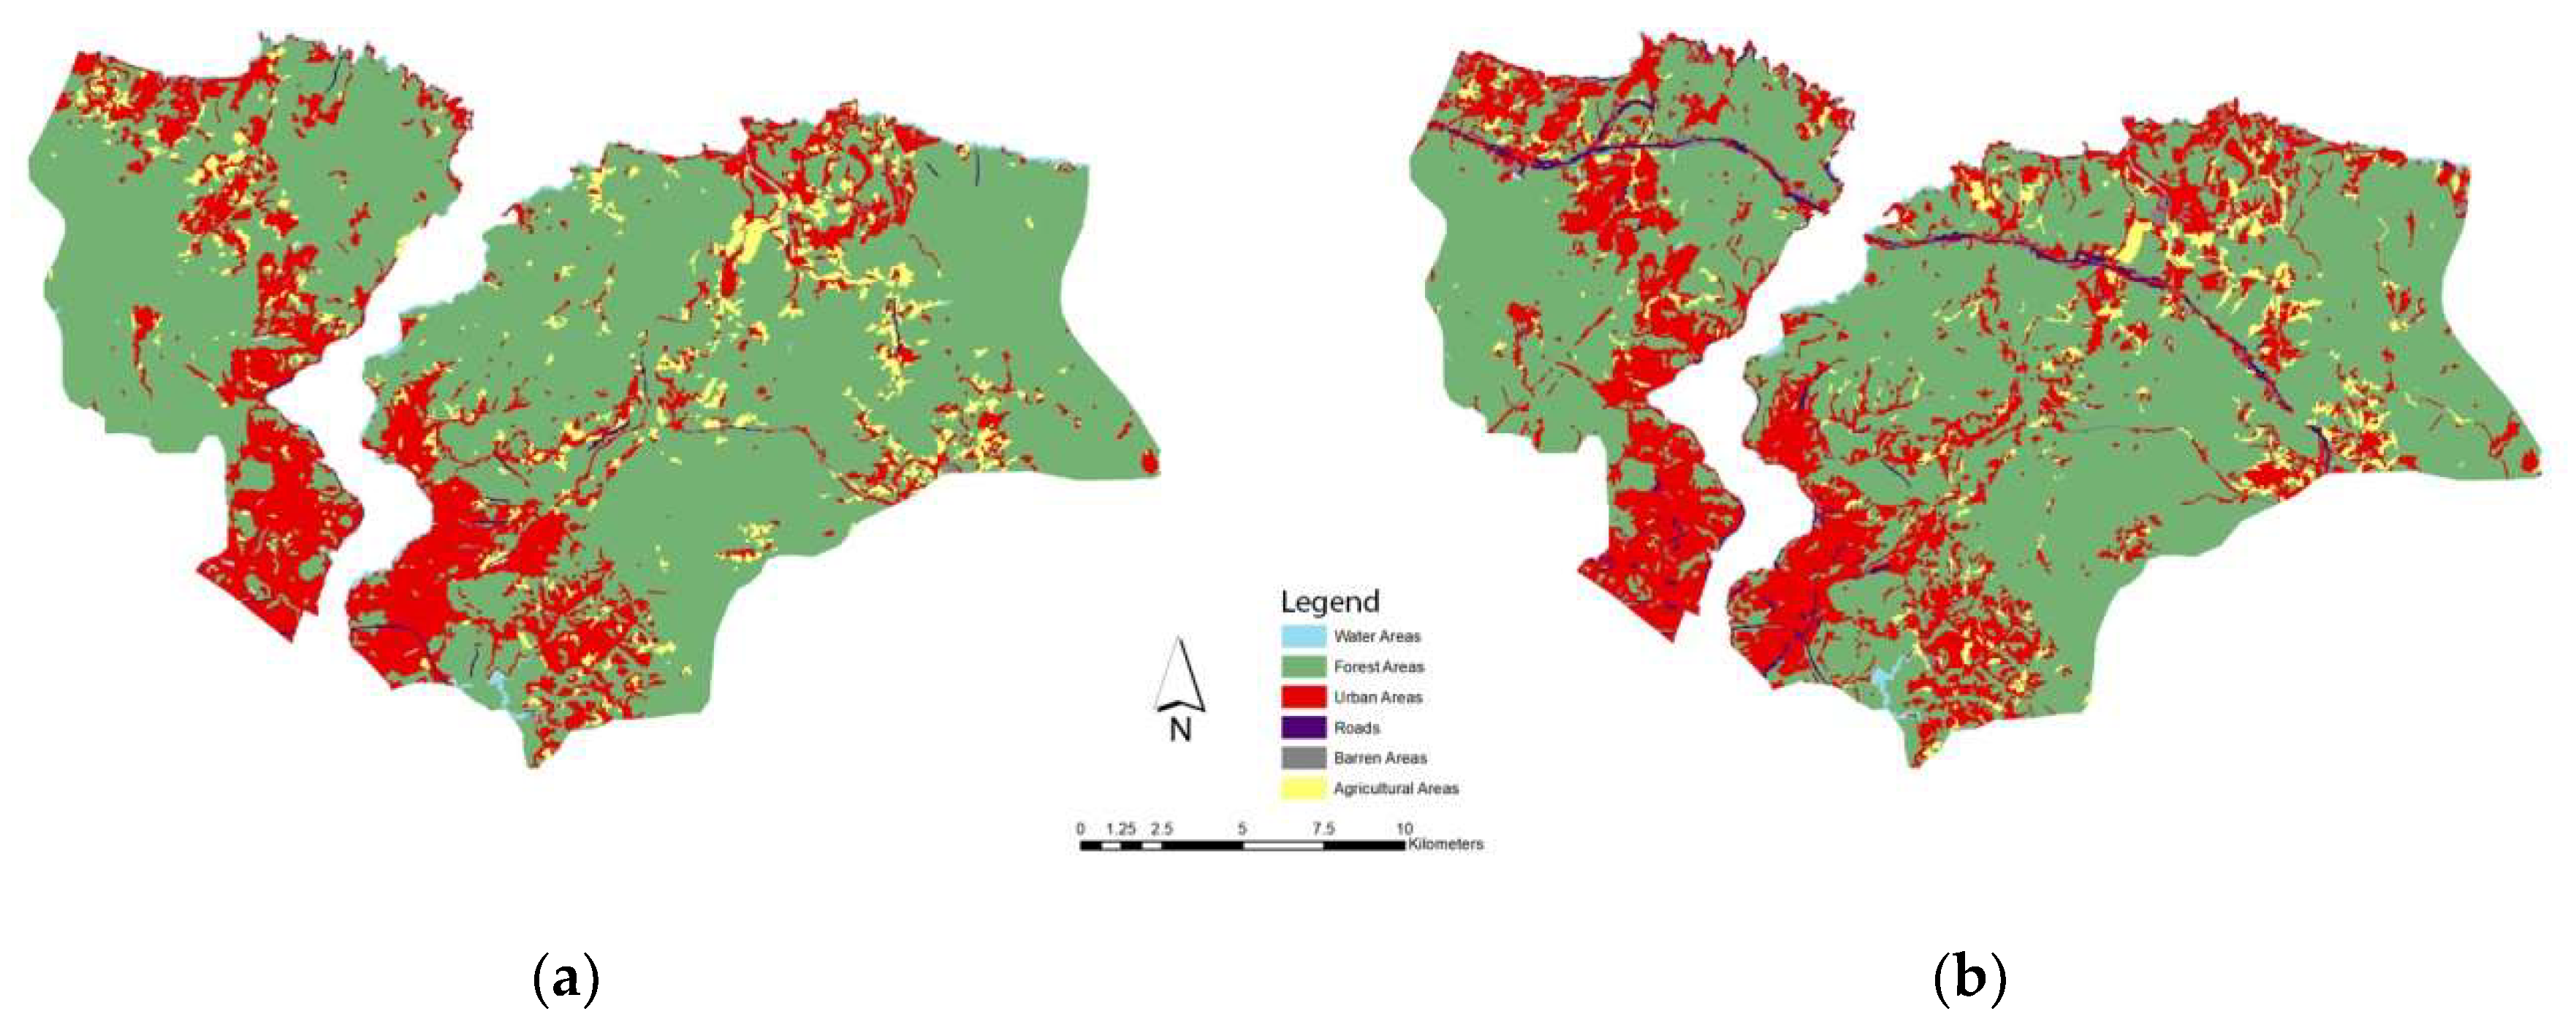
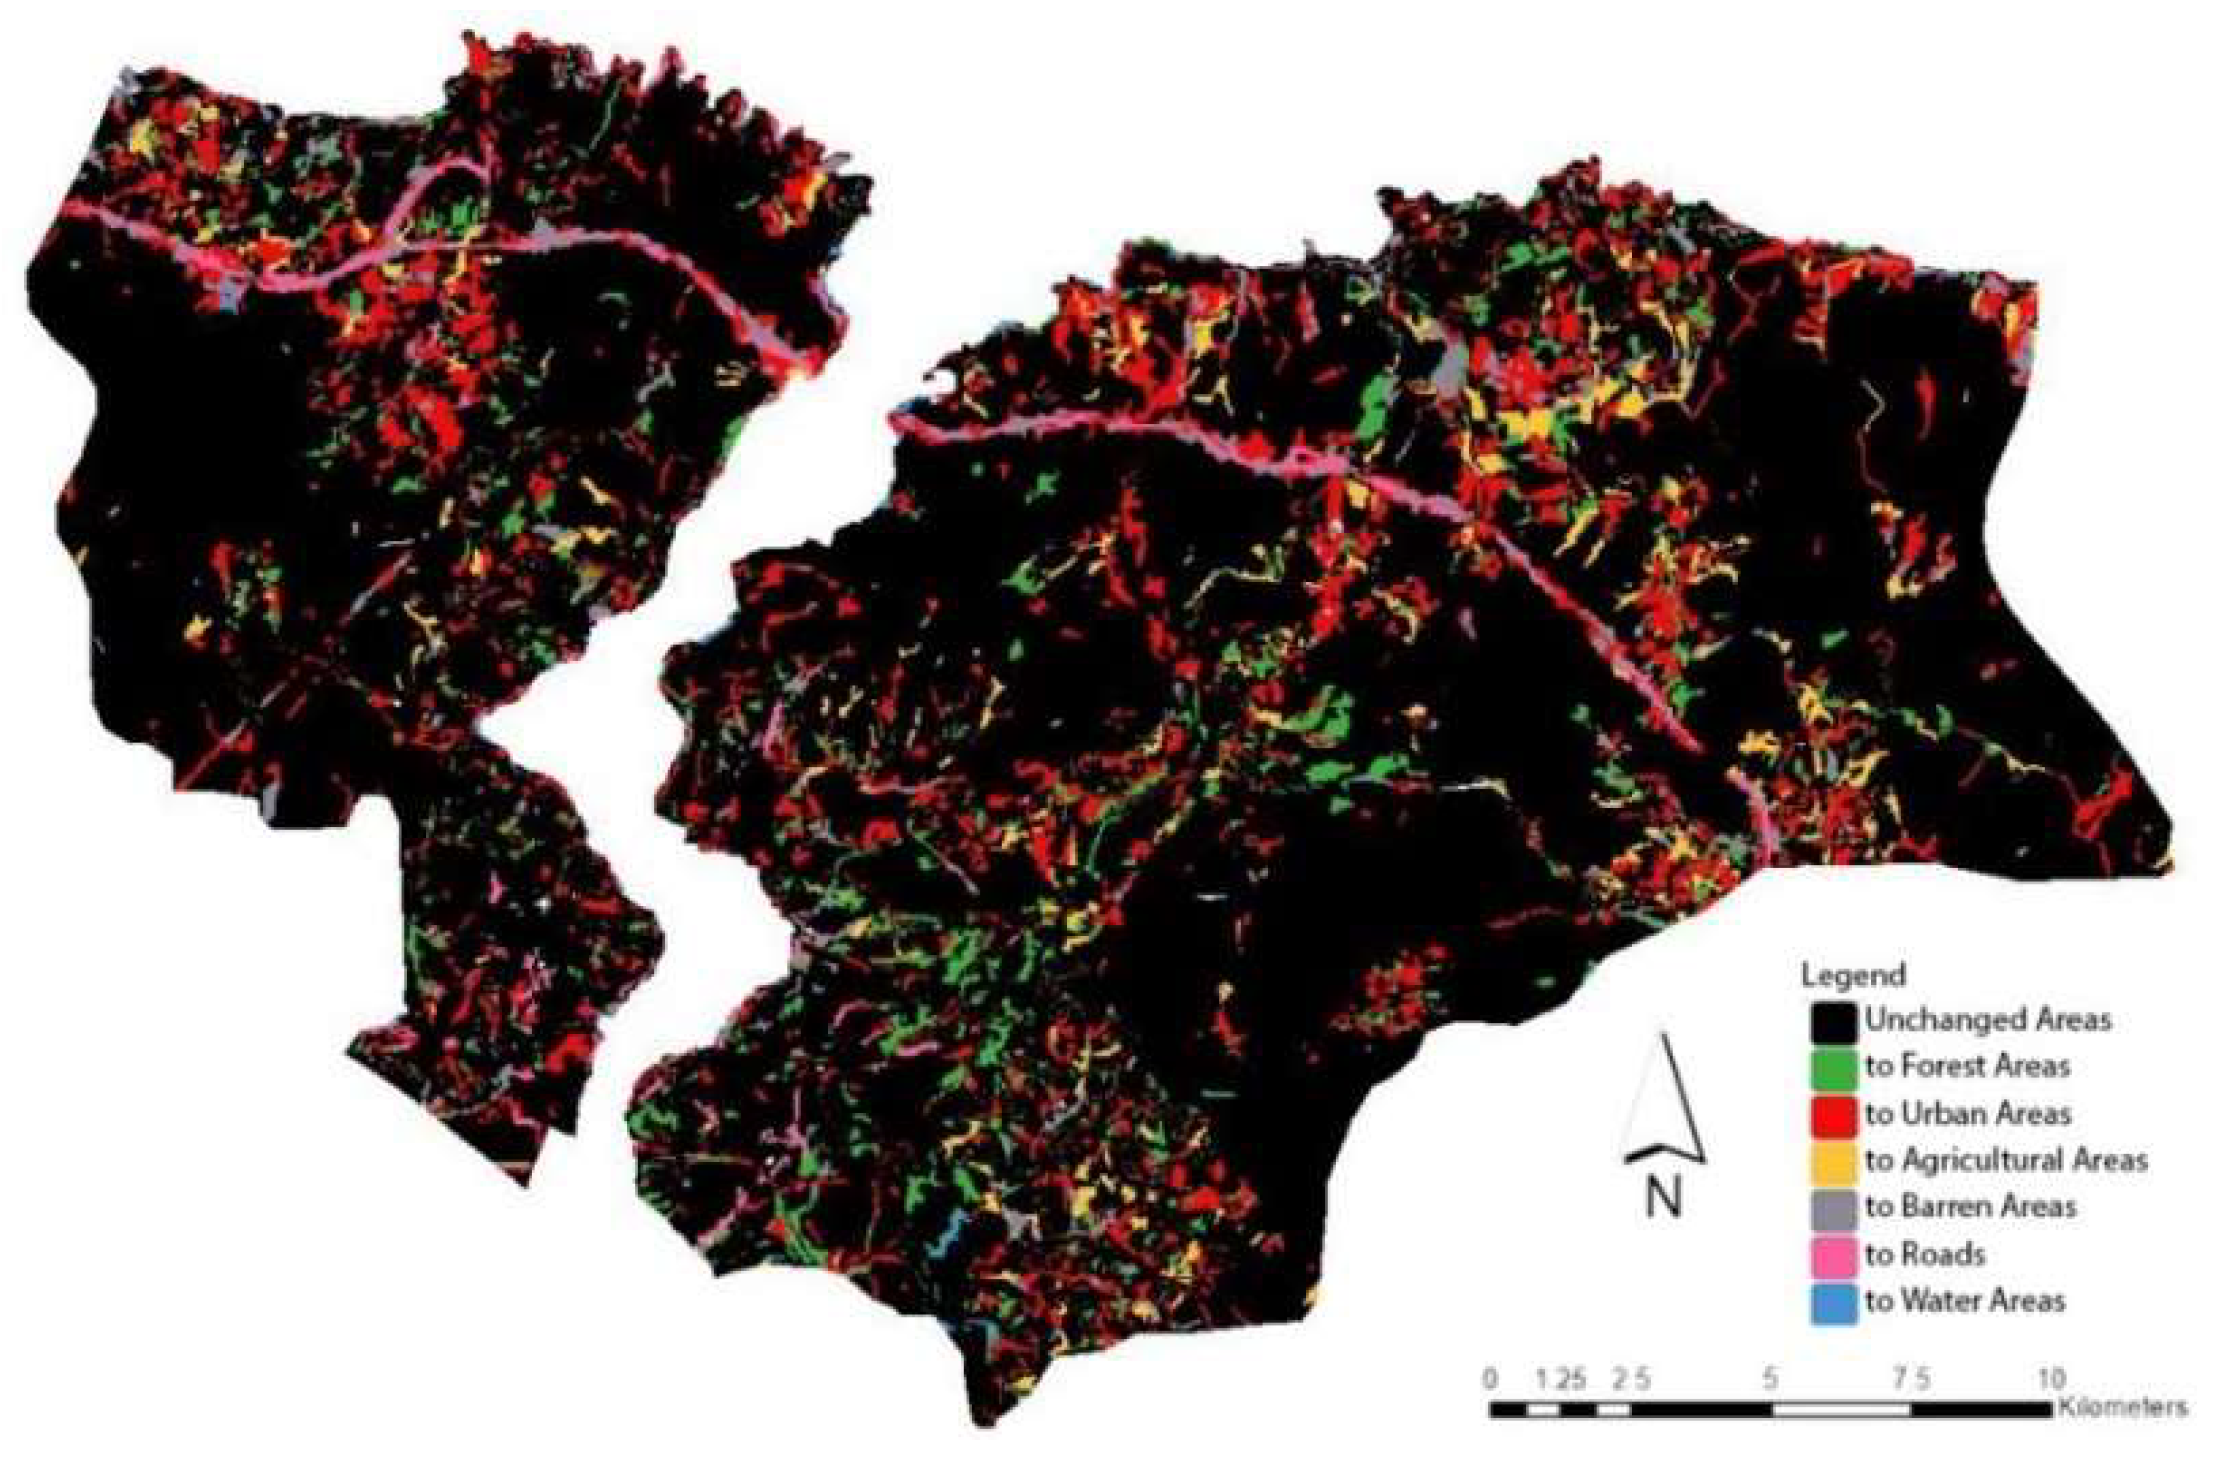
3. Result and Discussion

Satellite images are divided into six classes with object-based classification (Figure 3). These are agricultural areas, urban areas, water areas, forest areas, barren areas, and roads.
Accuracy assessment analysis was performed by adding random points to the classification results. Producer, user, overall accuracy, and kappa ratio are shown in Table 4.
The change analysis was revealed by comparing the classification results. Change analysis is shown in Figure 4.
As a result of the classification, it was observed that forest areas decreased from 317.8 km2 to 293.9 km2. This shows that approximately 6% of forest loss was experienced in the study area. It is observed that the built areas increased from 88.6 km2 to 109.6 km2. The built areas increased by approximately 4%. The rate of change in classes is shown in Table 5.
The classification results obtained were examined with FRAGSTATS and landscape metrics were calculated. Results are shown in Table 6.
This study examines the overall land use change and forest loss in the Sarıyer and Beykoz districts from 2009 to 2019 using Landsat data. The purpose of this study was to examine the pressure of urbanization effects on forest areas. In this study landscape metrics were used for this purpose. A numerical description of the landscape structure and an objective understanding of the functioning of the landscape can be achieved by using landscape metrics [12].
The increase in ED in forest areas means that forest areas are fragmented from whole and large pieces to smaller pieces. An increase in the LPI value indicates that the small patches belonging to the road class combine to form the largest patch index. The same is not the case for the forest areas. While the PD metric results increase in patches belonging to this class, the decrease in AI and LPI metric results is an indication that the holistic structure of the class is disrupted and it is divided into small units that are separate from each other. As a result of the fragmentation of forest areas due to urban areas and roads, there is a decrease in the largest patch index of the forest areas class over the years.
The main reason why the barren areas increased in parallel with the road class is the presence of undefined areas as construction sites around the newly opened roads. The increase in road, barren and urban areas has led to a decrease in forest and agricultural areas. Especially forest areas in and around the Northern Marmara Highway were destroyed and land use was changed.

Author Contributions

B.S. analyzed the data and wrote the paper. F.B.B. helped in the organization of the paper and contributed to editing the manuscript. All authors have read and agreed to the published version of the manuscript.

Funding

This research received no external funding.

Institutional Review Board Statement

Not applicable.

Informed Consent Statement

Not applicable.

Data Availability Statement

Not applicable.

Conflicts of Interest

The authors declare no conflict of interest.

References

  1. Aksu, G. Analysis of Landscape Changes: A Case Study in Istanbul Sarıyer. Ph.D. Thesis, Istanbul University, Istanbul, Turkey, November 2012. [Google Scholar]
  2. Brockerhoff, E.G.; Jactel, H.; Parrotta, J.A.; Quine, C.P.; Sayer, J. Plantation forests and biodiversity: Oxymoron or opportunity? Biodivers. Conserv. 2008, 17, 925–951. [Google Scholar] [CrossRef]
  3. Bain, D.J.; Brush, G.S. Placing the pieces: Reconstructing the original property mosaic in a warrant and patent watershed. Landsc. Ecol. 2004, 19, 843–856. [Google Scholar] [CrossRef]
  4. Li, H.; Peng, J.; Yanxu, L.; Yina, H. Urbanization impact on landscape patterns in Beijing City, China: A spatial heterogeneity perspective. Ecol. Indic. 2017, 82, 50–60. [Google Scholar] [CrossRef]
  5. Han, X.; Chen, X.; Feng, L. Four decades of winter wetland changes in Poyang Lake based on Landsat observations between 1973 and 2013. Remote Sens. Environ. 2015, 156, 426–437. [Google Scholar] [CrossRef]
  6. Algancı, U. Determination of Land Cover Changes with Multi-temporal Landsat 8 Satellite Images: A Case Study of Istanbul. Harita Dergisi. 2018, 160, 24–33. [Google Scholar]
  7. Jiang, N.; Zhang, J.X.; Li, H.T.; Lin, X.G. Object-oriented buinding extraction by DSM and very high-resolution orthoimages. The International Archives of the Photogrammetry. Remote Sens. Spat. Inf. Sci. 2008, 37, 441–446. [Google Scholar]
  8. Wahyudi, A.; Liu, Y.; Corcoran, J. Combining Landsat and landscape metrics to analyze large-scale urban land cover change: A case study in the Jakarta Metropolitan Area. J. Spat. Sci. 2019, 64, 515–534. [Google Scholar] [CrossRef]
  9. McGarigal, K. Models of Landscape Structure; Lecture Notes; University of Massachusetts: Amherst, MA, USA, 2001; Chapter 7. [Google Scholar]
  10. Alay, A.M. Investigation of Land Use-Land Cover Change, and Modeling the Landscape Change of Sariyer, Istanbul; Institute of Science and Technology, İstanbul Technical University: İstanbul, Turkey, 2016. [Google Scholar]
  11. Sertel, E.; Topaloglu, H.; Sallı, B.; Algan, I.; Aksu, G. Comparison of Landscape Metrics for Three Different Level Land Cover/Land Use Maps. Int. J. Geo-Inf. 2018, 7, 408. [Google Scholar] [CrossRef] [Green Version]
  12. Benliay, A.; Yıldırım, E. Use of Landscape Metrics in Landscape Planning Studies. Türk Bilimsel Derlemeler Derg. 2013, 6, 7–11. [Google Scholar]
Figure 1. Study area.
Environsciproc 22 00057 g001
Figure 2. Flow chart of the study.
Environsciproc 22 00057 g002
Figure 3. (a) Classification result for 2009, (b) classification result for 2019.
Environsciproc 22 00057 g003
Figure 4. LULC change analysis.
Environsciproc 22 00057 g004
Table 1. Segmentation values.
YearsImage Layer Weights
(R-G-B-NIR-SWIR1-SWIR2)
Scale ParameterShape/ColorCompactness/Smoothness
20091,1,1,2,1,1200.8/0.20.6/0.4
20191,1,1,2,1,1200.8/0.20.6/0.4
Table 2. Features for nearest neighbor classification.
Features for NNExplanation
NDVI
(Normalized Difference Vegetation Index)
To determine the vegetation density on the earth;
NDVI = (NIR − RED)/(NIR + RED)
MNDWI
(Modified Normalized Difference
Water Index)
To determine the water areas on the earth;
MNDWI = (GREEN − SWIR1)/(GREEN + SWIR1)
NDBI
(Normalized Difference Built-up Index)
To determine the built areas on the earth;
NDBI = (SWIR1 − NIR)/(SWIR1 + NIR)
BrightnessIt calculates the average values of the objects in the image in all bands.
Length/WidthIt determines the ratio of the lengths to the widths of the objects in the image.
Table 3. Detailed information about the landscape indices implemented in FRAGSTATS 4.2.
NameAbbreviationFormulasDescription
Aggregation Index
(Dispersion Interspersion Metric)
AI AI = [ g i i m a x g i i ] (100)
0 ≤ AI ≤ 100
It is used to measure the degree of clumping of patches.
Edge Density
(Edge Metric)
ED ED = k = 1 m e i k A (10,000)
ED ≥ 0, limitless
Edge density of all patches of the class
Largest Patch
Index
(Area Metric)
LPI LPI = m a x ( a i j ) j = 1 n A (100)
0 < LPI ≤ 100
The ratio of the largest patch in the class to the class
Patch Density
(Subdivision Metric)
PD PD = n i A (10,000) (100)
PD > 0, constrained by cell size.
It shows the distribution and fragmentation of cells by patch type.
Note: gii: number of like adjacencies (joins) between pixels of patch type (class) i based on the single-count method; max-gii: maximum number of like adjacencies (joins) between pixels of patch type (class) i based on the single-count method; eik = total length (m) of edge in landscape involving patch type (class) i, includes landscape boundary and background segments involving patch type i; A: total landscape area (m2); aij: area (m2) of patch ij; ni: number of patches in the landscape of patch type (class) i.
Table 4. Result of accuracy assessment.
Classes20092019
PA (%)UA (%)PA (%)UA (%)
Water84909690
Forest Areas92989497
Urban Areas97958987
Agricultural Areas94828989
Barren Areas81847676
Roads86838280
20092019
Overall Accuracy 91%89%
Kappa Ratio 89%86%
Table 5. Area of classes and change rate between 2009 and 2019.
Classes20092019Change Rate
Area/km2Percentage/%Area/km2Percentage/%%
Water4.990.83.990.8-
Forest Areas317.8573.2293.9867.3−5.9
Urban Areas88.6320.1109.6724.2+4.1
Roads1.420.375.791.3+0.93
Barren Areas1.820.337.272.6+2.27
Agricultural Areas22.725.216.733.8−1.4
TOTAL437.43100437.431000
Table 6. Results of landscape metrics.
MetricsUnitsForestUrban AreasRoadsBarrenAgricultural
Area
Water
2009–20192009–20192009–20192009–20192009–20192009–2019
PDpatch/ha0.38–0.490.77–1.170.07–0.210.3–0.640.91–0.631.18–1.50
AI%96.8–95.789.6–87.767.8–73.769.0–73.380.8–78.966.5–60.9
EDm/ha31.3–38.528.0–40.71.43–4.721.66–6.0213.5–10.93.67–3.49
LPI%45.8–40.36.64–5.180.05–0.150.04–0.050.17–0.150.13–0.13
Publisher’s Note: MDPI stays neutral with regard to jurisdictional claims in published maps and institutional affiliations.

