1. Introduction
Large wildfires constitute a very significant disturbance to fire-prone landscapes. In different locations around the world, such as California (USA), Portugal, Spain, and Australia, the intensity of these natural events is enhanced by the effects of climate change and the overexploitation of natural resources by the population [
1,
2,
3,
4,
5].
Wildfires are events that result in a great loss of biodiversity, in addition to important changes to the surface where they occur [
6,
7]. Portugal is a country where the recurrence of forest fires is increasing due to a combination of environmental and human factors, such as drier years, and climatic conditions favorable to their propagation, such as lack of precipitation, low humidity, and wind. Considering the human factor, in the last three decades, the unequal distribution of the population throughout the Portuguese territory is related to the regional distribution of ignition sources [
8]. The same scenario is observed in the northwest region of Spain.
The consequences of the fires are of social and economic order, affecting rural properties and their agricultural production, resulting in a significant loss of capital, and of environmental order, degrading the landscape’s natural values and decreasing the provision of ecosystem services. The forest is responsible for providing different ecosystem services, such as carbon storage in vegetation and soil, food, water filtration, and climate regulation at local and regional levels. With the increase in the occurrence of wildfires, the availability of ecosystem services is altered [
9].
In the context of climate change, quantifying carbon stocks, an important ecosystem service to mitigate global warming, is essential. To quantify the carbon stock, biophysical parameters, such as the height of the trees are necessary. To measure this parameter, there is the possibility of using a worldwide database called the Global Ecosystem Dynamics Investigation (GEDI), a LIDAR instrument on board the International Space Station that has made data available since April 2019, with a scan diameter of 25 m. This instrument makes high-resolution observations of the vertical structure of the forest, providing metrics needed to understand processes and patterns of biodiversity [
10]. The studies of [
11,
12,
13] used GEDI data to estimate the height of trees in forests. We used the Google Earth Engine platform to analyze satellite imagery, digital elevation model, and GEDI data to measure vegetation height before and after fires.
2. Material and Method
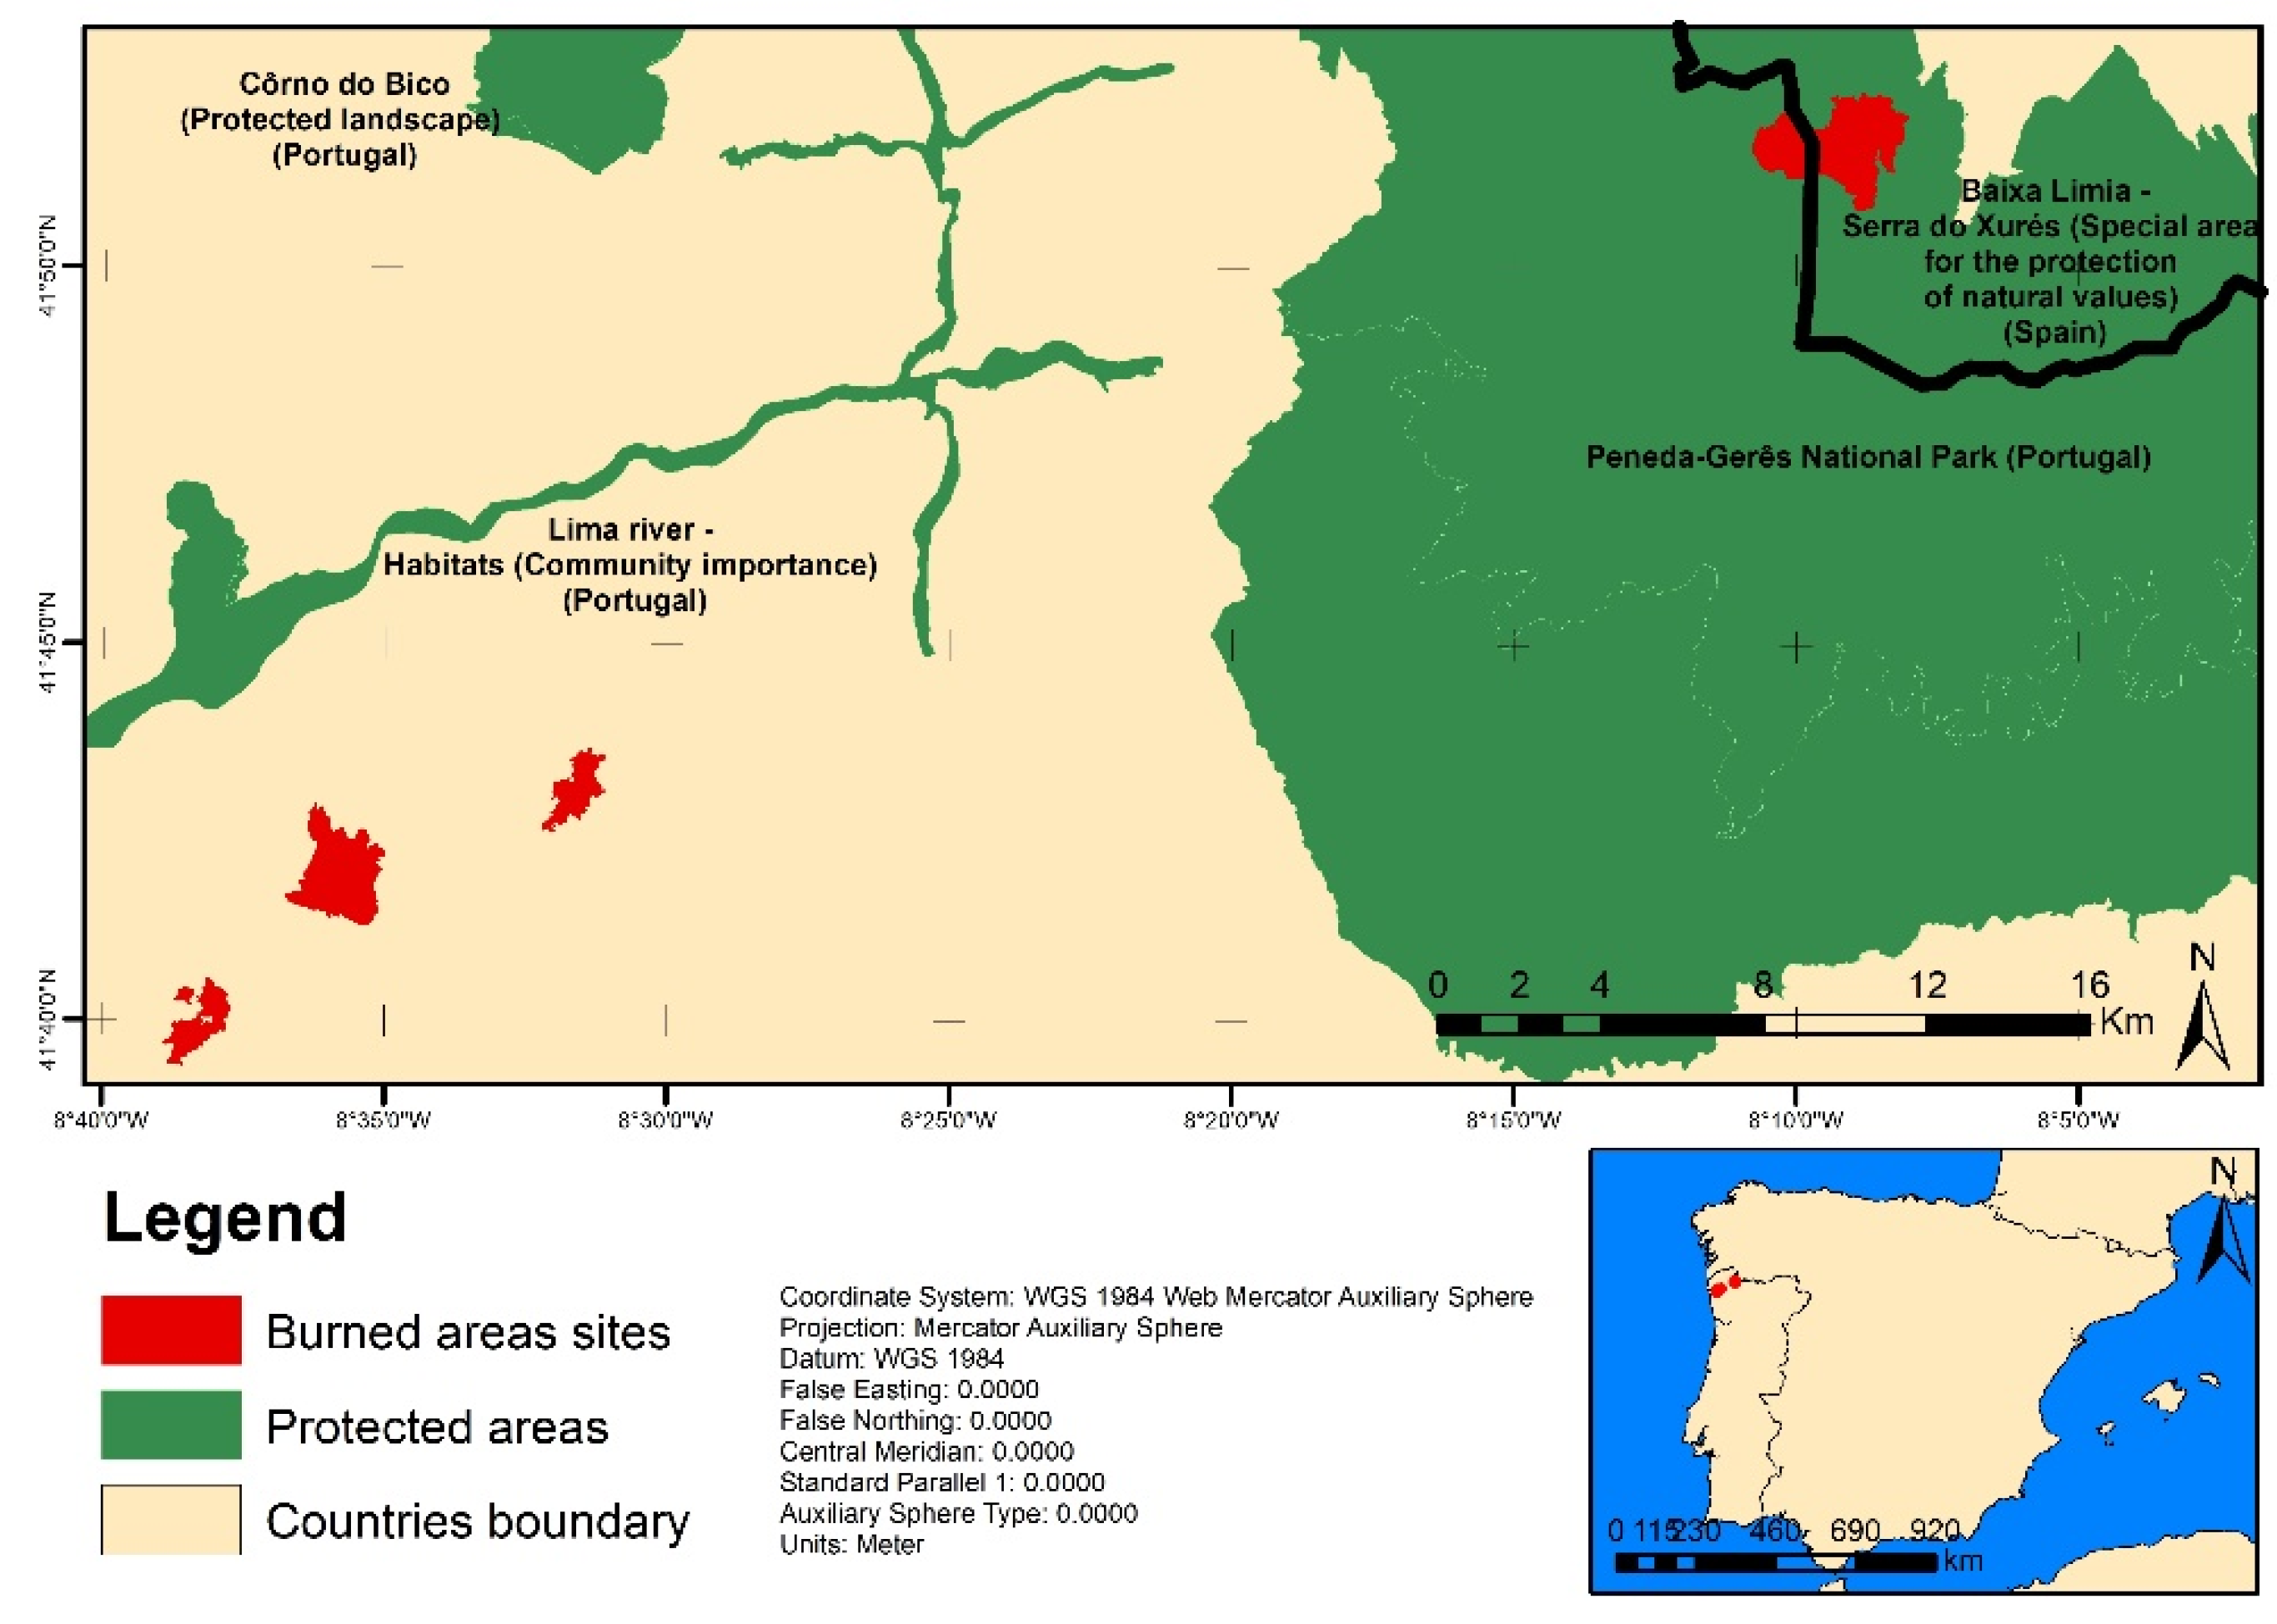
2.1. Study Area
The study was performed in 4 areas affected by wildfires in the summer of 2020 in northern Portugal and Galicia (Spain) (
Figure 1).
The areas cover 1294.8 hectares (ICNF, 2020), with one of the areas affecting the Peneda-Gerês National Park (PNPG), a protected area together with the Spanish Natural Park of Baixa Limia–Serra do Xurés, the Gerês-Xurés Transfrontier Park, and the Biosphere reserve of the same name.
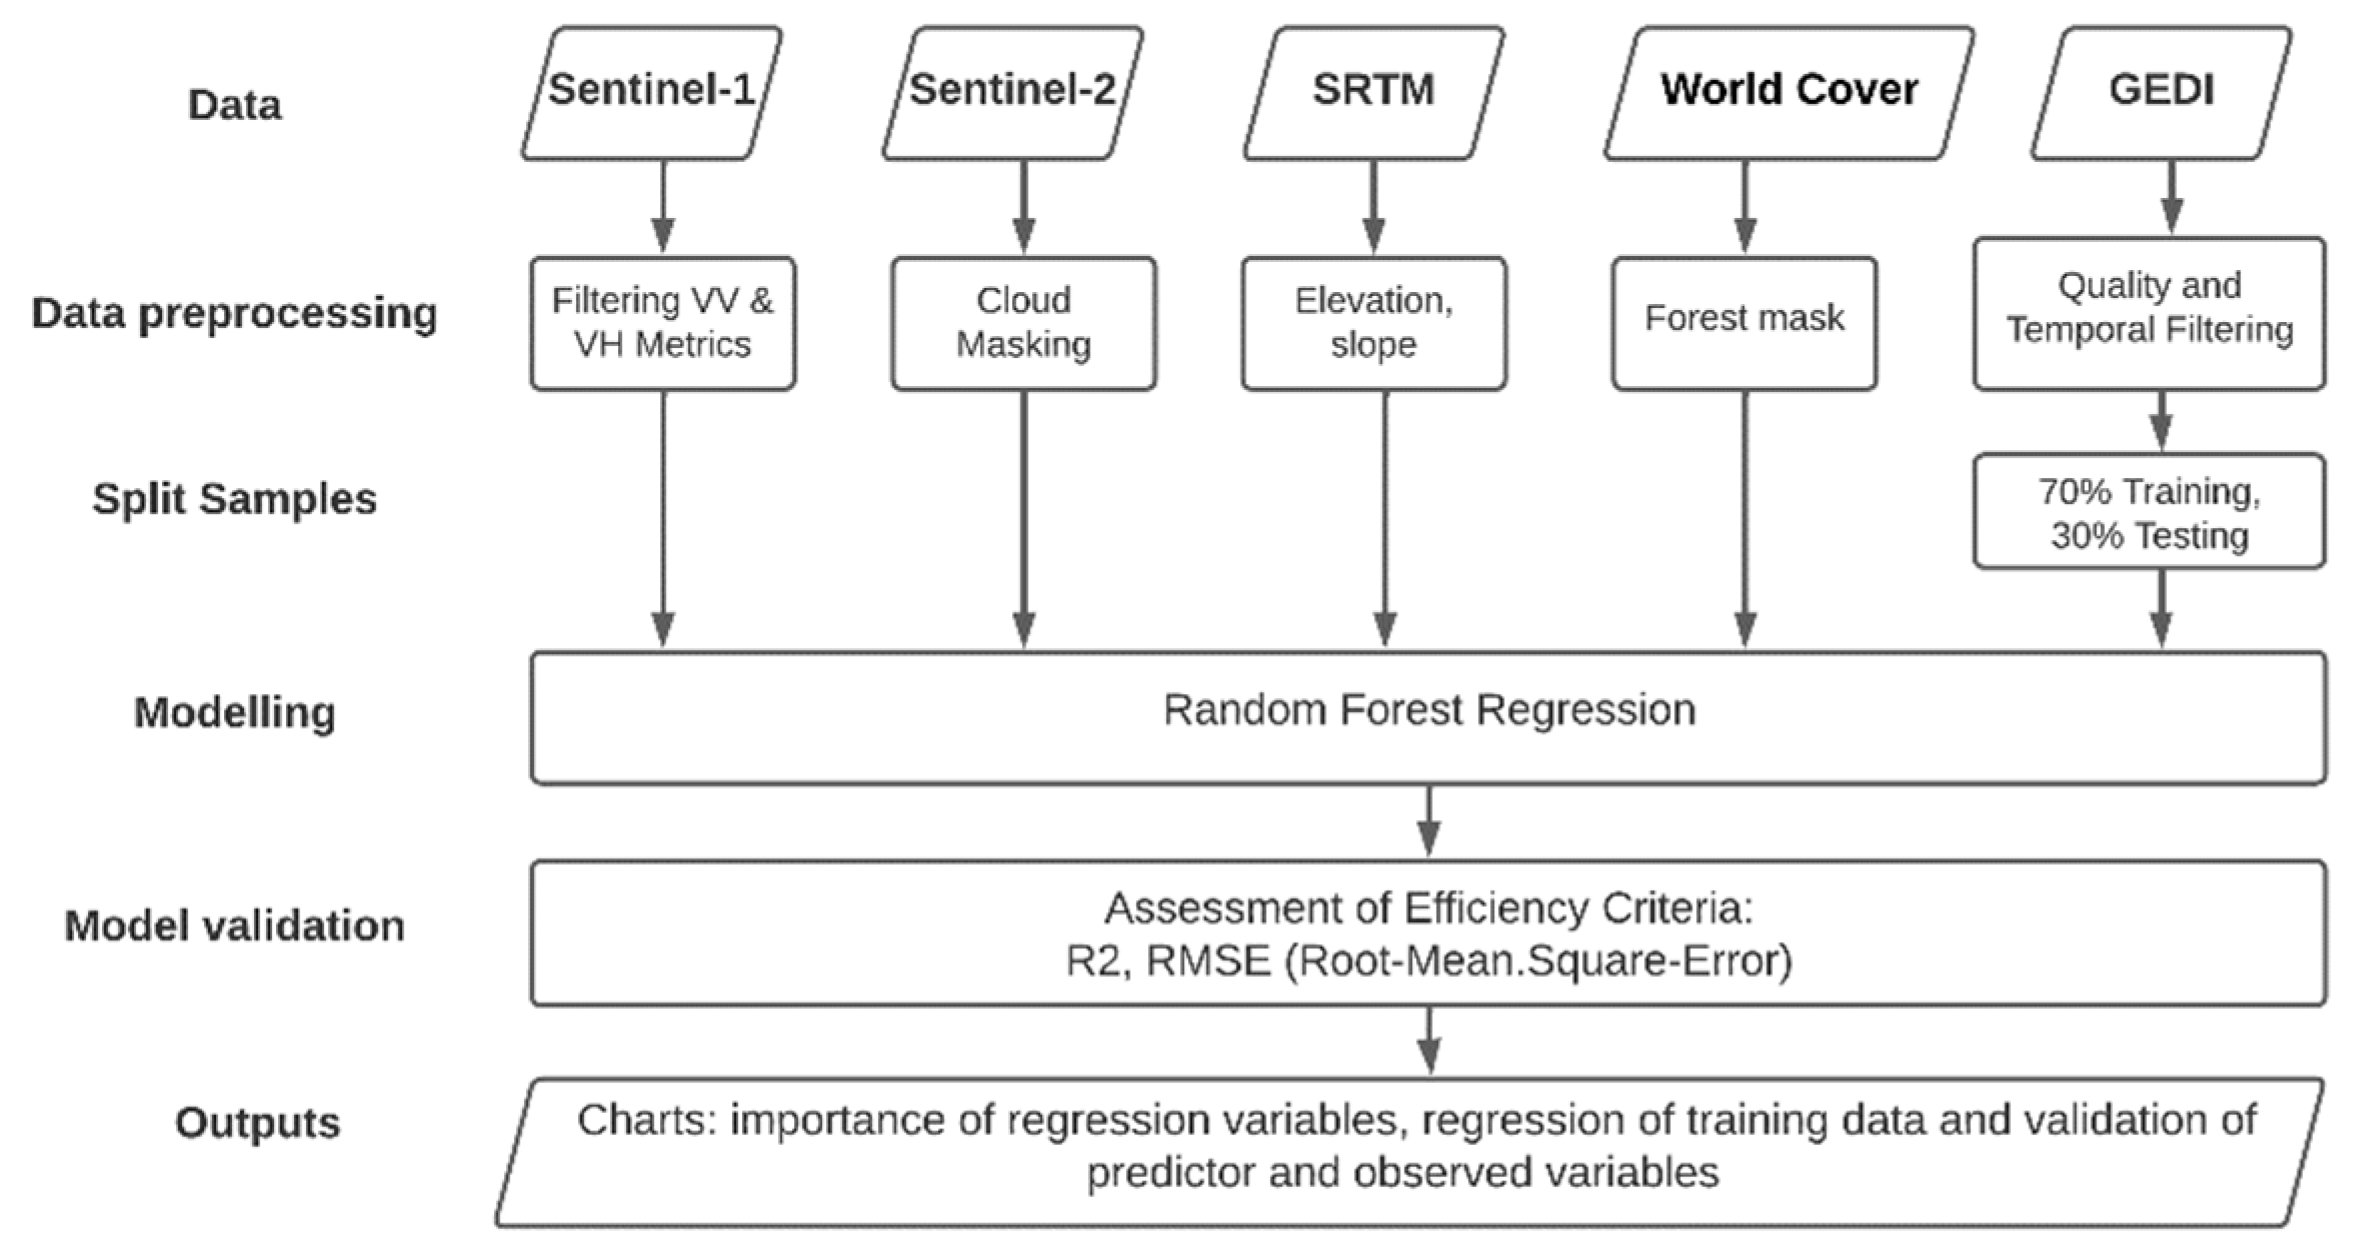
2.2. Data Acquisition and Processing
The research steps were adapted from the Kamusoko [
13] and are available in
Figure 2.
Sentinel data for the period of September to December 2020 were used to model vegetation structural characteristics. The Sentinel-2 multispectral sensor data at level 2A (Surface Reflectance) were processed together with C-band Synthetic Aperture Radar (SAR) data from Sentinel-1 (ground range detected). Both Sentinel datasets have a geometric resolution of 10 m, which will be the target spatial resolution of the models [
14]. Sentinel-1 data were filtered for single copolarization of vertical transmission (VV) and dual-band cross-polarization in vertical transmission and horizontal reacceptance (VH). Sentinel-2 has been filtered for a cloud percentage of less than 20%.
Shuttle Radar Topography Mission (SRTM) [
15] data were used to obtain elevation and slope values. This SRTM V3 product (SRTM Plus) was provided by NASA at a resolution of 1 arc-second (approximately 30 m). The World Cover 2020 product of the European Space Agency (ESA) was used for the delimitation of the forest mask; this image had a 10m resolution based on Sentinel-1 and Sentinel-2 data.
We used the Global Ecosystem Dynamics Investigation (GEDI) level 2A data [
11,
16] for forest area selection. GEDI data were stored as point geometries representing the centroid of the 25 m sample footprint. Vegetation structural attribute that was modelled was canopy height (98th percentile of the relative height metrics from GEDI L2A).
All data were processed in Google Earth Engine (GEE) using the Python API. The predictor variables for the model were determined from Sentinel-1, Sentinel-2, SRTM, and World Cover data. A machine learning approach was used with the application of a random forest regression model. A random forest (RF) model is a machine learning ensemble technique that has proven its popularity in remote sensing applications due to its high accuracy and performance [
14,
17].
In total, about 10,000 quality-filtered GEDI samples were used for model training and validation of each vegetation structure attribute. The GEDI sample set was randomly split before modeling into a collection of training samples (70%) and test samples (30%) for model validation. The bands included in the classification were (‘B2’, ‘B3’, ‘B4’, ‘B5’, ‘B6’, ‘B7’, ‘B8’, ‘B11’, ‘B12’, ‘VV_iqr’, ‘VH_iqr’, ‘elevation’, ‘slope’, and ‘Map’). The test samples, model-independent, were used to calculate several model efficiency criteria, such as the coefficient of determination (R2) and root mean square error (RMSE).
3. Results and Discussion
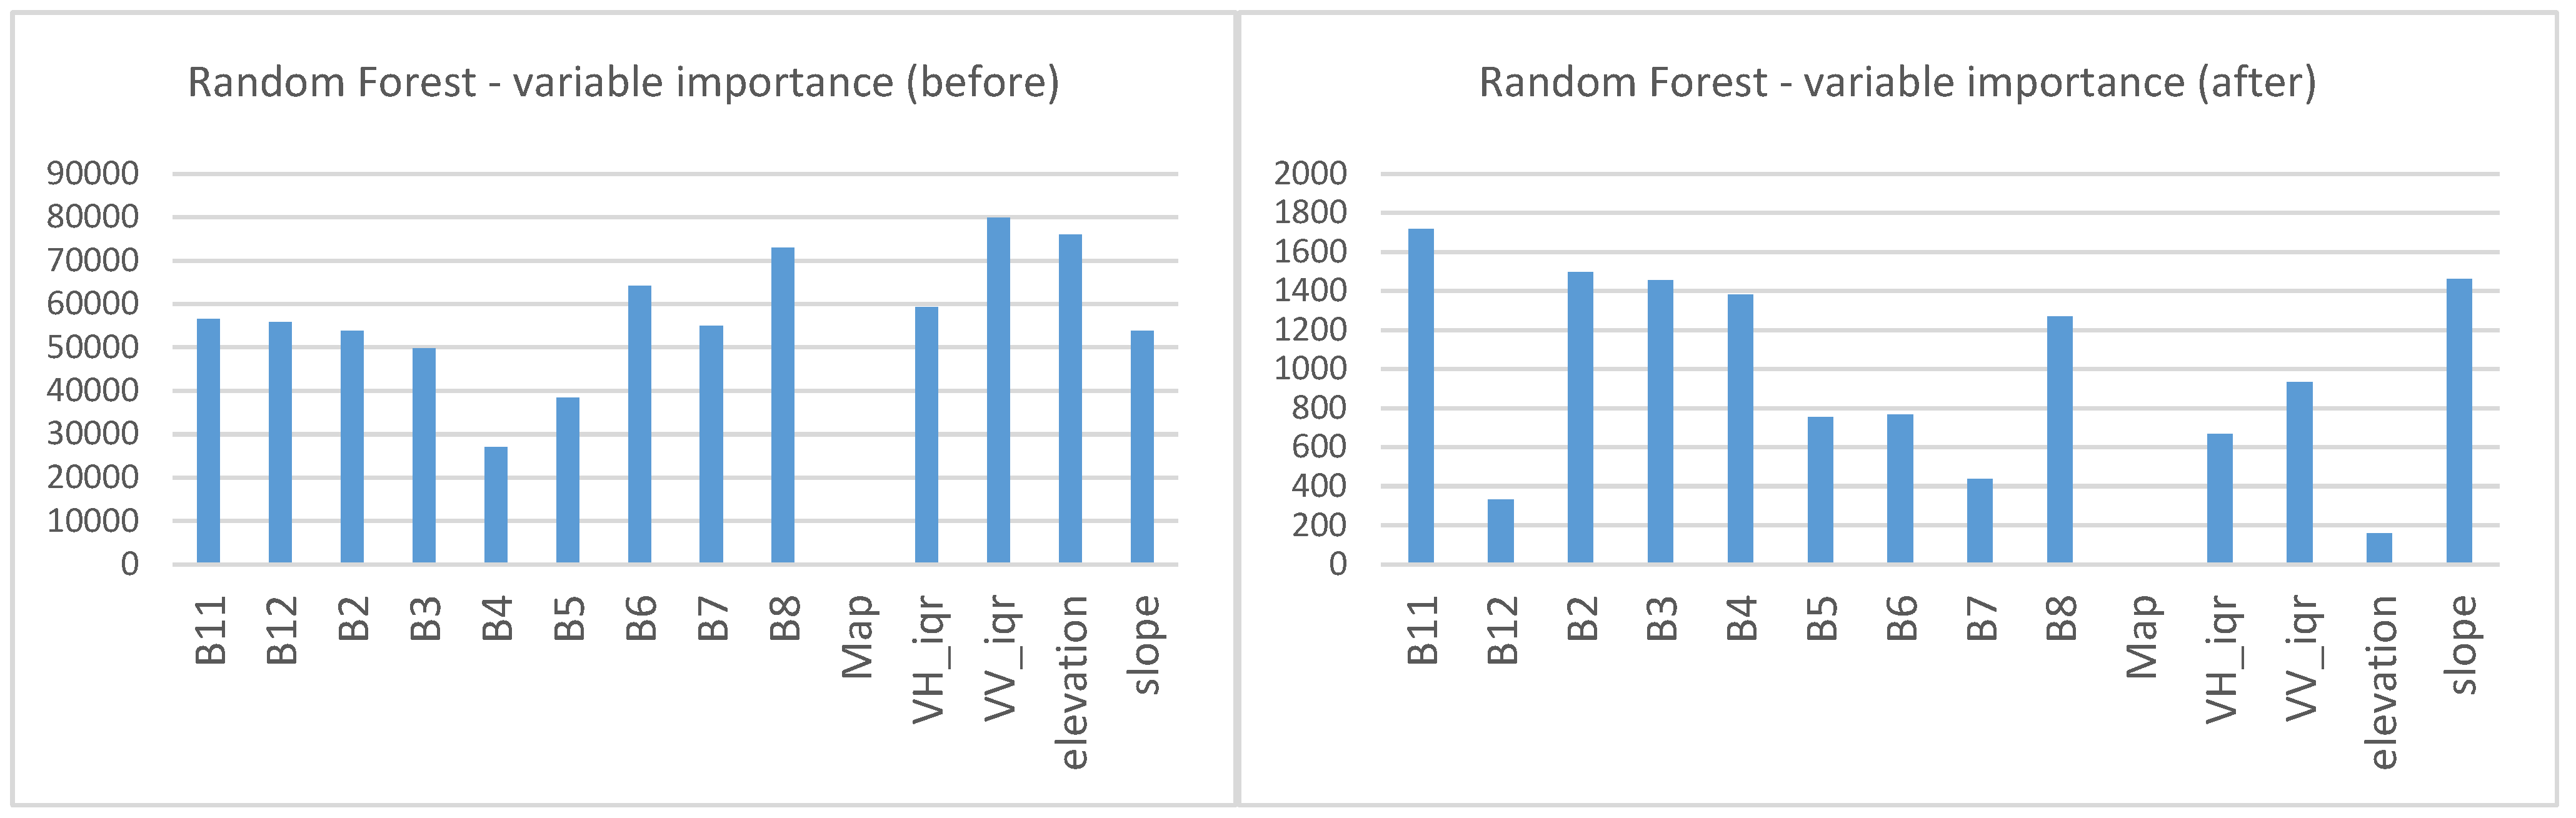
The importance of the variables used in the regression using random forest can be seen in
Figure 3.
B4 (red) was the one that underwent the greatest change, as it is the most sensitive to vegetation variations in the visible spectrum. Therefore, the lack of or decrease in the amount of vegetation after fires resulted in a greater variation in its importance in the regression.
The wavelengths of the Red-edge range (B5, B6, and B7) and B8 (NIR) are more sensitive in identifying the severity of fires. The bands of the Red-edge range can be used in the calculation of the NDVI705 (Difference Vegetation Red-Edge Index) most suitable for forest monitoring and wildfires [
18,
19].
Sentinel’s SWIR waveform is sensitive to changes in the structural crust, deformation of soil minerals, and soil salinity. These changes are identified in soil degradation processes resulting from wildfires that result in greater soil exposure [
20], hence the greater variation in the importance of these variables in the regression. More details on soil degradation using hyperspectral data and remote sensing can be found in Goldshleger et al. [
21].
Sentinel-1 collects C-band synthetic aperture radar (SAR) imagery to provide VV and VH with dual-band cross-polarization and vertically transmitted/horizontally received data applied to forestry studies to identify fire scars. The results show that the VV polarization is more important than the VH, maintaining the same proportion before and after fires. Regarding terrain data, elevation is no longer an important variable in the postfire regression, and the slope becomes one of the most important variables. This is because the slope becomes more easily identified in a digital elevation model (DEM) in an area with fewer trees. The slope values help to identify regions where the trees did not burn.
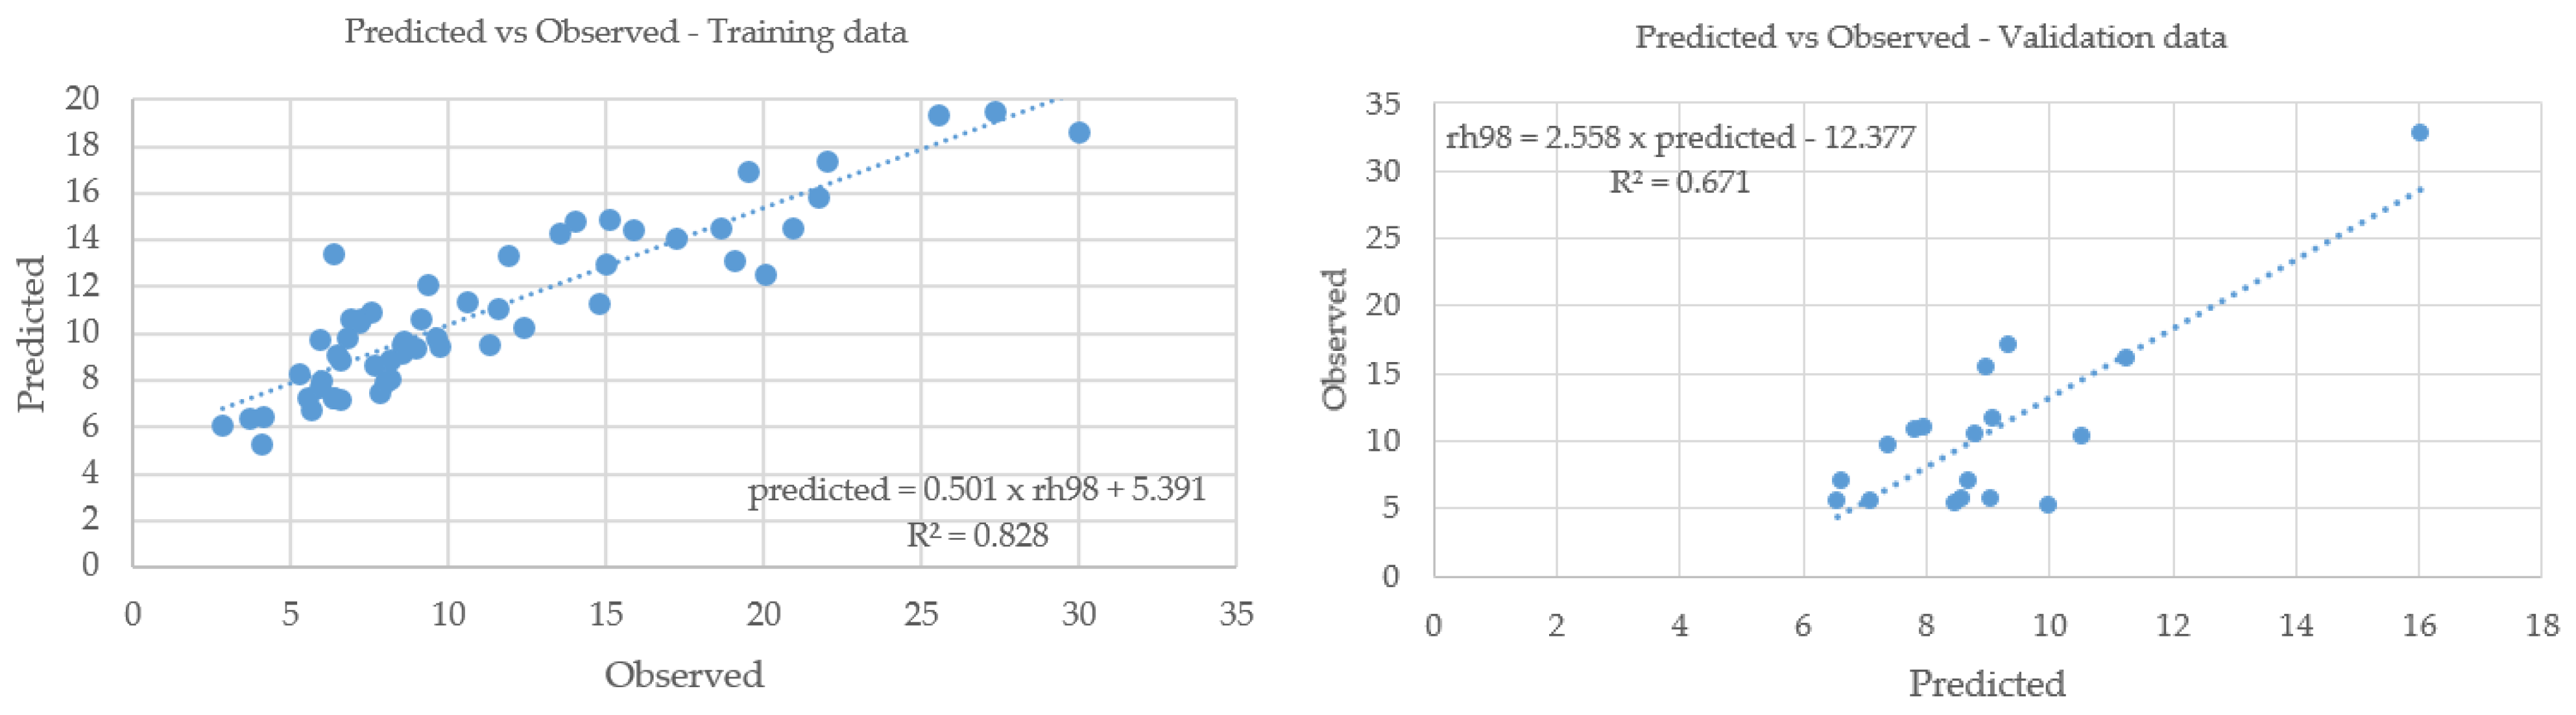
Concerning the height of the trees, the results indicate that before the fires, the heights varied from 5.21 to 20.16 m and between 5.55 and 9.12 m after the fires. The regression results of the training (70%) and validation (30%) datasets before the fires are shown in the
Figure 4.
In the training data set before the fires, a good result of r2 0.82 and RMSE 3.47 was recorded, with a greater concentration of data close to the fit line and in the validation data set, r2 0.67 and RMSE 5.23, with greater dispersion of the data to the surroundings of the model fit line.
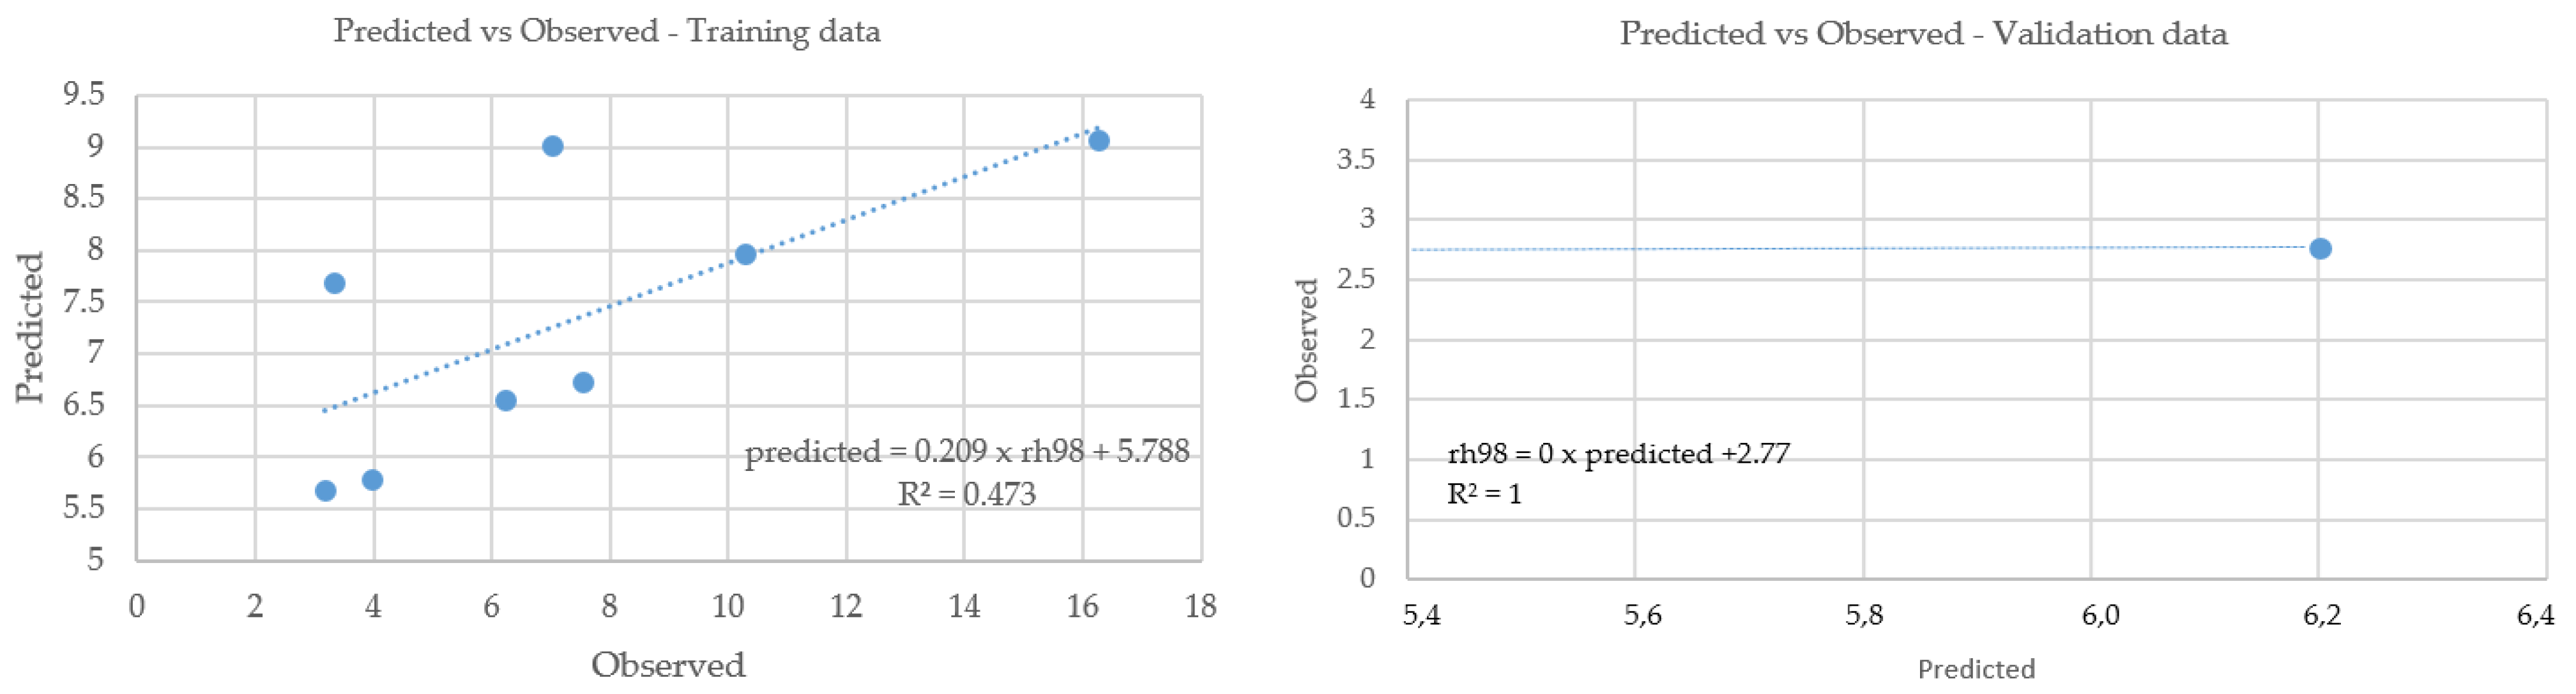
After the fires, the training and validation data are shown in the
Figure 5.
Concerning the regression of the training data observed after the fires, low values of r2 were identified in the training data of r2 0.47 and RMSE 3.36 with a large data dispersion and in the validation data of r2 1 and RMSE 3.34, constituting bad statistical results. However, these results are acceptable in the context of a work that intends to measure the height of trees in burned areas before and after fires. The result is explained by the drastic reduction in trees for model validation after the fires, dramatically decreasing the number of predictor variable data (GEDI) needed for random forest regression.
4. Conclusions
The use of the GEE platform to analyze large amounts of data has shown potential in recent years, due to its flexibility in code construction and data crossing. In the present study, we sought to analyze the GEDI dataset, an important LIDAR instrument that since 2019 has provided data from planet Earth with great potential for analysis related to climate change, such as measuring carbon stocks and vegetation structures.
We can conclude that the results presented in the present research are important and have great potential for the application in the study of wildfires using remote sensing. It was possible to identify with relative precision the variations observed in the height of trees in burned areas in northern Portugal and Spain.
The regression results corroborate the decrease in tree height due to the occurrence of fires, demonstrating great potential for the application of the random forest model to predict tree height using LIDAR data and other predictor variables, such as SAR and hyperspectral images from the Sentinel satellite.
Author Contributions
Conceptualization, S.F., S.M.B.d.S., A.B.-G. and A.V.; methodology, software, validation, and formal analysis, S.F. and S.M.B.d.S.; investigation and resources, S.F., S.M.B.d.S., A.B.-G. and A.V.; data curation and writing—original draft preparation, S.F. and S.M.B.d.S.; writing—review and editing, A.B.-G. and A.V.; visualization and supervision, A.B.-G. and A.V.; project administration, A.V.; funding acquisition, A.V. All authors have read and agreed to the published version of the manuscript.
Funding
This research was funded by the European Regional Development Fund. Climate Change Resilient Tourism in Protected Areas of Northern Portugal (CLICTOUR-Project NORTE-01-0145-FEDER-000079).
Institutional Review Board Statement
Not applicable.
Informed Consent Statement
Not applicable.
Data Availability Statement
Conflicts of Interest
The authors declare no conflict of interest.
References
- Nauslar, N.; Abatzoglou, J.; Marsh, P. The 2017 North Bay and Southern California Fires: A Case Study. Fire 2018, 1, 18. [Google Scholar] [CrossRef] [Green Version]
- Russell-Smith, J.; McCaw, L.; Leavesley, A. Adaptive prescribed burning in Australia for the early 21st Century—Context, status, challenges. Int. J. Wildl. Fire 2020, 29, 305. [Google Scholar] [CrossRef] [Green Version]
- Pereira, M.; Calado, T.; DaCamara, C.; Calheiros, T. Effects of regional climate change on rural fires in Portugal. Clim. Res. 2013, 57, 187–200. [Google Scholar] [CrossRef] [Green Version]
- Tedim, F.; Remelgado, R.; Borges, C.; Carvalho, S.; Martins, J. Exploring the occurrence of mega-fires in Portugal. For. Ecol. Manag. 2013, 294, 86–96. [Google Scholar] [CrossRef]
- Iriarte-Goñi, I.; Ayuda, M.-I. Should Forest Transition Theory include effects on forest fires? The case of Spain in the second half of the twentieth century. Land Use Policy 2018, 76, 789–797. [Google Scholar] [CrossRef] [Green Version]
- dos Santos, S.M.B.; Bento-Gonçalves, A.; Vieira, A. Research on Wildfires and Remote Sensing in the Last Three Decades: A Bibliometric Analysis. Forests 2021, 12, 604. [Google Scholar] [CrossRef]
- dos Santos, S.M.B.; Bento-Gonçalves, A.; Franca-Rocha, W.; Bapt ista, G. Assessment of Burned Forest Area Severity and Postfire Regrowth in Chapada Diamantina National Park (Bahia, Brazil) Using dNBR and RdNBR Spectral Indices. Geosciences 2020, 10, 106. [Google Scholar] [CrossRef] [Green Version]
- Nunes, A.; Lourenço, L.; Bento-Gonçalves, A.; Vieira, A. Três décadas de incêndios florestais em Portugal: Incidência regional e principais fatores responsáveis. Cad. Geogr. 2013, 32, 133–143. [Google Scholar] [CrossRef] [PubMed] [Green Version]
- Haines-Young, R.; Potschin, M.B. Common International Classification of Ecosystem Services (CICES) V5.1: Guidance on the Application of the Revised Structure, 1st ed.; Barton in Fabis: Nottingham, UK, 2018; Available online: https://cices.eu/content/uploads/sites/8/2018/01/Guidance-V51-01012018.pdf (accessed on 1 June 2022).
- Dubayah, R.; Blair, J.B.; Goetz, S.; Fatoyinbo, L.; Hansen, M.; Healey, S.; Hofton, M.; Hurtt, G.; Kellner, J.; Luthcke, S.; et al. The Global Ecosystem Dynamics Investigation: High-resolution laser ranging of the Earth’s forests and topography. Sci. Remote Sens. 2020, 1, 100002. [Google Scholar] [CrossRef]
- Potapov, P.; Li, X.; Hernandez-Serna, A.; Tyukavina, A.; Hansen, M.C.; Kommareddy, A.; Pickens, A.; Turubanova, S.; Tang, H.; Silva, C.E.; et al. Mapping global forest canopy height through integration of GEDI and Landsat data. Remote Sens. Environ. 2021, 253, 112165. [Google Scholar] [CrossRef]
- Rishmawi, K.; Huang, C.; Zhan, X. Monitoring Key Forest Structure Attributes across the Conterminous United States by Integrating GEDI LiDAR Measurements and VIIRS Data. Remote Sens. 2021, 13, 442. [Google Scholar] [CrossRef]
- Kamusoko, C. Vegetation and Forest Cover Applications. Ai Geolabs Publish. 2022. Available online: https://aigeolabs.com/courses/course-6/ (accessed on 1 June 2022).
- Kacic, P.; Hirner, A.; Ponte, E. Da Fusing Sentinel-1 and -2 to Model GEDI-Derived Vegetation Structure Characteristics in GEE for the Paraguayan Chaco. Remote Sens. 2021, 13, 5105. [Google Scholar] [CrossRef]
- Farr, T.G.; Rosen, P.A.; Caro, E.; Crippen, R.; Duren, R.; Hensley, S.; Kobrick, M.; Paller, M.; Rodriguez, E.; Roth, L.; et al. The Shuttle Radar Topography Mission. Rev. Geophys. 2007, 45, RG2004. [Google Scholar] [CrossRef] [Green Version]
- Dubayah, R.; Blair, J.B.; Beck, J.; Wirt, B.; Armston, J.; Hofton, M.; Luthcke, S.; Tang, H. GLOBAL Ecosystem Dynamics Investigation (GEDI) Level 2 User Guide; 2021; Volume 3. Available online: https://lpdaac.usgs.gov/documents/986/GEDI02_UserGuide_V2.pdf (accessed on 1 June 2022).
- Belgiu, M.; Drăguţ, L. Random forest in remote sensing: A review of applications and future directions. ISPRS J. Photogramm. Remote Sens. 2016, 114, 24–31. [Google Scholar] [CrossRef]
- Evangelides, C.; Nobajas, A. Red-Edge Normalised Difference Vegetation Index (NDVI705) from Sentinel-2 imagery to assess post-fire regeneration. Remote Sens. Appl. Soc. Environ. 2020, 17, 100283. [Google Scholar] [CrossRef]
- Fernández-Manso, A.; Fernández-Manso, O.; Quintano, C. SENTINEL-2A red-edge spectral indices suitability for discriminating burn severity. Int. J. Appl. Earth Obs. Geoinf. 2016, 50, 170–175. [Google Scholar] [CrossRef]
- White, J.D.; Ryan, K.C.; Key, C.C.; Running, S.W. Remote sensing of forest fire severity and vegetation recovery. Int. J. Wildl. Fire 1996, 6, 125–136. [Google Scholar] [CrossRef] [Green Version]
- Goldshleger, N.; Ben-Dor, E.; Lugassi, R.; Eshel, G. Soil Degradation Monitoring by Remote Sensing: Examples with Three Degradation Processes. Soil Sci. Soc. Am. J. 2010, 74, 1433–1445. [Google Scholar] [CrossRef]
| Publisher’s Note: MDPI stays neutral with regard to jurisdictional claims in published maps and institutional affiliations. |
© 2022 by the authors. Licensee MDPI, Basel, Switzerland. This article is an open access article distributed under the terms and conditions of the Creative Commons Attribution (CC BY) license (https://creativecommons.org/licenses/by/4.0/).


