
Application of Tasseled Cap Transformation of Sentinel-2—MSI Data for Forest Monitoring and Change Detection on Territory of Natural Park “BLUE STONES” †

Abstract
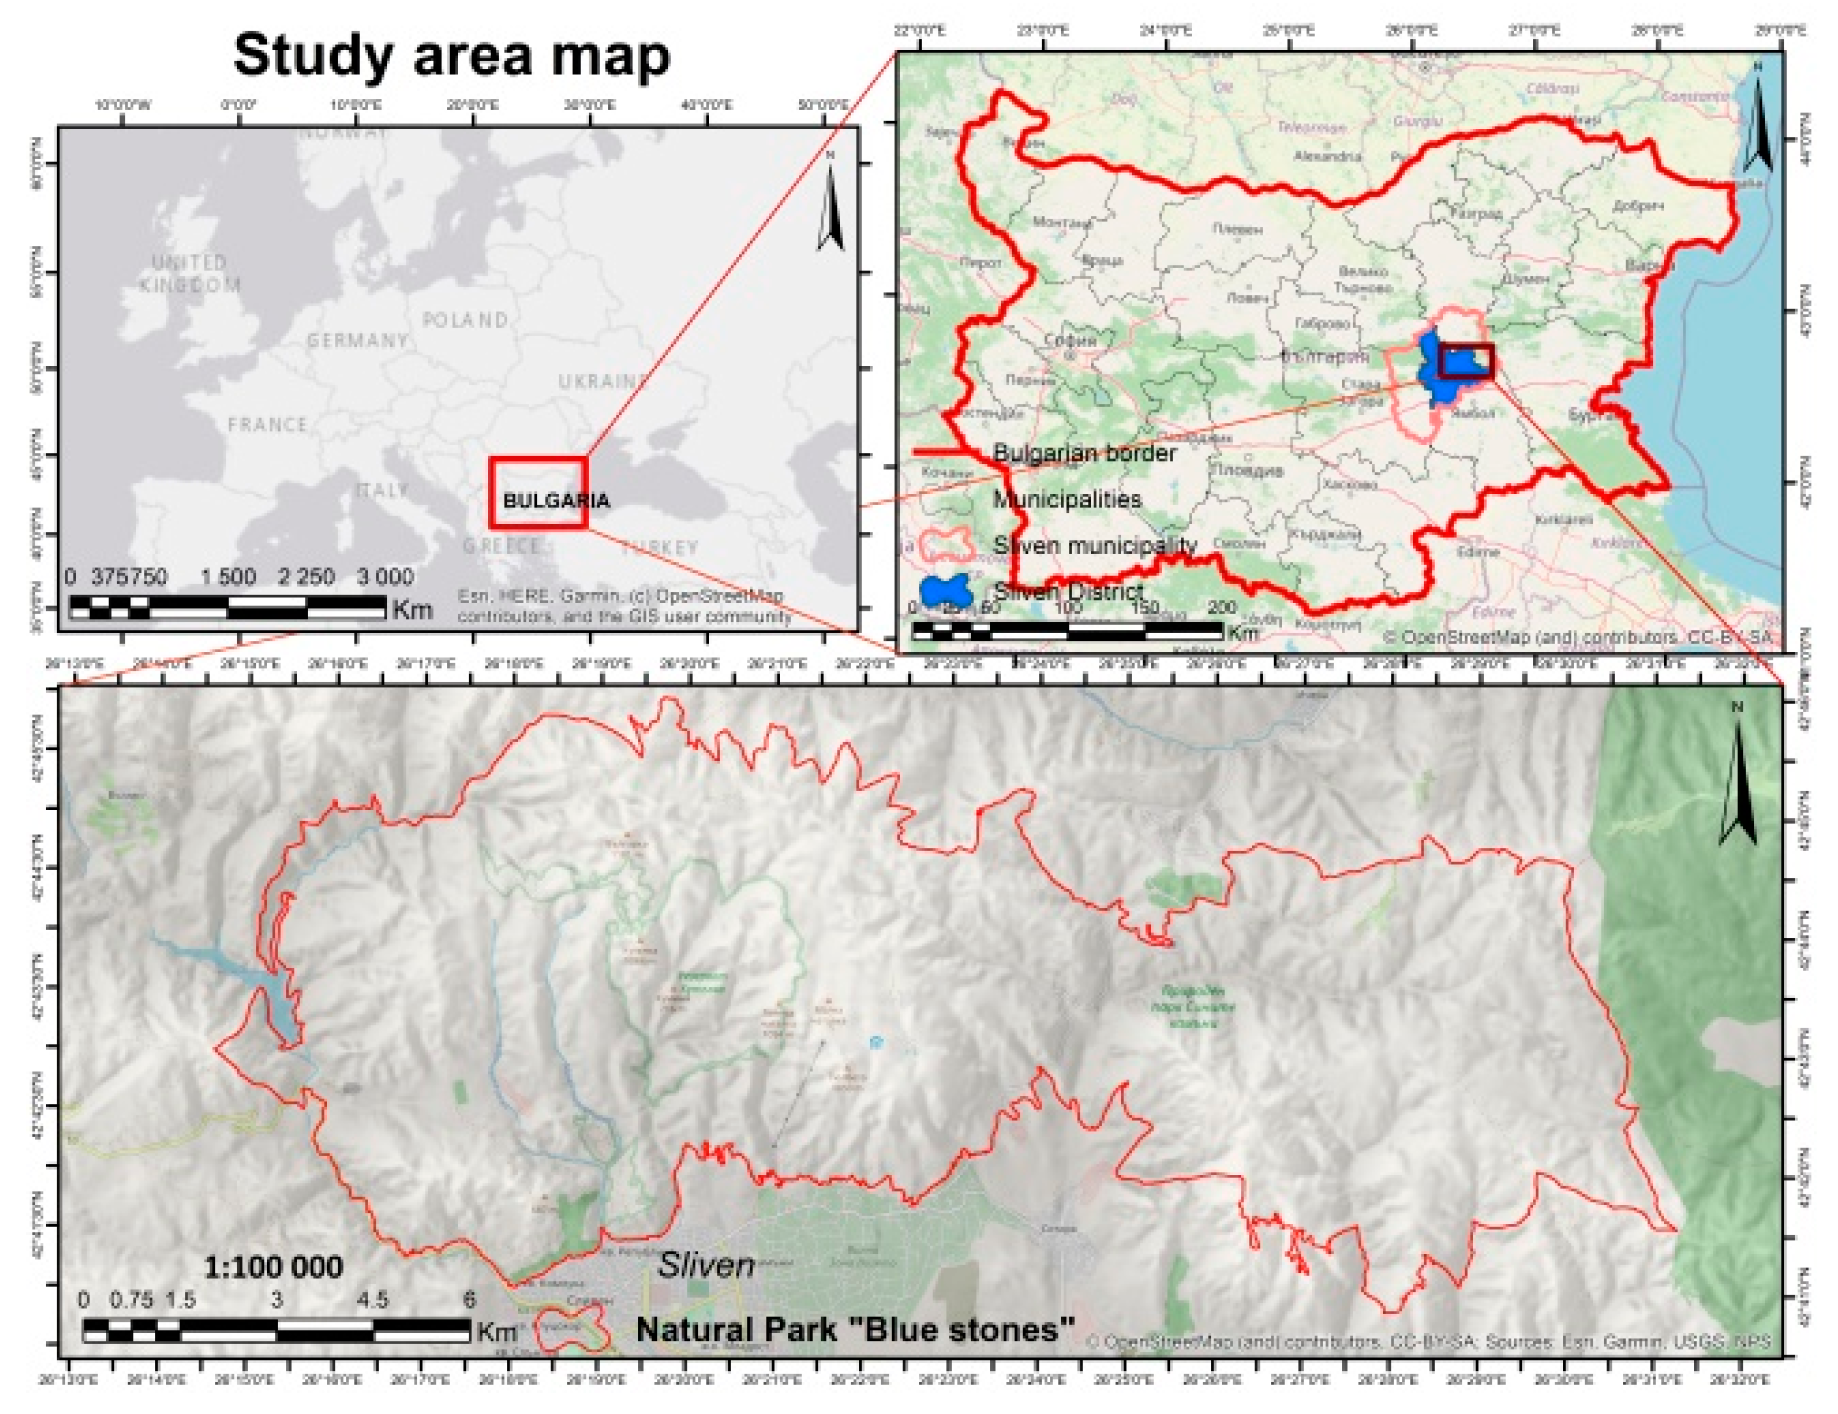
:1. Introduction
2. Materials and Methods
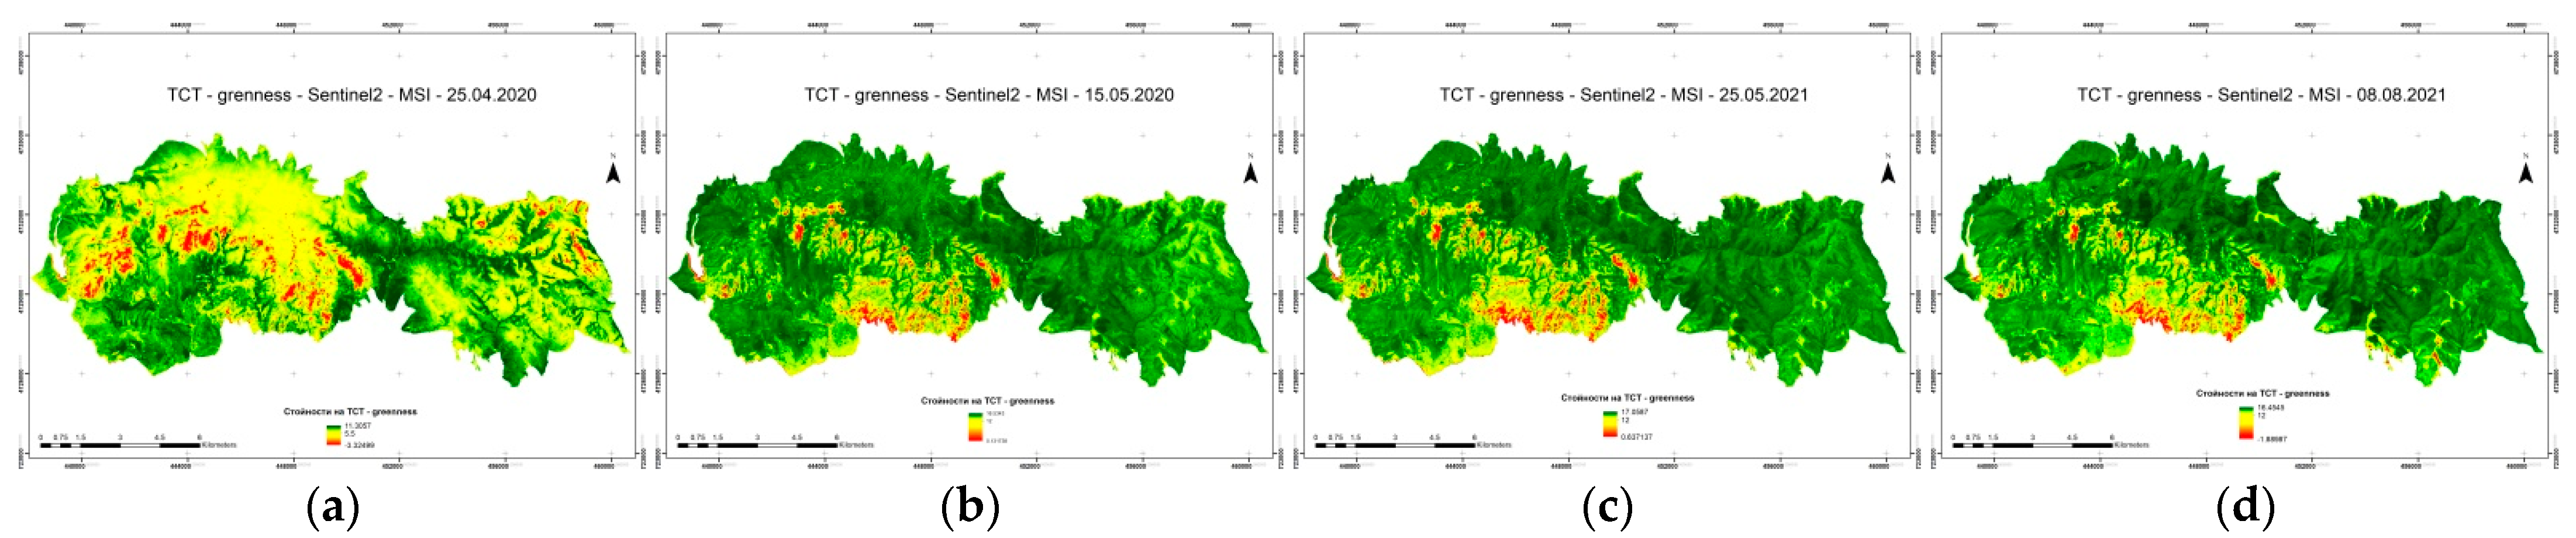
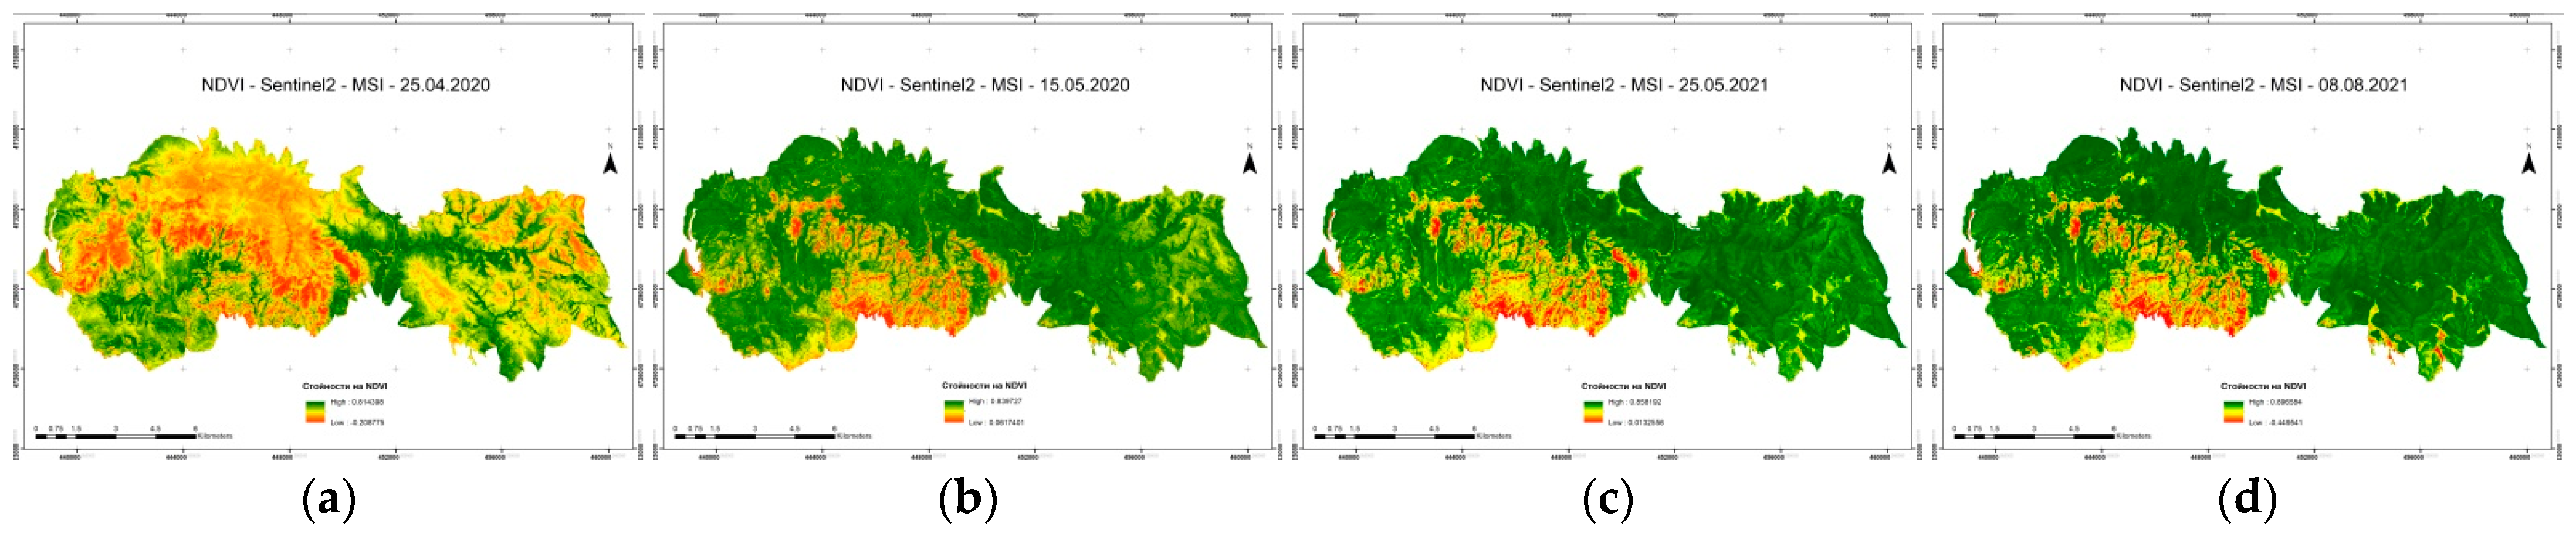
3. Results and Discussion
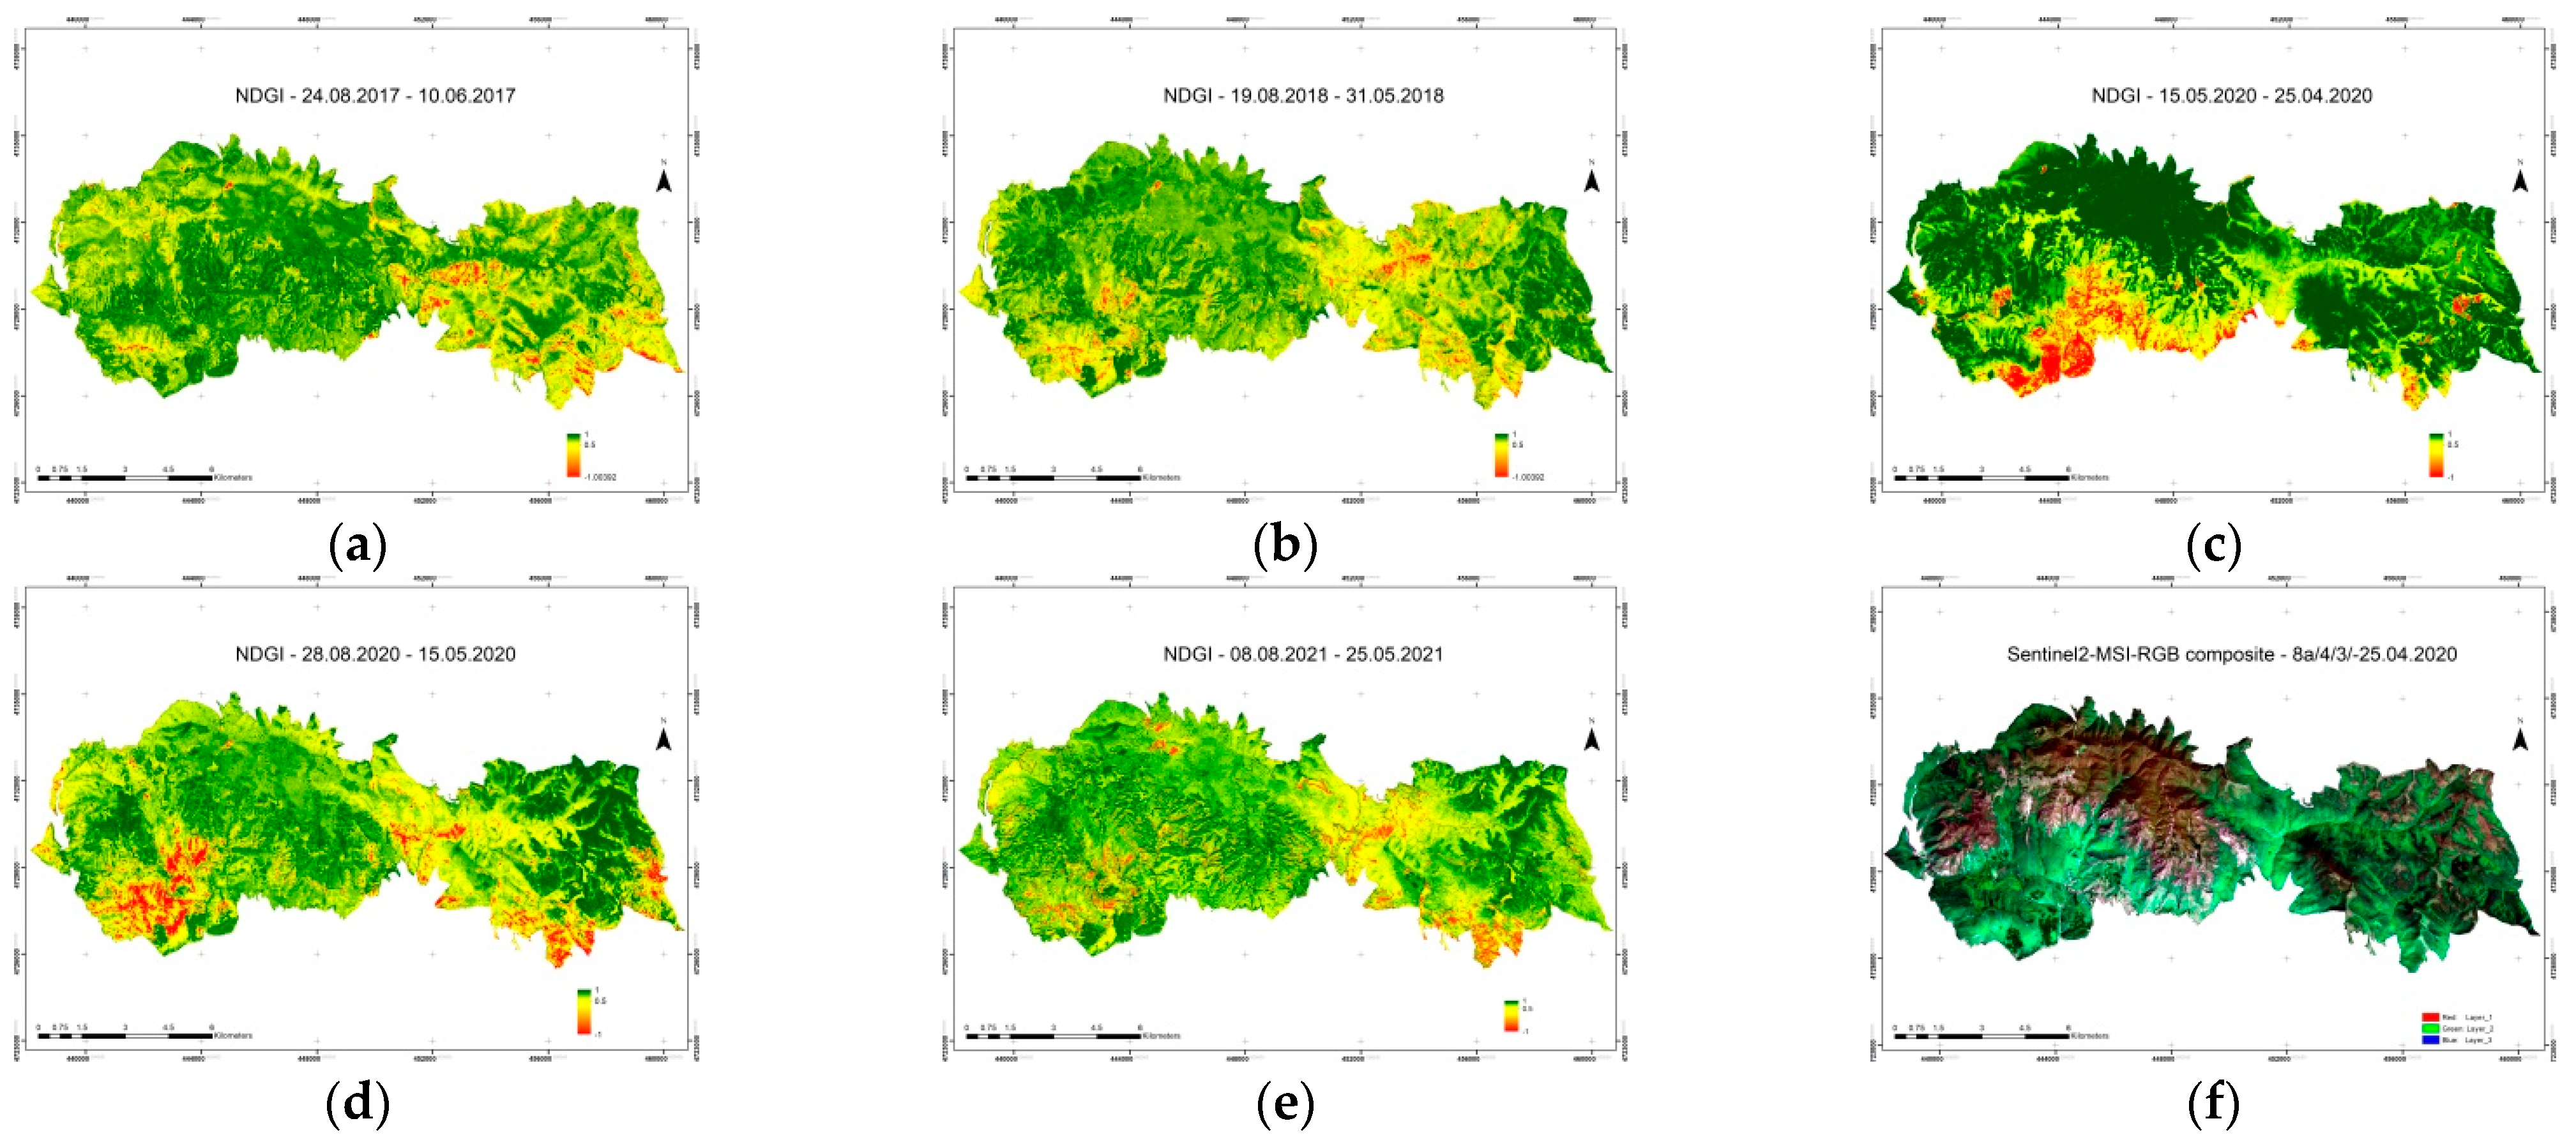
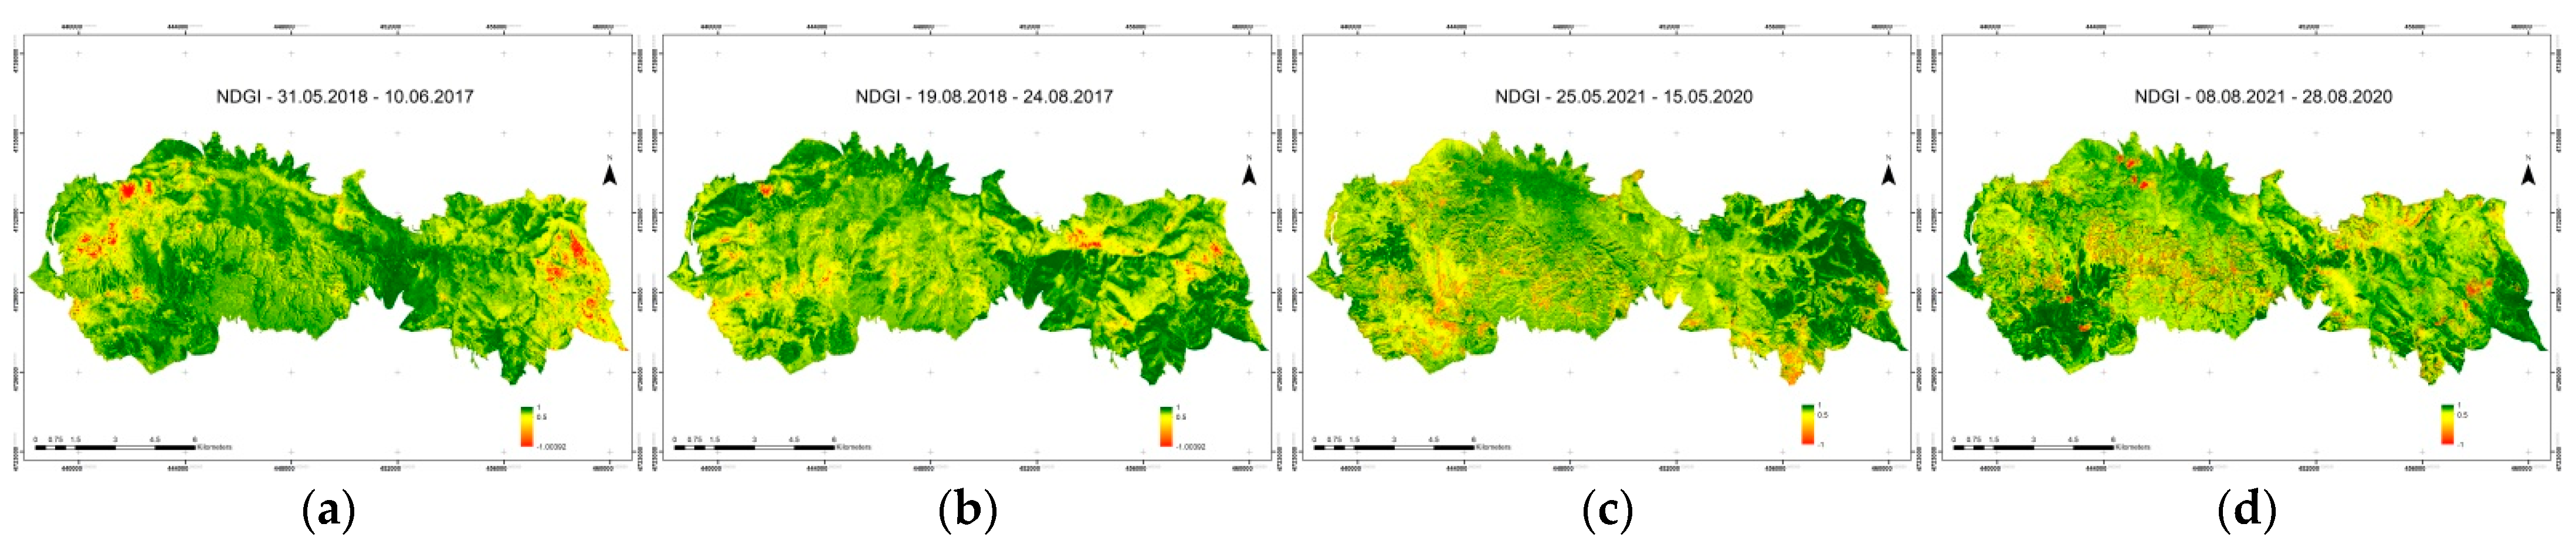
3.1. Short-Term Temporal Periods of NDGI
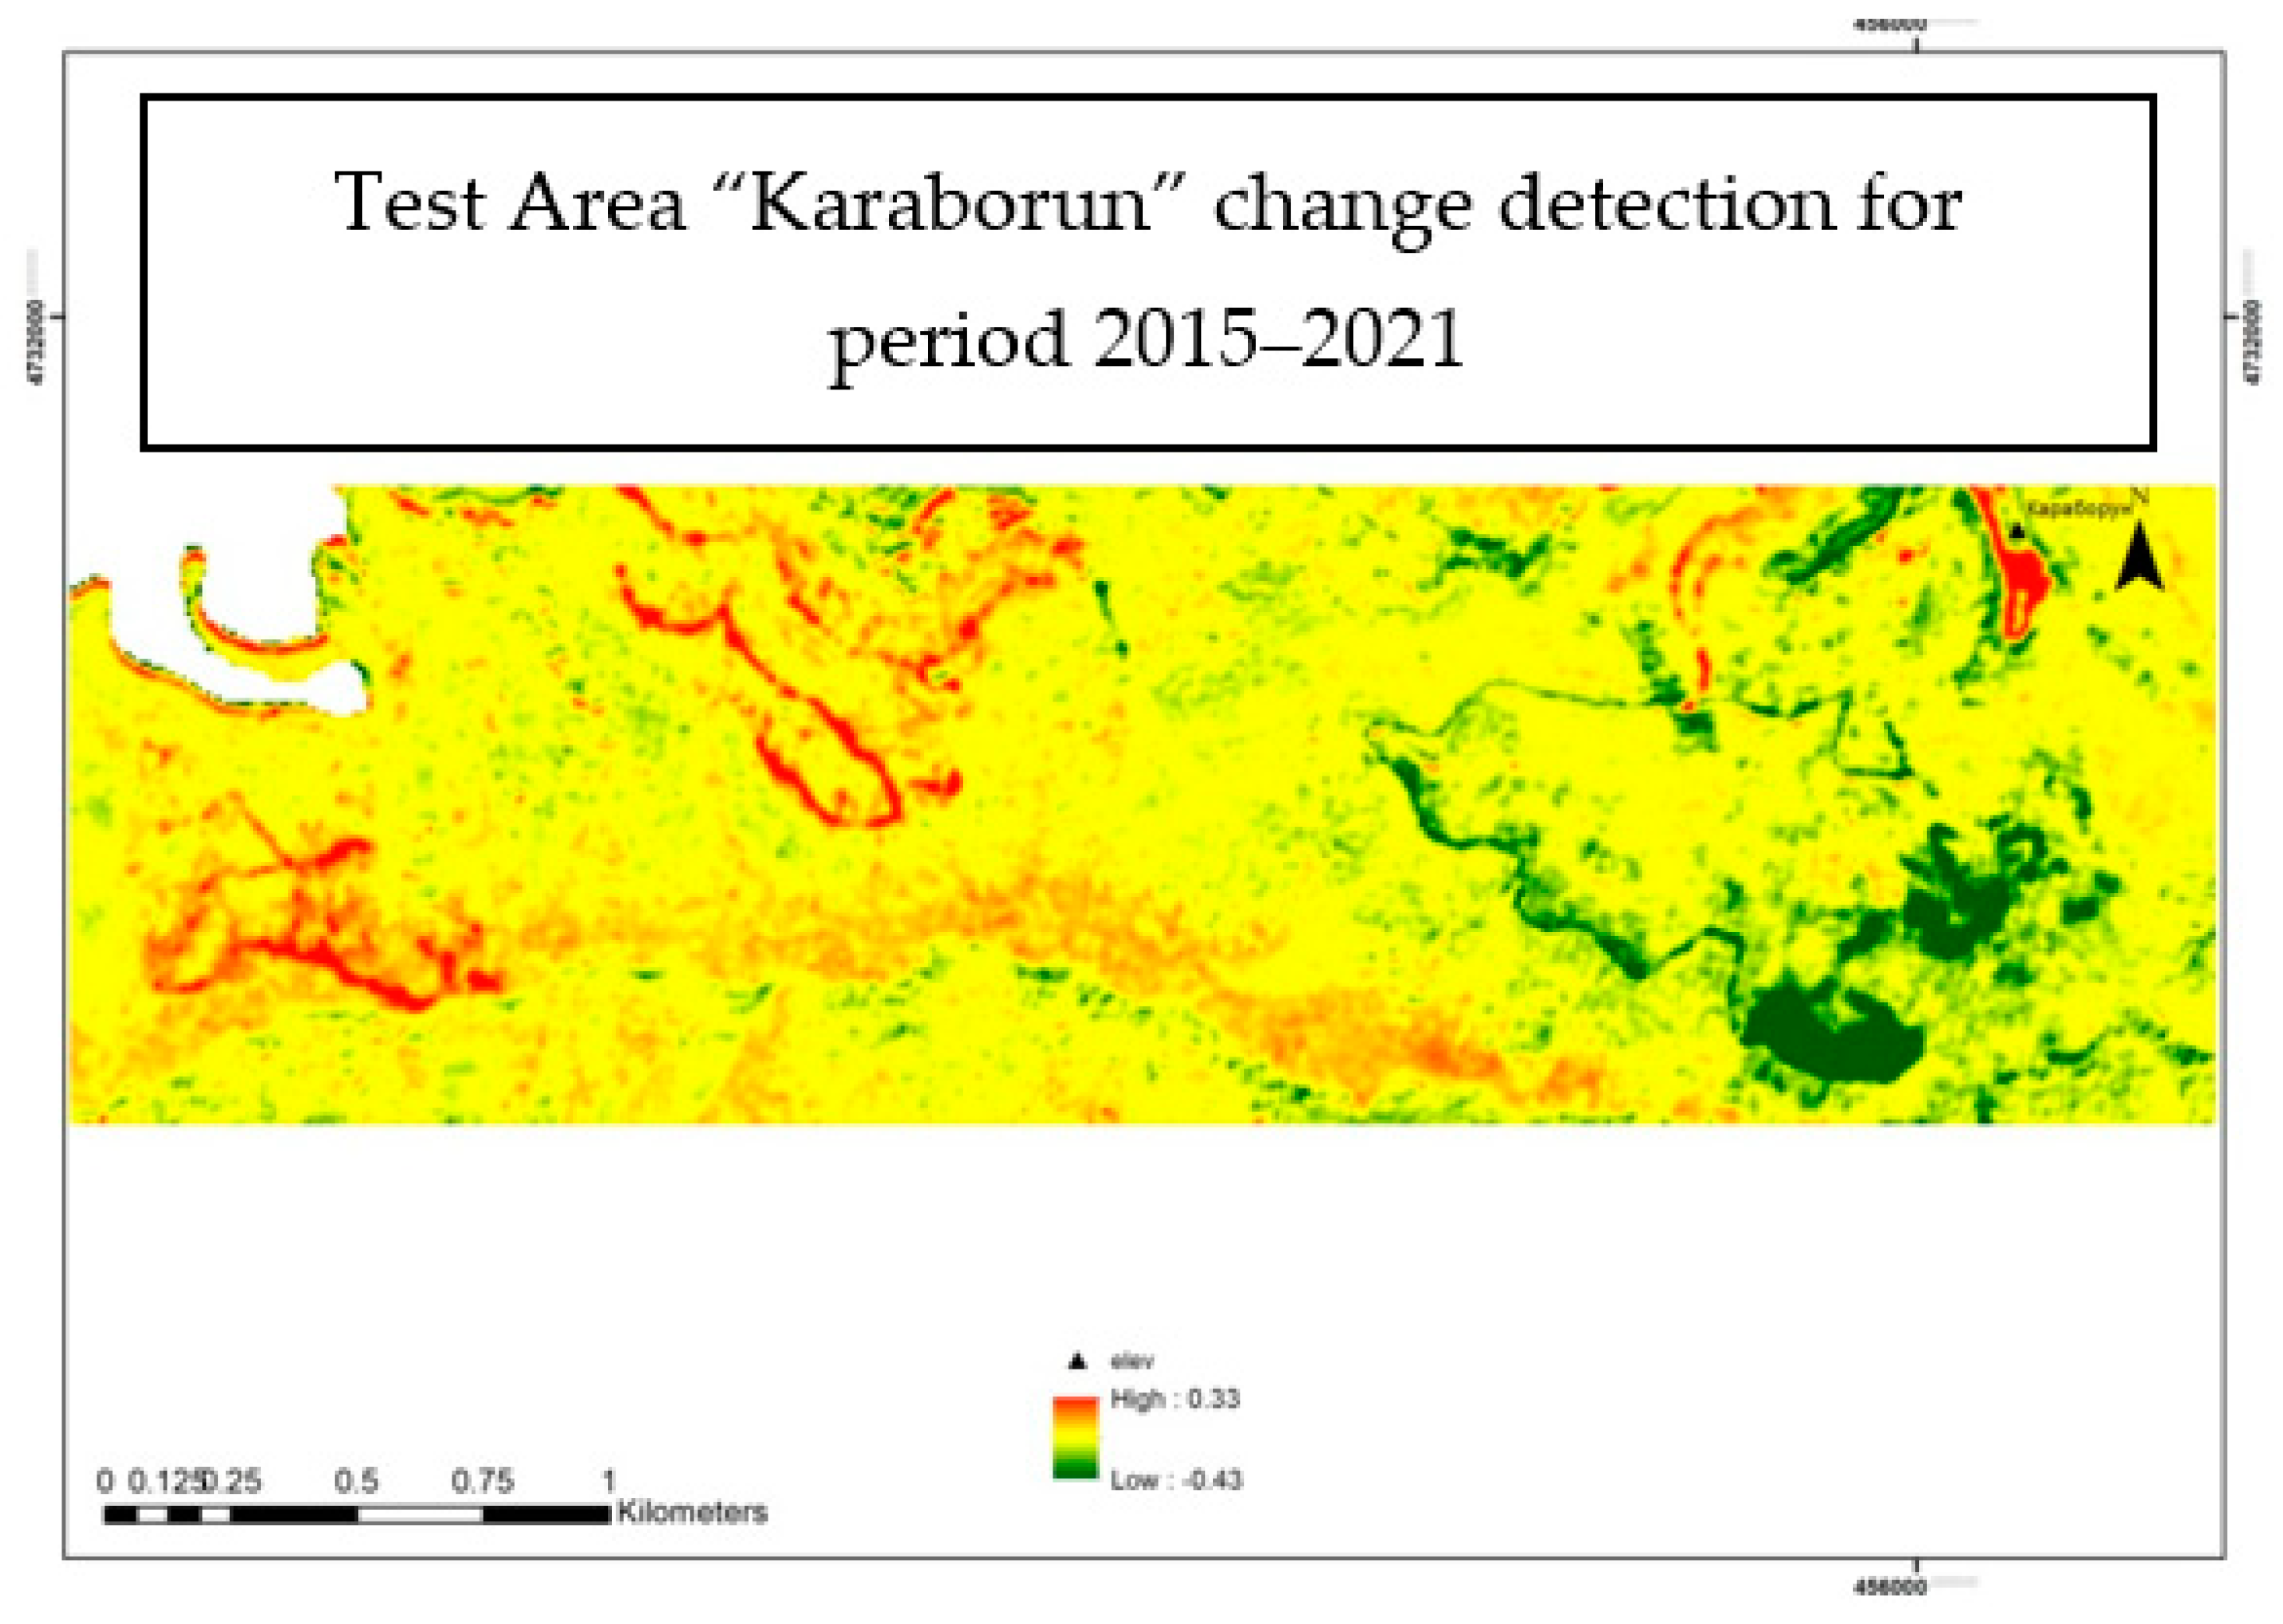
3.2. Long-Term Temporal Periods of NDGI
4. Conclusions
Funding
Institutional Review Board Statement
Informed Consent Statement
Data Availability Statement
Conflicts of Interest
References
- Flora. Available online: http://dppsk.org/en/flora/ (accessed on 10 September 2022).
- Nedkov, R. Orthogonal Transformation of Segmented Images from the Satellite Sentinel-2. In Comptes Rendus de l’Academie Bulgare des Sciences; Bulgarian Academy of Sciences: Sofia, Bulgaria, 2017; Volume 70, pp. 687–692. ISSN 1310–1331. [Google Scholar]
- Kauth, R.J.; Thomas, G.S. Tasselled Cap—A graphic description of the spactral-temporal developement of agricultural crops as seen by Landsat. In Symposium on Machine Processing of Remotely Sensed Data, Proceedings of the NTC Conference Record—National Telecommunications Conference, West Lafayette, IN, USA, 29 June–1 July 1976; IEEE: West Lafayette, IN, USA, 1976; pp. 41–51. [Google Scholar]
- Yarbrough, L.D. The Legacy of the Tasseled Cap Transform: A Development of a More Robust Kauth-Thomas Transform Derivation. Ph.D. Thesis, The University of Mississippi, Oxford, MS, USA, 2006. [Google Scholar]
- Crist, E.P.; Cicone, R.C. Application of the Tasseled Cap concept to simulated Thematic Mapper data. Photogramm. Eng. Remote Sens. 1984, 50, 343–352. [Google Scholar]
- Baig, M.H.A.; Zhang, L.; Shuai, T.; Tong, Q. Derivation of a tasselled cap transformation based on Landsat 8 at-satellite reflectance. Remote Sens. Lett. 2014, 5, 423–431. [Google Scholar] [CrossRef]
- Sentinel-2. Available online: https://sentinel.esa.int/web/sentinel/missions/sentinel-2 (accessed on 12 September 2022).
- Nedkov, R. Normalized Differential Greenness Index for Vegetation Dynamics Assessment. In Comptes rendus de l’Academie bulgare des Sciences; Bulgarian Academy of Sciences: Sofia, Bulgaria, 2017; Volume 70, pp. 1143–1146. ISSN 1310–1331. [Google Scholar]
- Stankova, N.; Nedkov, R. Monitoring forest regrowth with different burn severity using aerial and Landsat data. In Proceedings of the IEEE International Symposium on Geoscience and Remote Sensing (IGARSS), Milan, Italy, 26–31 July 2015; pp. 2166–2169. [Google Scholar] [CrossRef]
- Daniela, A.; Roumen, N. Monitoring the dynamics of phenological development of winter wheat using orthogonalization of multispectral satellite data. In Proceedings of the SPIE, Remote Sensing for Agriculture, Ecosystems, and Hydrology XXII, online, 20 September 2020; Volume 11528. [Google Scholar] [CrossRef]
- Roumen, N.; Emiliya, V.; Daniela, A.; Nikolay, G. Assessment of forest vegetation state through remote sensing in response to fire impact. In Proceedings of the SPIE, Eighth International Conference on Remote Sensing and Geoinformation of the Environment (RSCy2020), Paphos, Cyprus, 26 August 2020; Volume 11524. [Google Scholar] [CrossRef]
- Emiliya, V.; Roumen, N.; Daniela, A.; Kameliya, R.; Andrey, S.; Nikolai, G.; Iliyana, G. Application of remote sensing techniques for monitoring of the climatic parameters in forest fire vulnerable regions in Bulgaria. In Proceedings of the SPIE, Seventh International Conference on Remote Sensing and Geoinformation of the Environment (RSCy2019), Paphos, Cyprus, 27 June 2019; Volume 11174. [Google Scholar] [CrossRef]


| Satellite, Sensor | Date of Aquisition | Spectral Band | GSD (m) |
|---|---|---|---|
| Sentinel 2-MSI | 10 June 2017 24 August 2017 31 May 2018 19 August 2018 | All spectral channels [7] | 10 × 10 20 × 20 60 × 60 |
| 25 April 2020 15 May 2020 28 August 2020 25 May 2021 08 August 2021 |
Publisher’s Note: MDPI stays neutral with regard to jurisdictional claims in published maps and institutional affiliations. |
© 2022 by the author. Licensee MDPI, Basel, Switzerland. This article is an open access article distributed under the terms and conditions of the Creative Commons Attribution (CC BY) license (https://creativecommons.org/licenses/by/4.0/).
Share and Cite
Stoyanov, A. Application of Tasseled Cap Transformation of Sentinel-2—MSI Data for Forest Monitoring and Change Detection on Territory of Natural Park “BLUE STONES”. Environ. Sci. Proc. 2022, 22, 42. https://doi.org/10.3390/IECF2022-13073
Stoyanov A. Application of Tasseled Cap Transformation of Sentinel-2—MSI Data for Forest Monitoring and Change Detection on Territory of Natural Park “BLUE STONES”. Environmental Sciences Proceedings. 2022; 22(1):42. https://doi.org/10.3390/IECF2022-13073
Chicago/Turabian StyleStoyanov, Andrey. 2022. "Application of Tasseled Cap Transformation of Sentinel-2—MSI Data for Forest Monitoring and Change Detection on Territory of Natural Park “BLUE STONES”" Environmental Sciences Proceedings 22, no. 1: 42. https://doi.org/10.3390/IECF2022-13073