
Spatial Dynamics of Tree Stand Disturbance under Siberian Silk Moth (Dendrolimus sibiricus) Impact in Central Siberia in 2016–2020 Based on Remote Sensing Data †

 ,
,  , ,
, ,
Abstract
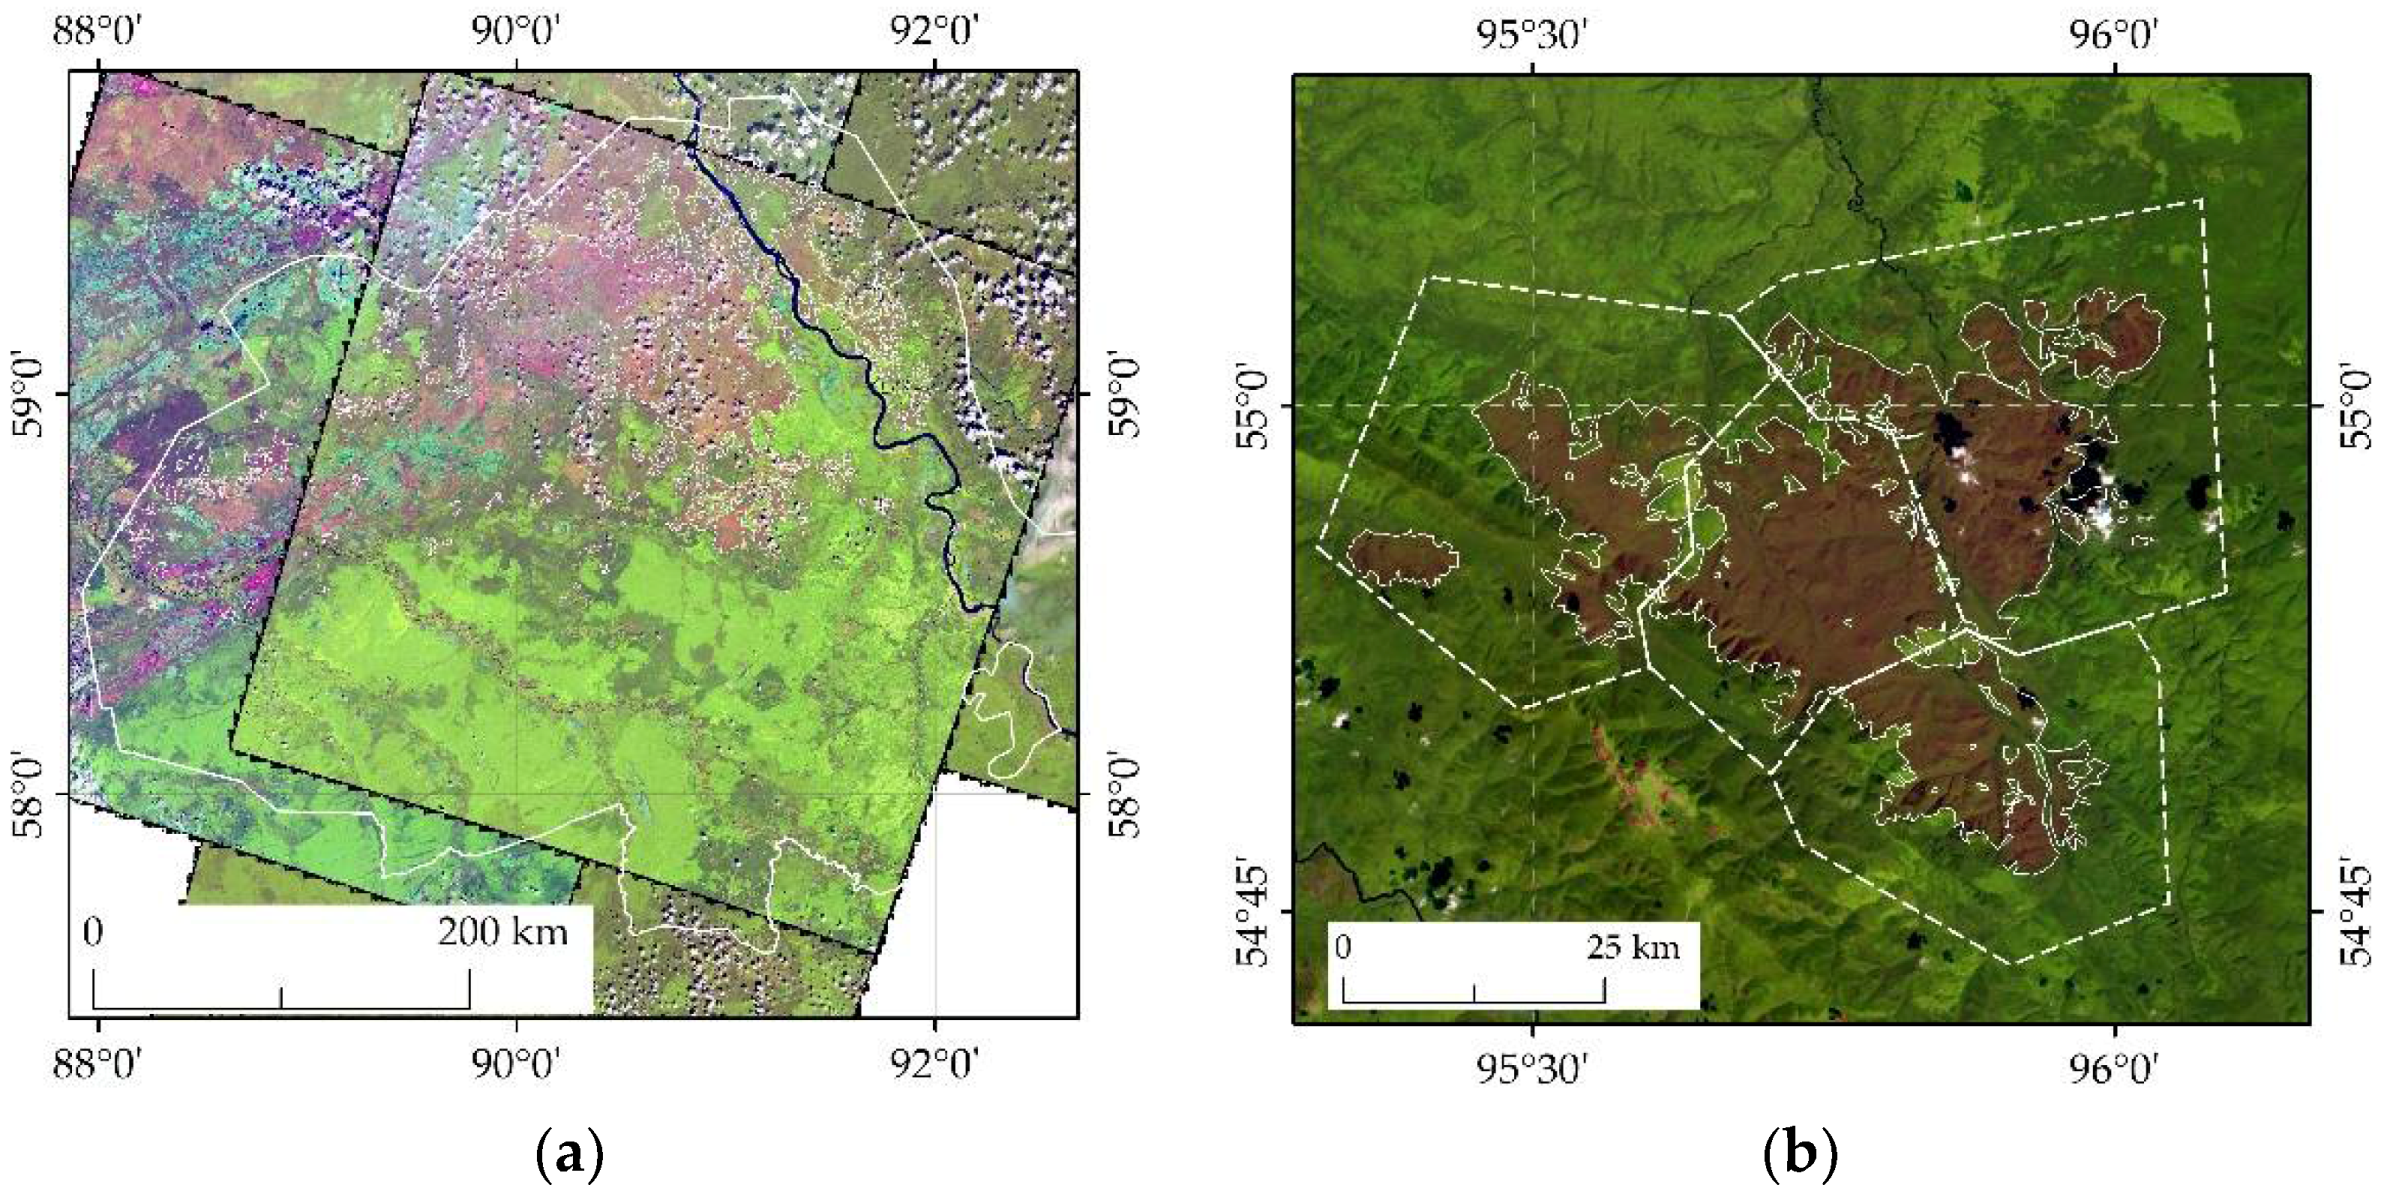
:1. Introduction
2. Material and Methods
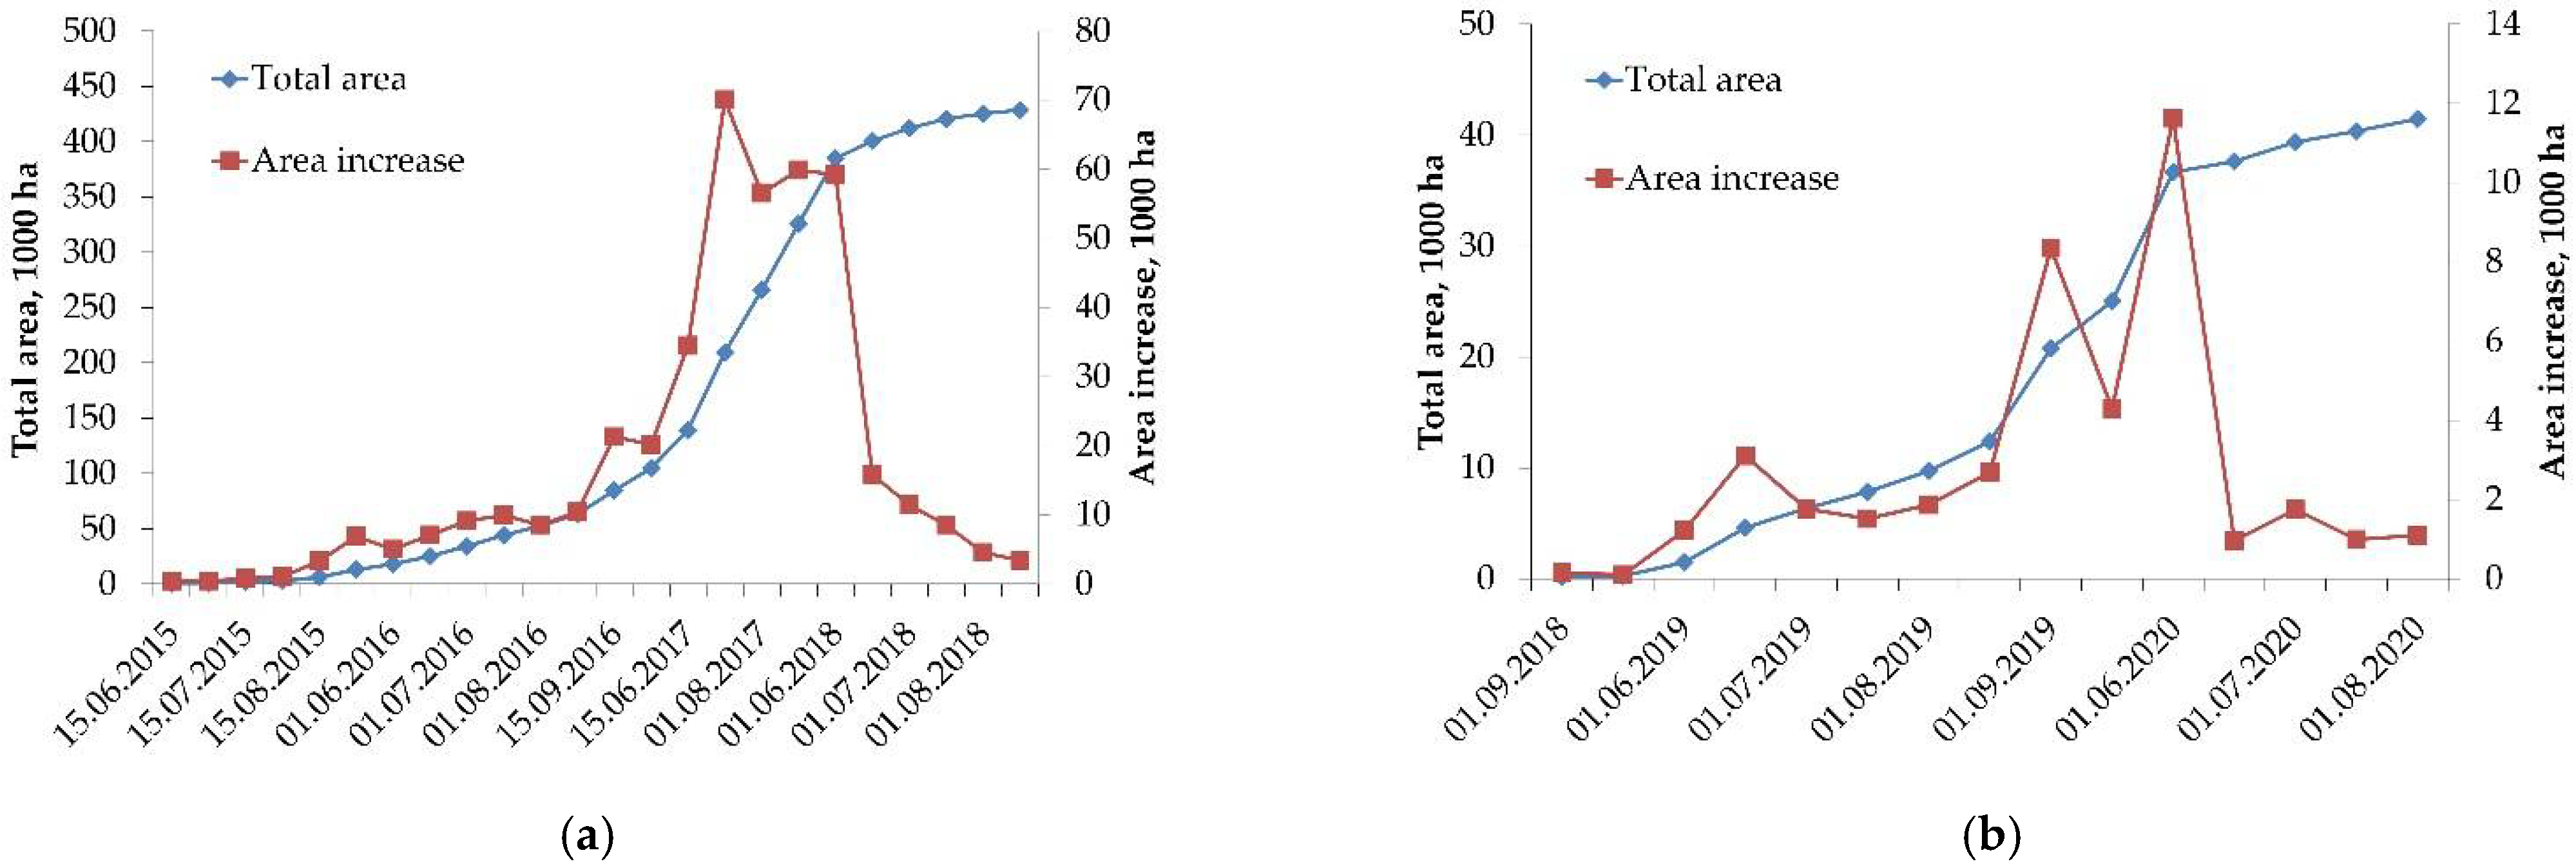
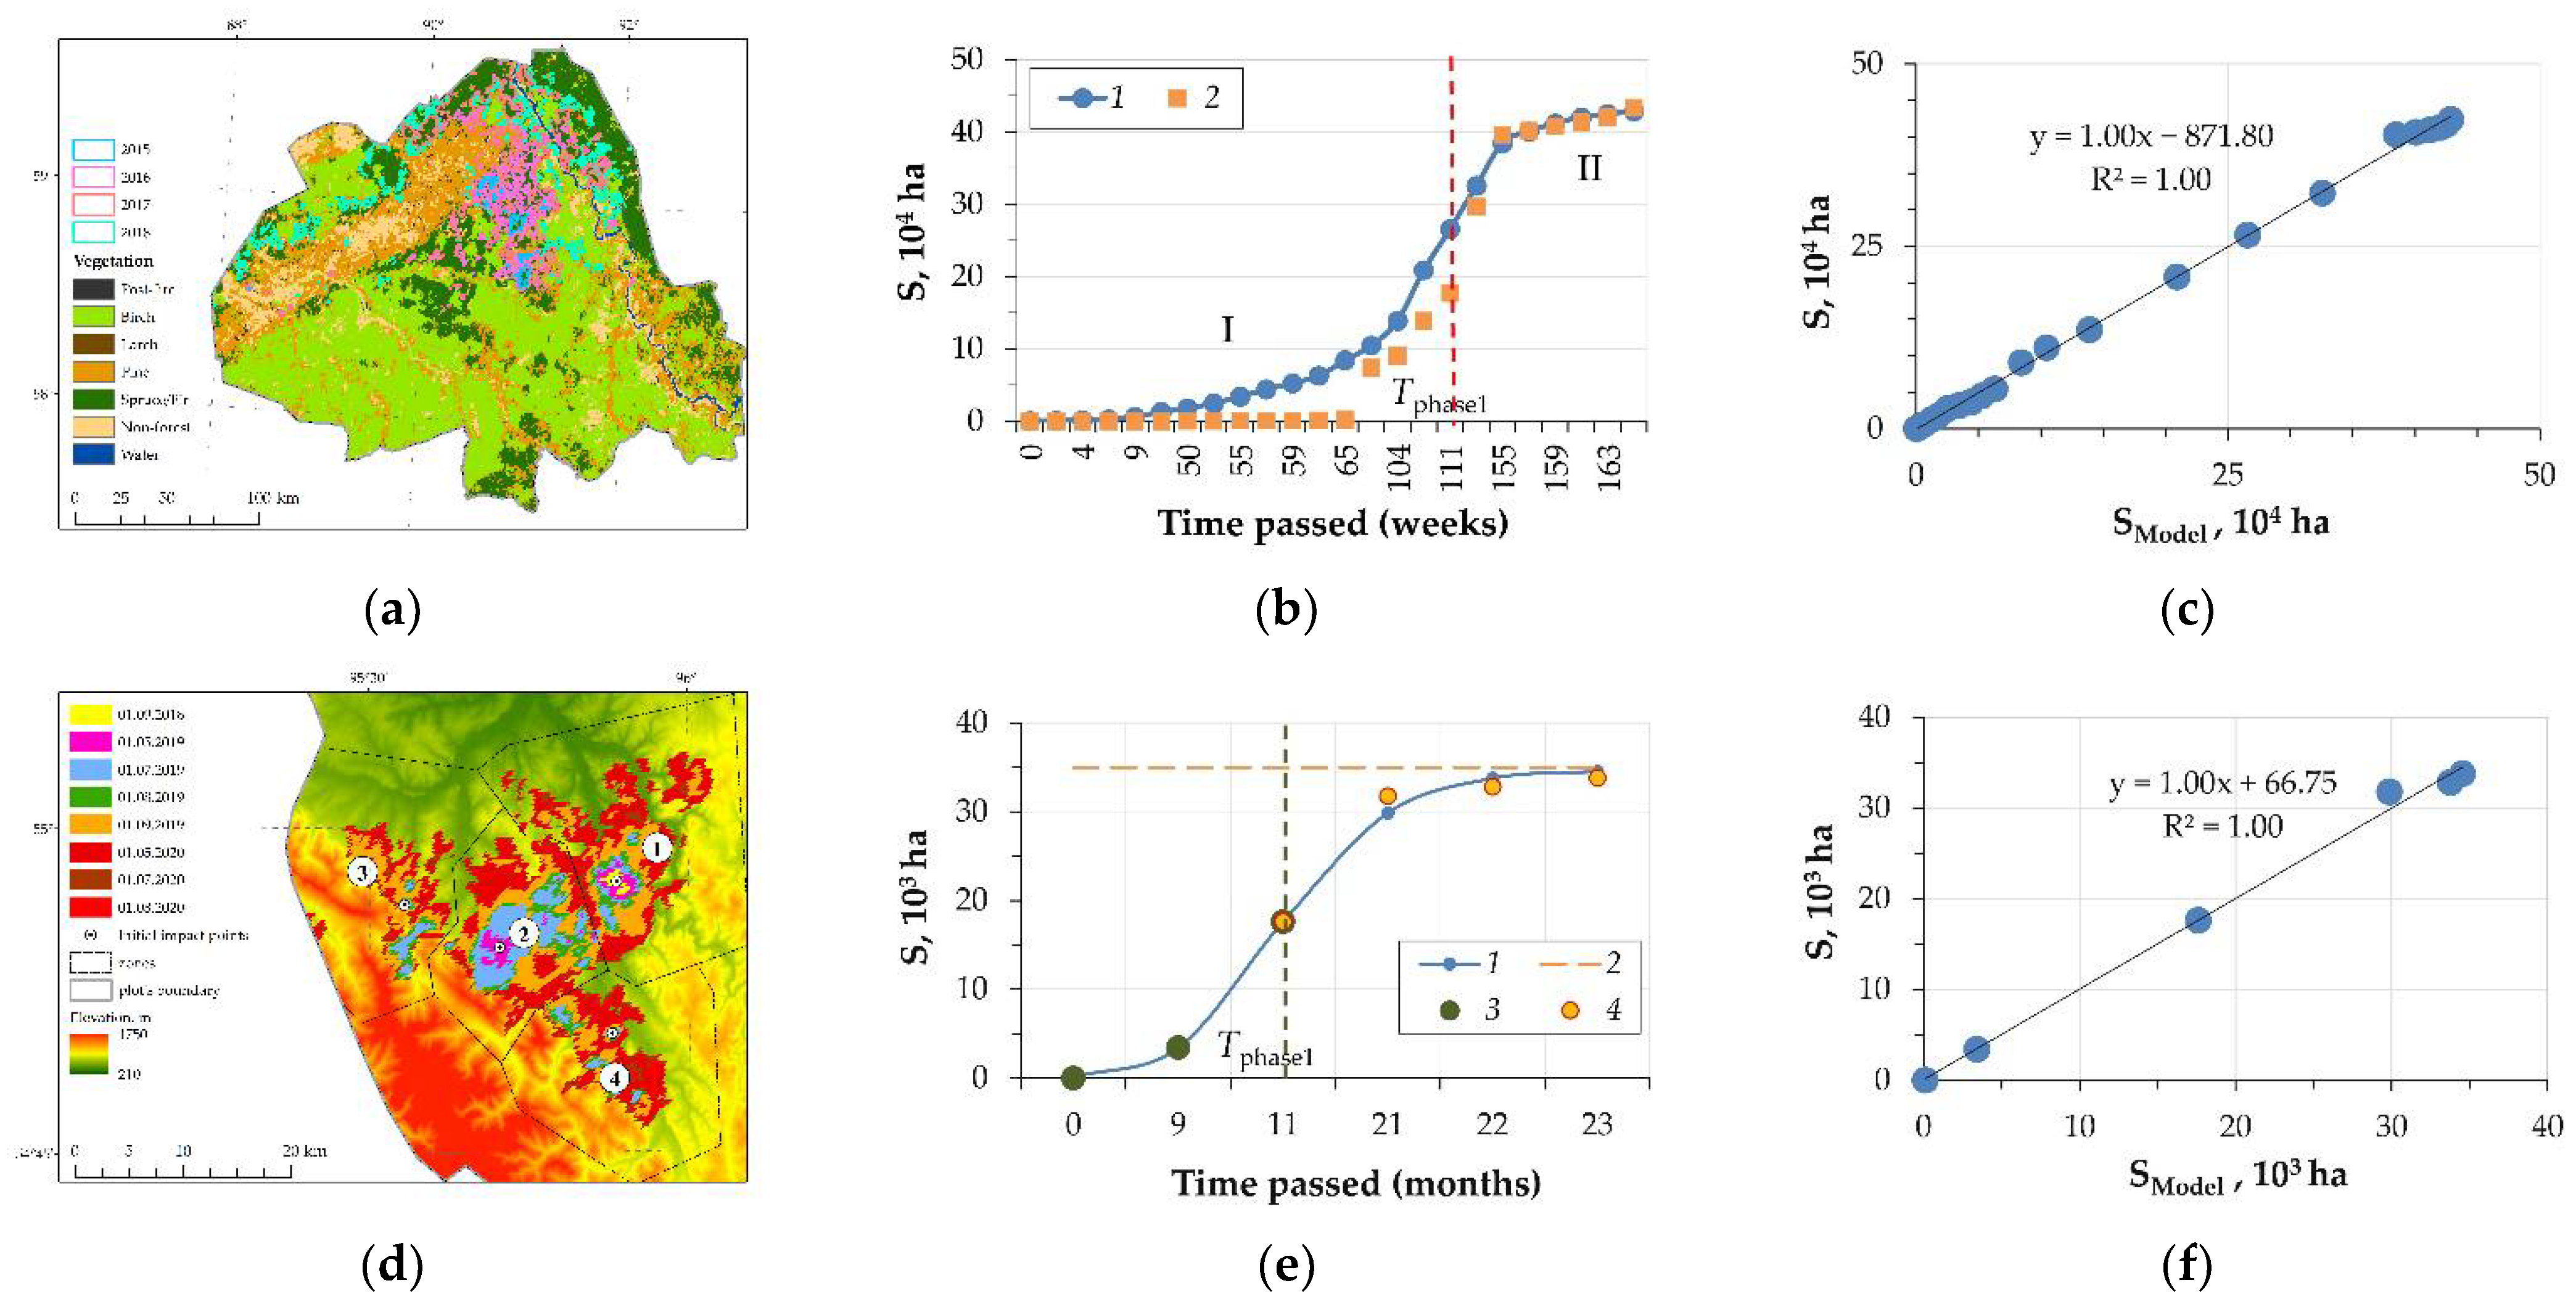
3. Results and Discussion
- (a)
- a phase of increasing rate of disturbed area growth, which is limited by the characteristic of time, Tphase, unique for each case, which is determined by the change of the pattern of the disturbed area growth;
- (b)
- the phase of the decreasing rate of area growth and further “saturation” (the maximum value of the disturbed area for the given case).
4. Conclusions
Author Contributions
Funding
Institutional Review Board Statement
Informed Consent Statement
Data Availability Statement
Acknowledgments
Conflicts of Interest
References
- Kovalev, A.V.; Ovchinnikova, T.M. Development of simulation models for dynamics of forest pest numbers. Contemp. Probl. Ecol. 2010, 2, 27–35. [Google Scholar]
- Morris, R.F. The development of predictive equations for the spruce budworm based on keyfactor analysis. Dyn. Epidemic Spruce Budworm Popul. Mem. Entomol. Soc. Can. 1963, 95, 116–129. [Google Scholar] [CrossRef]
- Mawby, W.D.; Hain, P.P.; Doggett, C.A. Endemic and epidemic populations of southern pine beetle: Implications of the two-phase model for forest managers. For. Sci. 1989, 35, 1075–1087. [Google Scholar]
- Iskhakov, T.R.; Sukhovol’skii, V.G.; Ovchinnikova, T.M.; Tarasova, O.V. A population and energy model of a forest insect outbreak. Biophysics 2007, 52, 440–444. [Google Scholar] [CrossRef]
- Möykkynen, T.; Pukkala, T. Modelling of the spread of a potential invasive pest, the Siberian moth (Dendrolimus sibiricus) in Europe. For. Ecosyst. 2014, 1, 10. [Google Scholar] [CrossRef]
- Mikhailov, J.Z.; Sumina, N.Y. Siberian moth Dendrolimus superans (Butler, 1877) and control of it in Irkutsk region. Bajk. Zool. J. 2012, 3, 25–29. (In Russia) [Google Scholar]
- Leontiev, D.F. Distribution and forecasting of the population of the Siberian silkmoth (scientific review). Intern. J. Appl. Fundam. Res. 2015, 11, 705–709. (In Russian) [Google Scholar]
- Pavlov, I.N.; Litovka, Y.A.; Golubev, D.V.; Astapenko, S.A.; Chromogin, P.V. New outbreak of Dendrolimus sibiricus tschetv. in Siberia (2012–2017): Monitoring, modeling and biological control. Contemp. Probl. Ecol. 2018, 11, 406–419. [Google Scholar] [CrossRef]
- Lyamtsev, N.I. Assessment and forecast of Siberian moth mass propagation risks in the Krasnoyarsk krai forests. Izv. St.-Peterbg. Lesoteh. Akad. 2019, 228, 294–311. (In Russian) [Google Scholar] [CrossRef]
- Sultson, S.M.; Goroshko, A.A.; Verkhovets, S.V.; Mikhaylov, P.V.; Ivanov, V.A.; Demidko, D.A.; Kulakov, S.S. Orographic Factors as a Predictor of the Spread of the Siberian Silk Moth Outbreak in the Mountainous Southern Taiga Forests of Siberia. Land 2021, 10, 115. [Google Scholar] [CrossRef]
- Sultson, S.M.; Goroshko, A.A.; Mikhaylov, P.V.; Demidko, D.A.; Ponomarev, E.; Verkhovets, S.V. Improving the Monitoring System towards Early Detection and Prediction of the Siberian Moth Outbreaks in Eastern Siberia. Proceedings 2021, 68, 5. [Google Scholar] [CrossRef]
- Kovalev, A.; Soukhovolsky, V. Analysis of Forest Stand Resistance to Insect Attack According to Remote Sensing Data. Forests 2021, 12, 1188. [Google Scholar] [CrossRef]
- Fedotova, E.V.; Im, S.T.; Kharuk, V.I. Analysis of the spatial confinement of areas of taiga forests disturbed by the Siberian silk moth according to small-scale remote sensing data. Interexpo GEO-Sib. 2007, 2, 206–210. (In Russia) [Google Scholar]
- Im, S.T.; Fedotova, E.V.; Kharuk, V.I. Spectrodiametric satellite imagery in the analysis of the outbreak zone of mass reproduction of the Siberian silk moth. J. Sib. Fed. Univ. Eng. Technol. 2008, 1, 346–358. (In Russia) [Google Scholar]
- Wolfe, R.E.; Roy, D.P.; Vermote, E. MODIS Land Data Storage, Gridding, and Compositing Methodology: Level 2 Grid. IEEE Trans. Geosci. Remote Sens. 1998, 36, 1324–1338. [Google Scholar] [CrossRef]
- Didan, K.; Munoz, A.B.; Solano, R.; Huete, A. MODIS Vegetation Index User’s Guide Version 3.00, June 2015 (Collection 6). Available online: https://vip.arizona.edu/documents/MODIS/MODIS_VI_UsersGuide_June_2015_C6.pdf (accessed on 10 October 2022).
- Knyazeva, S.V.; Koroleva, N.V.; Eidlina, S.P.; Sochilova, E.N. Health of vegetation in the area of mass outbreaks of Siberian moth based on satellite data. Contemp. Probl. Ecol. 2019, 12, 743–752. [Google Scholar] [CrossRef]
- Kharuk, V.I.; Ranson, K.J.; Im, S.T. Siberian silkmoth outbreak pattern analysis based on SPOT VEGETATION data. Int. J. Remote Sens. 2009, 30, 2377–2388. [Google Scholar] [CrossRef]
- Bartalev, S.; Egorov, V.; Zharko, V.; Loupian, E.; Plotnikov, D.; Khvostikov, S.; Shabanov, N. Land Cover Mapping over Russia Using Earth Observation Data; Russian Academy of Sciences’ Space Research Institute: Moscow, Russia, 2016; p. 208. (In Russia) [Google Scholar]
- Kharuk, V.I.; Antamoshkina, O.A. Impact of Silkmoth Outbreak on Taiga Wildfires. Contemp. Probl. Ecol. 2017, 10, 556–562. [Google Scholar] [CrossRef]
- Bartalev, S.A.; Stytsenko, F.V. An assessment of the forest stands destruction by fires basedon the remote sensing data on a seasonal distribution of burnt areas. Contemp. Probl. Ecol. 2021, 2, 115–122. [Google Scholar] [CrossRef]
- Vaganov, E.A.; Shashkin, A.V.; Kharuk, V.I.; Khlebopros, R.G.; Sukhovolsky, V.G.; Gaevsky, N.A.; Degermendzhi, A.G.; Gubanov, V.G. Ecological Biophysics. Vol. 2. Biophysics of Land and Water Ecosystems; Gitelzon, I.I., Pechurkin, N.S., Eds.; Logos: Moscow, Russia, 2002; 360p, ISBN 5-94010-073-2. (In Russia) [Google Scholar]
- Kharuk, V.I.; Demidko, D.A.; Fedotova, E.V.; Dvinskaya, M.L.; Budnik, U.A. Spatial and temporal dynamics of Siberian silk moth large-scale outbreak in dark-needle coniferous tree stands in Altai. Contemp. Probl. Ecol. 2016, 9, 711–720. [Google Scholar] [CrossRef]
- Kharuk, V.I.; Im, S.T.; Soldatov, V.V. Siberian silkmoth outbreaks surpassed geoclimatic barrier in Siberian Mountains. J. Mt. Sci. 2020, 17, 1891–1900. [Google Scholar] [CrossRef]
- Loupian, E.A.; Bourtsev, M.A.; Proshin, A.A.; Kashnitskiy, A.V.; Balashov, I.V.; Bartalev, S.A.; Konstantinova, A.M.; Kobets, D.A.; Radchenko, M.V.; Tolpin, V.A.; et al. Usage Experience and Capabilities of the VEGA-Science System. Remote Sens. 2022, 14, 77. [Google Scholar] [CrossRef]
- Abrams, M.; Crippen, R.; Fujisada, H. ASTER Global Digital Elevation Model (GDEM) and ASTER Global Water Body Dataset (ASTWBD). Remote Sens. 2020, 12, 1156. [Google Scholar] [CrossRef]


| IrP, 2018–2020 | ||||
| Model | Model Coefficients (2) | |||
| Phase I: Aexp(Bx + C) + D | A | B | C | D |
| 0.91 | 0.82 | 0.86 | 1.00 | |
| Phase II: E ln(Fx + G) + H | E | F | G | H |
| 22,497.42 | 0.187 | 0.07 | 558.35 | |
| EnP, 2015–2018, Tphase = 111 weeks | ||||
| Model | Model Coefficients (2) | |||
| Phase I: Aexp(Bx + C) + D | A | B | C | D |
| 0.989 | 0.100 | 0.986 | 1.00 | |
| Phase II: E ln(Fx + G) + H | E | F | G | H |
| 60.903 | 0.007 | 7.704 | 0.101 | |
Disclaimer/Publisher’s Note: The statements, opinions and data contained in all publications are solely those of the individual author(s) and contributor(s) and not of MDPI and/or the editor(s). MDPI and/or the editor(s) disclaim responsibility for any injury to people or property resulting from any ideas, methods, instructions or products referred to in the content. |
© 2022 by the authors. Licensee MDPI, Basel, Switzerland. This article is an open access article distributed under the terms and conditions of the Creative Commons Attribution (CC BY) license (https://creativecommons.org/licenses/by/4.0/).
Share and Cite
Ponomarev, E.I.; Goroshko, A.A.; Shvetsov, E.G.; Yakimov, N.D.; Tretyakov, P.D.; Sultson, S.M.; Mikhaylov, P.V. Spatial Dynamics of Tree Stand Disturbance under Siberian Silk Moth (Dendrolimus sibiricus) Impact in Central Siberia in 2016–2020 Based on Remote Sensing Data. Environ. Sci. Proc. 2022, 22, 4. https://doi.org/10.3390/IECF2022-13056
Ponomarev EI, Goroshko AA, Shvetsov EG, Yakimov ND, Tretyakov PD, Sultson SM, Mikhaylov PV. Spatial Dynamics of Tree Stand Disturbance under Siberian Silk Moth (Dendrolimus sibiricus) Impact in Central Siberia in 2016–2020 Based on Remote Sensing Data. Environmental Sciences Proceedings. 2022; 22(1):4. https://doi.org/10.3390/IECF2022-13056
Chicago/Turabian StylePonomarev, Evgenii I., Andrey A. Goroshko, Evgeny G. Shvetsov, Nikita D. Yakimov, Pavel D. Tretyakov, Svetlana M. Sultson, and Pavel V. Mikhaylov. 2022. "Spatial Dynamics of Tree Stand Disturbance under Siberian Silk Moth (Dendrolimus sibiricus) Impact in Central Siberia in 2016–2020 Based on Remote Sensing Data" Environmental Sciences Proceedings 22, no. 1: 4. https://doi.org/10.3390/IECF2022-13056