Proceeding Paper

Cover and Land Use Changes in the Dry Forest of Tumbes (Peru) Using Sentinel-2 and Google Earth Engine Data †

1
Dirección de Desarrollo Tecnológico Agrario, Instituto Nacional de Innovación Agraria (INIA), Av. La Molina, 1981, Lima 15024, Peru
2
Instituto de Investigación Para el Desarrollo Sustentable de Ceja de Selva (INDES-CES), Universidad Nacional Toribio Rodríguez de Mendoza de Amazonas, Chachapoyas 01001, Peru
3
Instituto de Investigación en Desarrollo Sostenible y Cambio Climático, Universidad Nacional de Frontera, Av. San Hilarión 101, Sullana 20103, Peru
*
Author to whom correspondence should be addressed.
Presented at the 3rd International Electronic Conference on Forests—Exploring New Discoveries and New Directions in Forests, 15–31 October 2022; Available online: https://iecf2022.sciforum.net/.
Environ. Sci. Proc. 2022, 22(1), 2; https://doi.org/10.3390/IECF2022-13095
Published: 21 October 2022

Abstract

:
Dry forests are home to large amounts of biodiversity, are providers of ecosystem services, and control the advance of deserts. However, globally, these ecosystems are being threatened by various factors such as climate change, deforestation, and land use and land cover (LULC). The objective of this study was to identify the dynamics of LULC changes and the factors associated with the transformations of the dry forest in the Tumbes region (Peru) using Google Earth Engine (GEE). For this, the annual collection of Sentinel 2 (S2) satellite images of 2017 and 2021 was analyzed. Six types of LULC were identified, namely urban area (AU), agricultural land (AL), land without or with little vegetation (LW), water body (WB), dense dry forest (DDF), and open dry forest (ODF). Subsequently, we applied the Random Forest (RF) method for the classification. LULC maps reported accuracies greater than 89%. In turn, the rates of DDF and ODF between 2017 and 2021 remained unchanged at around 82%. Likewise, the largest net change occurred in the areas of WB, AL, and UA, at 51, 22, and 21%, respectively. Meanwhile, forest cover reported a loss of 4% (165.09 km2) of the total area in the analyzed period (2017–2021). The application of GEE allowed for an evaluation of the changes in forest cover and land use in the dry forest, and from this, it provided important information for the sustainable management of this ecosystem.

1. Introduction

The dry forest plays an important role in the provision of ecosystem services such as the conservation of endemic flora and fauna species, medicinal plants, wood, firewood, and plant foods [1,2]. It is made up of deciduous vegetation, where most of the dominant tree species eliminate approximately 75% of their foliage during the long dry period of the year [3,4]. These forests are also recognized as one of the most threatened ecosystems worldwide [4], as they are exposed to many threats such as deforestation, fragmentation, overgrazing, forest fires, droughts, and LULC changes [5,6]. LULC changes exert negative impacts on ecosystems affecting climate, soil, water, and air, which are generally induced by the interaction of demographic, socioeconomic, political, and biophysical factors [7,8]. The LULC changes affect the loss of ecosystems that are transformed into pastures, crops, or new areas of urban expansion. Additionally, they impact protected areas, reporting high rates of forest loss [9].
Currently, the application of remote sensing (RS) tools plays an important role in analyzing the dynamics of LULC changes through the analysis of medium-resolution satellite images such as Landsat and S2 [10]. In recent years, many studies have evaluated the impact of LULC changes in different areas of the world [11,12]. Multi-temporal S2 image processing has been fully exploited on platforms such as GEE [13] through the application of supervised classification using the RF method, with reliable results [14]. In Peru, we find the department of Tumbes, which is home to diverse ecosystems such as the dry forest and a diversity of endemic species [15]. However, the forest is exposed to Many threats and impacts that are related to human activities [16]. For this reason, the objective of this study was to evaluate the changes in LULC in the dry forest of Tumbes (Peru) using S2 data and the GEE platform in the period from 2017 to 2021.

2. Materials and Methods
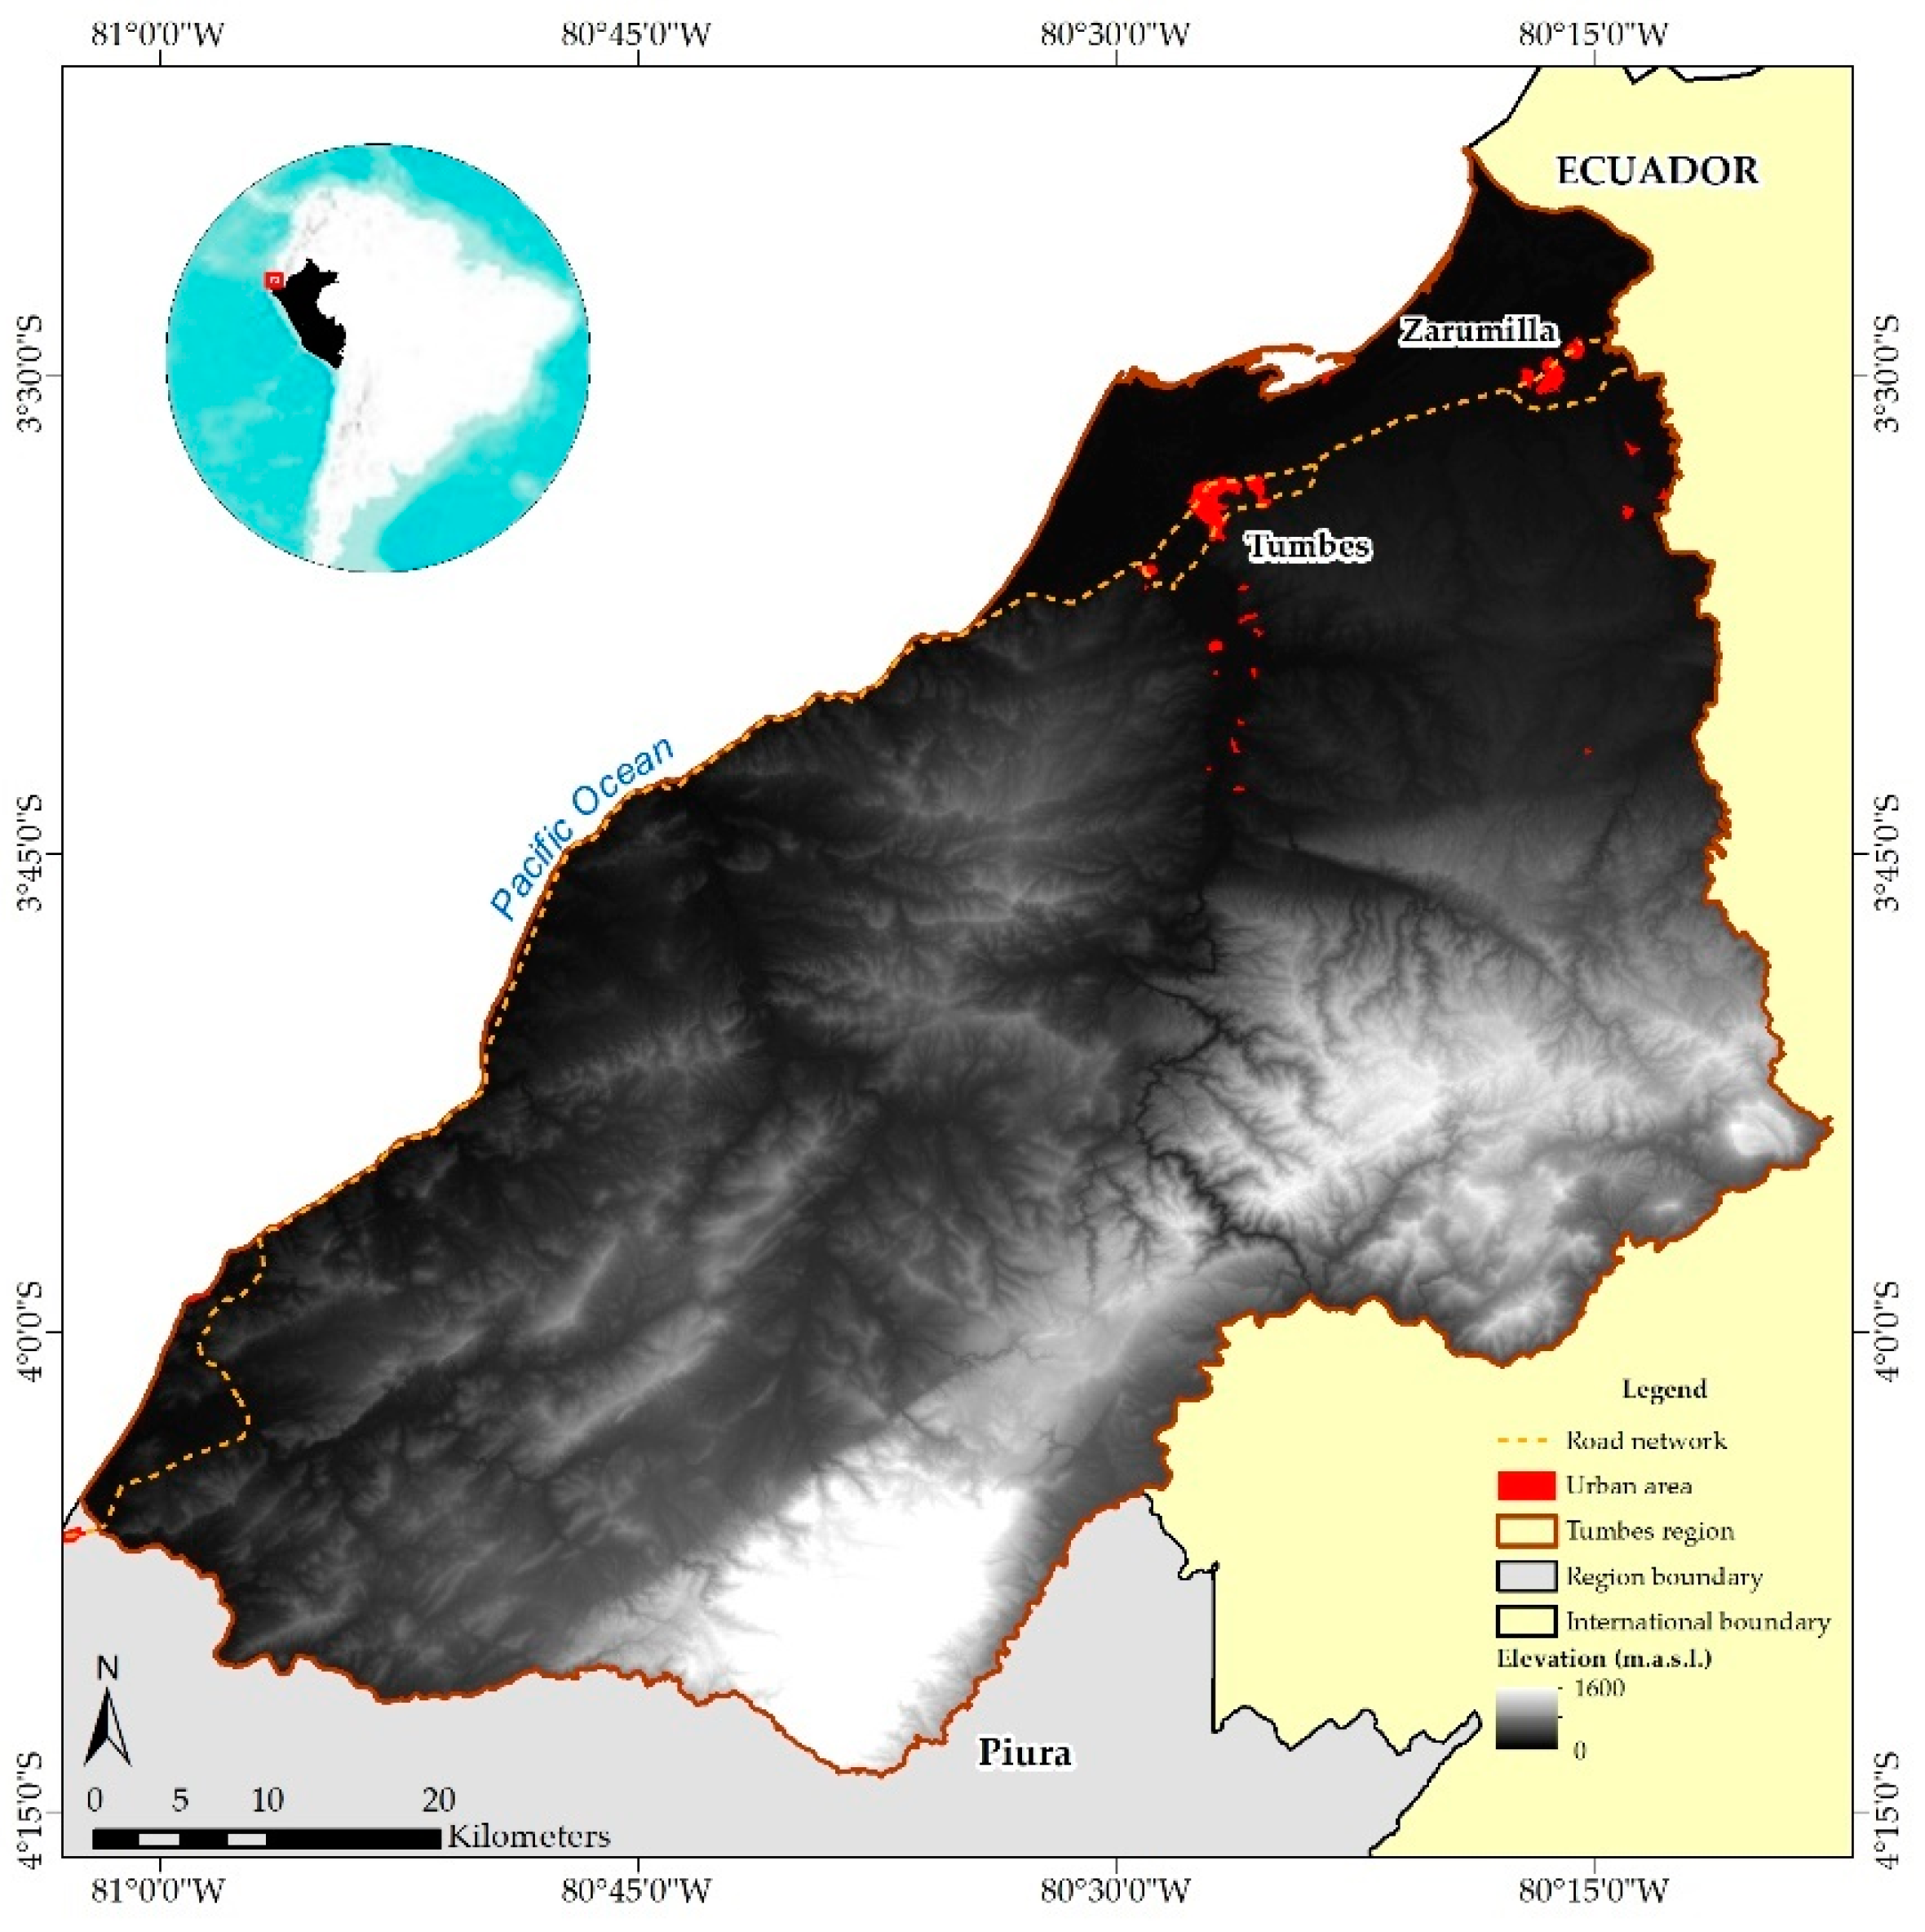
2.1. Study Area

The department of Tumbes has an area of 4646.67 km2 and is located in the north of Peru, between the extreme coordinates of latitude 3°23.045′ and 4°13.841′ S and longitude 80°25.625′ and 80°6.609′ W (Figure 1). The study area is part of the dry forest ecosystem and forms the Tumbes region, distributed between Peru and Ecuador [16]. It is found in an altitude range that goes from 0 to 1600 m above sea level, with a mean annual temperature that oscillates between 20 and 26 °C and annual rainfall between 300 mm in the lowlands and 700 mm in the highlands, respectively [17].

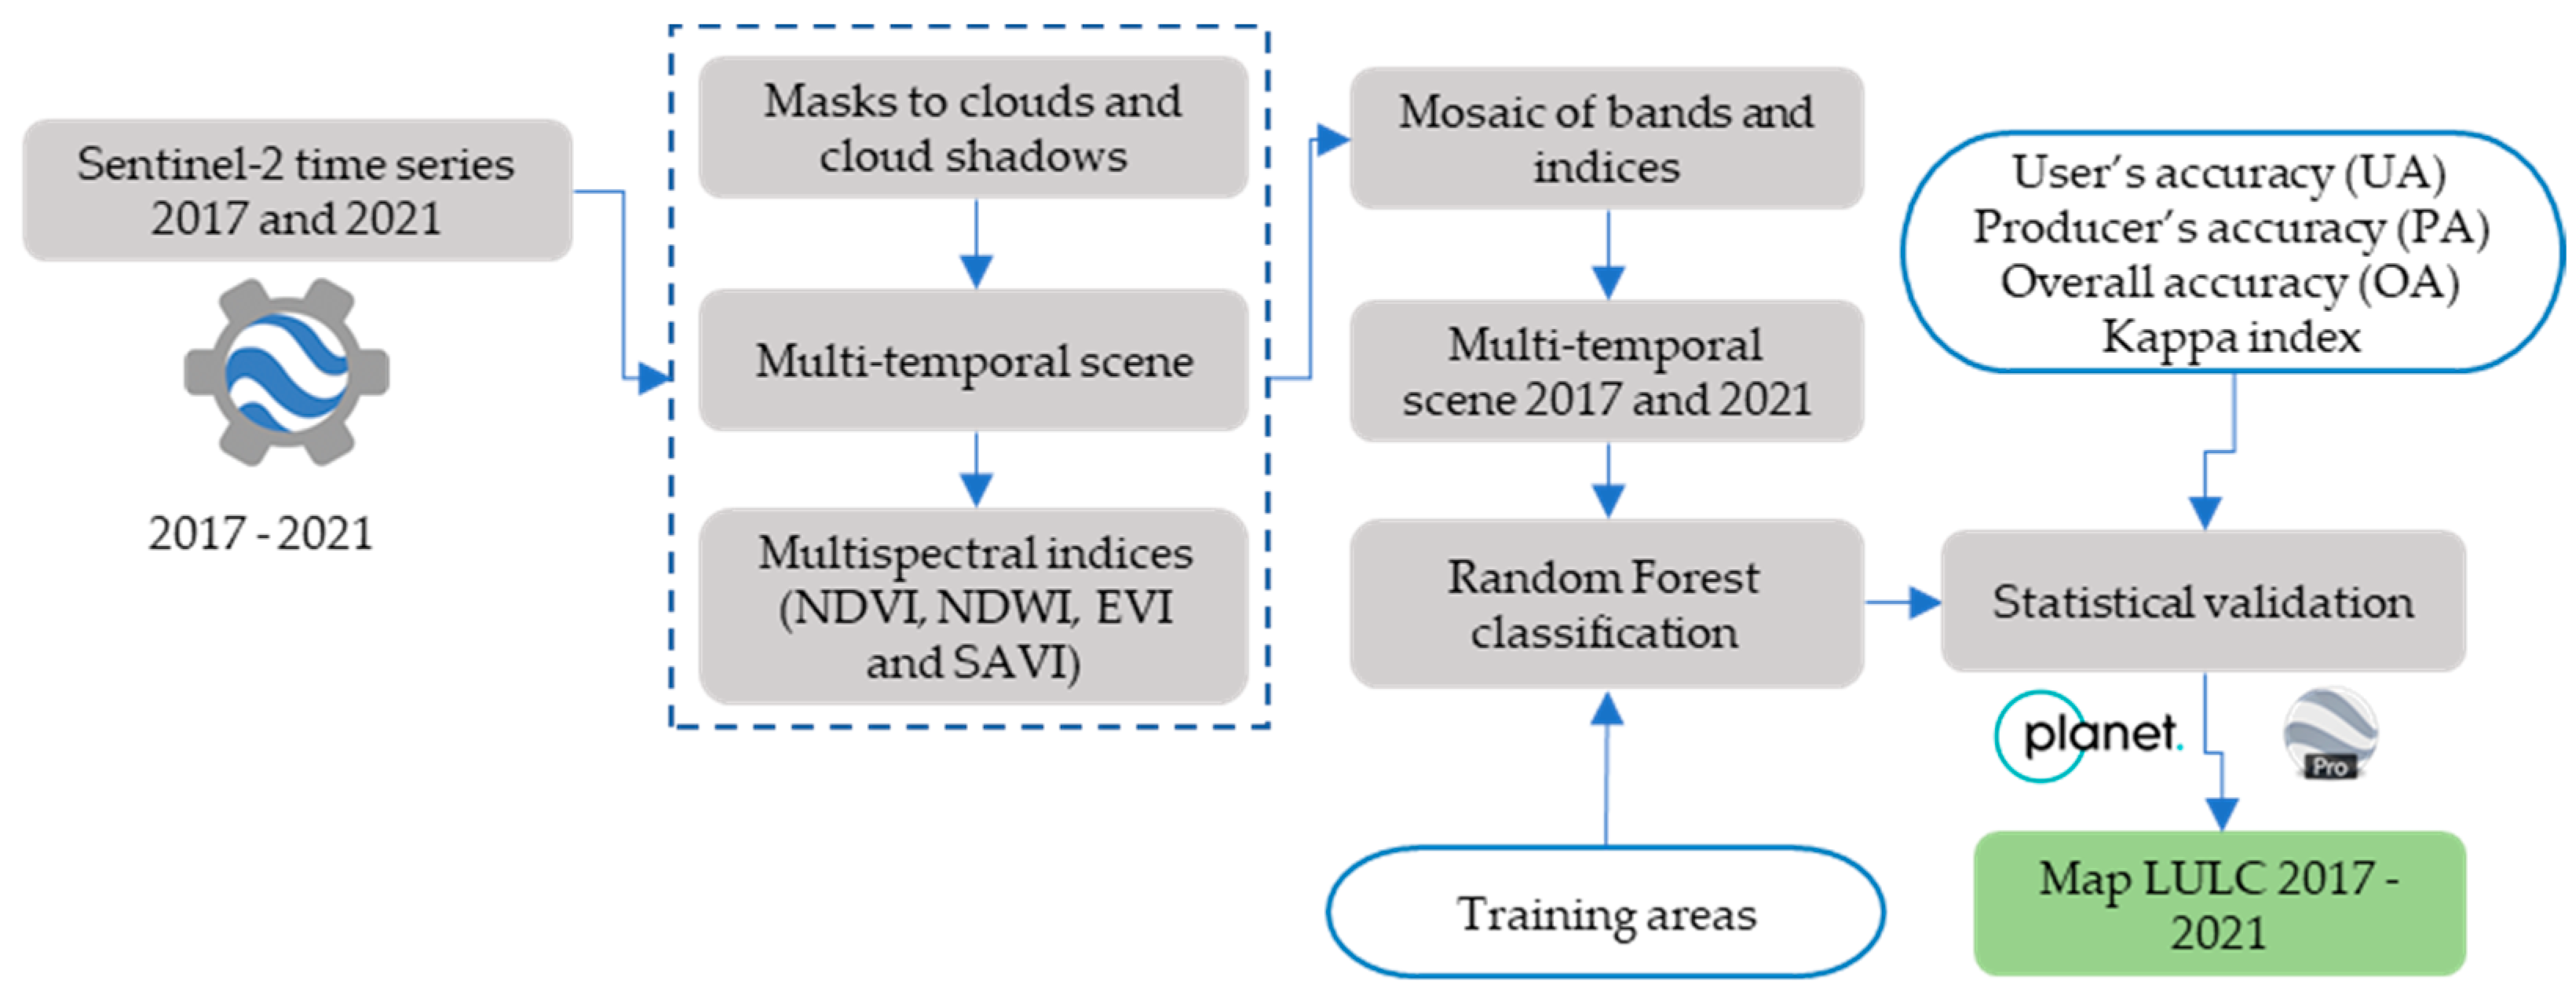
2.2. Image Acquisition and Processing

The data was represented by S2 images from 2017 to 2021 (Figure 2), with a spatial resolution of 10 m. Image processing was performed in GEE [13]. To improve the quality of the S2 images, the metadata applied a filter that considered cloud cover less than 30% [18,19]. Cloud and cloud shadow masking was then performed through the CloudScore and Temporal Dark Outlier Mask (TDOM) algorithms using the Quality Assessment (QA60) band [20]. Subsequently, the vegetation indices were calculated, namely the Normalized Difference Vegetation Index (NDVI), the Normalized Difference Water Index (NDWI), the Enhanced Vegetation Index (EVI), and the Soil Adjusted Vegetation Index (SAVI), with the objective of having more variables for the supervised classification process. Finally, the minimum, maximum, and median values for each band and the vegetation indices were calculated to build a multi-band mosaic for each year.

2.3. Classification of Images and Map of Land Use and Cover Change

The training areas were represented by six types of LULC, namely: urban area (UA), agricultural land (AL), land without or with little vegetation (LW), water body (WB), dense dry forest (DDF), and open dry forest (ODF), that were identified in the field and satellite images. Supervised classification was performed through the RF model. Prior to classification, 20,000 training points were randomly generated and divided proportionally by type [21] and year of evaluation. It was necessary to perform a visual analysis of the cartography using high-resolution images in ArcGIS v. 10.5. Subsequently, the intensity, loss, gain, and annual rate of change in the analyzed period (2017–2021) [12,22] were determined.

2.4. Validation of the Results

The final classified maps were compared with reference data, such as Google Earth satellite imagery and PlanetScope, using a confusion matrix. For this, 203 randomly distributed validation points were used for each type, assuming a precision error of 3% within a confidence interval of 96%, which allowed calculating the general precision (OA), user precision (UA), precision of the producer (PA), and Kappa index [22].

3. Results

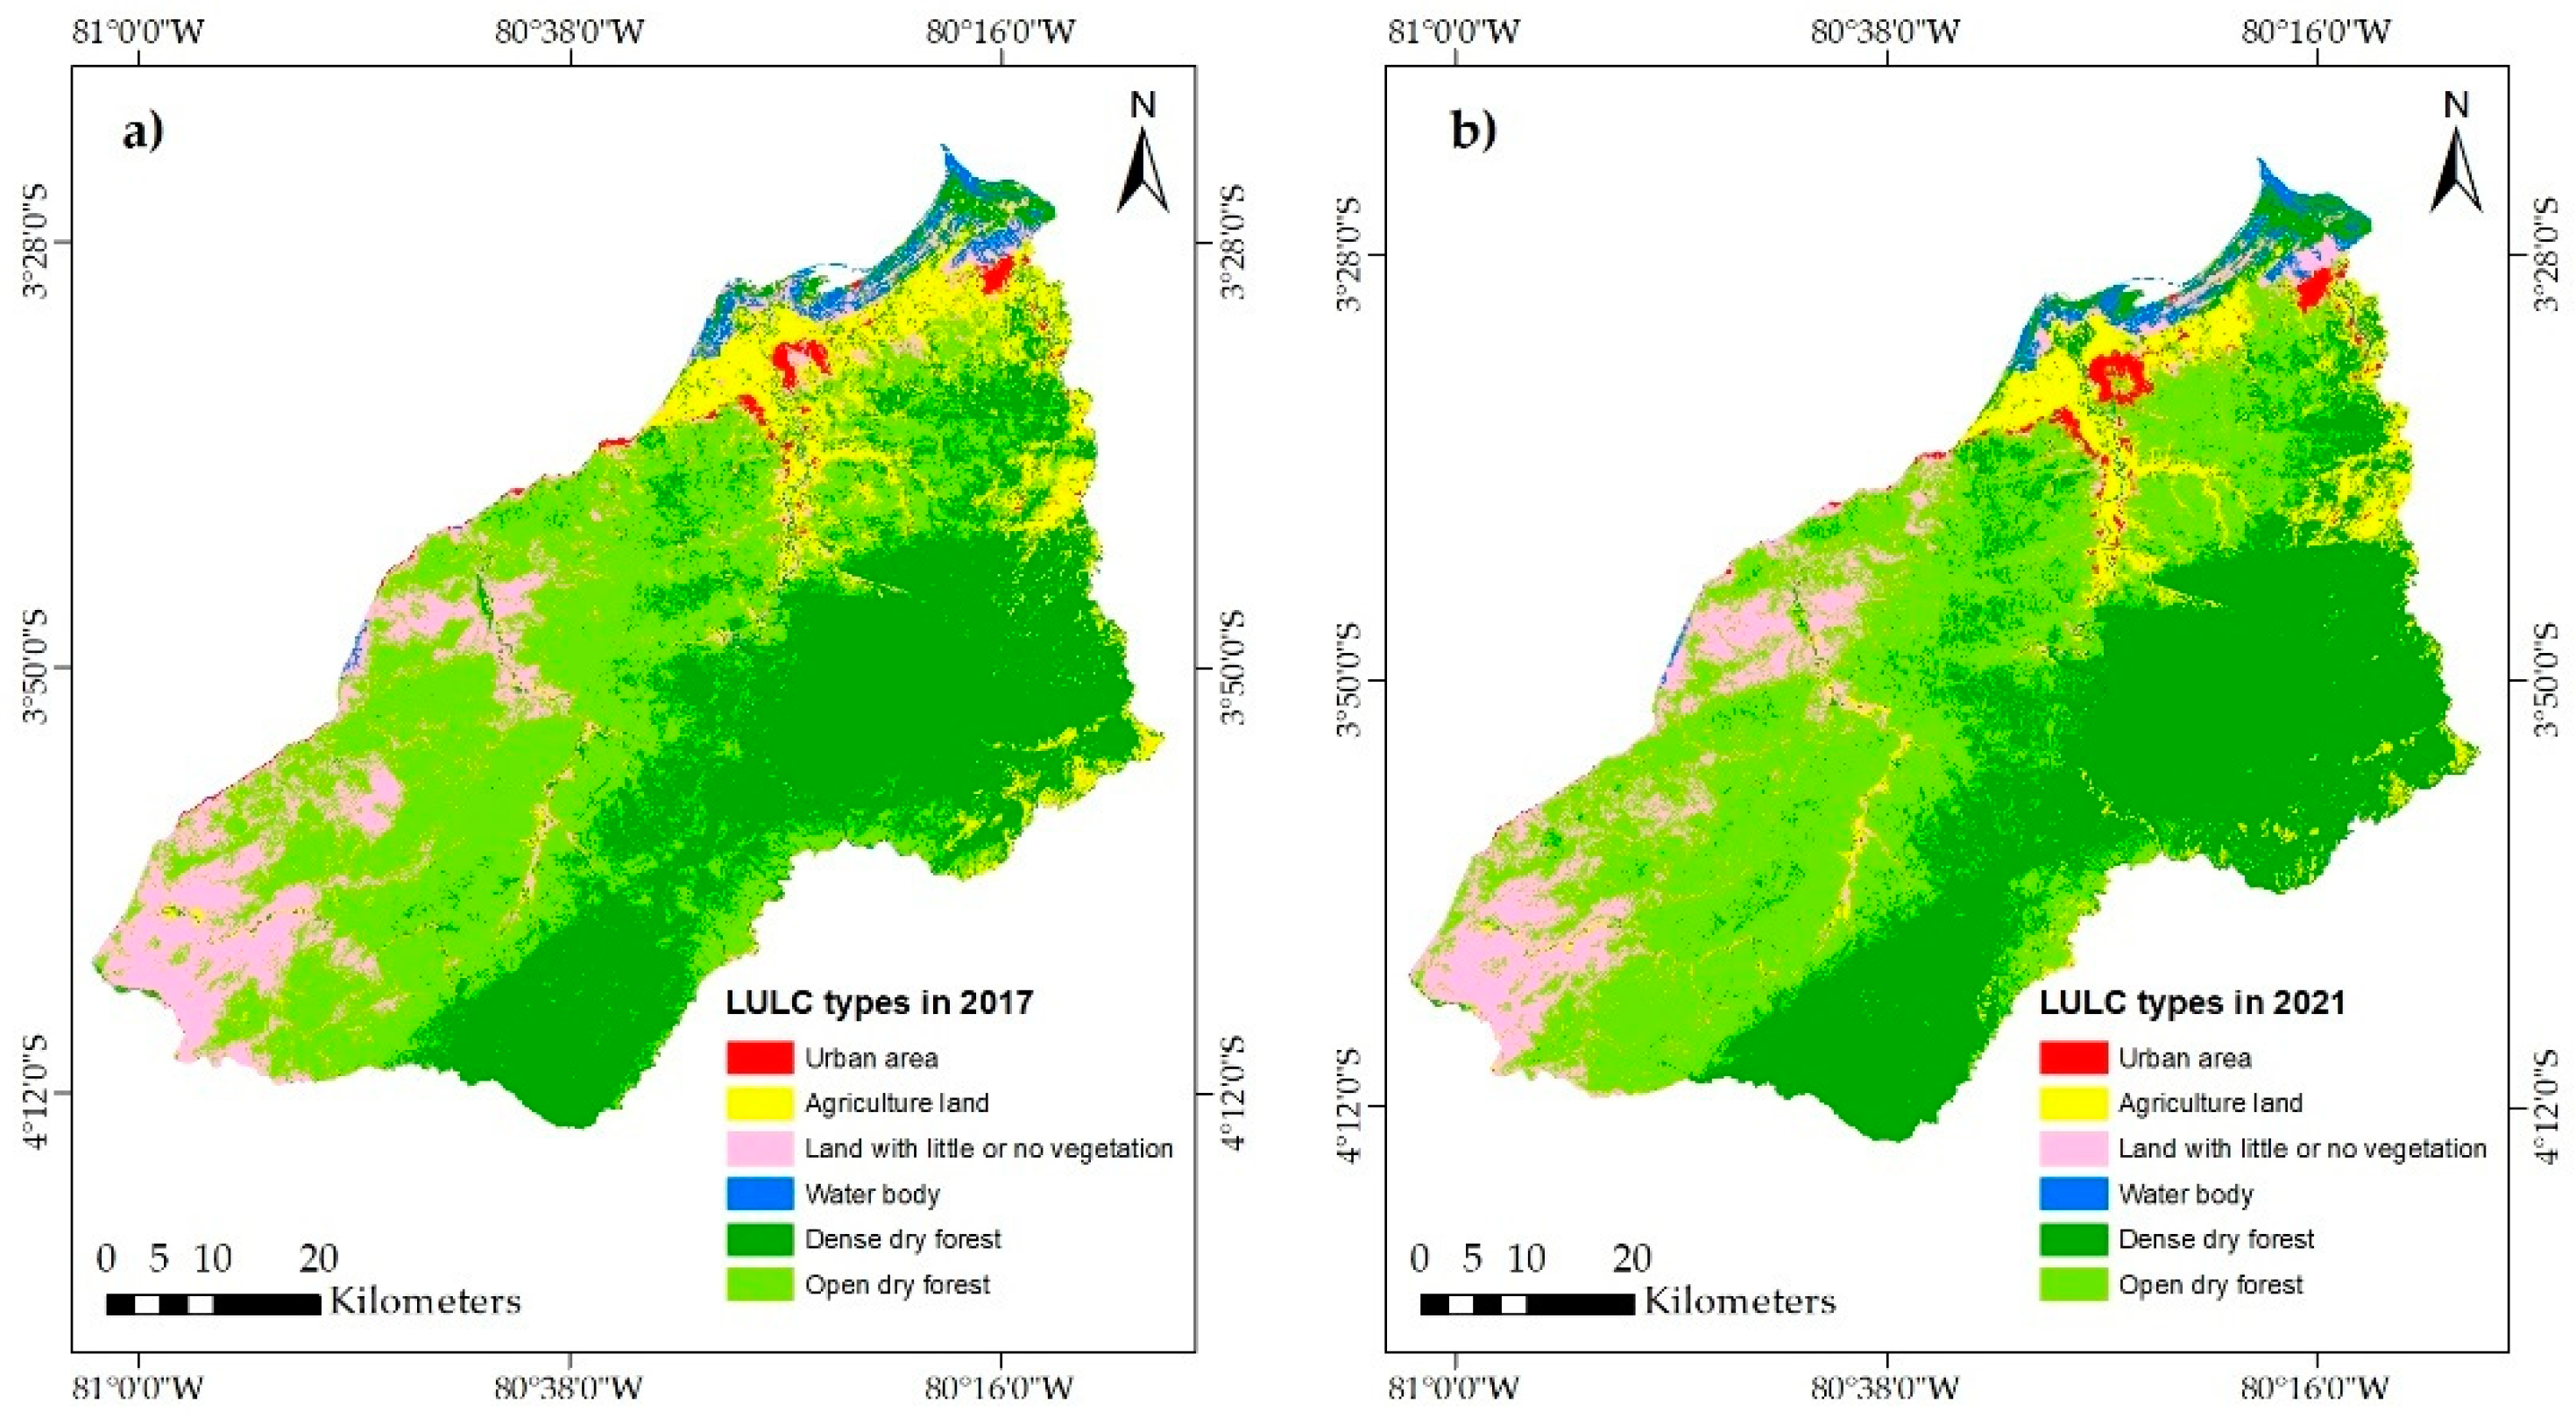
3.1. LULC Distribution and Accuracy Assessment

The 2017 and 2021 LULC maps for the Tumbes region are shown in Figure 3. It is observed that the DDF and ODF types had a larger surface and were distributed throughout the study area, with increases from 1725.02 to 1822.99 km2 and from 1844.99 to 1892.01 km2, respectively. The type of AU also reports an increase in its surface, from 36.71 to 48.07 km2 for the evaluation years, respectively. However, other classes, such as AL, located to the northwest and close to water bodies, decreased by 92.25 km2 by 2021. In the same way, the LW and WB types showed similar spatial patterns, reporting a reduction in their surfaces of 1.24 and 0.11%, respectively, according to the years of evaluation. On the other hand, the accuracy of the LULC maps for 2017 and 2021 reported OA values greater than 92%, just as UA and PA were greater than 70 and 71%, respectively. The Kappa index also showed values above 89%.

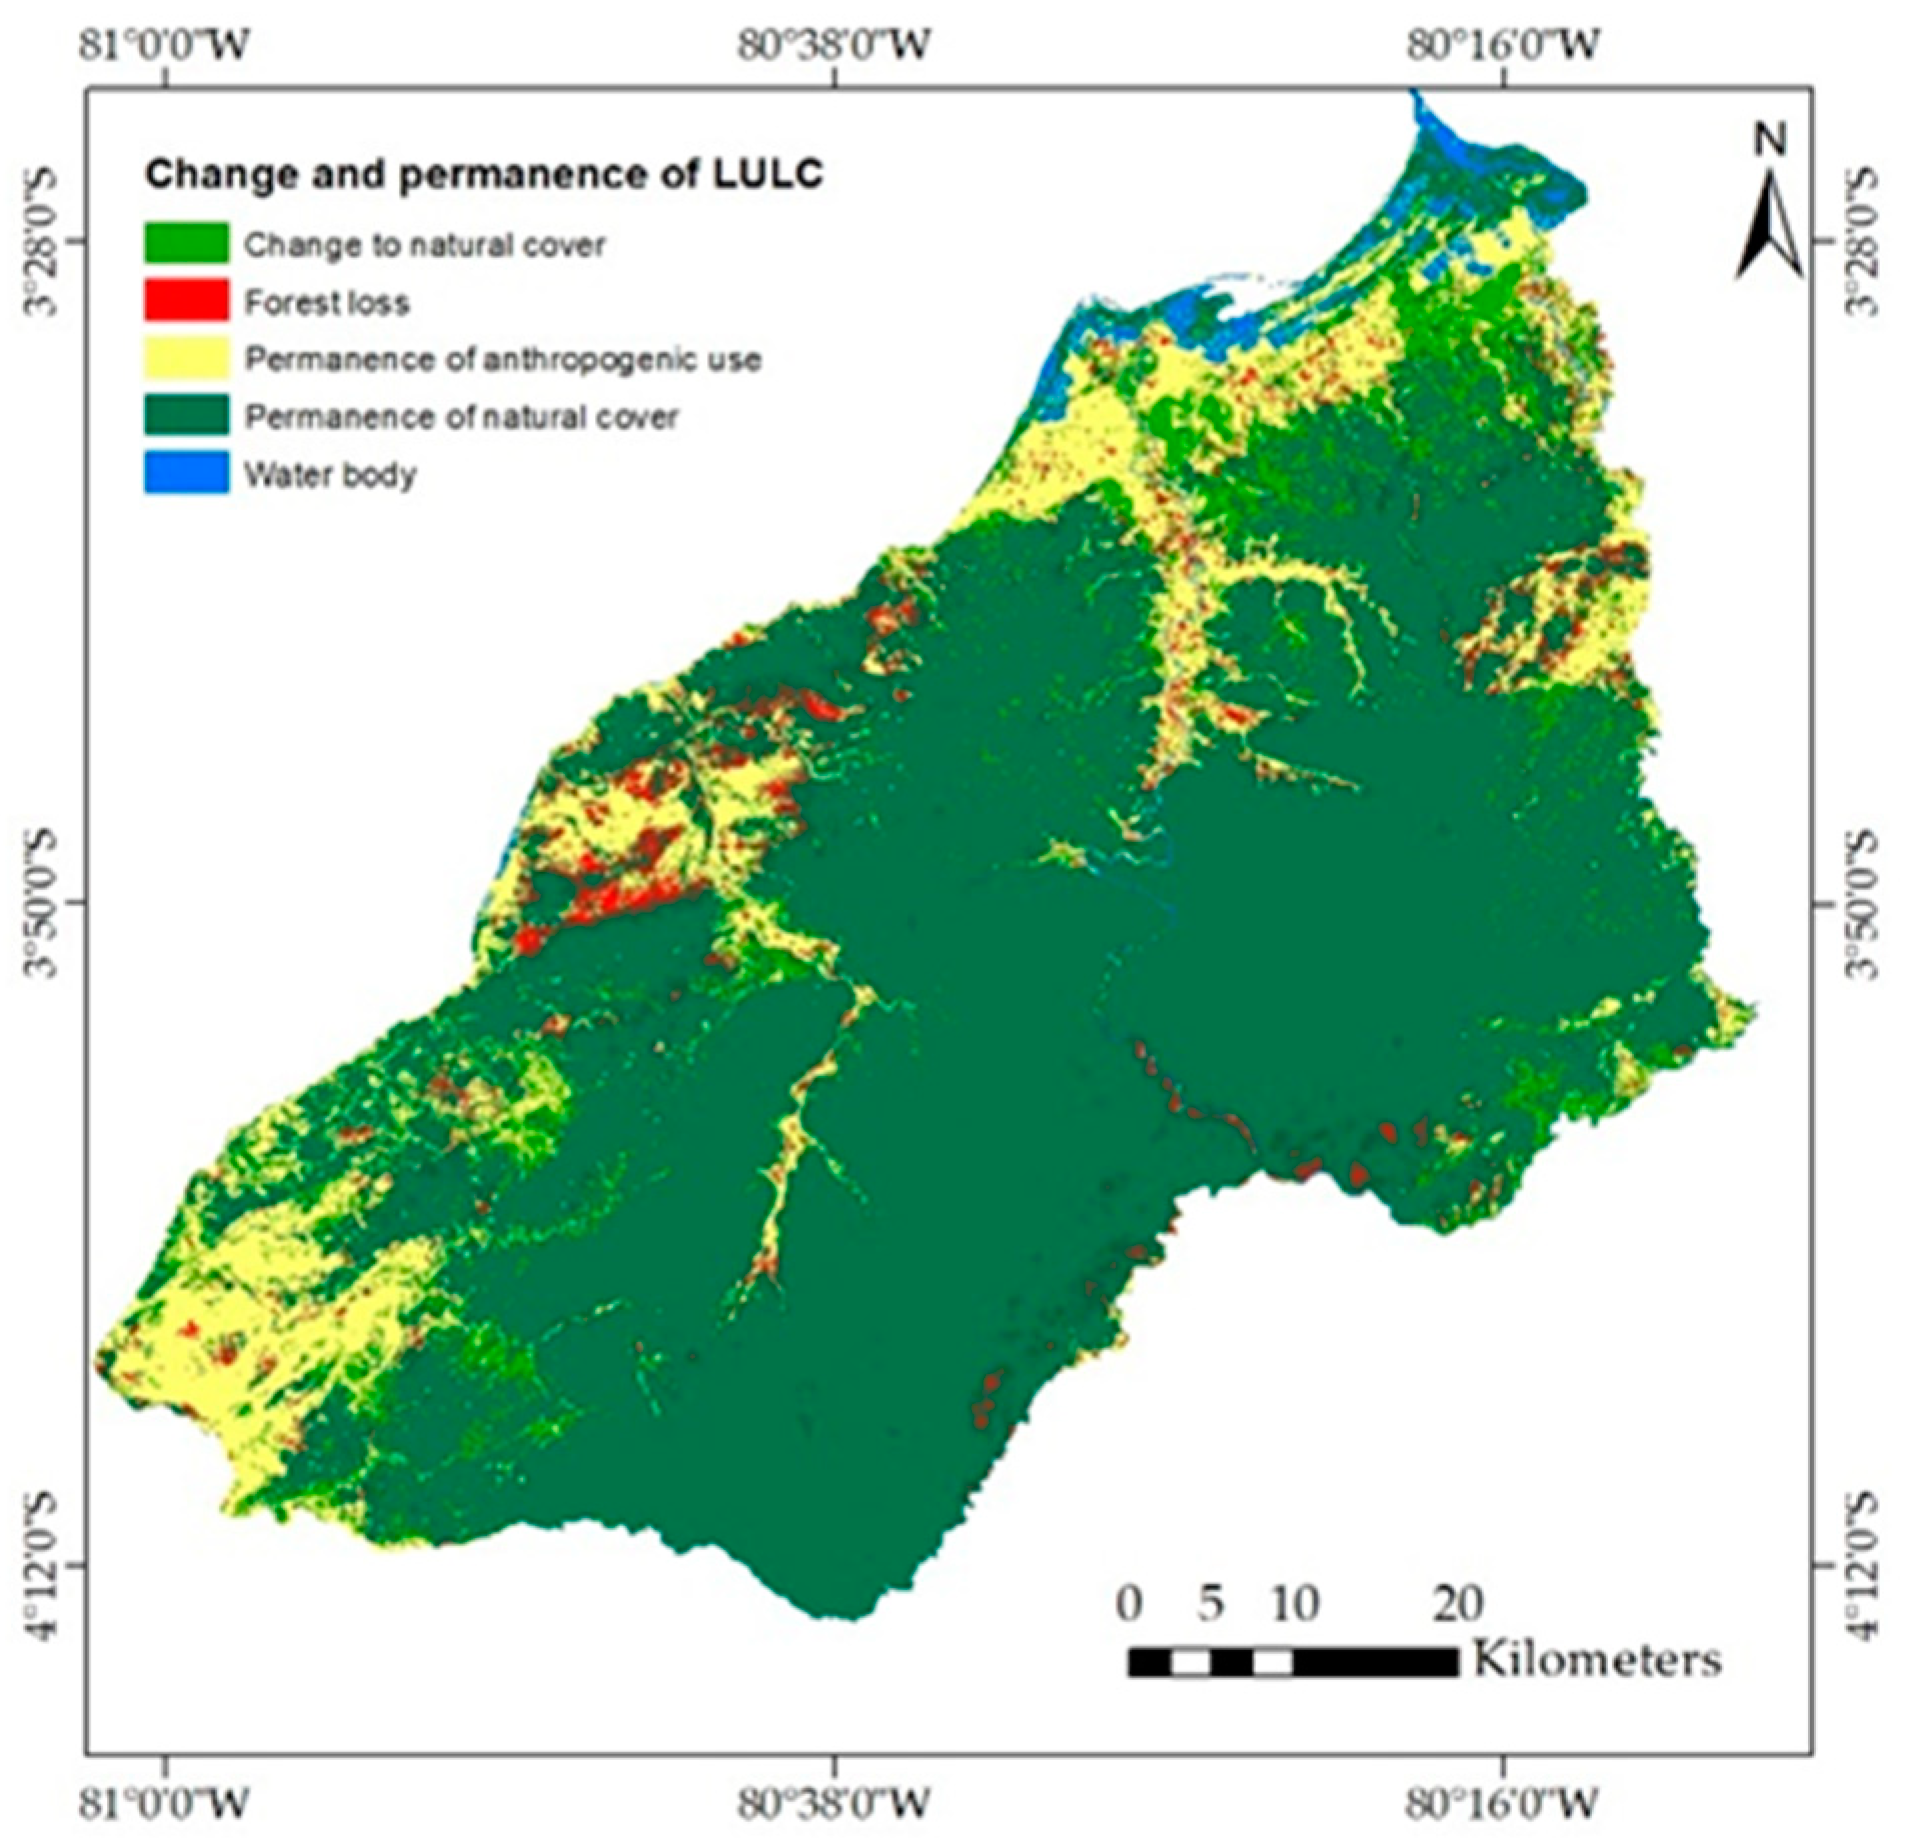
3.2. Analysis of LULC Changes

The analysis of estimated rates for the 2017–2021 period reports a marked dynamic for LULC. The changes mainly occurred in the increases of UA (4.81%), DDF (1.39%), and ODF (0.63%). This is a result of the reduction in AL (−5.92%), WB (−1.92%), and BS (−2.67%) rates. Likewise, the greatest changes occurred in UA (55.36%), WB (48.17%), and AL (47.03%). In turn, the largest net change was represented by WB, AL, and UA of 51.27, 21.67, and 20.66%, respectively. For its part, Figure 4 shows the changes produced by LULC during the analysis period. Consequently, 73% of the forest surface remained unchanged, as did anthropogenic use (agricultural land and urban area) (15%). However, 4% (165.09 km2) of the total area lost its forest cover.

4. Discussion

The dry forest of the north coast of Peru is considered the most sensitive region to the El Niño phenomenon (ENP) [23], which mainly affects the populations settled in this ecosystem. Likewise, the vegetation is conditioned by climatic factors, such as precipitation and temperature since they have a marked effect on the regeneration and physiognomy of the vegetation cover [24]. However, ENP can also have some positive impacts, especially in rural communities where they favor some crops such as rice, the appearance of temporary grasslands for cattle, and the regeneration of dry forests [25]. The results of the main types of LULC in the Tumbes region reported an increase in forest cover of approximately 2% by 2021. However, in areas near UA and LW, foci of forest loss were shown. These changes could be related to the expansion of the agricultural frontier, firewood extraction, or deforestation [5,24]. Another important aspect is the decrease in the AL surface from 425.65 to 333.40 ha from 2017 to 2021. This reduction could be related to water availability since the ENP occurred in 2017, which increased the crop plots in the study area.

5. Conclusions

In this study, we used 10-m multi-temporal S2 images to analyze LULC changes in the Tumbes region from 2017 to 2021, which were implemented on the GEE platform. The generated maps reported accuracies greater than 89%, which were evaluated with other available high-resolution images. Through the comparison of the LULC maps, it was reported that forest cover in recent years has lost 4% of the total area. In addition, the application of GEE made it possible to evaluate the LULC changes in the dry forest and, from this, provide important information for the sustainable management of this important ecosystem.

Author Contributions

Conceptualization, E.B. and W.S.; methodology, E.B., W.S., D.G.-P., L.V.-V., D.S. and J.G.; validation, E.B., D.G.-P., J.G., W.A. and H.V.V.; formal analysis, E.B., W.S. and D.G.-P.; investigation, E.B., W.S. and C.I.A.; resources, J.G., H.V.V. and C.I.A.; data curation, E.B., W.S. and L.V.-V.; writing—original draft preparation, E.B., D.S. and C.I.A.; writing—review and editing, C.I.A.; visualization, E.B., W.A. and H.V.V.; supervision, W.S., J.G., H.V.V. and C.I.A.; project administration, J.G., H.V.V. and C.I.A.; funding acquisition, J.G., H.V.V. and C.I.A. All authors have read and agreed to the published version of the manuscript.

Funding

This research was funded by PP068 “Reducción de la vulnerabilidad y atención de emergencias por desastres” of the Ministry of Agrarian Development and Irrigation (MIDAGRI) of the Peruvian Government, and Universidad Nacional de Frontera (UNF).

Institutional Review Board Statement

Not applicable.

Informed Consent Statement

Not applicable.

Data Availability Statement

Not applicable.

Acknowledgments

We thank Ivan Ucharima for image processing and “Centro Experimental La Molina” for providing field resources. In addition, we thank Eric Rodriguez, Maria Angélica Puyo, and Cristina Aybar for supporting the logistic activities in our laboratory. Finally, the authors thank the Bioinformatics High-Performance Computing server of Universidad Nacional Agraria la Molina for providing resources for data analysis.

Conflicts of Interest

The authors declare no conflict of interest.

References

  1. Padilla, N.A.; Alvarado, J.; Granda, J. Bienes y Servicios Ecosistémicos de Los Bosques Secos de La Provincia de Loja. Bosques Latid. Cero 2018, 8, 2. Available online: https://revistas.unl.edu.ec/index.php/bosques/article/view/499 (accessed on 30 April 2022).
  2. Mercado, W.; Rimac, D. Comercialización de miel de abeja del bosque seco, distrito de Motupe, Lambayeque, Perú. Nat. Econ. 2019, 4, 24–37. [Google Scholar] [CrossRef]
  3. MINAM. Mapa Nacional de Cobertura Vegetal; MINAM: Lima, Perú, 2015. Available online: https://www.gob.pe/institucion/minam/informes-publicaciones/2674-mapa-nacional-de-cobertura-vegetal-memoria-descriptiva (accessed on 10 August 2022).
  4. Espinosa, C.I.; de la Cruz, M.; Luzuriaga, A.L.; Escudero, A. Bosques Tropicales Secos de La Región Pacífico Ecuatorial: Diversidad, Estructura, Funcionamiento e Implicaciones Para La Conservación. Ecosistemas 2012, 21, 167–179. [Google Scholar]
  5. Whaley, O.Q.; Beresford-Jones, D.G.; Milliken, W.; Orellana, A.; Smyk, A.; Leguía, J. An ecosystem approach to restoration and sustainable management of dry forest in southern Peru. Kew Bull. 2010, 65, 613–641. [Google Scholar] [CrossRef]
  6. Mantilla, P.G.; Neri, L. El ecoturismo como alternativa sostenible para proteger el bosque seco tropical peruano: El caso de Proyecto Hualtaco, Tumbes. Pasos. Rev. Turismo Patrim. Cult. 2015, 13, 1437–1449. [Google Scholar] [CrossRef]
  7. Negese, A. Impacts of Land Use and Land Cover Change on Soil Erosion and Hydrological Responses in Ethiopia. Appl. Environ. Soil Sci. 2021, 2021, 1–10. [Google Scholar] [CrossRef]
  8. Birhanu, A.; Masih, I.; van der Zaag, P.; Nyssen, J.; Cai, X. Impacts of land use and land cover changes on hydrology of the Gumara catchment, Ethiopia. Phys. Chem. Earth Parts A/B/C 2019, 112, 165–174. [Google Scholar] [CrossRef]
  9. Scullion, J.J.; Vogt, K.A.; Sienkiewicz, A.; Gmur, S.; Trujillo, C. Assessing the influence of land-cover change and conflicting land-use authorizations on ecosystem conversion on the forest frontier of Madre de Dios, Peru. Biol. Conserv. 2014, 171, 247–258. [Google Scholar] [CrossRef]
  10. Khan, M.S.; Ullah, S.; Chen, L. Comparison on Land-Use/Land-Cover Indices in Explaining Land Surface Temperature Variations in the City of Beijing, China. Land 2021, 10, 1018. [Google Scholar] [CrossRef]
  11. Kamwi, J.M.; Mbidzo, M. Impact of land use and land cover changes on landscape structure in the dry lands of Southern Africa: A case of the Zambezi Region, Namibia. GeoJournal 2020, 87, 87–98. [Google Scholar] [CrossRef]
  12. Briceñojas, N.B.R.; Castillo, E.B.; Quintana, J.L.M.; Cruz, S.M.O.; López, R.S. Deforestatcioón ien the Peruvilan Amazonía peruana: Iíndexices de cambiofs Lande covber/Lturand y uso del (suelC/LU) Changeso basado ed on SIGIS. Bol. Asoc. Geogr. Esp. 2019, 81, 1–34. [Google Scholar] [CrossRef]
  13. Gorelick, N.; Hancher, M.; Dixon, M.; Ilyushchenko, S.; Thau, D.; Moore, R. Google Earth Engine: Planetary-scale geospatial analysis for everyone. Remote Sens. Environ. 2017, 202, 18–27. [Google Scholar] [CrossRef]
  14. Wang, J.; Qiu, L.; Wang, Z.; Huang, X.; Shan, J.; Li, M. Study on remote sensing feature selection of green manure crop Astragalus sinicus based on multitemporal Sentinel-2 imagery. In Proceedings of the 2021 9th International Conference on Agro-Geoinformatics (Agro-Geoinformatics), Shenzhen, China, 26–29 July 2021; pp. 1–5. [Google Scholar]
  15. Marris, E. Conservation: Biodiversity as a bonus prize. Nature 2010, 468, 895. [Google Scholar] [CrossRef] [Green Version]
  16. Ortiz, J.C.; Espinosa, C.I.; Dahik, C.Q.; Mendoza, Z.A.; Ortiz, E.C.; Gusmán, E.; Weber, M.; Hildebrandt, P. Influence of Anthropogenic Factors on the Diversity and Structure of a Dry Forest in the Central Part of the Tumbesian Region (Ecuador–Perú). Forests 2019, 10, 31. [Google Scholar] [CrossRef] [Green Version]
  17. Aguirre, Z.; Kvist, L. Floristic Composition and Conservation Status of the Dry Forests in Ecuador. Lyonia 2005, 8, 41–67. [Google Scholar]
  18. Arekhi, M.; Goksel, C.; Sanli, F.B.; Senel, G. Comparative Evaluation of the Spectral and Spatial Consistency of Sentinel-2 and Landsat-8 OLI Data for Igneada Longos Forest. ISPRS Int. J. Geo-Inf. 2019, 8, 56. [Google Scholar] [CrossRef] [Green Version]
  19. Parente, L.; Ferreira, L. Assessing the Spatial and Occupation Dynamics of the Brazilian Pasturelands Based on the Automated Classification of MODIS Images from 2000 to 2016. Remote Sens. 2018, 10, 606. [Google Scholar] [CrossRef] [Green Version]
  20. Samsammurphy. Cloud Masking with Sentinel 2. 2017. Available online: https://github.com/samsammurphy/cloud-masking-sentinel2/blob/master/cloud-masking-sentinel2.ipynb (accessed on 23 April 2020).
  21. Hailemariam, S.N.; Soromessa, T.; Teketay, D. Land Use and Land Cover Change in the Bale Mountain Eco-Region of Ethiopia during 1985 to 2015. Land 2016, 5, 41. [Google Scholar] [CrossRef] [Green Version]
  22. Chuvieco, E. Fundamentals of Satellite Remote Sensing. An Enviromental Approach, 2nd ed.; CRC Press, Taylor & Francis Group: New York, NY, USA, 2016; ISBN 978-1-4987-2807-2. [Google Scholar]
  23. Rodríguez, R.; Mabres, A.; Luckman, B.; Evans, M.; Masiokas, M.; Ektvedt, T.M. “El Niño” events recorded in dry-forest species of the lowlands of northwest Peru. Dendrochronologia 2005, 22, 181–186. [Google Scholar] [CrossRef]
  24. Zorogastúa, P.; Quiroz Guerra, R.; Garatuza Payán, J. Evaluación de Cambios En La Cobertura y Uso de La Tierra Con Imágenes de Satélite En Piura—Perú. Ecol. Appl. 2011, 10, 13–22. [Google Scholar] [CrossRef] [Green Version]
  25. Pécastaing, N.; Chávez, C. The impact of El Niño phenomenon on dry forest-dependent communities’ welfare in the northern coast of Peru. Ecol. Econ. 2020, 178, 106820. [Google Scholar] [CrossRef]
Figure 1. Location of the department of Tumbes in Peru.
Environsciproc 22 00002 g001
Figure 2. Methodological flow applied to analyze the LULC changes in the dry forest of the Tumbes region (Peru).
Environsciproc 22 00002 g002
Figure 3. LULC spatial distribution maps for the Tumbes region: (a) 2017 and (b) 2021.
Environsciproc 22 00002 g003
Figure 4. Maps of the change and permanence of LULC that occurred between 2017 and 2021 in the Tumbes region.
Environsciproc 22 00002 g004
Publisher’s Note: MDPI stays neutral with regard to jurisdictional claims in published maps and institutional affiliations.

