
Potential Use of Sentinel-2 Data for Discrimination of Tectona grandis L. Healthy and Non-Healthy Tree Species Using Spectral Angle Mapper †


Abstract
:1. Introduction
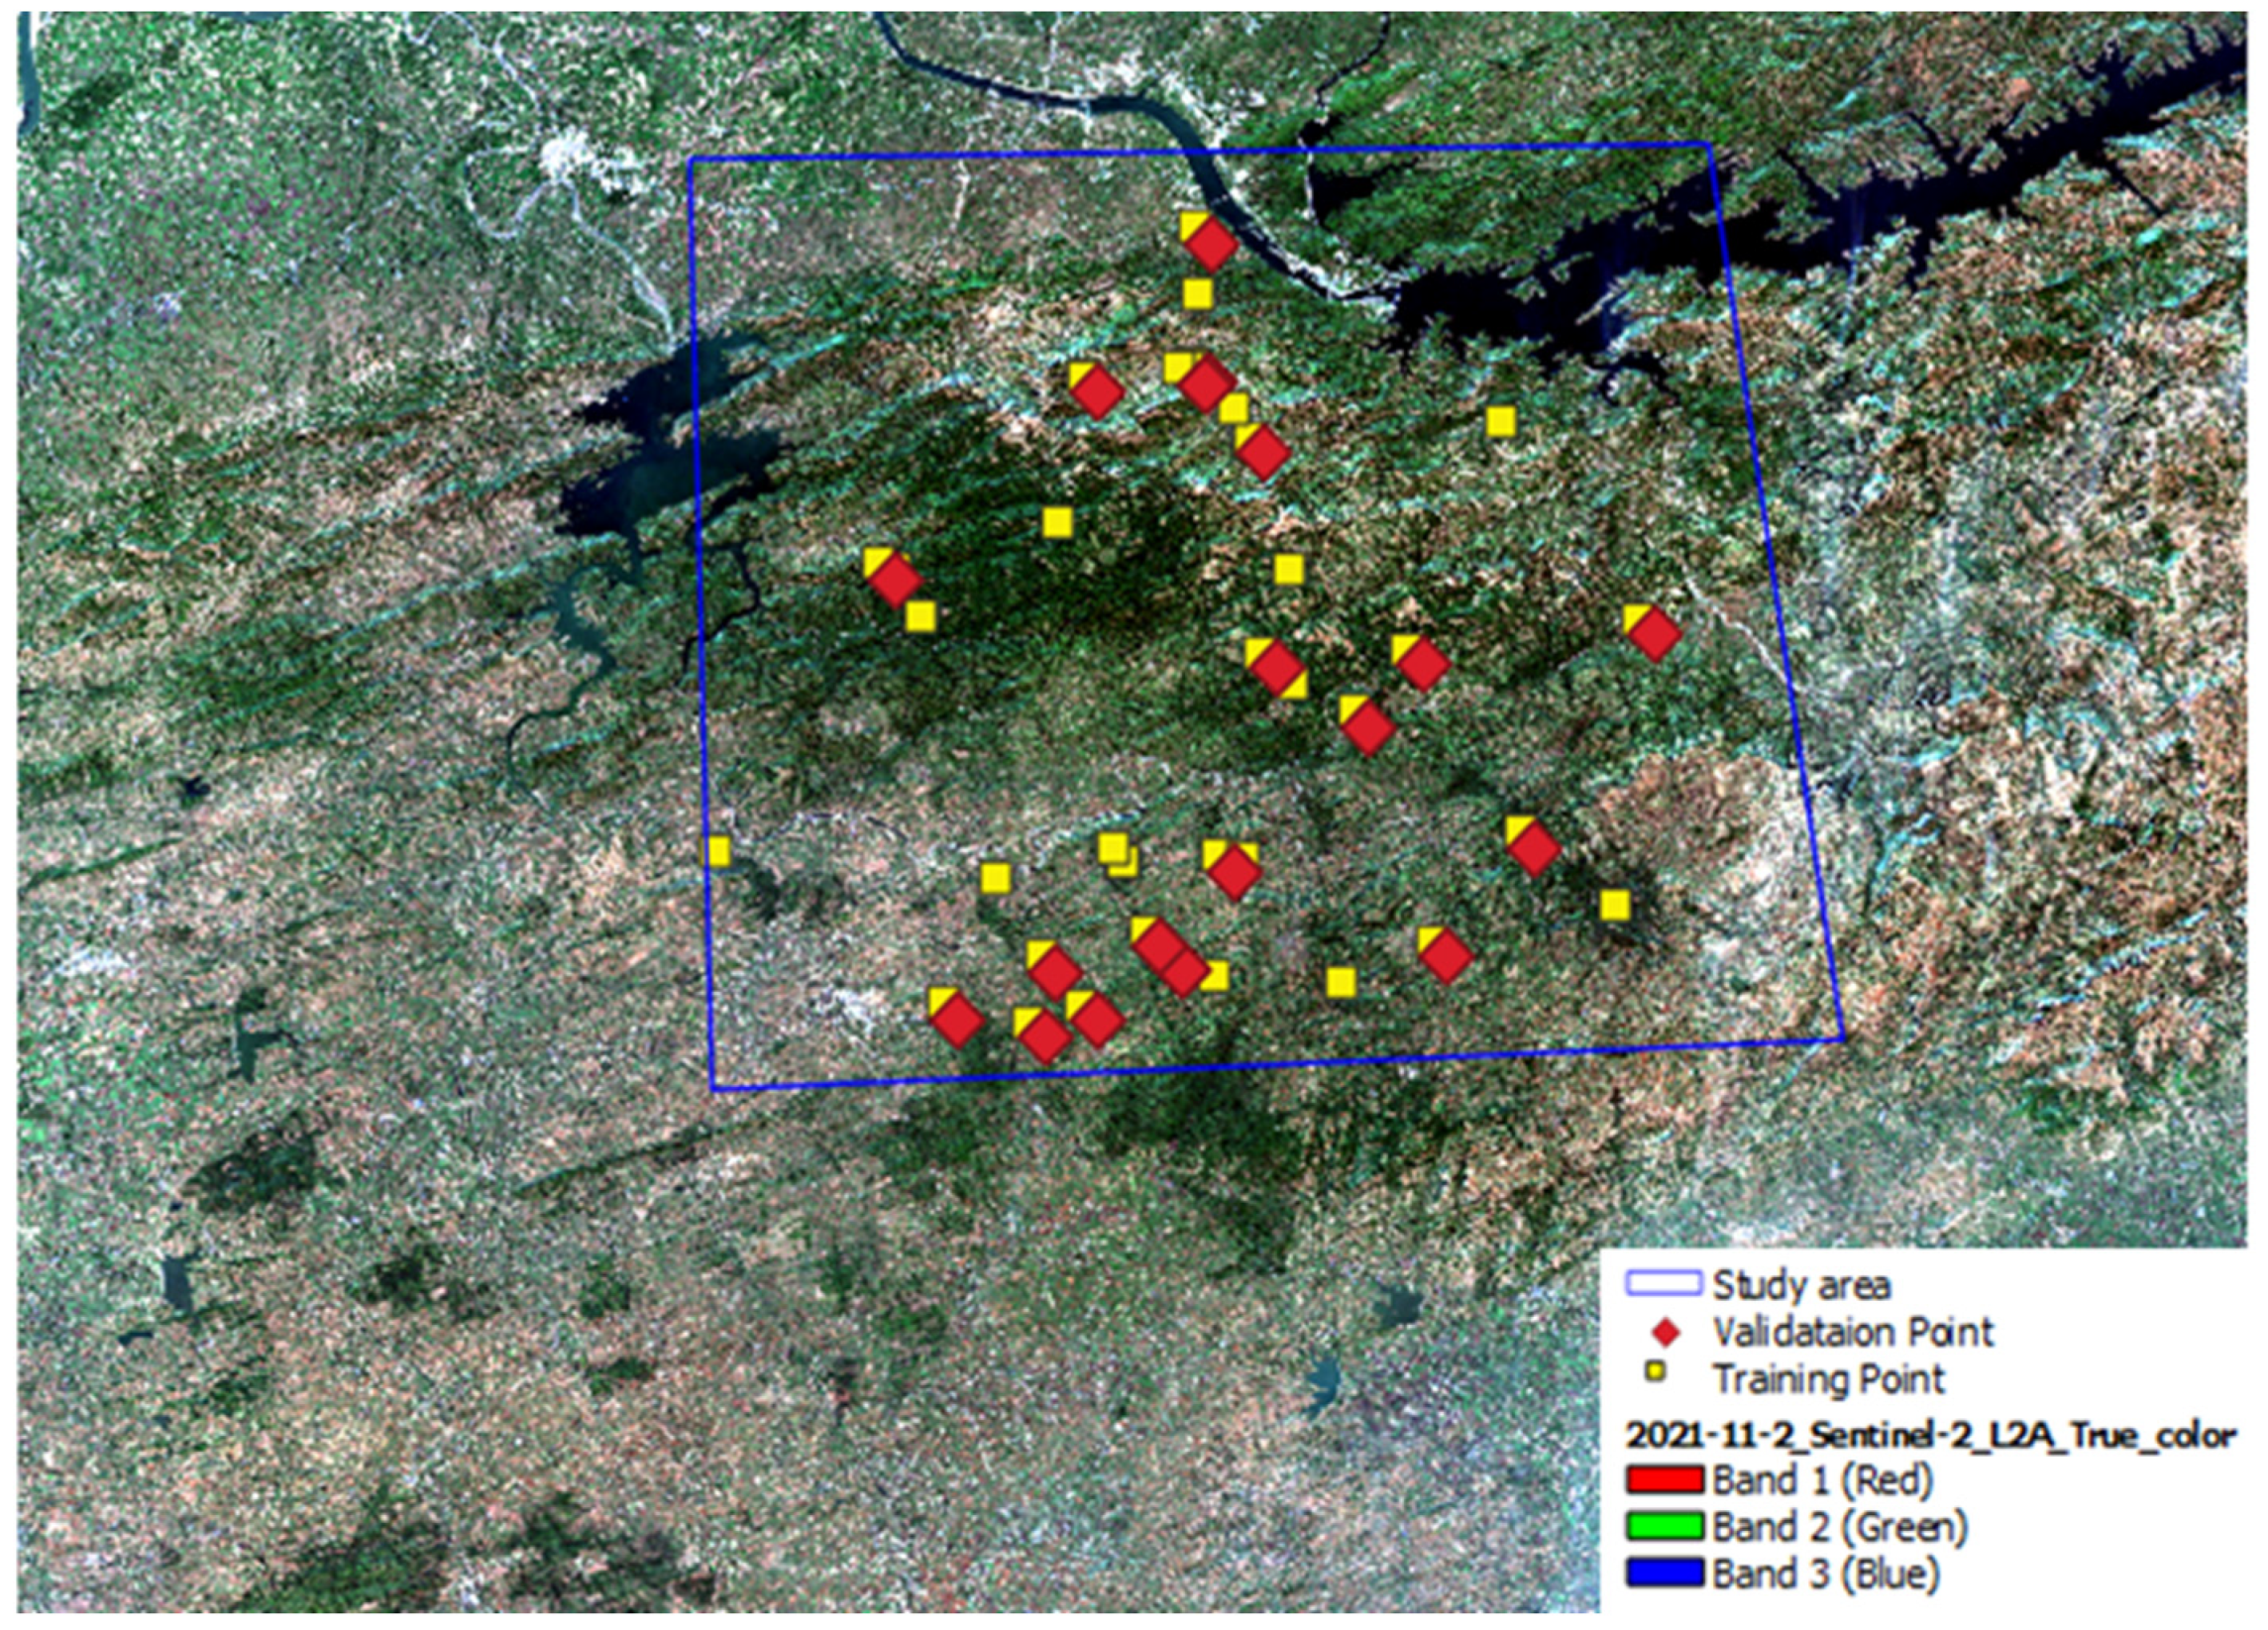
2. Study Area
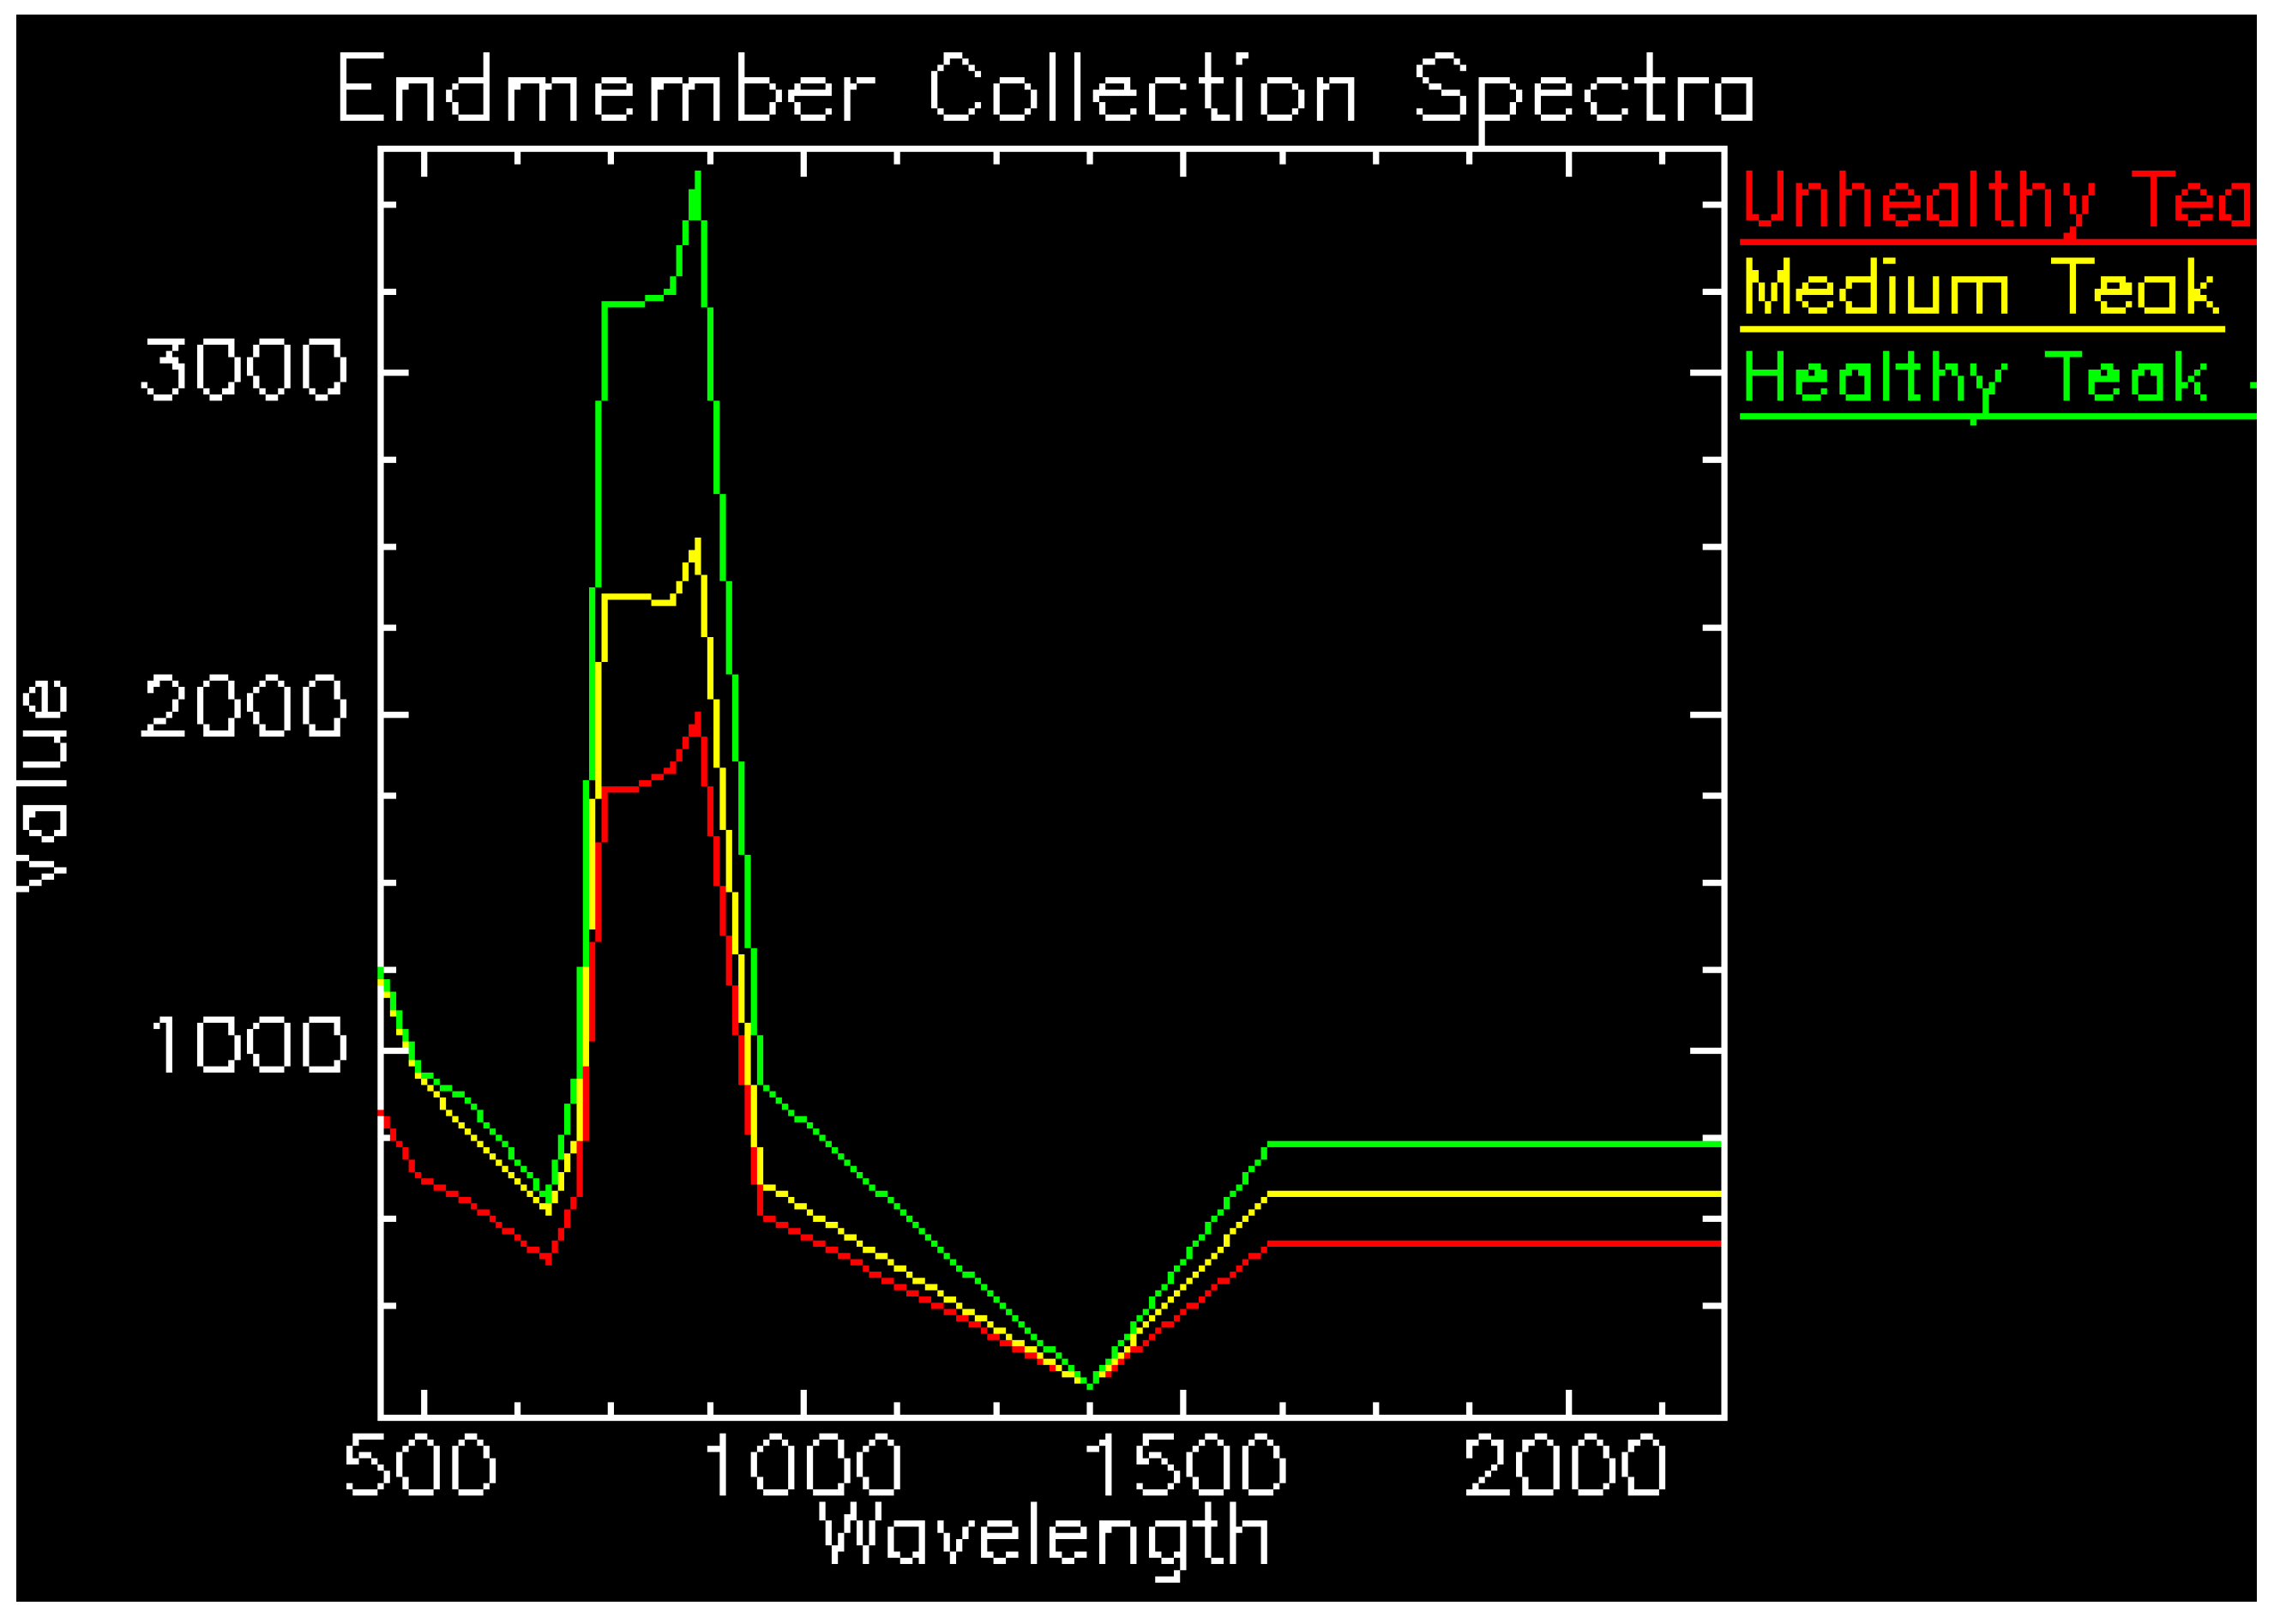
3. Methodology
Model Development
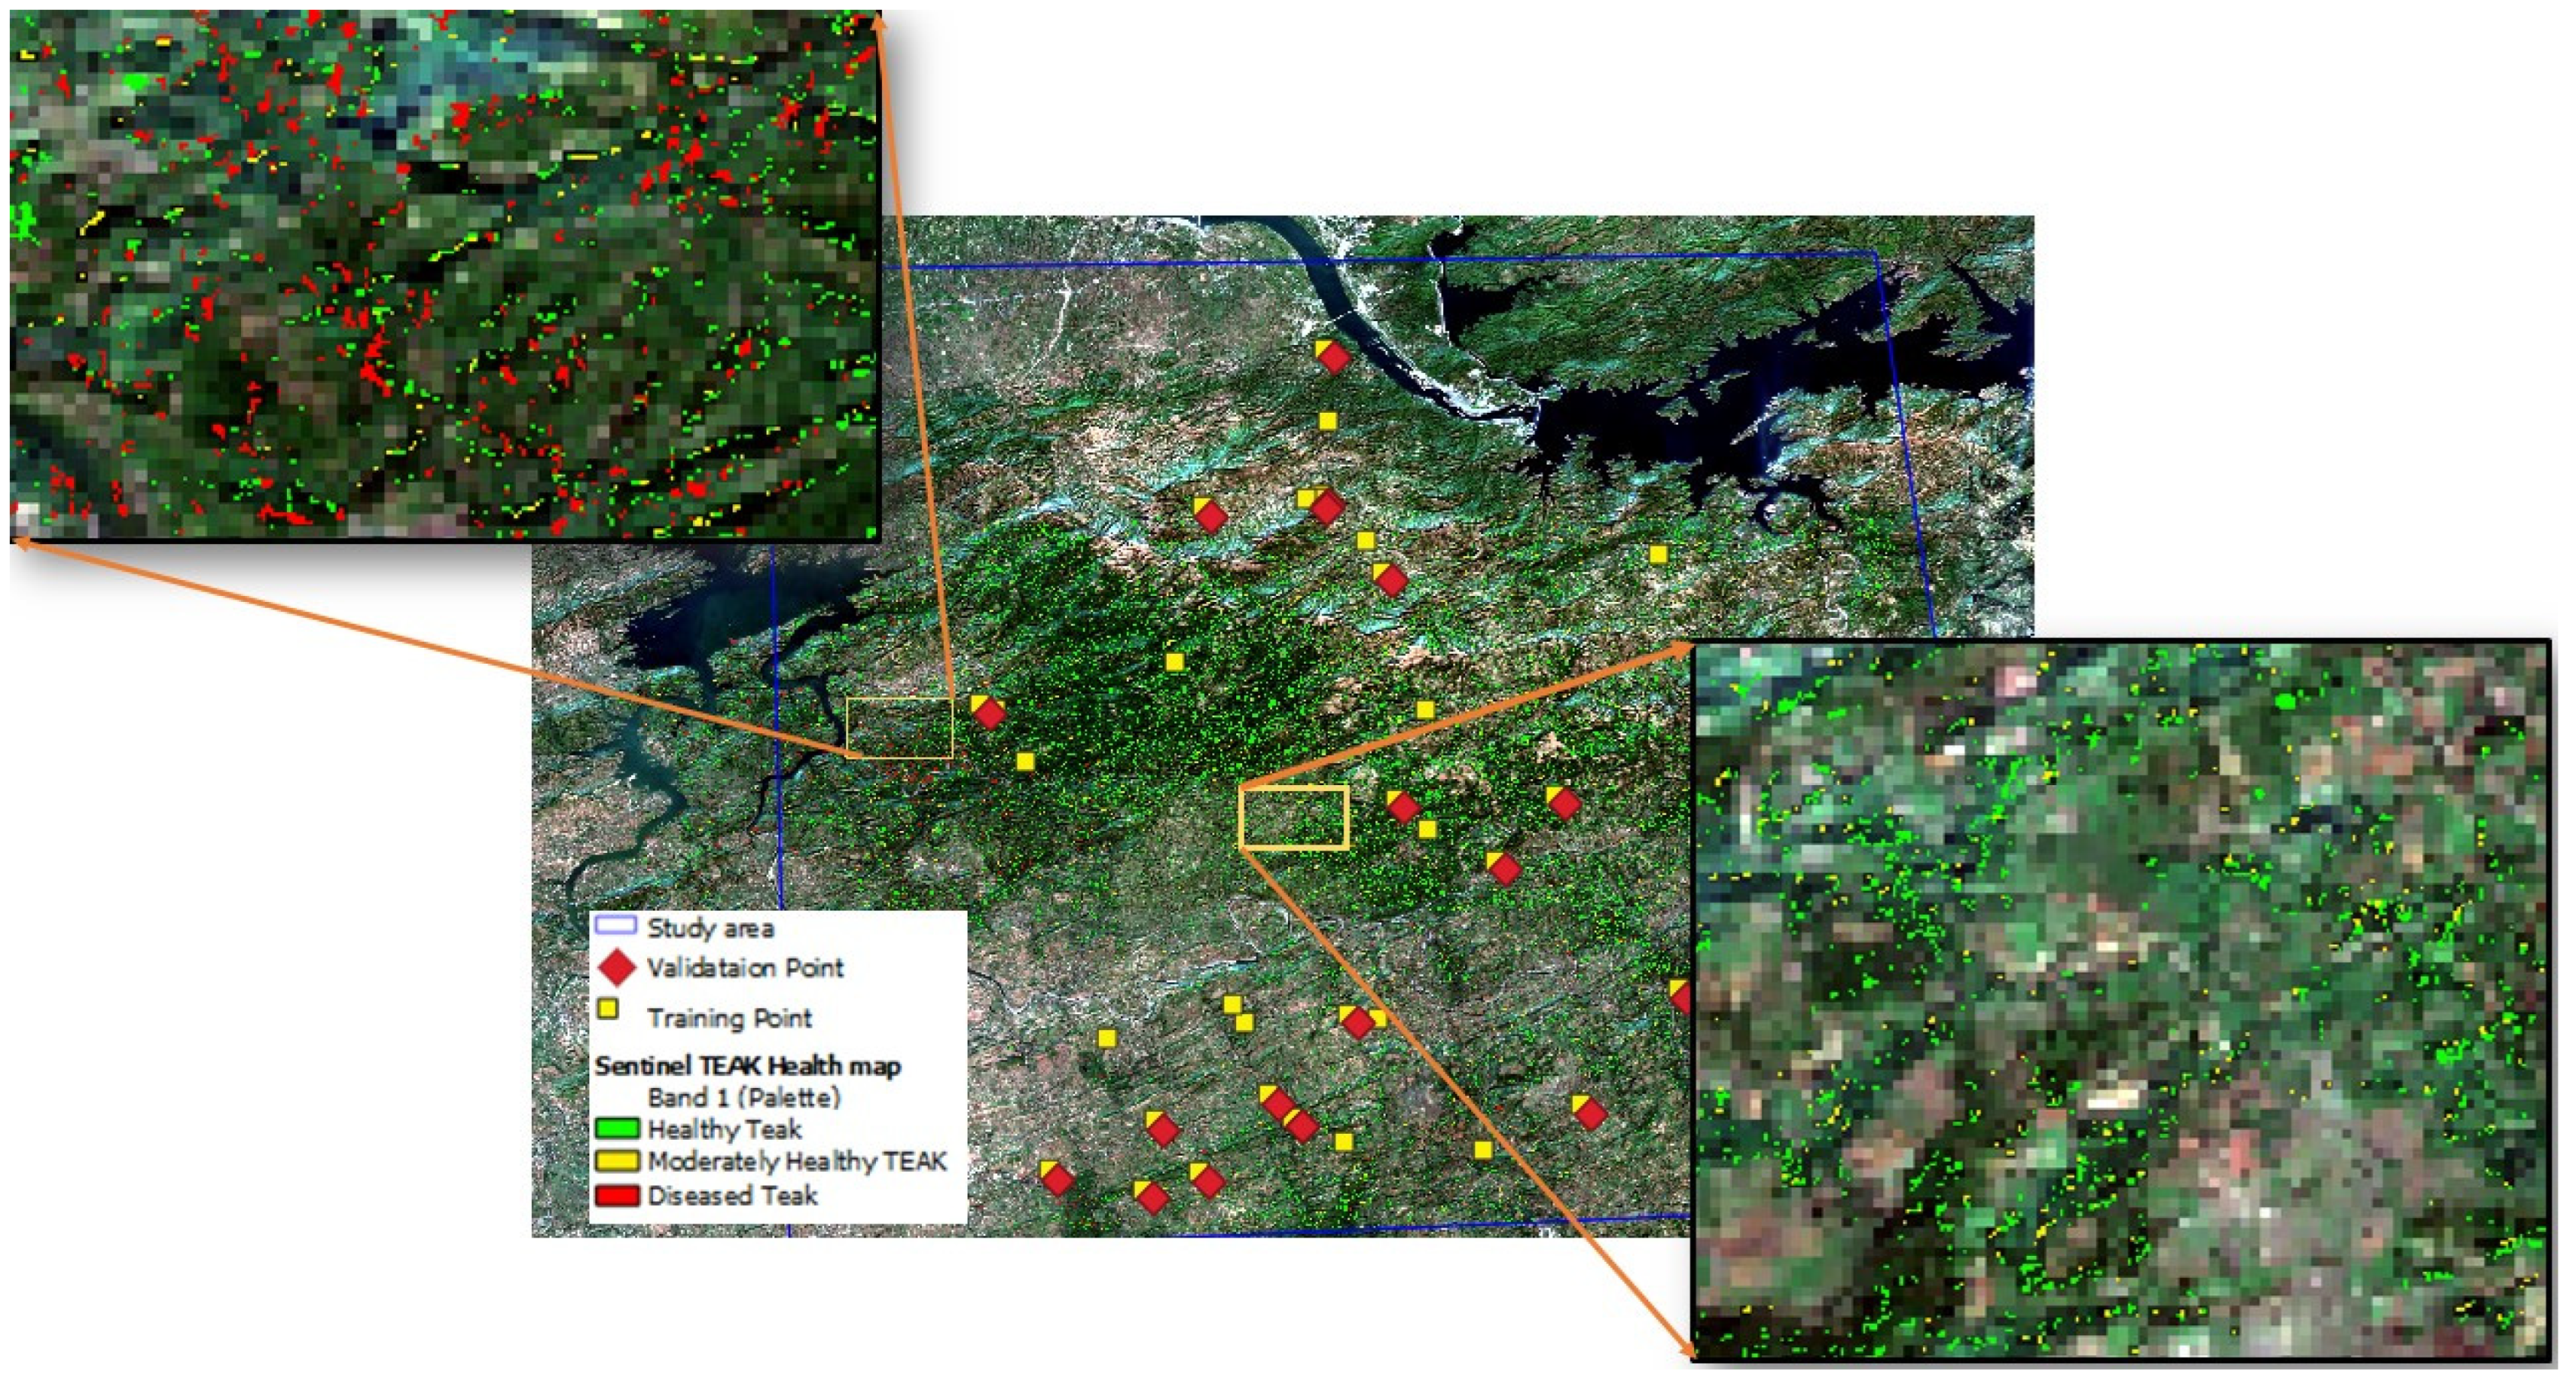
4. Result and Discussion
Accuracy
5. Conclusions
Funding
Institutional Review Board Statement
Informed Consent Statement
Data Availability Statement
Conflicts of Interest
References
- Davis, L.S.; Norman Johnson, K.; Bettinger, P.S.; Howard, T.E.; Alván Encinas, L.; Salazar, M.; Gretzinger, S.; Lange, G.; Schmithusen, F.; Hyde, W.; et al. Forest Management: To Sustain Ecological, Economic, and Social Values; Universidad Nacional Agraria La Molina: Lima, Perú, 2001. [Google Scholar]
- Buschbacher, R.J. Natural forest management in the humid tropics: Ecological, social, and economic considerations. Ambio 1990, 19, 253–258. [Google Scholar]
- Meng, J.; Li, S.; Wang, W.; Liu, Q.; Xie, S.; Ma, W. Mapping Forest Health Using Spectral and Textural Information Extracted from SPOT-5 Satellite Images. Remote Sens. 2016, 8, 719. [Google Scholar] [CrossRef] [Green Version]
- Kiran, S.G.; Mudaliar, A. Remote sensing & Geo-informatics technology in evaluation of forest tree diversity. Asian J. Plant Sci. Res. 2012, 2, 237–242. [Google Scholar]
- Andersen, H.-E.; Strunk, J.; Temesgen, H.; Atwood, D.; Winterberger, K. Using multilevel remote sensing and ground data to estimate forest biomass resources in remote regions: A case study in the boreal forests of Interior Alaska. Can. J. Remote Sens. 2012, 37, 596–611. [Google Scholar] [CrossRef]
- Du, L.; Zhou, T.; Zou, Z.; Zhao, X.; Huang, K.; Wu, H. Mapping forest biomass using remote sensing and national forest inventory in China. Forests 2014, 5, 1267–1283. [Google Scholar] [CrossRef] [Green Version]
- Egli, S. Mycorrhizal mushroom diversity and productivity—An indicator of forest health? Ann. For. Sci. 2011, 68, 81–88. [Google Scholar] [CrossRef] [Green Version]
- Zhang, J.; Huang, S.; Hogg, E.; Lieffers, V.; Qin, Y.; He, F. Estimating spatial variation in alberta forest biomass from a combination of forest inventory and remote sensing data. Biogeosciences 2014, 11, 2793–2808. [Google Scholar] [CrossRef] [Green Version]
- Getzin, S.; Wiegand, K.; Schöning, I. Assessing biodiversity in forests using very high-resolution images and unmanned aerial vehicles. Method. Ecol. Evol. 2012, 3, 397–404. [Google Scholar] [CrossRef]
- Peduzzi, A.; Wynne, R.H.; Fox, T.R.; Nelson, R.F.; Thomas, V.A. Estimating leaf area index in intensively managed pine plantations using airborne laser scanner data. For. Ecol. Manag. 2012, 270, 54–65. [Google Scholar] [CrossRef] [Green Version]
- Fassnacht, F.E.; Latifi, H.; Stereńczak, K.; Modzelewska, A.; Lefsky, M.; Waser, L.T.; Straub, C.; Ghosh, A. Review of studies on tree species classification from remotely sensed data. Remote Sens. Environ. 2016, 186, 64–87. [Google Scholar] [CrossRef]
- Madonsela, S.; Cho, M.A.; Mathieu, R.; Mutanga, O.; Ramoelo, A.; Kaszta, Z.; Van De Kerchove, R.; Wolff, E. Multi-phenology WorldView-2 imagery improves remote sensing of savannah tree species. Int. J. Appl. Earth Obs. Geoinf. 2017, 58, 65–73. [Google Scholar] [CrossRef]


Publisher’s Note: MDPI stays neutral with regard to jurisdictional claims in published maps and institutional affiliations. |
© 2022 by the author. Licensee MDPI, Basel, Switzerland. This article is an open access article distributed under the terms and conditions of the Creative Commons Attribution (CC BY) license (https://creativecommons.org/licenses/by/4.0/).
Share and Cite
Mudaliar, A. Potential Use of Sentinel-2 Data for Discrimination of Tectona grandis L. Healthy and Non-Healthy Tree Species Using Spectral Angle Mapper. Environ. Sci. Proc. 2022, 22, 13. https://doi.org/10.3390/IECF2022-13130
Mudaliar A. Potential Use of Sentinel-2 Data for Discrimination of Tectona grandis L. Healthy and Non-Healthy Tree Species Using Spectral Angle Mapper. Environmental Sciences Proceedings. 2022; 22(1):13. https://doi.org/10.3390/IECF2022-13130
Chicago/Turabian StyleMudaliar, Ashwini. 2022. "Potential Use of Sentinel-2 Data for Discrimination of Tectona grandis L. Healthy and Non-Healthy Tree Species Using Spectral Angle Mapper" Environmental Sciences Proceedings 22, no. 1: 13. https://doi.org/10.3390/IECF2022-13130