Proceeding Paper

An Aerosol Optical Depth Comparison Study Based on Satellite Observations of the Western Indian Region, Surat †

by
Ranjitkumar Solanki
* and
Kamlesh Pathak
Department of Physics, Sardar Vallabhbhai National Institute of Technology, Surat 395007, India
*
Author to whom correspondence should be addressed.
Presented at the 5th International Electronic Conference on Atmospheric Sciences, 16–31 July 2022; Available online: https://ecas2022.sciforum.net.
Environ. Sci. Proc. 2022, 19(1), 9; https://doi.org/10.3390/ecas2022-12861
Published: 31 July 2022
(This article belongs to the Proceedings of The 5th International Electronic Conference on Atmospheric Sciences)

Abstract

:
The aerosol optical depth (AOD) was measured along the Tapi River in the Gulf of Khambhat in Surat, Gujarat (India). Satellite data from MODIS relating to the aerosol optical depth (AOD) were collected from the Giovanni site, developed by NASA. In this study, the data from a period of 5 years (January to December 2015 to 2019) are discussed. Variations in the regional meteorological conditions are related to aerosol optical depth characteristics. The annual average AOD variation was observed from the data obtained from January to December 2015–2019. The average annual changes in the aerosol optical depth (AOD) revealed a peak value during the monsoon season, while the seasonal mean aerosol optical depth (AOD) was lowest during the pre-monsoon season, and it was somewhat moderate in the winter season. The post-monsoon season’s variations in the aerosol optical depth (AOD) were comparable to those of the winter and pre-monsoon seasons in 2016. Following this, the values increased and exceeded the maximum for both the Aqua and Terra measurements, owing to changes in the local boundary layer.

1. Introduction

Aerosol in the atmosphere is a suspension of liquid and solid particles with radii ranging from a few nanometres to 100 m. These particles are very dynamic in space and time, and they have significant local and regional consequences, including reduced visibility, pollution from urban air, and potential health consequences [1]. Aerosols have both direct and indirect effects on solar energy transmission [2]. The scattering (and absorption) of incoming radiation from solar energy diminishes the surface insolation as a direct impact. The indirect effect is due to changes in the cloud droplet size as a result of cloud albedo rises and potential cloud lifetimes. It leads to a decrease in the surface solar exposure. Optical radiation scattering and absorption are affected by their size distribution, refractive index, and total atmospheric loading. As a result, solar radiation reaching the Earth’s surface is attenuated or obliterated [3].
Aerosols in the atmosphere are determined to be one of the major contributors to the great unpredictability of climate sensitivity, and they also increase the concentration of greenhouse gases in the atmosphere. Atmospheric aerosols can effectively impact the radiation budget and climate directly and indirectly by modifying the density and size of cloud droplets, resulting in alterations to the formation of clouds, the cloud albedo, and the clouds’ period of existence, as well as the chance of condensation. Dust aerosols also have a substantial impact on atmospheric radiative and climatic forces via their interactions with clouds, which influence cloud optical characteristics and precipitation efficiencies.

2. Data and Methodology

2.1. Satellite-Based Measurement of Aerosols

Scientist use different techniques to measure the AOD over the land and oceans, but it is quite difficult to measure. The remote sensing method is a useful and powerful technique for studying and monitoring the AOD over lands and oceans on a global as well as regional scale. However, it is difficult to observe the spatial–temporal distribution of the abovementioned characteristics on a regular basis from the ground.
Satellite observations offer detailed information over a long time period and across a vast geographic area. Aerosol monitoring uses space-based equipment to determine the atmospheric involvement from the total signal collected by the satellite sensor. Moderate resolution imaging spectroradiometer (MODIS) instruments were used in this study for the measurement of aerosols in the atmosphere. The two sensors of the MODIS on NASA’s Terra (operational since February 2000) and Aqua (operational since June 2002) satellites monitor the Earth from its polar orbit. This satellite passes over the equator at different crossing times, with Terra and Aqua crossing at 10:30 local time and at 13:30 local time, respectively [4].
Many investigators have studied the effectiveness of atmospheric data obtained from MODIS on Terra and Aqua. According to Kaufman [5] the capability of space-borne sensors to study the optical behaviour of aerosols and their limitations has been discussed in detail. Presently, many Earth-orbiting satellites provide aerosol optical depth data on a daily basis, with entire global coverage. Remote sensing sensors, such as Sea-WiFS, AVHRR and MODIS, have produced a large amount of data that have attracted the attention of scientists for the purpose of their analysis and application in climate modelling.

2.2. MODIS (Moderate Resolution Imaging Spectroradiometer)

The moderate resolution imaging spectroradiometer (MODIS) is a novel sensor or device that can characterize global aerosol features both spatially and temporally. MODIS was launched on NASA’s Terra satellite in December 1999 and Aqua satellite in May 2002 and includes 36 channels ranging from 0.41 to 15 m in the spectral range and three spatial resolutions: 250 m (two channels), 500 m (five channels), and 1 km (twenty-nine channels). The retrieval of aerosol data uses seven of these channels (0.47–2.13 m) to recover characteristics of the aerosols, as well as additional wavelengths in other areas of the spectrum, in order to identify cloud and river sediments [6,7,8,9]. MODIS, in contrast with prior satellite sensors that lacked adequate spectrum diversification, has great potential to determine the optical thickness of aerosols with better accuracy, as well as aerosol size metrics [10,11].

3. Results and Discussion

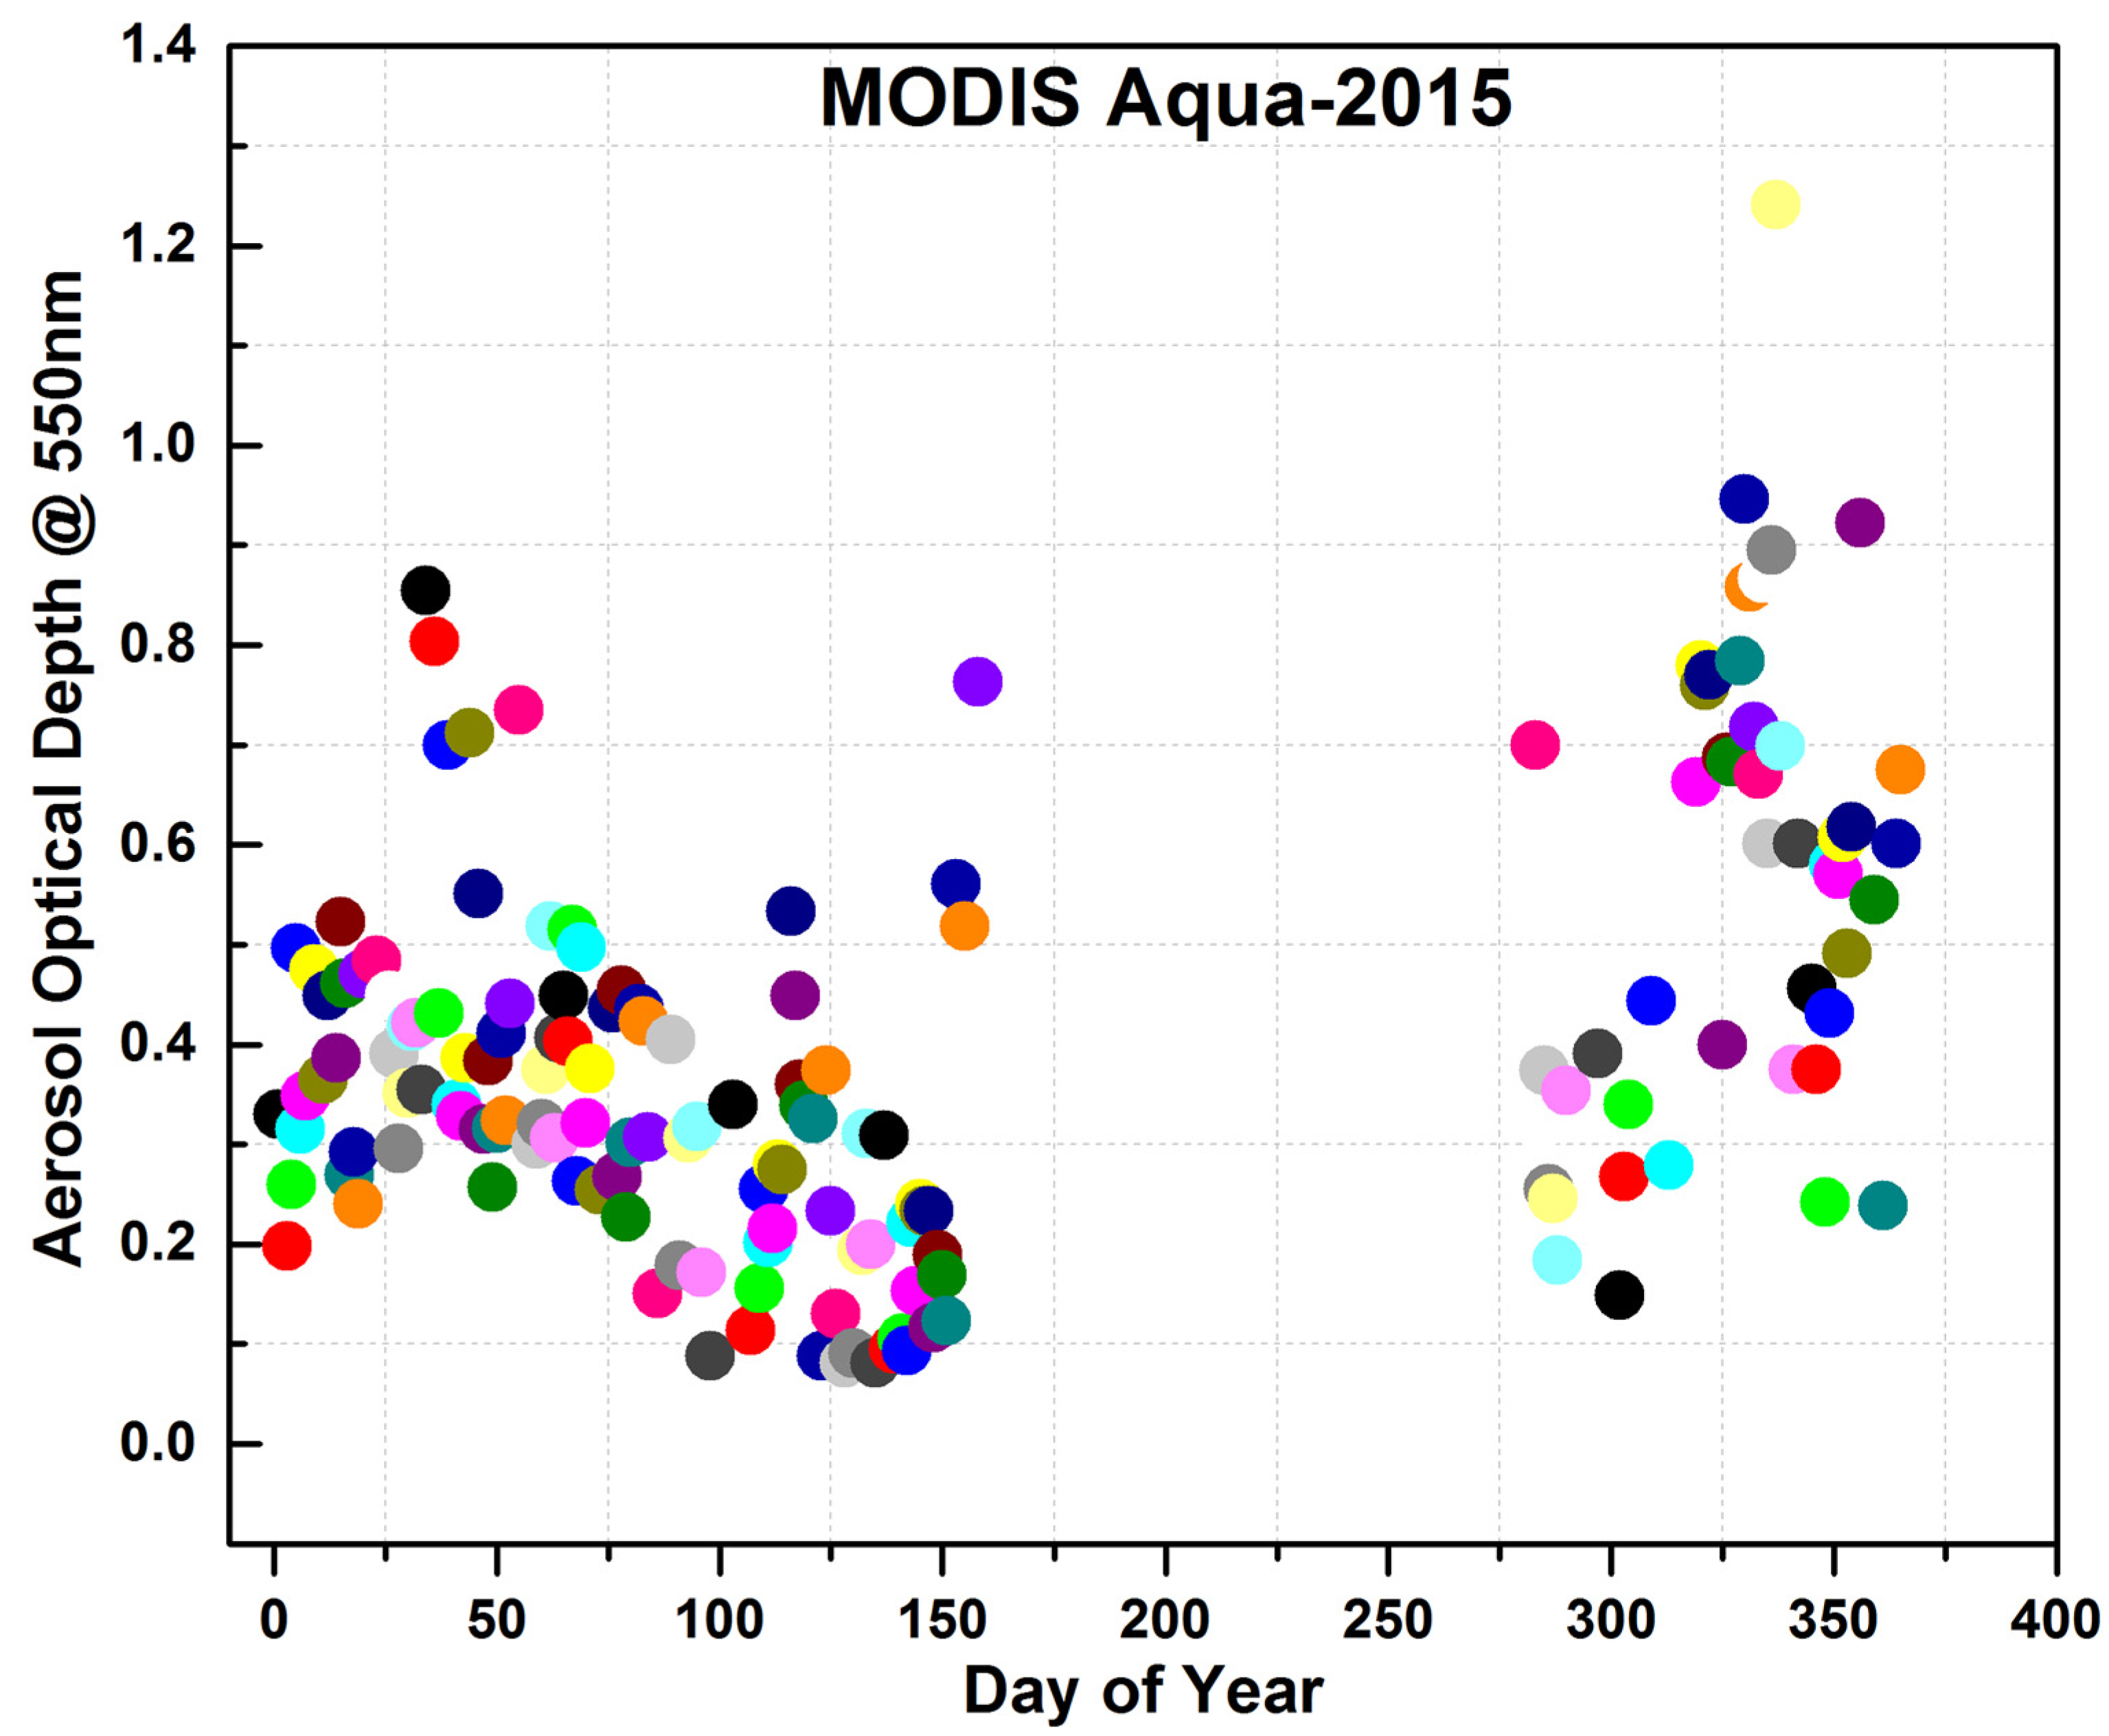
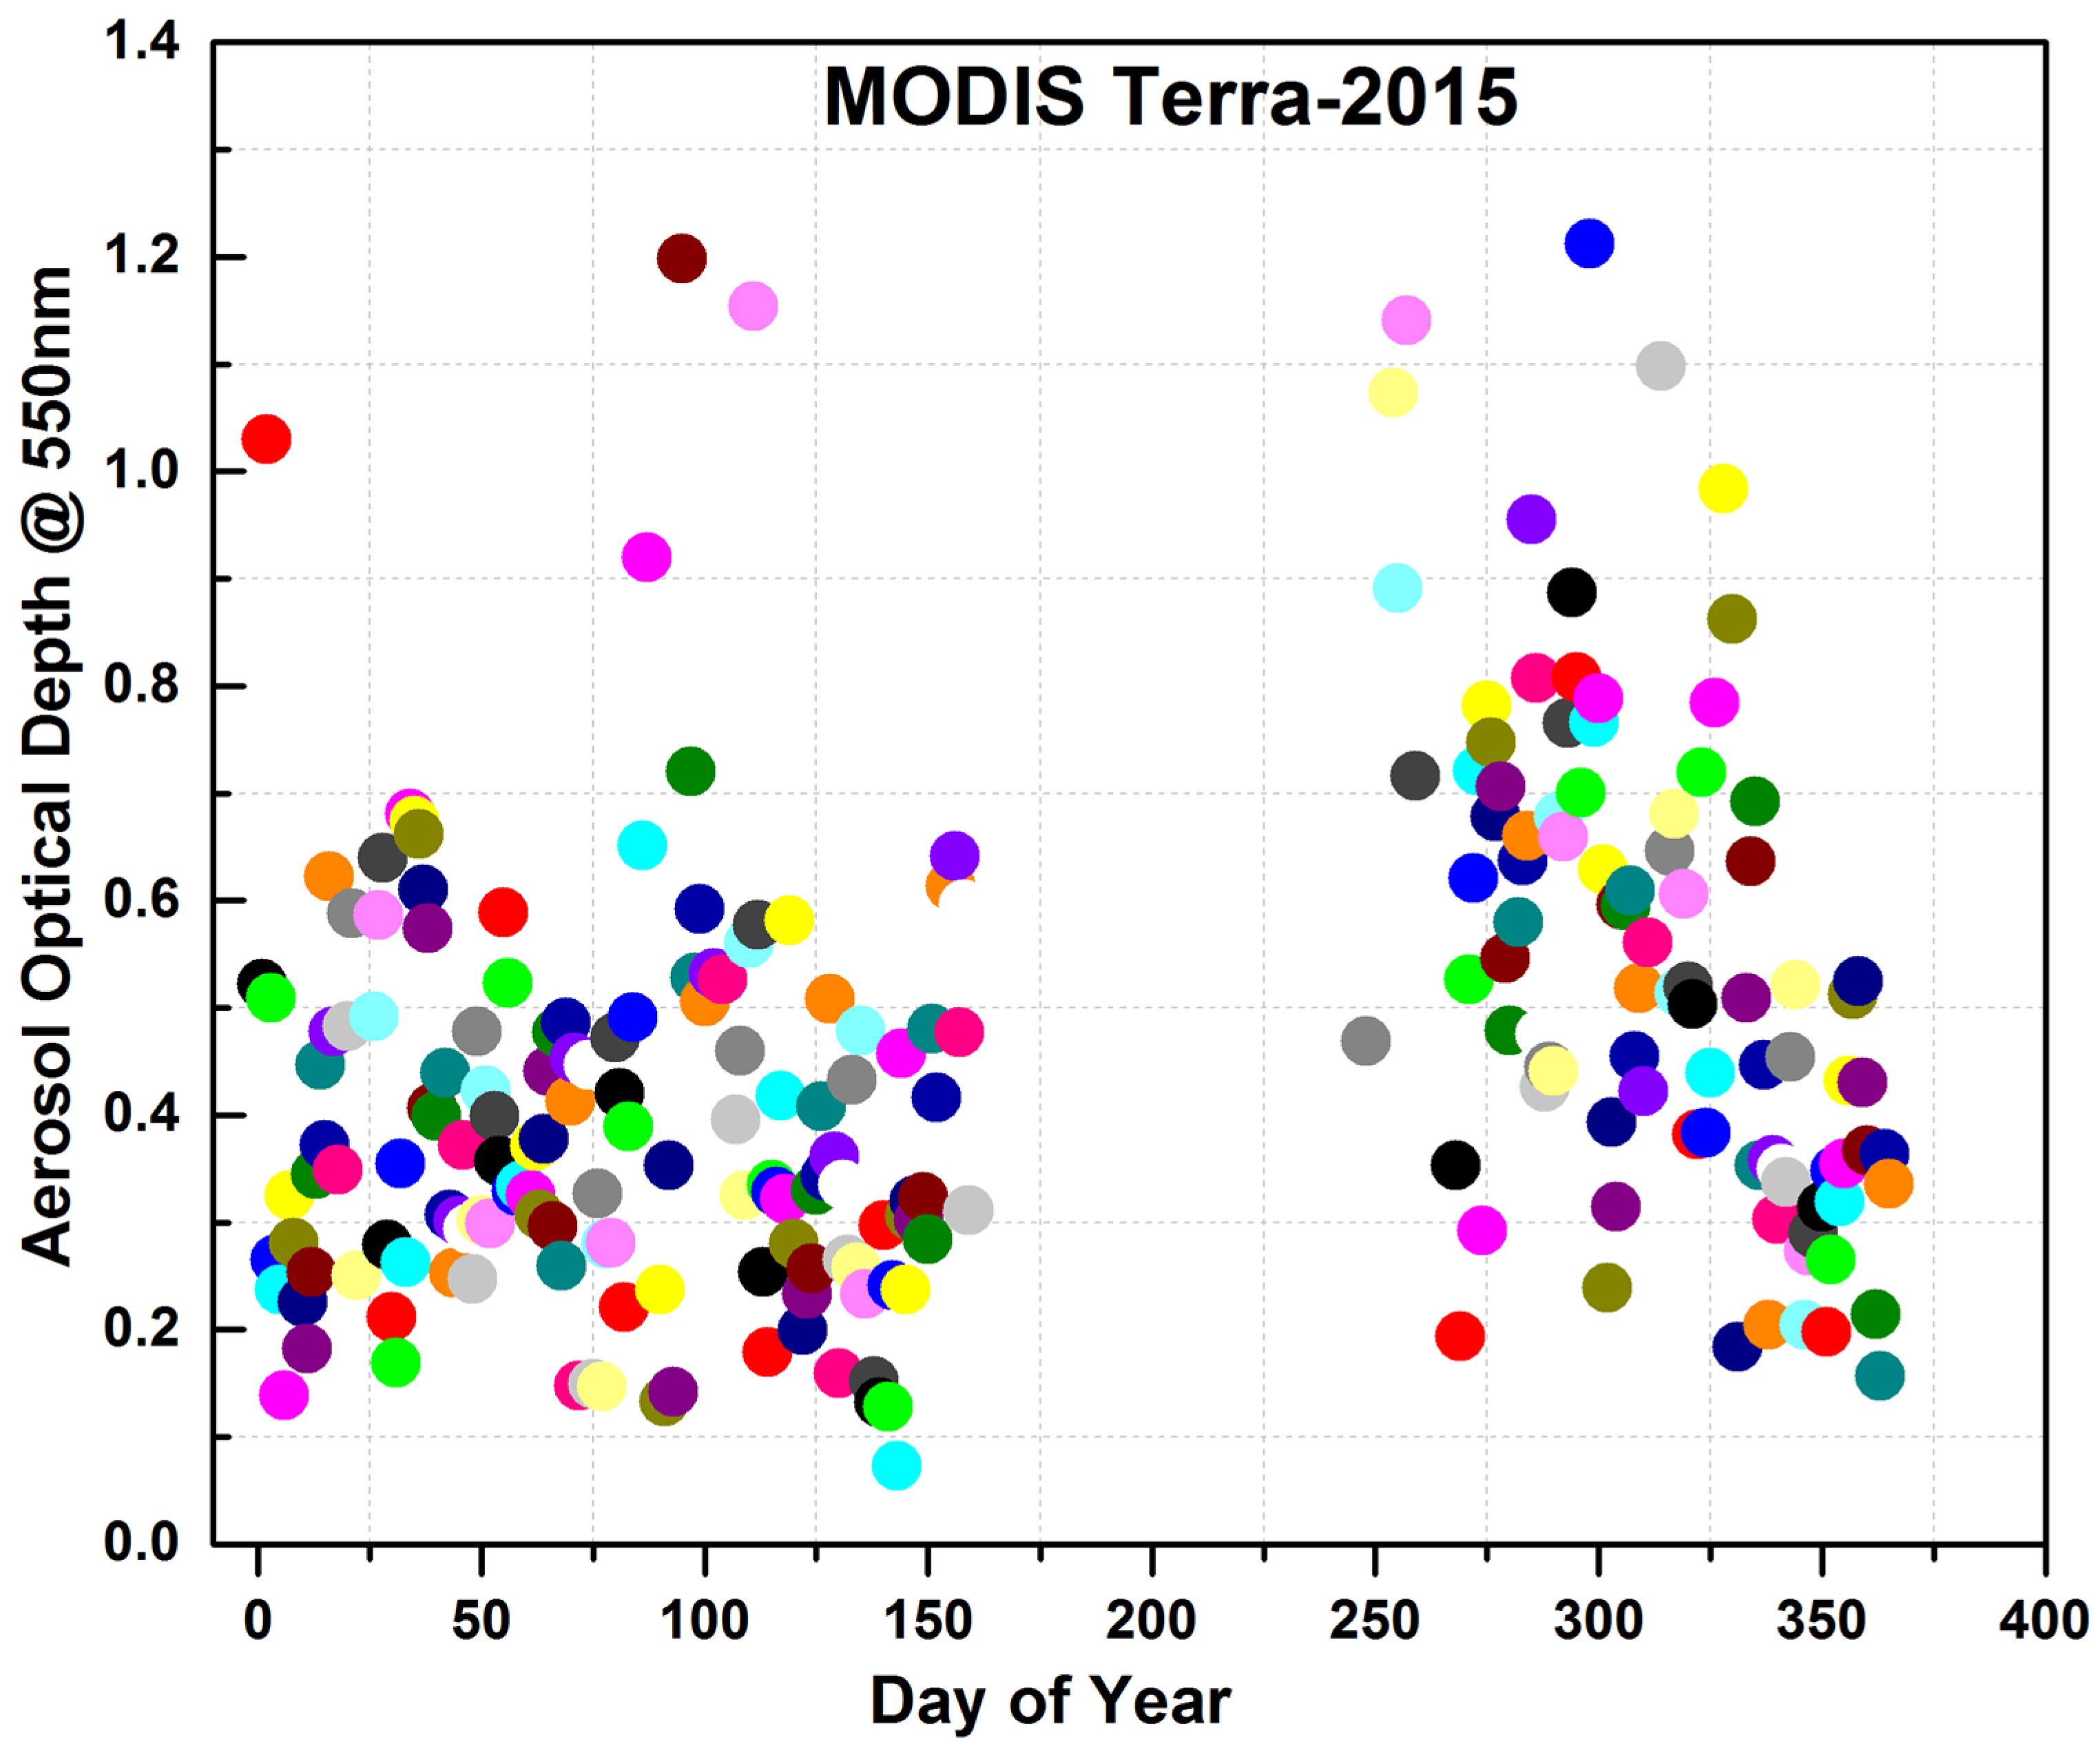
3.1. Daily AOD Variation over the Surat Region

Many studies on aerosols in India have focused on the black carbon aerosol effect and the effect on the climate across the globe. MODIS Aqua and Terra satellite data for 2015 are shown in Figure 1 and Figure 2, respectively, illustrating the day-to-day variations in AOD over the Surat region. The data gap in the middle part of the figure is due to the unavailability of data during the monsoon months, as the MODIS retrieval algorithm detects and screens out the cloud contamination [12]. The figure represents the variations in the AOD at 550 nm on the vertical axis with the corresponding day of the year (DOY) on the horizontal axis.
The higher values of the AOD around the monsoon period may be due to the contamination of the cloud. Comparatively high AOD (>0.5) was observed around February, which is the winter period in this region. The overall trend observed in both the MODIS Aqua and Terra data followed a similar pattern, but with variation in the number of records and values. This difference between the Aqua and Terra data is due to the differences across time periods and continually varying atmospheric conditions at the time of the observations.

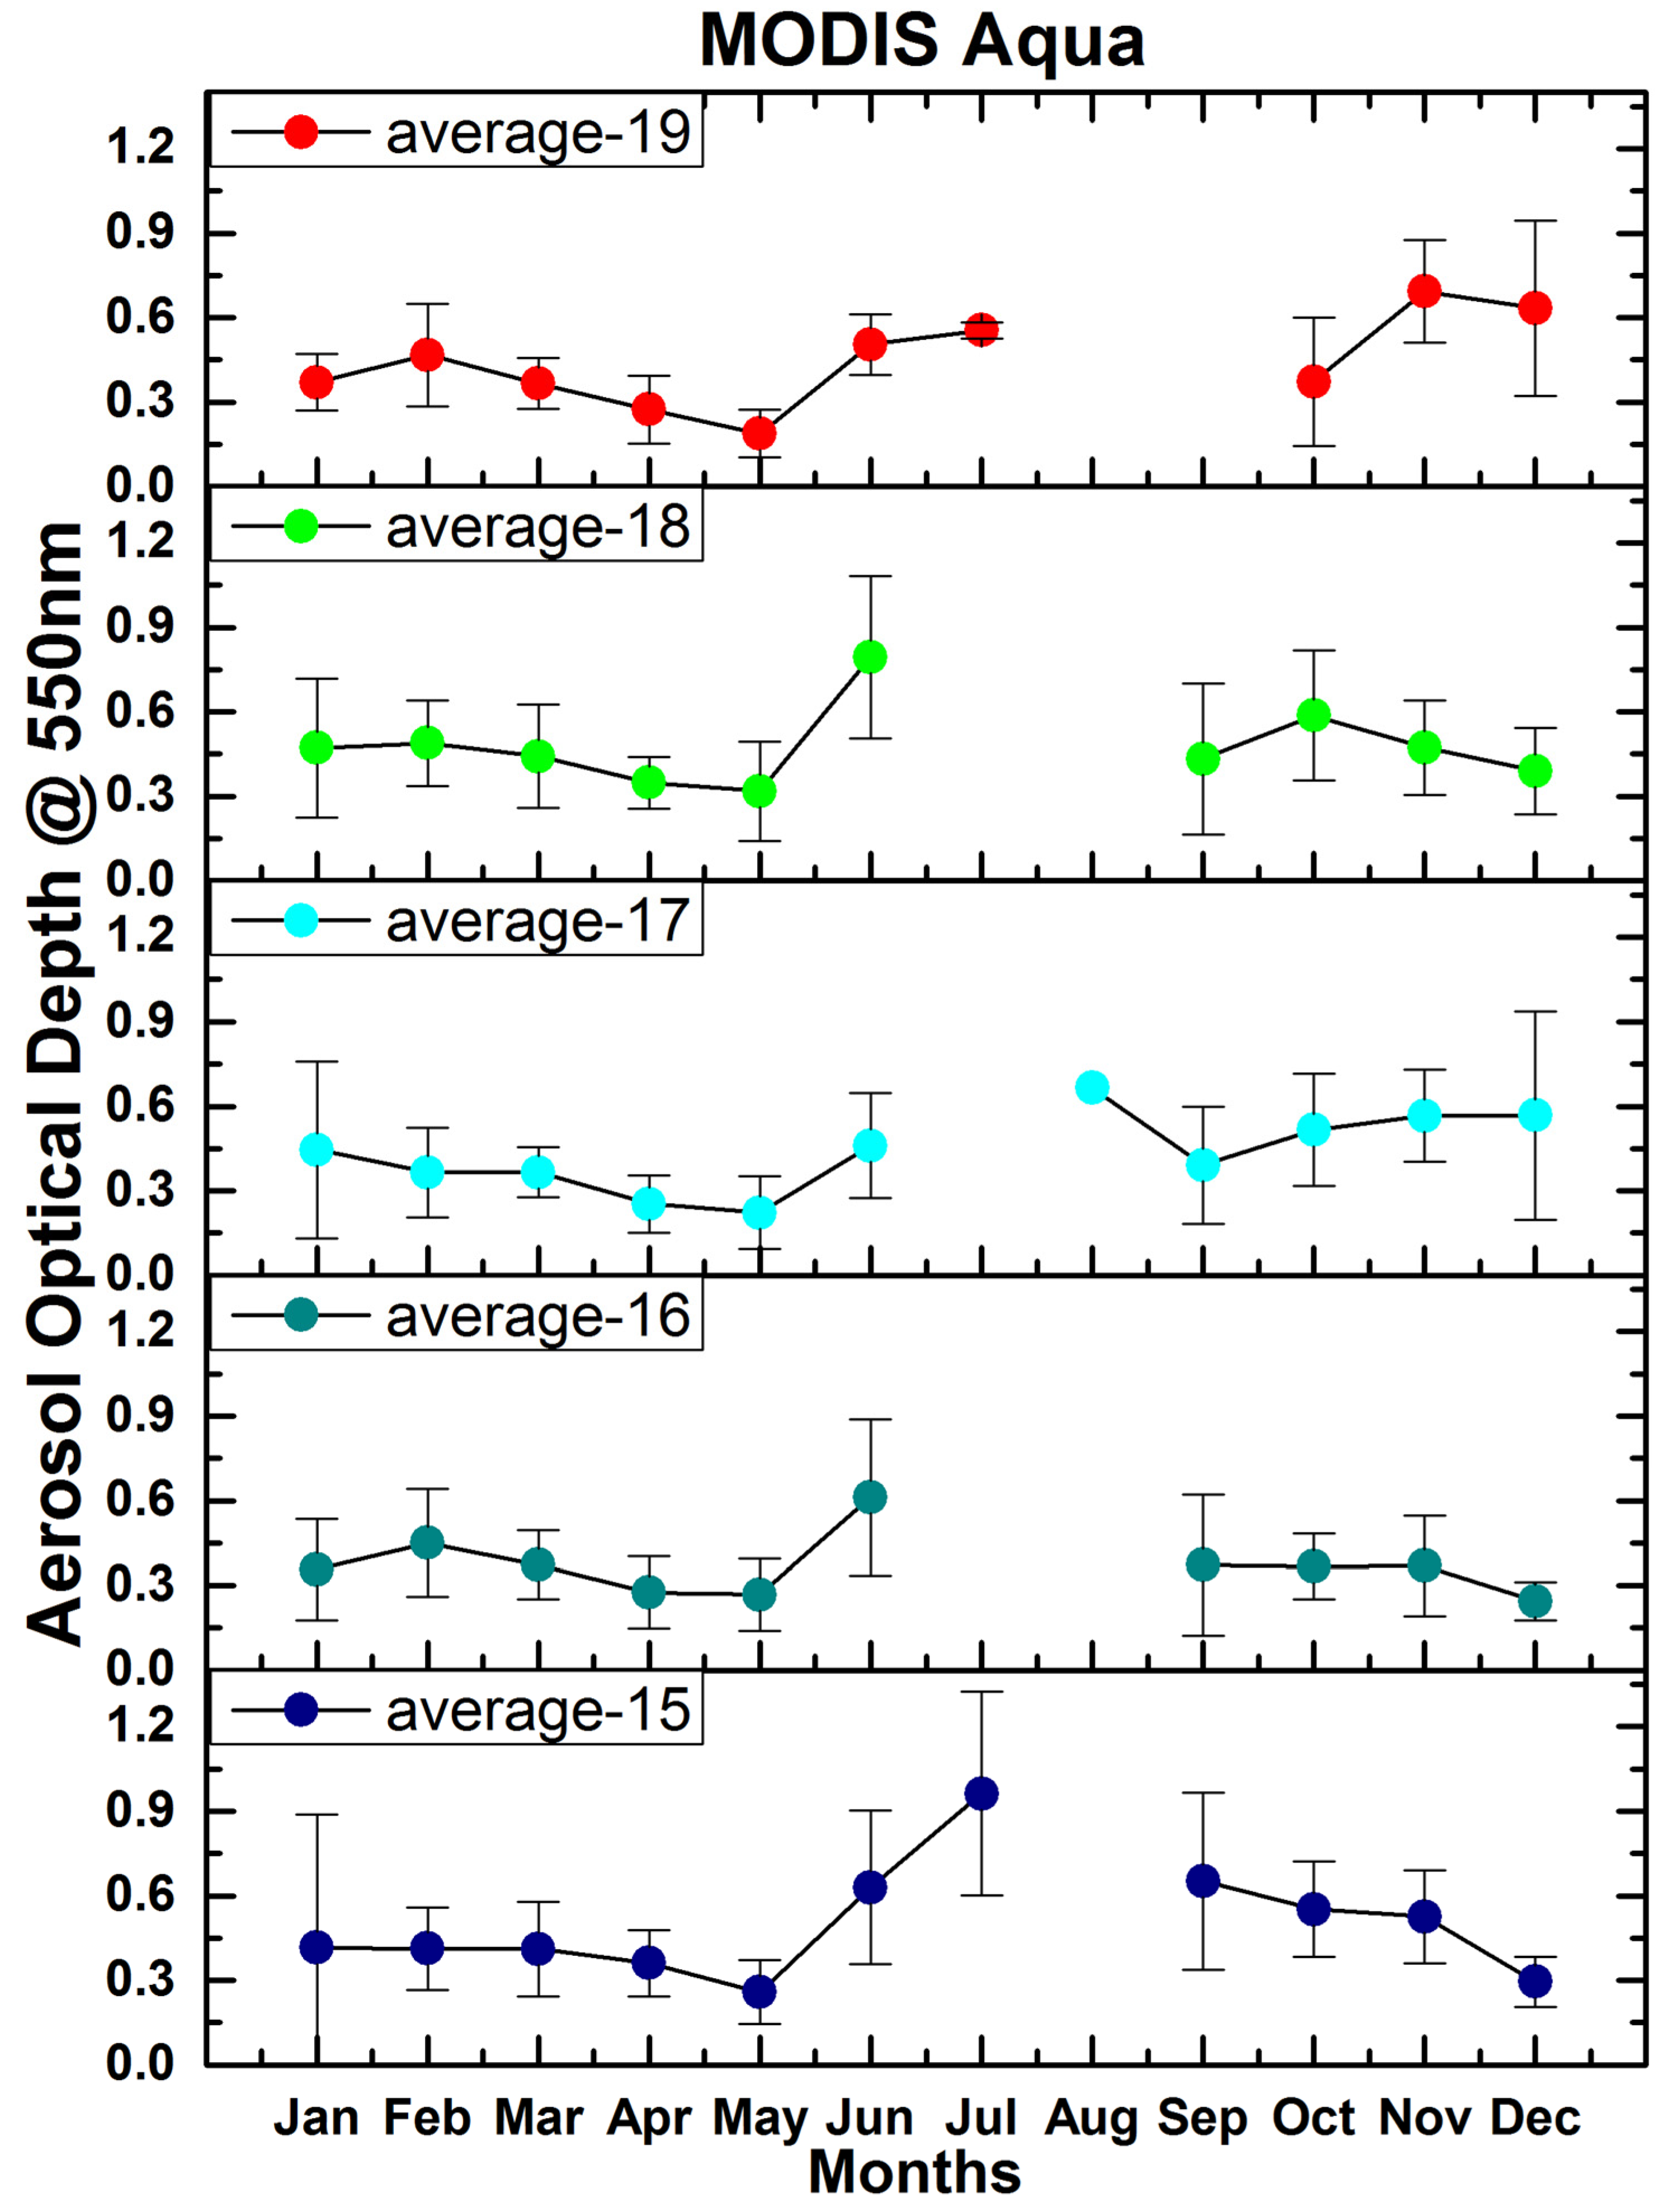
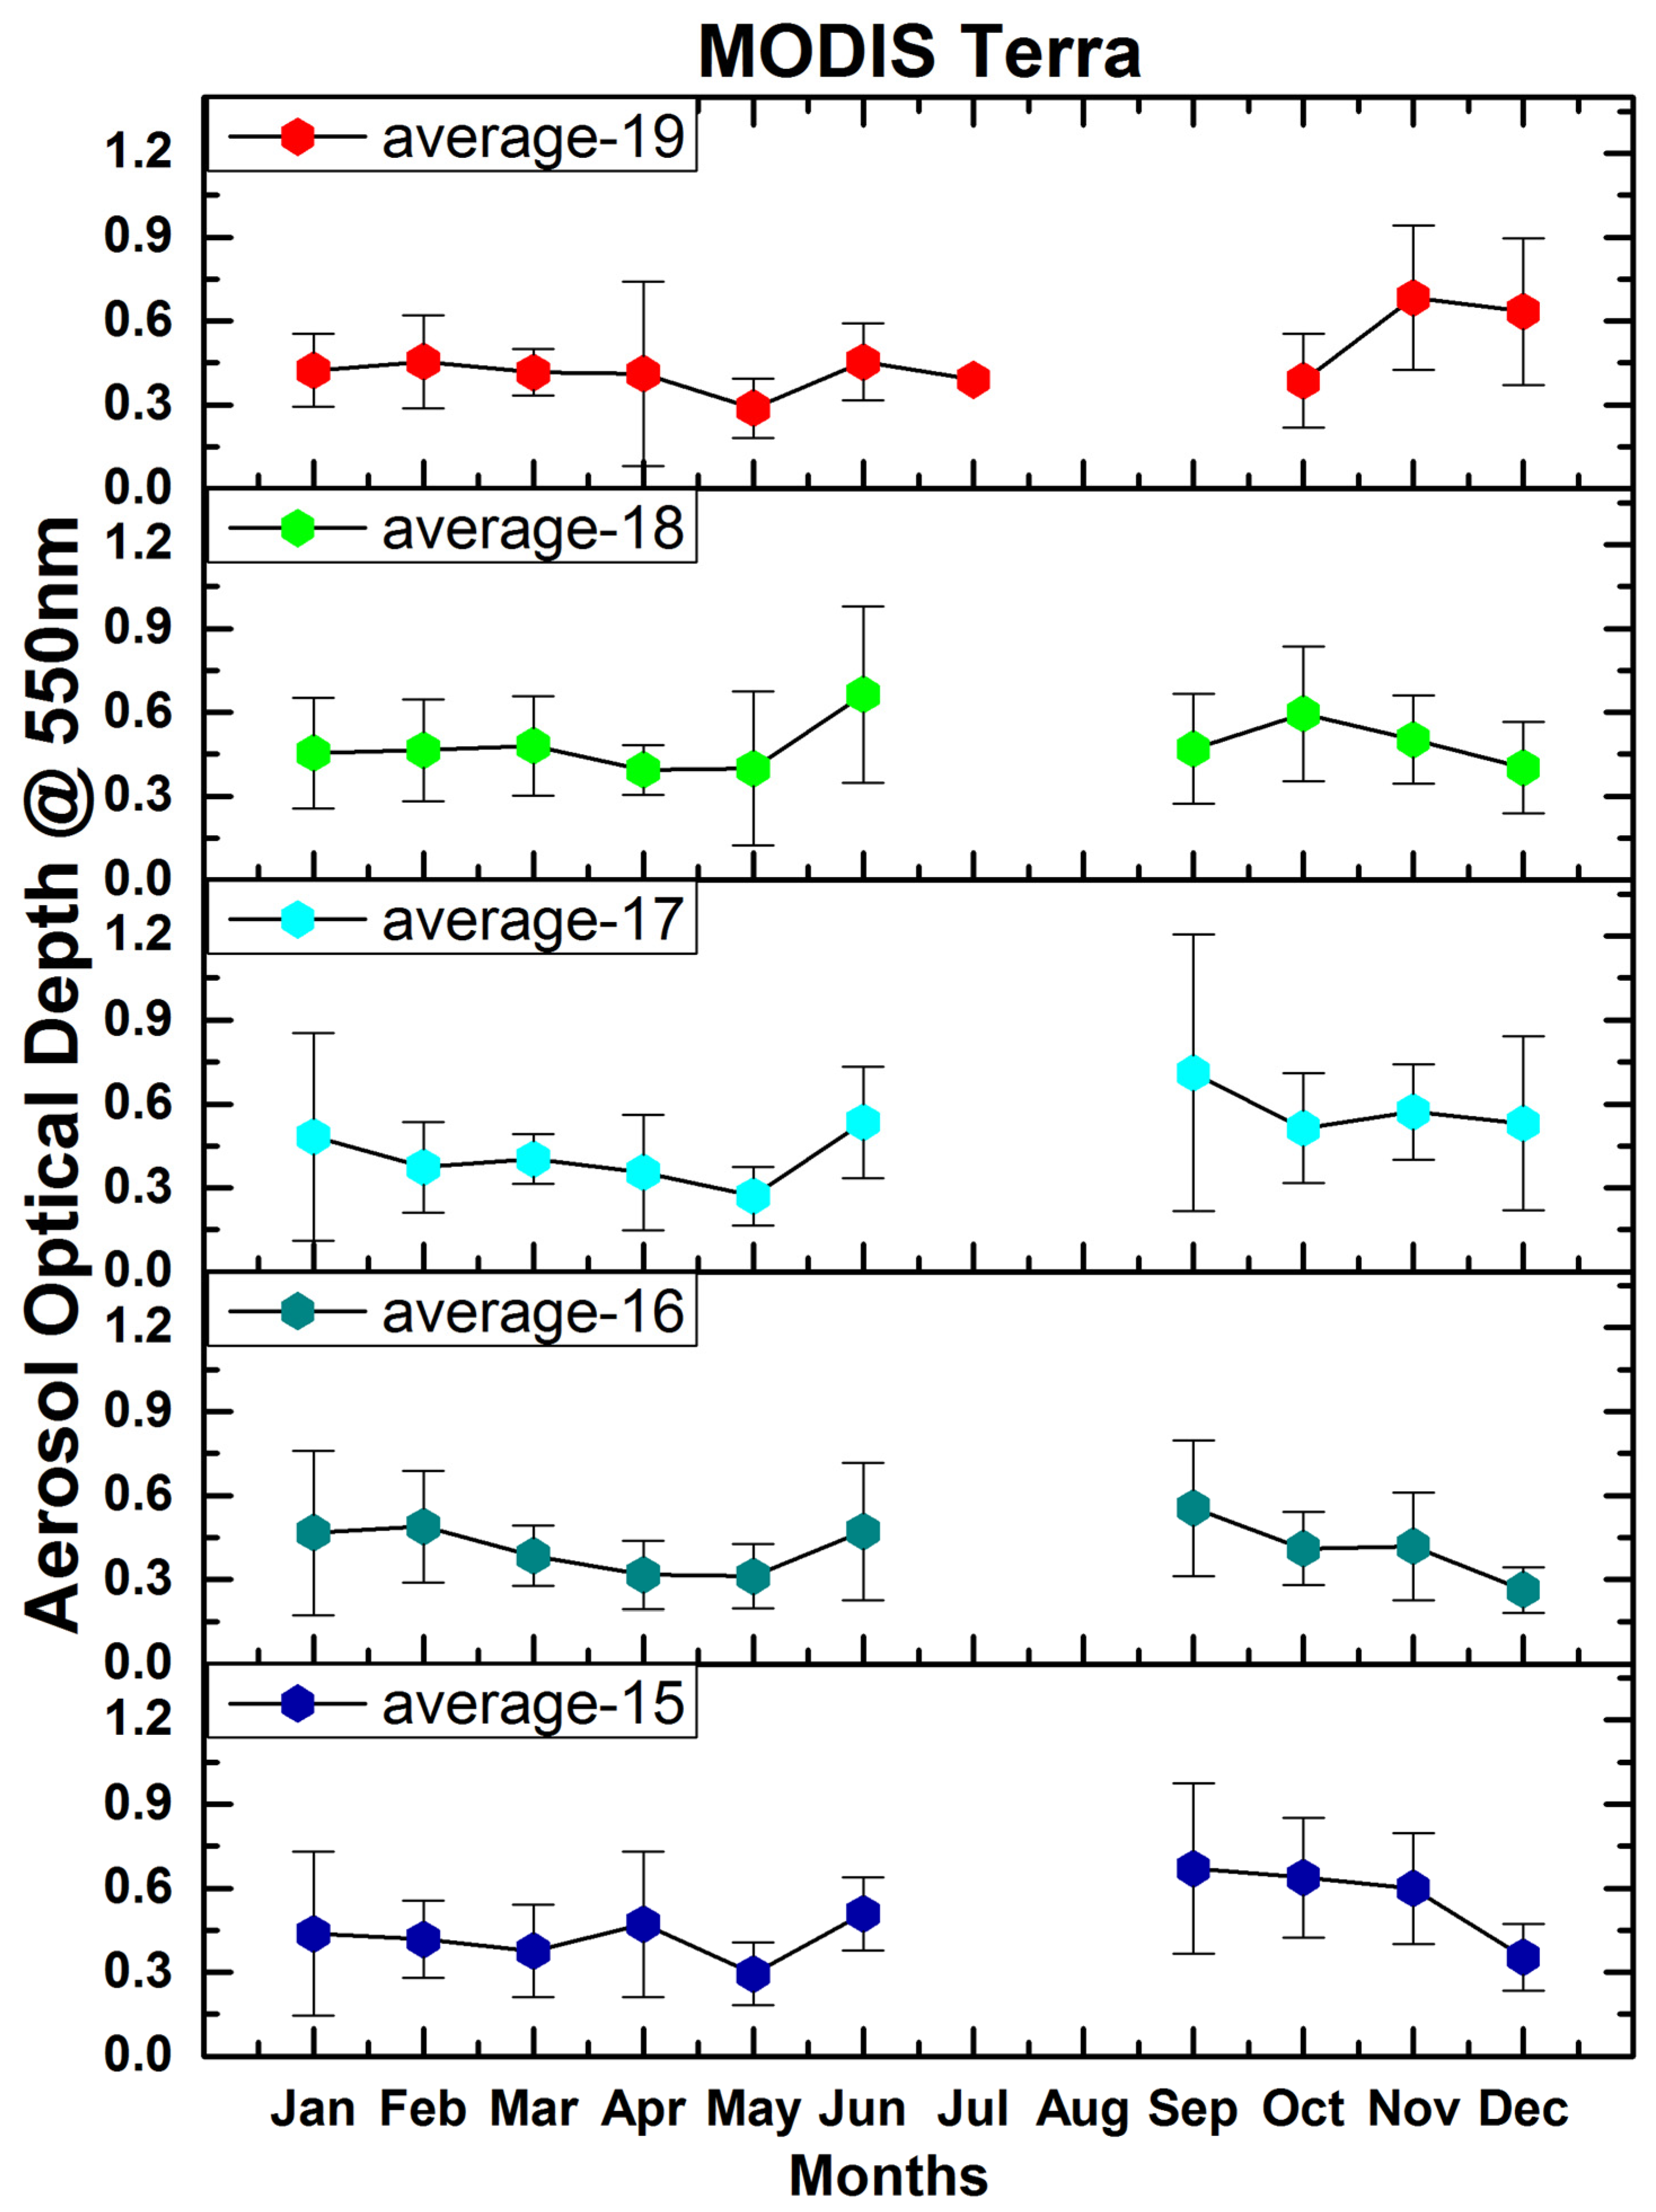
3.2. Monthly Variations in the AOD over Surat

Figure 3 and Figure 4 depict the monthly average aerosol optical depths (AODs) from 2015 to 2019 at 550 nm, derived from the MODIS Aqua and Terra satellites sensors. The MODIS AOD retrieval procedure’s improved cloud screening algorithm [13,14] (Mhawish et al., 2017; Sogacheva et al., 2017) reveals a data gap around the monsoon season (June to September). The MODIS AOD values were higher, and throughout these months cloud contamination was observed. The Figure 3 and Figure 4 also indicate the yearly inter-comparison of the MODIS Aqua and Terra mean observations. In both the satellites, the lower AOD values were usually recorded in May for all years.

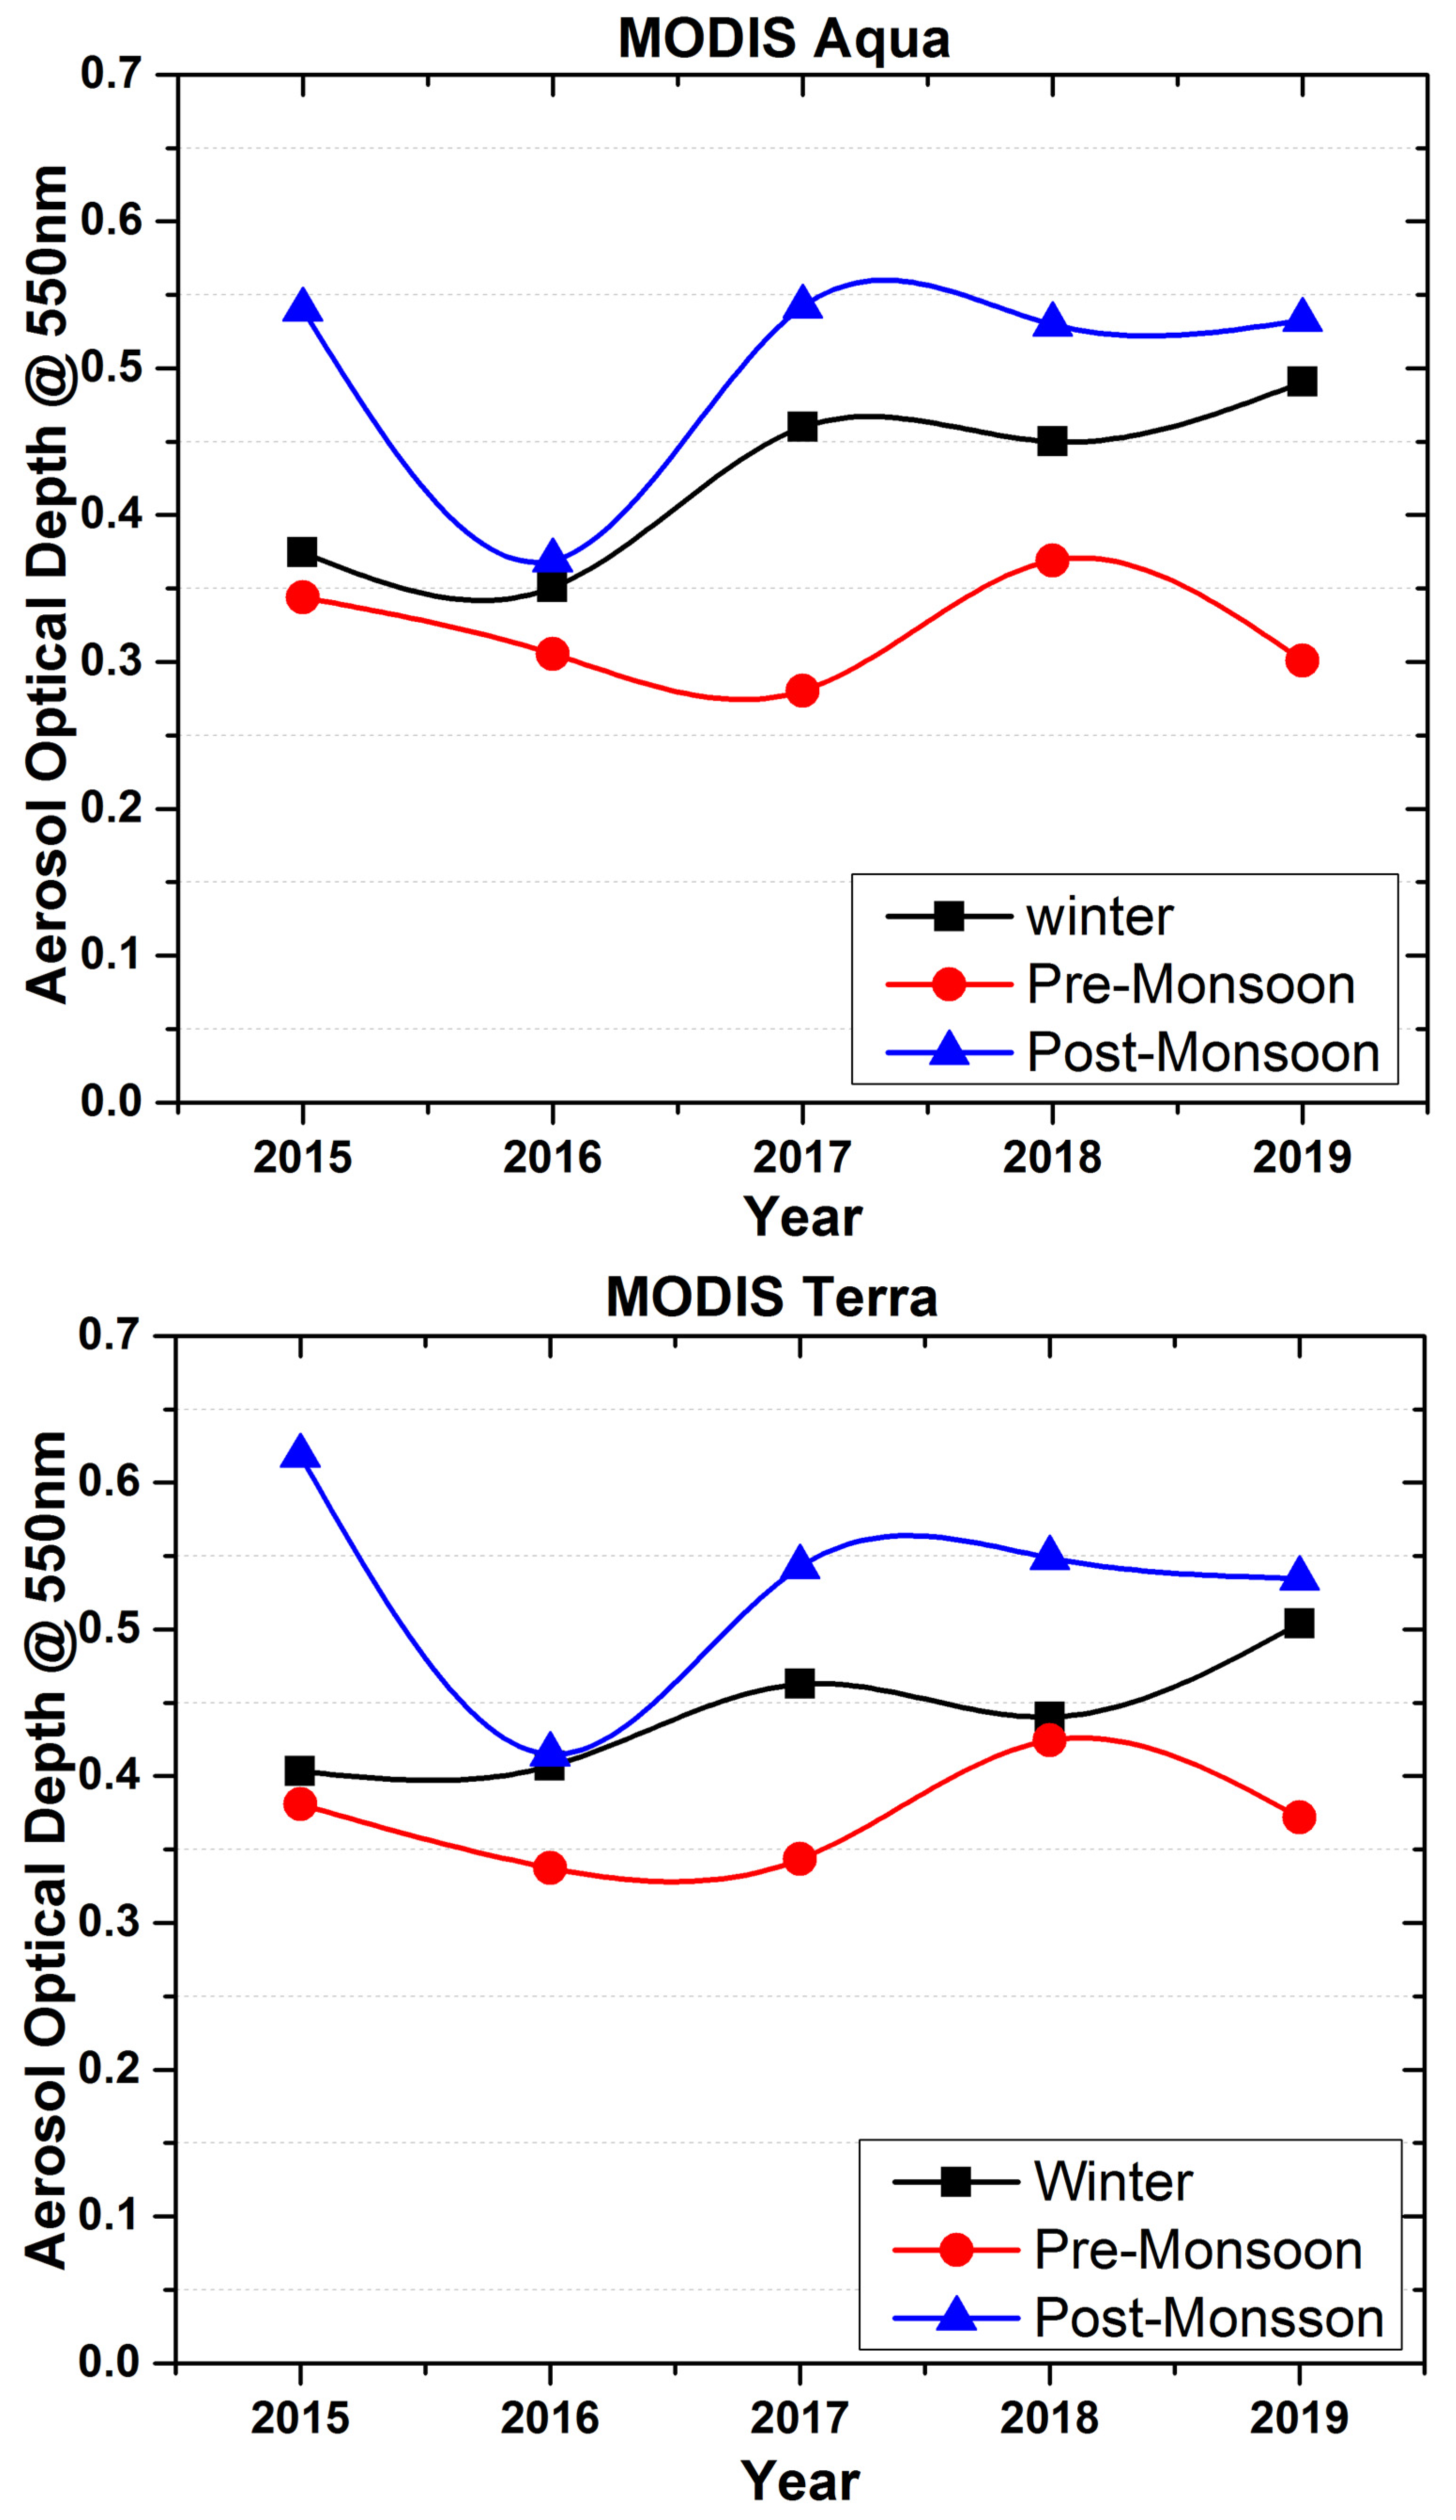
3.3. Seasonal Variations over the Surat Region

The study region experiences four seasons annually, which can be categorised as the winter or dry (December to February), pre-monsoon (March to May), monsoon (June to September) and post-monsoon (October to November) seasons. Seasonal means of the MODIS Aqua and Terra AODs at 550 nm for the winter, pre-monsoon and post monsoon months are shown in the Figure 5, respectively.

4. Summary and Conclusions

The lowest AOD values were identified during the pre-monsoon season, whereas the winter season had a moderate AOD. In 2016, the post-monsoon season showed similar variations to the winter and pre-monsoon seasons, although the values rose after that time and peaked in both the Aqua and Terra observations. The seasonal variations in the MODIS Terra AOD showed higher values compared to the Aqua AOD values.

Author Contributions

Conceptualization, R.S. and K.P.; methodology, R.S.; validation, R.S. and K.P.; formal analysis, R.S.; investigation, R.S.; resources, R.S.; data curation, R.S.; writing—original draft preparation, R.S.; writing—review and editing, R.S.; visualization, R.S. and K.P.; supervision, K.P. All authors have read and agreed to the published version of the manuscript.

Funding

The research received no external funding.

Institutional Review Board Statement

Not applicable.

Informed Consent Statement

Not applicable.

Data Availability Statement

Publicly available datasets were analyzed in this study. This data can be found here: [https://giovanni.gsfc.nasa.gov/giovanni/].

Acknowledgments

The authors wish to thank those that provided the data sets used in this paper, which were produced with the Giovanni online data system, developed and maintained by the NASA GES DISC.

Conflicts of Interest

The authors declare no conflict of interest.

References

  1. Pope, C.A.; Burnett, R.T.; Thun, M.J.; Calle, E.E.; Krewski, D.; Ito, K.; Thurston, G.D. Lung Cancer, Cardiopulmonary Mortality, and Long-term Exposure to Fine Particulate Air Pollution. JAMA 2002, 287, 1132–1141. [Google Scholar] [CrossRef] [PubMed]
  2. Ramanathan, V.; Crutzen, P.J.; Kiehl, J.T.; Rosenfeld, D. Aerosols, climate, and the hydrological cycle. Science 2001, 294, 2119–2124. [Google Scholar] [CrossRef] [PubMed]
  3. Ranjan, R.R.; Joshi, H.P.; Iyer, K.N. Spectral variation of total column aerosol optical depth over Rajkot: A tropical semi-arid Indian station. Aerosol Air Qual. Res. 2007, 7, 33–45. [Google Scholar] [CrossRef]
  4. Ma, X.; Bartlett, K.; Harmon, K.; Yu, F. Comparison of AOD between CALIPSO and MODIS: Significant differences over major dust and biomass burning regions. Atmos. Meas. Tech. 2013, 6, 2391–2401. [Google Scholar] [CrossRef]
  5. Kaufman, Y.J.; Tanré, D.; Remer, L.A.; Vermote, E.F.; Chu, A.; Holben, B.N. Operational remote sensing of tropospheric aerosol over land from EOS moderate resolution imaging spectroradiometer. J. Geophys. Res. Atmos. 1997, 102, 17051–17067. [Google Scholar] [CrossRef]
  6. Ackerman, S.A.; Strabala, K.I.; Menzel, W.P.; Frey, R.A.; Moeller, C.C.; Gumley, L.E. Discriminating clear sky from clouds with MODIS. J. Geophys. Res. Atmos. 1998, 103, 32141–32157. [Google Scholar] [CrossRef]
  7. Gao, B.-C.; Kaufman, Y.J.; Tanre, D.; Li, R.-R. Distinguishing tropospheric aerosols from thin cirrus clouds for improved aerosol retrievals using the ratio of 1.38-μm and 1.24-μm channels. Geophys. Res. Lett. 2002, 29, 36-1–36-4. [Google Scholar] [CrossRef]
  8. Martins, J.V. MODIS Cloud screening for remote sensing of aerosols over oceans using spatial variability. Geophys. Res. Lett. 2002, 29, 8009. [Google Scholar] [CrossRef]
  9. Li, R.-R.; Kaufman, Y.J.; Gao, B.-C.; Davis, C.O. Remote sensing of suspended sediments and shallow coastal waters. IEEE Trans. Geosci. Remote Sens. 2003, 41, 559–566. [Google Scholar]
  10. Tanré, D.; Kaufman, Y.J.; Herman, M.; Mattoo, S. Remote sensing of aerosol properties over oceans using the MODIS/EOS spectral radiances. J. Geophys. Res. Atmos. 1997, 102, 16971–16988. [Google Scholar] [CrossRef]
  11. Tanré, D.; Herman, M.; Kaufman, Y.J. Information on aerosol size distribution contained in solar reflected spectral radiances. J. Geophys. Res. Atmos. 1996, 101, 19043–19060. [Google Scholar]
  12. Frey, R.A.; Ackerman, S.A.; Liu, Y.; Strabala, K.I.; Zhang, H.; Key, J.R.; Wang, X. Cloud detection with MODIS. Part I: Improvements in the MODIS cloud mask for collection 5. J. Atmos. Ocean. Technol. 2008, 25, 1057–1072. [Google Scholar]
  13. Mhawish, A.; Banerjee, T.; Broday, D.M.; Misra, A.; Tripathi, S.N. Evaluation of MODIS Collection 6 aerosol retrieval algorithms over Indo-Gangetic Plain: Implications of aerosols types and mass loading. Remote Sens. Environ. 2017, 201, 297–313. [Google Scholar] [CrossRef]
  14. Sogacheva, L.; Kolmonen, P.; Virtanen, T.H.; Rodriguez, E.; Saponaro, G.; de Leeuw, G. Post-processing to remove residual clouds from aerosol optical depth retrieved using the Advanced Along Track Scanning Radiometer. Atmos. Meas. Tech. 2017, 10, 491–505. [Google Scholar] [CrossRef]
Figure 1. Daily variation in the AOD in 2015 using MODIS Aqua observations.
Environsciproc 19 00009 g001
Figure 2. Daily variation in the AOD in 2015 using MODIS Terra observations.
Environsciproc 19 00009 g002
Figure 3. MODIS Aqua AOD (550 nm) monthly variation during the years 2015–2019.
Environsciproc 19 00009 g003
Figure 4. MODIS Terra AOD (550 nm) monthly variation during the years 2015–2019.
Environsciproc 19 00009 g004
Figure 5. MODIS Aqua and Terra AOD (550 nm) seasonal variation during the years 2015–2019.
Environsciproc 19 00009 g005
Publisher’s Note: MDPI stays neutral with regard to jurisdictional claims in published maps and institutional affiliations.

