1. Introduction
Clouds play an essential role in the Earth’s radiation budget and the hydrological cycle [
1]. Despite their well-known importance, clouds and aerosols are two of the greatest contributors to the uncertainty in the climate change drift [
2]. For this reason, the macroscopic characterization of clouds and cloud monitoring have become relevant for describing the impact of clouds in climate change. Moreover, monitoring clouds is necessary for many other applications. For example, the importance of accurately estimating cloud-base height (CBH) in a precise manner is notorious in the aviation field. The visual meteorological conditions (VMC) are based on cloud-base height, among other meteorological variables, setting the altitude of the aircraft’s obligatory instrumental control. This aviation criterion requires an operative estimation of cloud-base height for the safety of the people in the flight, leading to a need for an accurate description of the atmospheric profiles over the aircraft track.
Historically, cloud-base height has been estimated by human observers by comparison to orographic information. In the present, the height of the top and the bottom of the clouds can be retrieved from satellites and ground-based stations, respectively. Ceilometers are the most common ground-based instruments for cloud-base height determination [
3]. However, new instruments have been developed to complement ceilometer measurements, such as stereoscopic systems [
4], all-sky cameras [
5] or infrared cameras [
6,
7]. Recent research has put the focus on infrared cameras as they offer interesting day and night information about the spatial distribution of clouds. Clouds are made up of small water droplets or ice crystals suspended in the air, so the cloud base is in thermal equilibrium with the air layer immediately below. According to this, cloud-base temperature can be estimated by its brightness temperature, as the infrared emissivity of clouds can be considered close to one.
In the context of infrared camera measurements of cloud-base height, some atmospheric gases interact notably with the radiation emitted by clouds, aerosols, atmospheric gases and the Earth’s surface, by absorption and emission processes. For this reason, an atmospheric correction is needed to obtain reliable estimates of the cloud-base height by infrared technology. The principal objective of this paper is to emphasize the importance of the atmospheric correction for accurately estimating the cloud-base height with infrared measurements.
2. Methods
In this work, line-by-line radiative solver RADIS has been employed. This open-source code is used for modeling the emission and absorption spectra of the atmospheric species available in HITRAN, HITEMP and CDSD databases [
8]. As most cloud formation occurs in the troposphere, only CO
2 and H
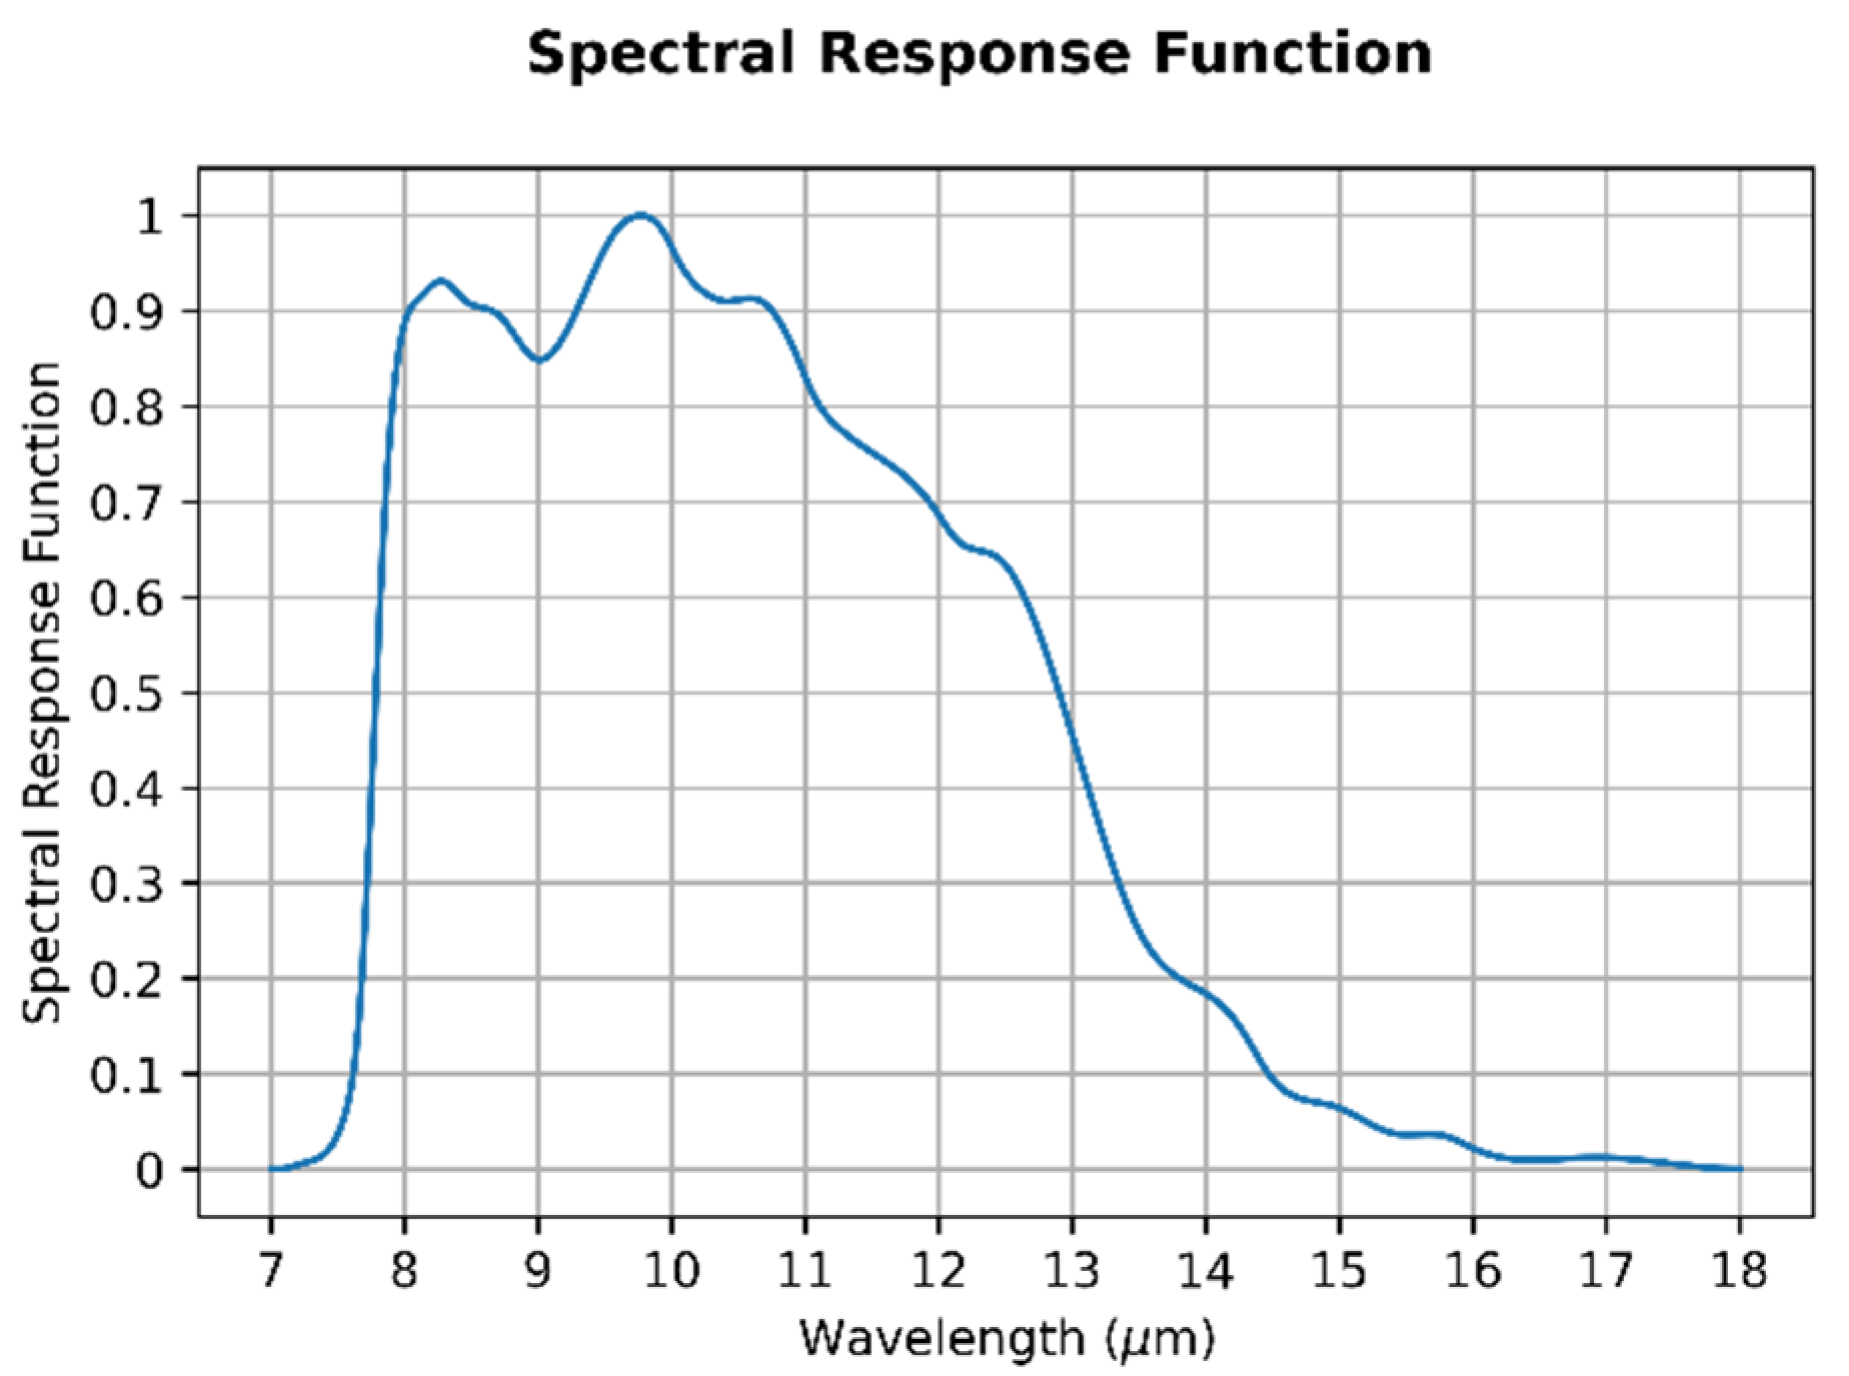
2O species have been selected from the HITRAN database and its emission/absorption spectra have been obtained. Since March 2021, a FLIR A325SC infrared camera has been installed on the roof of the Departamento de Física of the Universidad de Extremadura for cloud-base height estimations. The FLIR A325SC is an uncooled microbolometer infrared camera that operates mainly in the range of 7.5–13 microns, although its sensitivity extends up to 18 microns.
Figure 1 shows the standard spectral response function of an FLIR infrared camera.
In this study, the impact of the atmospheric correction is analyzed for six different standard atmospheric profiles: US Standard, Tropic, Middle-Latitude Summer, Middle-Latitude Winter, Subarctic Summer and Subarctic Winter. The variables to be considered are temperature, relative humidity and pressure. These profiles are the inputs for the RADIS radiative solver code. Although these atmospheric profiles extend up to 100 km with a vertical resolution of 1 km, in this study only the lower 15 km are considered, since they correspond to the top of the troposphere in our low-medium latitudes. Thus, the downward infrared radiance emitted by a uniform blackbody cloud and the radiative effect of the CO2 and H2O underneath have been analyzed for every 50 m along the lower 15 km of the atmosphere.
3. Results and Discussion
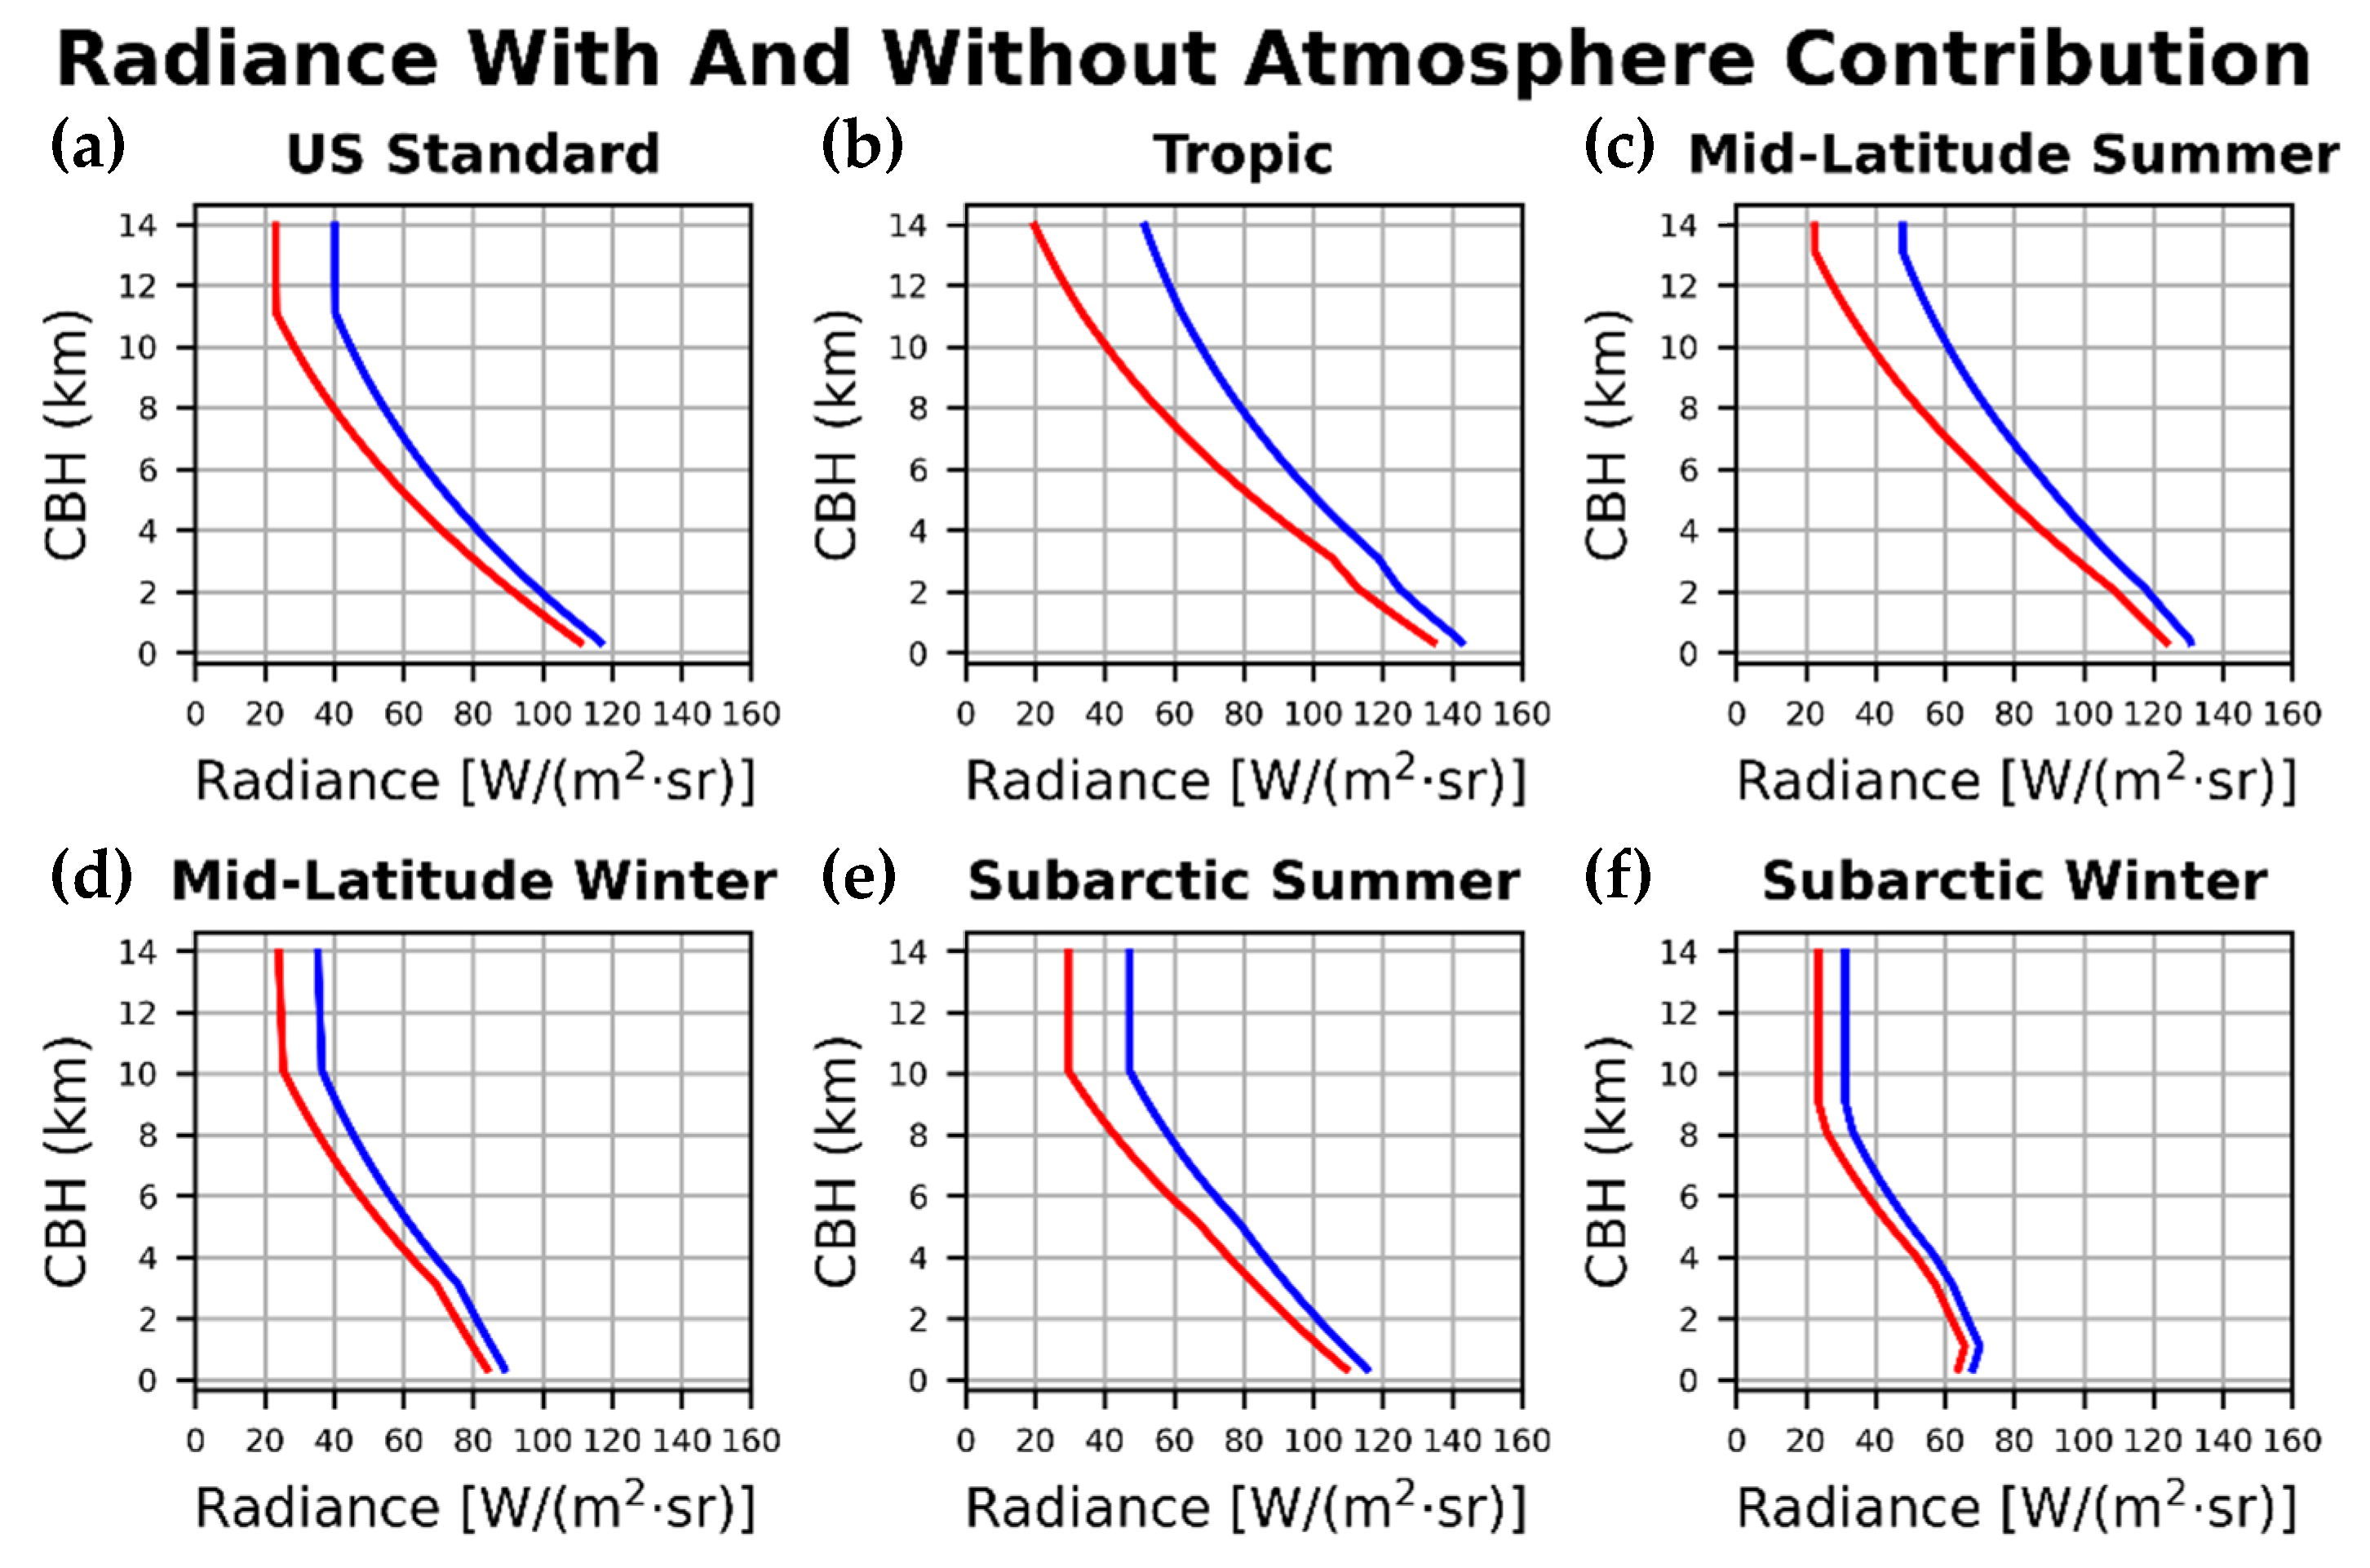
Figure 2 shows a positive net atmospheric effect on the downward radiance for all the standard atmospheric profiles considered. This indicates that the emission contribution of water vapor and carbon dioxide is higher compared with the absorption. The magnitude of the emission contribution significantly depends on the specific atmospheric profile as shown by the difference between the curves for the Tropical atmospheric profile (
Figure 2b) compared with the curves corresponding to the Subarctic Winter atmospheric profile (
Figure 2f). This difference corresponds to an atmospheric net emission effect of about 30 W/(m
2·sr) for 10 km CBH clouds with a Tropical atmospheric profile, in contrast to the atmospheric net emission effect for Subarctic atmospheric profiles, which is between 8 and 18 W/(m
2·sr).
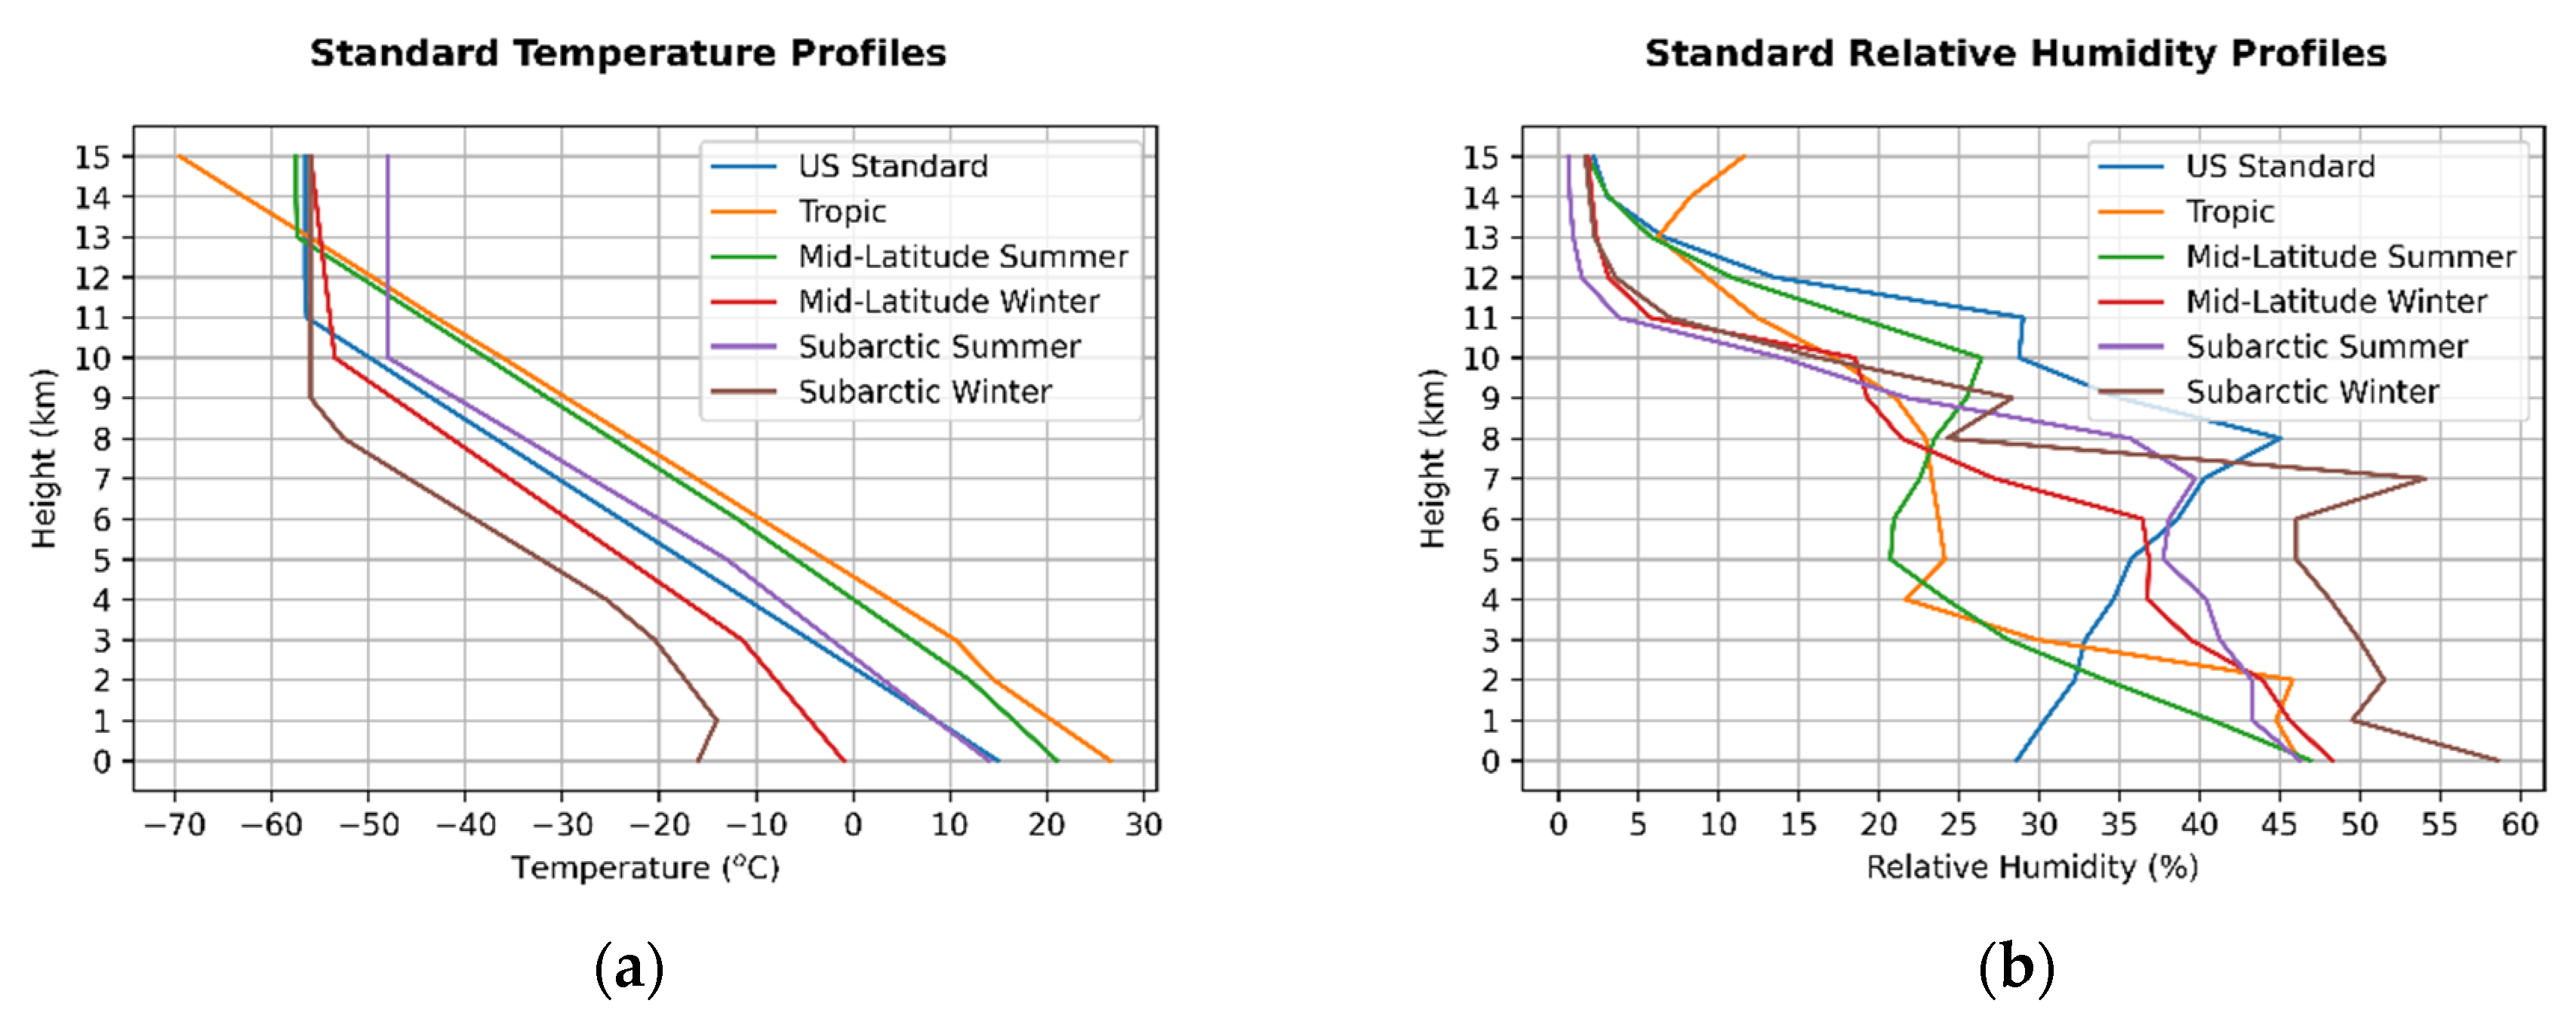
To better understand the reason for the differences encountered, a comparison of the temperature and relative humidity of the atmospheric profiles is presented in
Figure 3. The vertical gradient for all the standard temperature profiles is similar over the range of 5–8 km (
Figure 3a). However, the interaction of the surface with the lower atmosphere clearly affects the profiles, resulting in the divergence of the curves at low levels. In a similar way, the differences between the profiles at high levels can be explained by the scale height of each profile. A more detailed comparison shows that the vertical gradient of the Tropical atmospheric profile is approximately constant along almost all the troposphere levels, whereas for the Subarctic Winter and Mid-Latitude Winter atmospheric profiles the vertical gradient changes significantly at low and high levels. The comparison of
Figure 2 and
Figure 3 seems to confirm that the atmospheric net effect notably depends on the vertical gradient and the height of the tropopause.
The vertical gradient for all the standard relative humidity profiles is shown in
Figure 3b. In contrast to the temperature profiles, a significant variability of the relative humidity profiles can be observed. This high variability prevents from proposing direct relationships between humidity and net atmospheric effect.
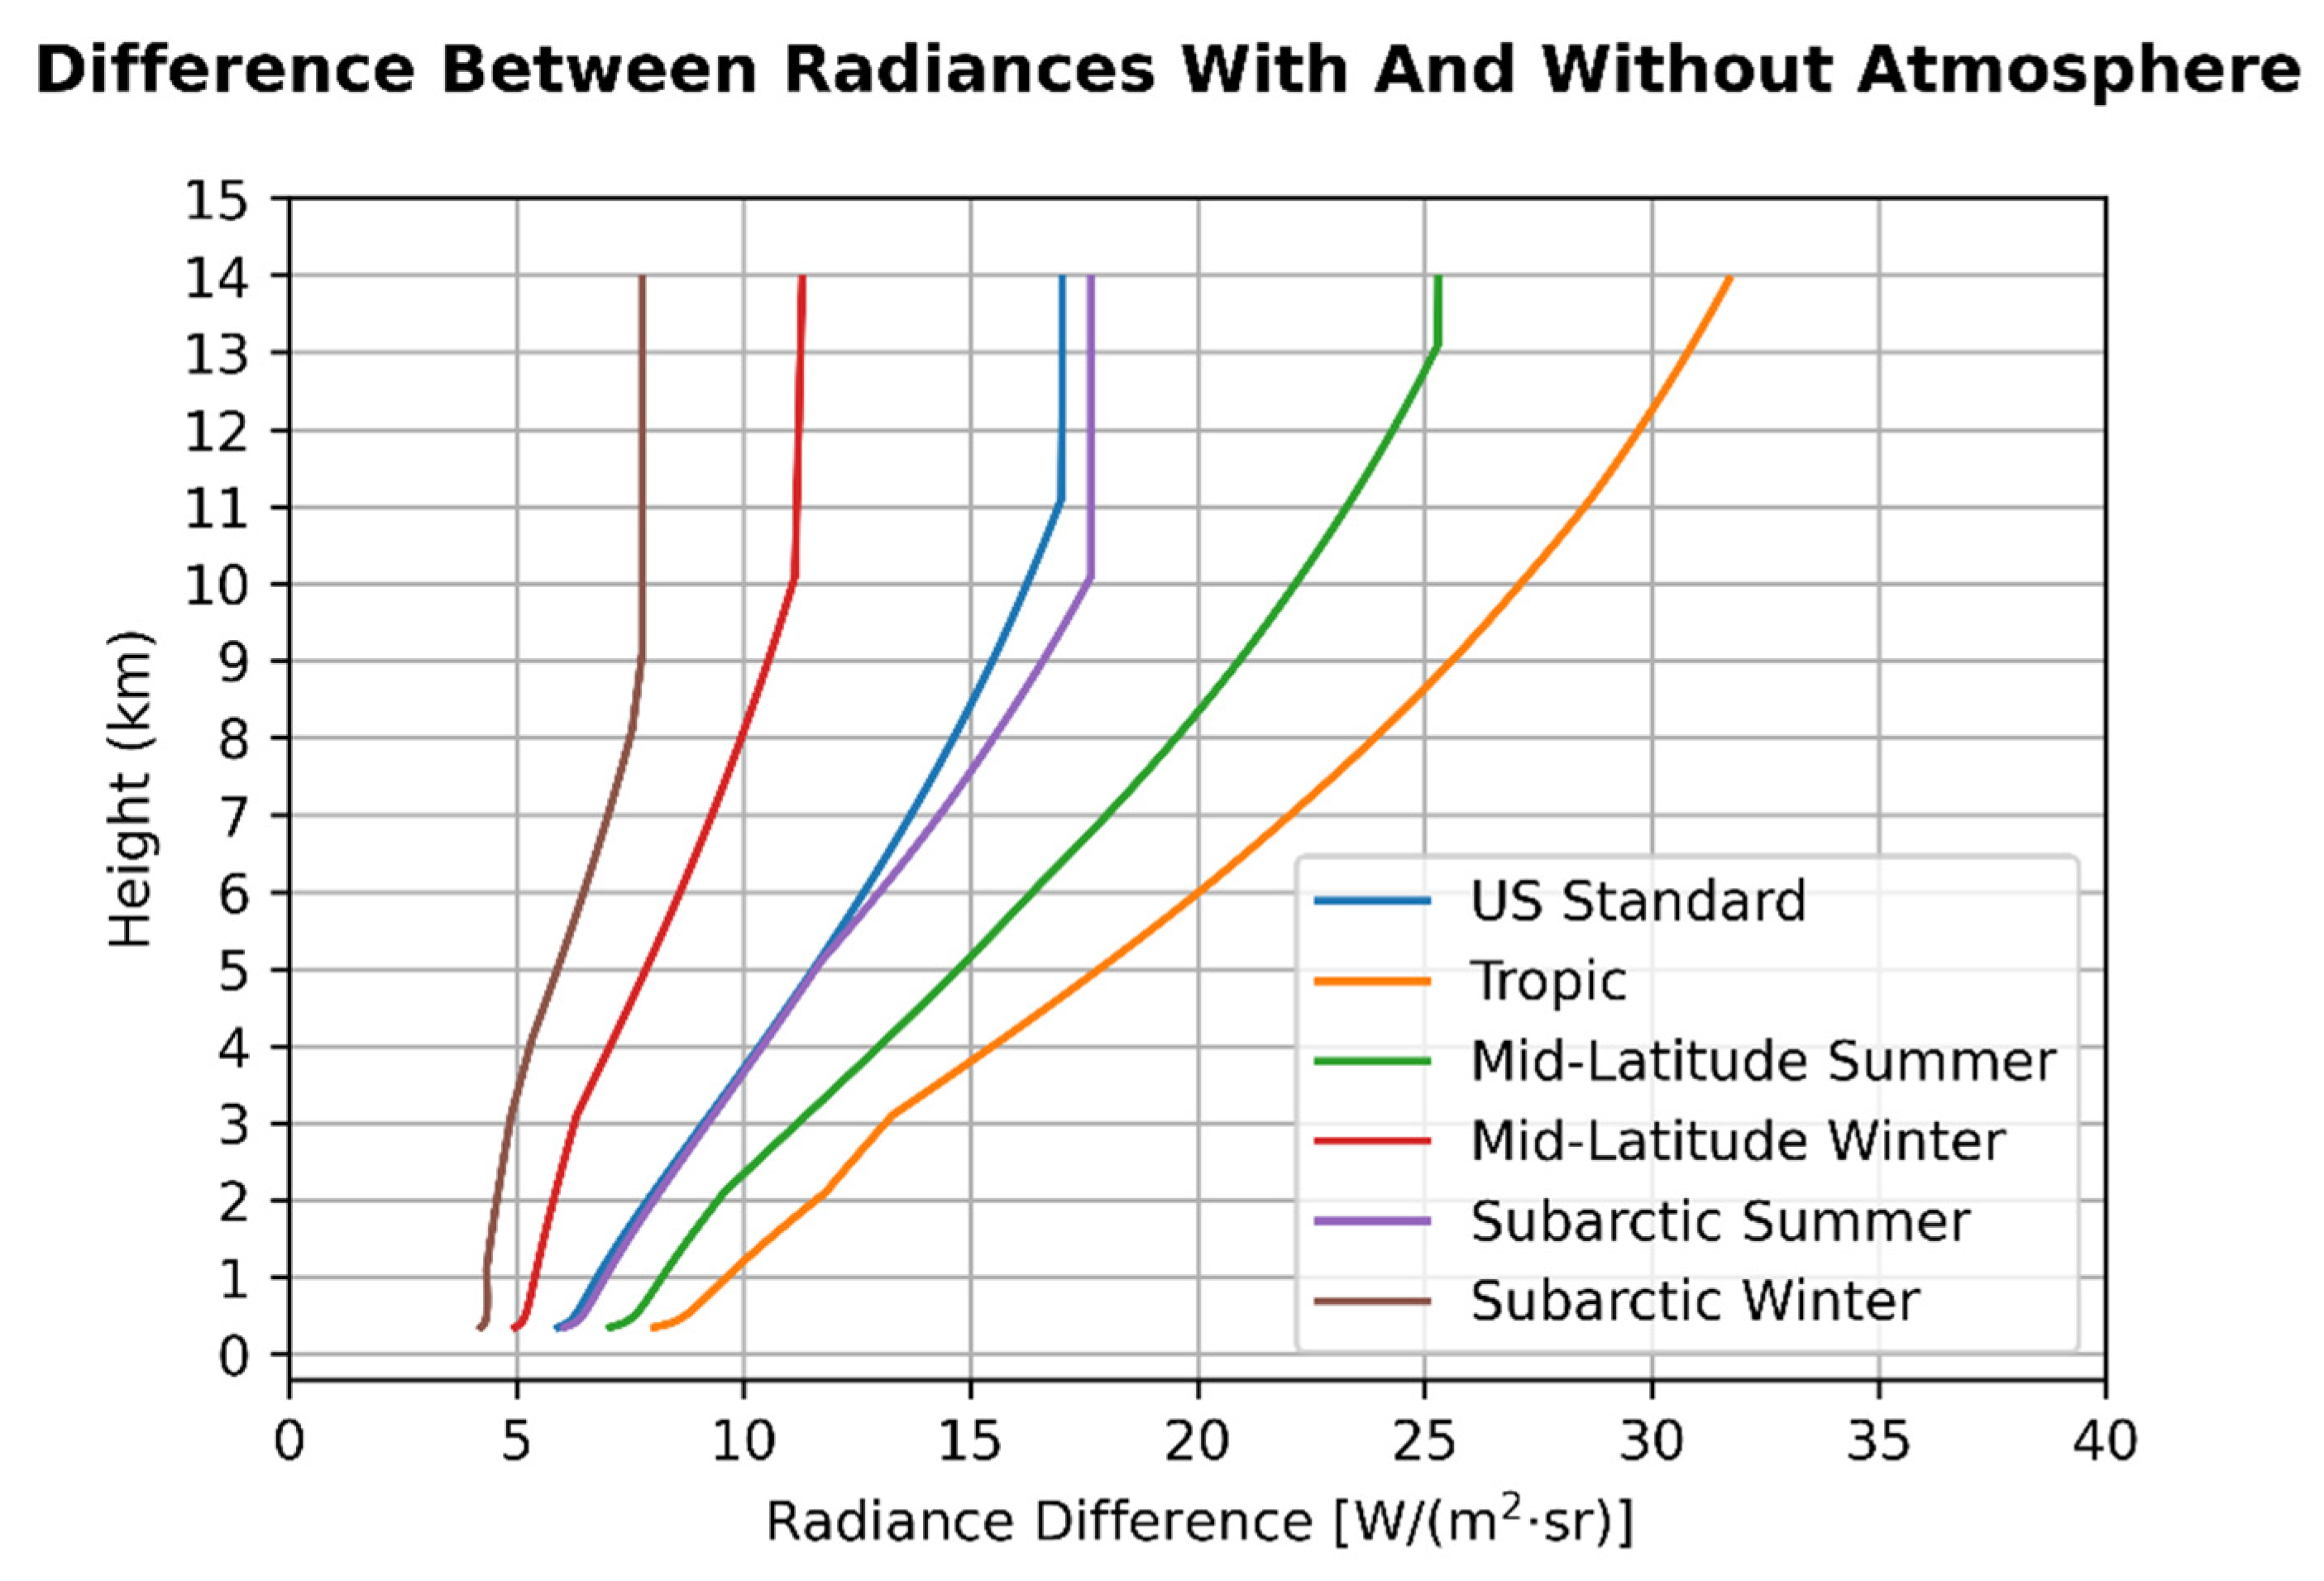
Figure 4 shows the atmospheric effect for the different profiles analyzed. This figure summarizes the results shown in
Figure 2 and clarifies the remarkable differences in the atmospheric effect of the atmospheric profiles selected. The Tropical atmospheric profile generates the most intense atmospheric effect, amplifying notably as the height increases. On the other hand, in the Subarctic Winter atmospheric profile, the magnitude of the atmospheric effect hardly changes as the height increases.
Figure 4 also indicates that the atmospheric correction becomes more important for high clouds than for medium or low clouds.
4. Conclusions
In this work, the impact of the atmospheric effect in infrared measurements has been analyzed. In the last years, the development of high-performance commercial cameras has generated a great number of lines of research in many fields of science and technology. In particular, infrared cameras are potential instruments to estimate cloud parameters such as cloud-base height. The main results revealed that atmospheric correction has to be taken into consideration for achieving accurate estimations of cloud-base height.
Author Contributions
Conceptualization, J.Z.B. and A.S.P.; methodology, J.Z.B.; software, J.Z.B.; validation, J.Z.B., and A.S.P.; formal analysis, J.Z.B.; investigation, J.Z.B.; resources, J.Z.B. and A.S.P.; data curation, J.Z.B.; writing—original draft preparation, J.Z.B.; writing—review and editing, J.Z.B. and A.S.P.; visualization, J.Z.B.; supervision, A.S.P.; project administration, A.S.P.; funding acquisition, J.Z.B. and A.S.P. All authors have read and agreed to the published version of the manuscript.
Funding
This work is part of the R+D+i grant RTI 2018-097332-B-C22 funded by MCIN/AEI/10.13039/501100011033/ and “ERDF A Way of Doing Europe”, GR21080 funded by Junta de Extremadura and “ERDF A Way of Doing Europe”, and the National Program FPU (FPU19/05789) funded by the Spanish Ministry of Science and Innovation.
Institutional Review Board Statement
Not applicable.
Informed Consent Statement
Not applicable.
Data Availability Statement
Not applicable.
Conflicts of Interest
The authors declare no conflict of interest.
References
- Peixóto, J.P.; Oort, A.H. Physics of climate. Rev. Mod. Phys. 1984, 56, 365. [Google Scholar]
- Forster, P.; Storelvmo, T.; Armour, K.; Collins, W.; Dufresne, J.-L.; Frame, D.; Lunt, D.J.; Mauritsen, T.; Palmer, M.D.; Watanabe, M.; et al. The Earth’s Energy Budget, Climate Feedbacks, and Climate Sensitivity. In Climate Change 2021: The Physical Science Basis. Contribution of Working Group I to the Sixth Assessment Report of the Intergovernmental Panel on Climate Change; Masson-Delmotte, V., Zhai, P., Pirani, A., Connors, S.L., Péan, C., Berger, S., Caud, N., Chen, Y., Goldfarb, L., Gomis, M.I., et al., Eds.; Cambridge University Press: Cambridge, UK; New York, NY, USA, 2021; pp. 923–1054. [Google Scholar]
- World Meteorological Organization. Guide of Meteorological Instruments and Methods of Observation; WMO: Lyon, France, 2008; Volume 8. [Google Scholar]
- Andreev, M.S.; Chulichkov, A.I.; Medvedev, A.P.; Postylyakov, O.V. Estimation of cloud base height using ground-based stereo photography: method and first results. In Remote Sensing of Clouds and the Atmosphere XIX; and Optics in Atmospheric Propagation and Adaptive Systems XVII; SPIE: Bellingham, WA, USA, 2014. [Google Scholar]
- Allmen, M.C.; Kegelmeyer, W.P., Jr. The computation of cloudbase height from paired whole-sky imaging cameras. J. Atmos. Ocean. Technol. 1996, 13, 97–113. [Google Scholar]
- Shaw, J.A.; Edqvist, E.; Bravo, H.E.; Mizutani, K.; Thurairajah, B. Measuring Arctic clouds with the infrared cloud imager. Atmos. Radiat. Meas. Appl. Clim. SPIE 2002, 4815, 20–30. [Google Scholar]
- Nugent, P.W.; Shaw, J.A.; Piazzolla, S. Infrared cloud imaging in support of Earth-space optical communication. Opt. Express 2009, 17, 7862–7872. [Google Scholar] [PubMed]
- Pannier, E.; Laux, C.O. RADIS: A nonequilibrium line-by-line radiative code for CO2 and HITRAN-like database species. J. Quant. Spectrosc. Radiat. Transf. 2019, 222–223, 12–25. [Google Scholar] [CrossRef]
| Publisher’s Note: MDPI stays neutral with regard to jurisdictional claims in published maps and institutional affiliations. |
© 2022 by the authors. Licensee MDPI, Basel, Switzerland. This article is an open access article distributed under the terms and conditions of the Creative Commons Attribution (CC BY) license (https://creativecommons.org/licenses/by/4.0/).


