1. Introduction
Over the recent years, it has become more evident that precipitation events occur more frequently and with greater intensity as a result of climate change [
1,
2]. Indeed, under warmer global conditions caused by the induction of anthropogenically produced greenhouse gases such as carbon dioxide (CO
2) and methane (CH
4) into the Earth’s atmosphere, the hydrological cycle is largely affected [
3,
4]. Enhanced evaporation from the oceans combined with the increased capacity of the warmer air to maintain greater amounts of water vapor leads to more intense and frequent extreme precipitation events, i.e., instances with greater than normal rainfall, hail or snow. Extreme phenomena, such as heavier-than-normal precipitation constitute a serious threat for the ecosystems and human societies. Floodings, landslides, water quality and food production degradation are some of the harmful consequences that different locations around the globe may experience in the coming years [
5,
6,
7]. Thus, it has become important to systematically monitor changes in precipitation at a local, regional or global level. To achieve this, a series of statistical methods and indicators has been developed over the years. The aim of this work is to analyze precipitation data from observational records in the Greek region in order to investigate recent changes in precipitation conditions.
2. Data and Methodology
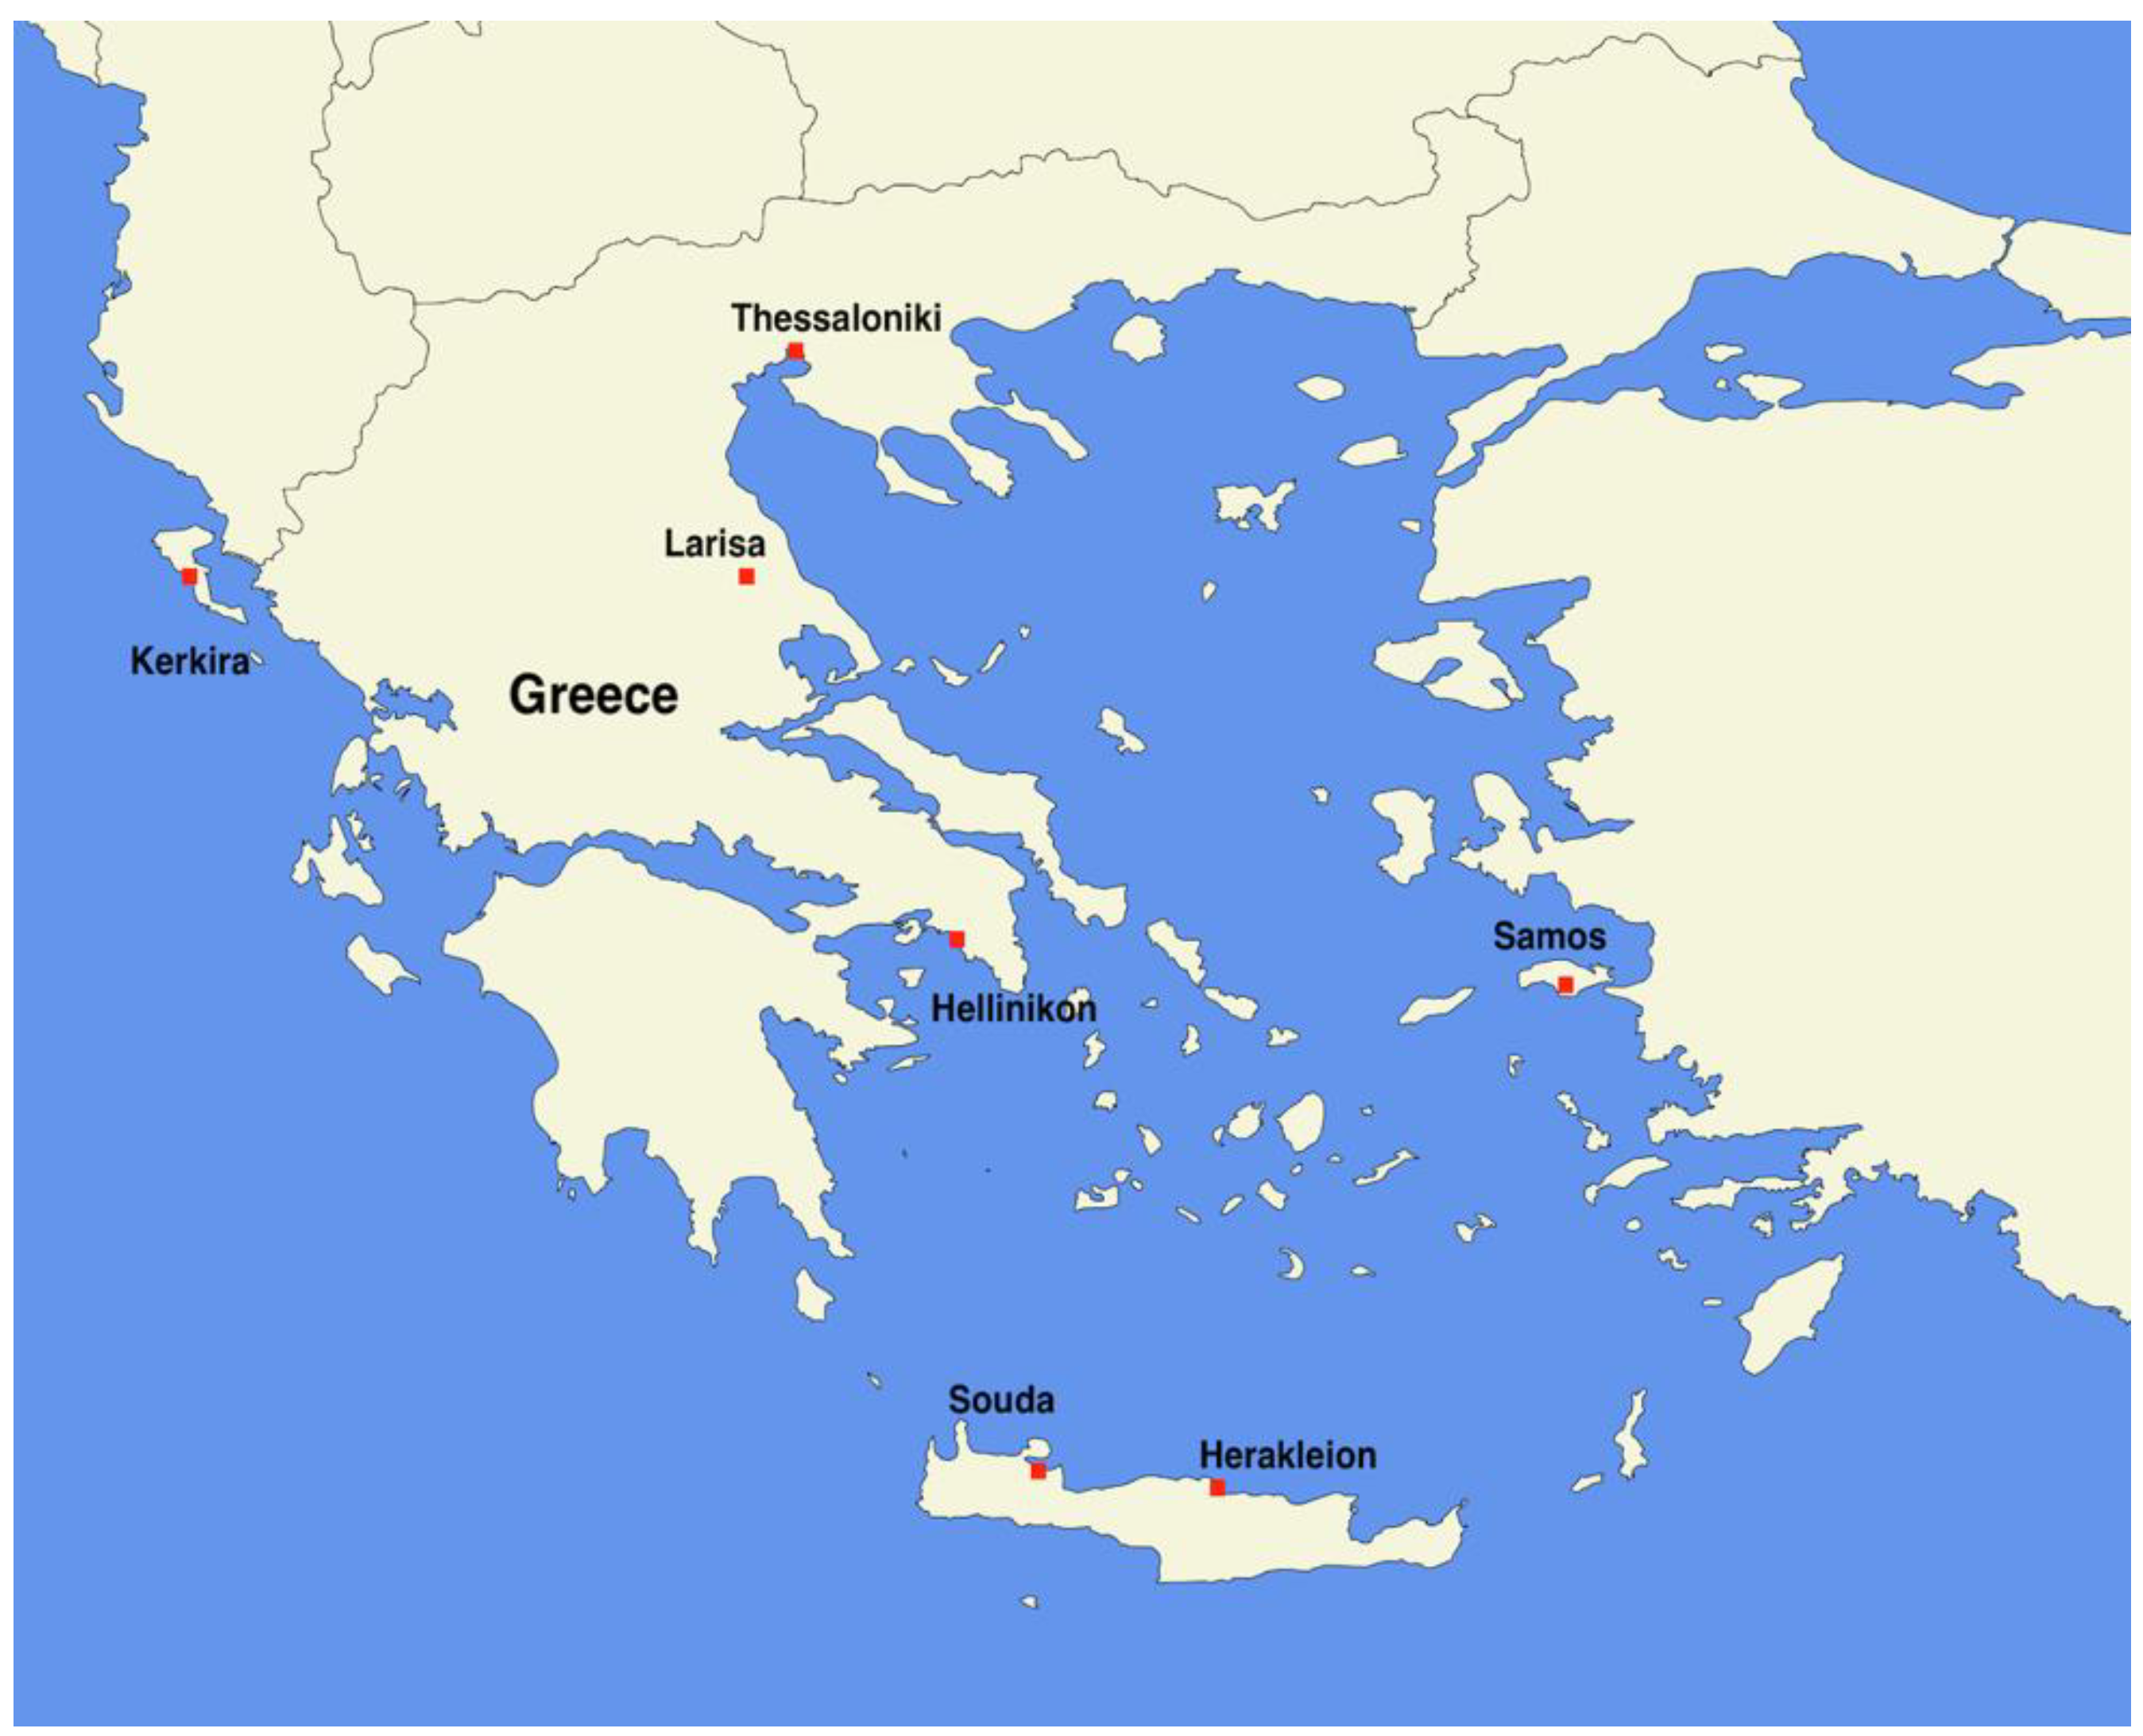
Precipitation data over the period of 1990−2020 and from seven WMO stations in Greece were used in this work, namely Hellinikon (located near the capital of Athens), Thessaloniki, Kerkira, Samos, Larisa, and finally, Souda and Herakleion (both located at the island of Crete). The distribution of the meteorological stations as well as their geographical characteristics are presented in
Figure 1 and
Table 1, respectively.
The precipitation indices that were used can be found in the following list. For each index, yearly and seasonal data were obtained.
RX1day: Highest 1-day precipitation amount,
RX5day: Highest 5-day precipitation amount,
SDII: Simple Daily Intensity Index,
RR1: Wet Days (RR ≥ 1 mm),
R10mm: Heavy precipitation days (RR ≥ 10 mm),
R20mm: Very Heavy Precipitation days (RR ≥ 20 mm),
CWD: Maximum number of consecutive wet days (RR ≥ 1 mm),
R95pTOT: Precipitation fraction on very wet days (>95%),
R99pTOT: Precipitation fraction on extremely wet days (>99%),
PRCPTOT: Total Precipitation on wet days.
Furthermore, the non-parametric Sen’s slope and Mann-Kendall [
8] method were applied to both the yearly and seasonal (winter and summer) data of all the above indices and for all the aforementioned stations in order to calculate the corresponding trends and their statistical significance. For the purpose of this analysis, the MAKESENS statistical tool [
9] was used.
3. Results and Discussion
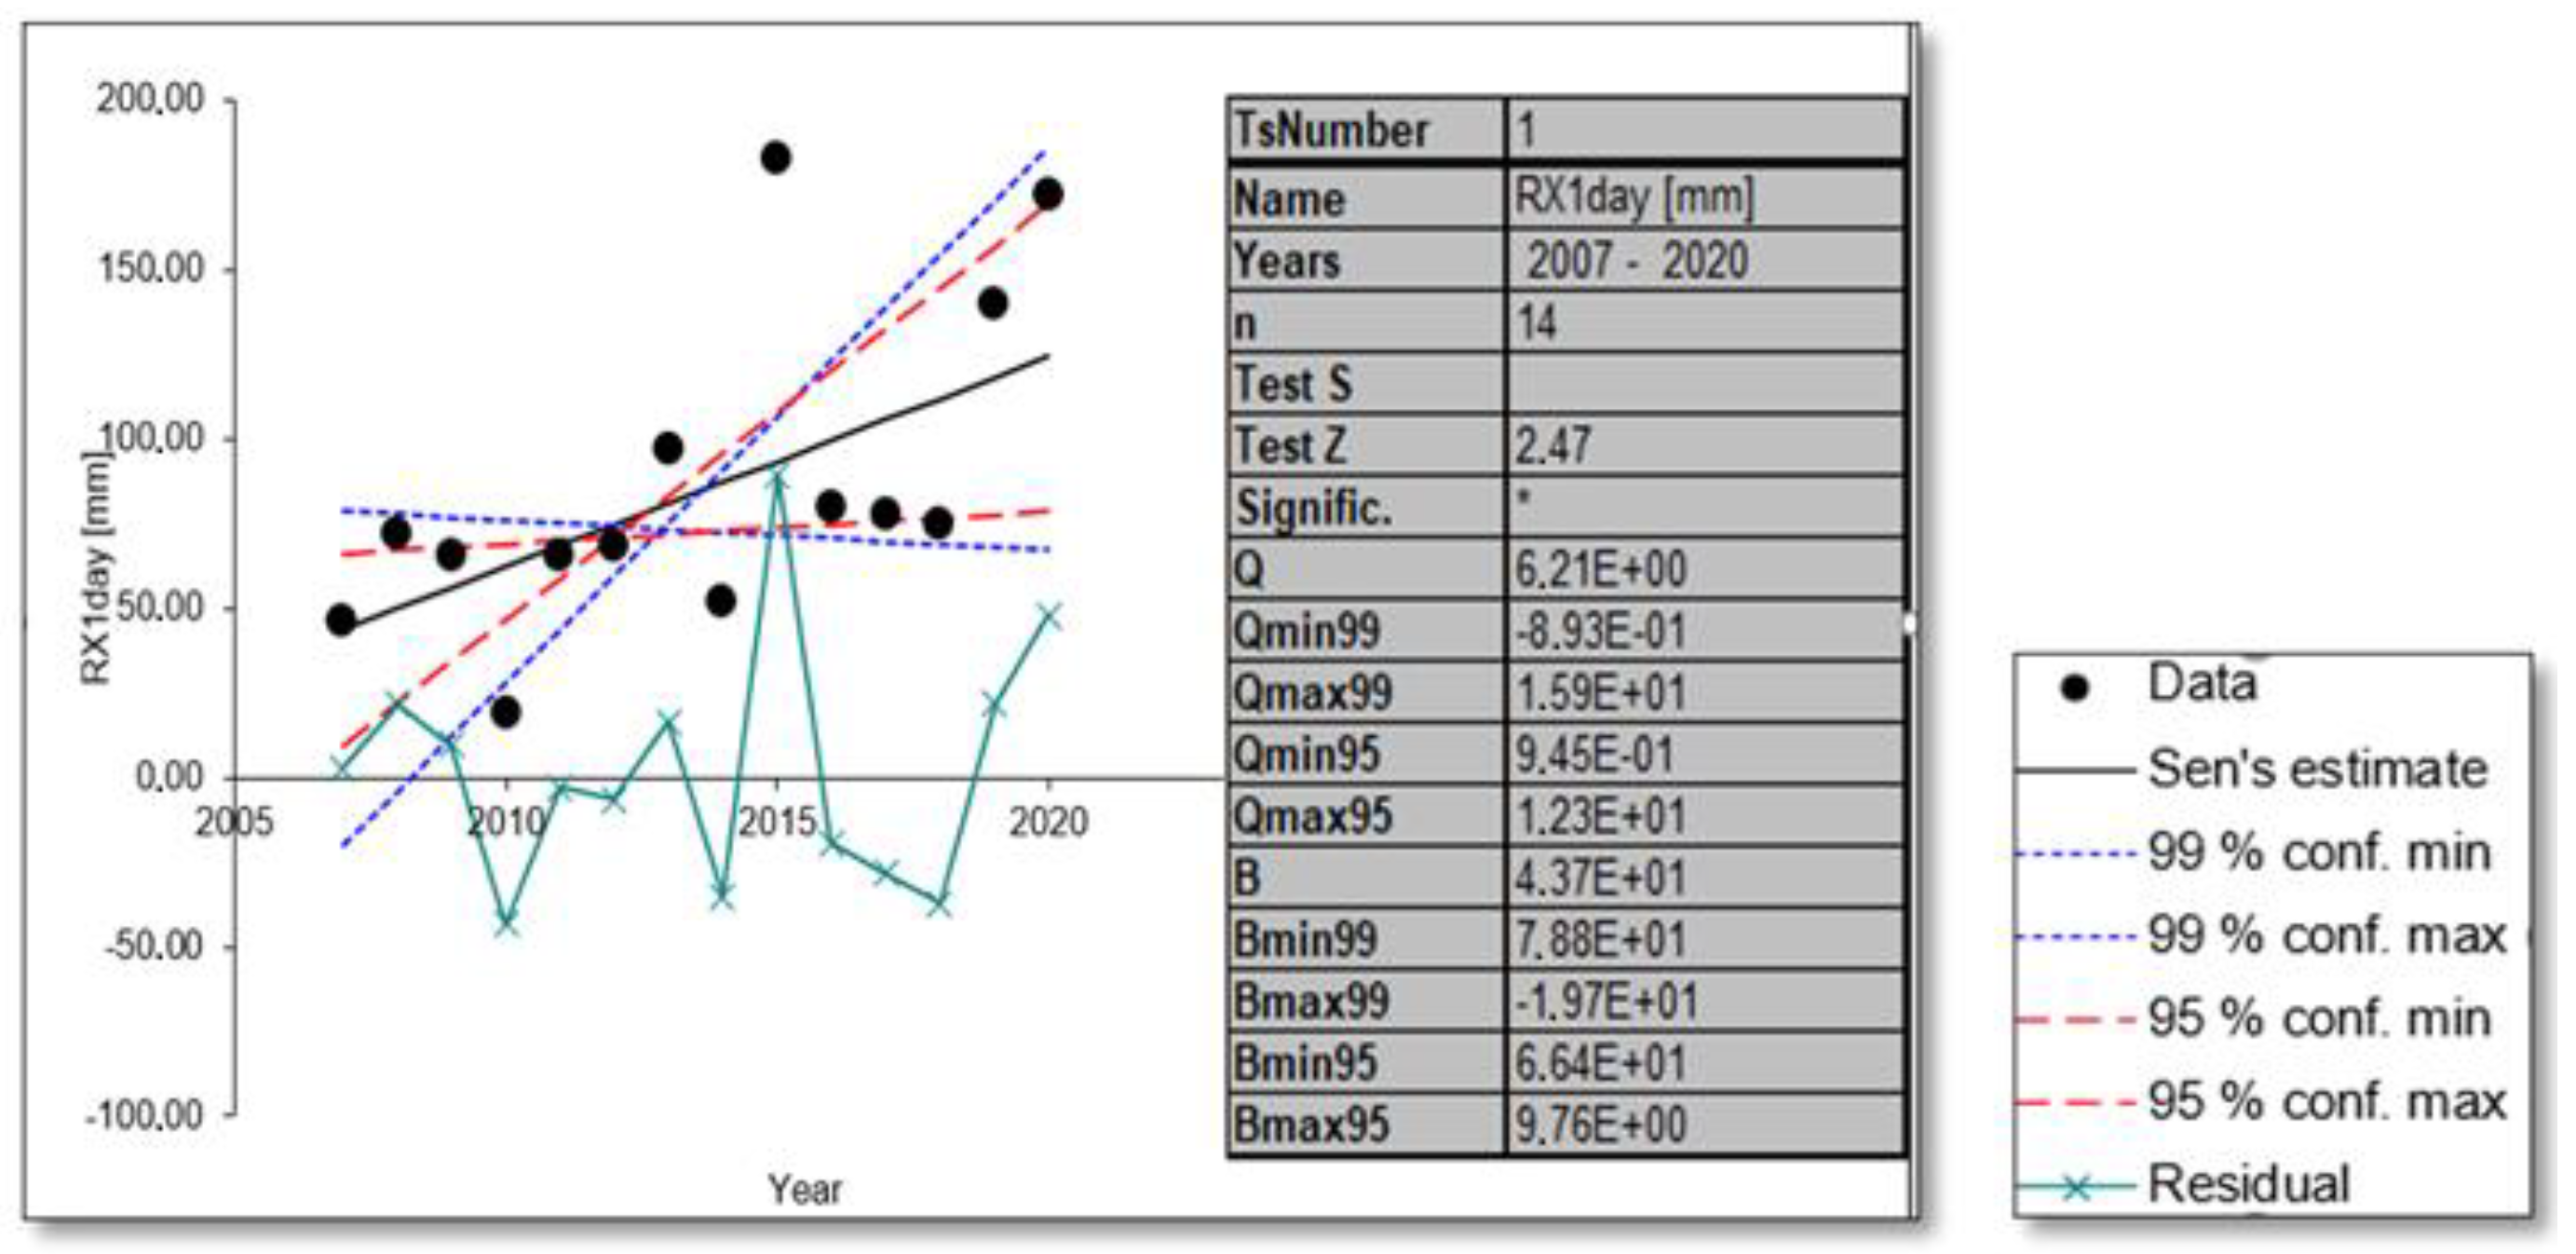
In
Figure 2, the statistical results from the application of the Sen’s slope and Mann-Kendall method on the yearly time series of the RX1day index for the Hellinikon station are shown, indicatively. Similar figures were also produced for all indices and stations and for both the seasonal and yearly data.
Statistically significant positive trends of the RX1day and RX5day indices were found for the station of Herakleion, and of RX1day for Souda. It should be noted that the data of the Souda station range from 2007 to 2020. The above finding signifies that the maximum 1-day and 5-day amount of precipitation has increased significantly at these locations. On the other hand, a statistically significant decrease was observed for the RX1day index for the meteorological station of Samos during the period of 1996−2020. Concerning the R10mm, R20mm and CWD indices, the Souda station has experienced a statistically significant increase in the values of R20mm during 2007 and 2020. This means that very heavy precipitation days have increased during the study period. The station of Kerkira also presents a statistically significant increase in the CWD index from 1990 to 2020. The SDII, R95pTOT and PRCPTOT indices have also increased in the location of the Souda station, while a decrease was detected for SDII at Samos. Concerning the seasonal trends, a statistically significant increase of RX1day and R95pTOT values during winter and RX1day, RX5day, SDII, RR1 and CWD values during summer was observed at Souda. This means that a greater amount of extreme precipitation occurred during winter in the study period at Souda and that even in the summer, the conditions tend to be wetter. At Samos, in contrast to the yearly data, where a decrease in precipitation was observed, the summer conditions tend to be wetter, given the statistically significant upward trends of RX1day, RX5day, SDII, RR1 and CWD. Finally, at Thessaloniki an increase in the amount and frequency of extreme precipitation was also measured during the summer.
To conclude, the trends and statistical significance of yearly and seasonal values of various indices associated with the intensity and frequency of precipitation in the Greek region were studied in this work. From the results discussed above, it can be deduced that some regions experienced an important increase in precipitation with respect to intensity and duration. The trend magnitude and significance, however, vary both seasonally and geographically, depending on a series of factors such as the site’s coordinates and its proximity to the sea.
Author Contributions
Conceptualization, C.G.T., A.N.P., I.K. and K.P.; methodology, C.G.T., A.N.P., I.K. and K.P.; software, A.N.P., I.K. and K.P.; validation, C.G.T., A.N.P., I.K. and K.P.; formal analysis, C.G.T., A.N.P., I.K. and K.P.; investigation C.G.T., A.N.P., I.K. and K.P.; data curation, C.G.T., A.N.P., I.K. and K.P; writing—original draft preparation, C.G.T., A.N.P., I.K. and K.P.; writing—review and editing, C.G.T., A.N.P., I.K. and K.P.; visualization, A.N.P., I.K. and K.P.; supervision, C.G.T.; project administration, C.G.T. All authors have read and agreed to the published version of the manuscript.
Funding
This research received no external funding.
Institutional Review Board Statement
Not applicable.
Informed Consent Statement
Not applicable.
Data Availability Statement
Data were obtained from KNMI Climate Explorer.
Conflicts of Interest
The authors declare no conflict of interest.
References
- Mora, C.; Spirandelli, D.; Franklin, E.C.; Lynham, J.; Kantar, M.B.; Miles, W.; Smith, C.Z.; Freel, K.; Moy, J.; Louis, L.V.; et al. Broad threat to humanity from cumulative climate hazards intensified by greenhouse gas emissions. Nat. Clim. Chang. 2018, 8, 1062–1071. [Google Scholar] [CrossRef]
- AghaKouchak, A.; Chiang, F.; Huning, L.S.; Love, C.A.; Mallakpour, I.; Mazdiyasni, O.; Moftakhari, H.; Papalexiou, S.M.; Ragno, E.; Sadegh, M. Climate Extremes and Compound Hazards in a Warming World. Annu. Rev. Earth Planet. Sci. 2020, 48, 519–548. [Google Scholar] [CrossRef]
- Tzanis, C.; Koutsogiannis, I.; Philippopoulos, K.; Kalamaras, N. Multifractal Detrended Cross-Correlation Analysis of Global Methane and Temperature. Remote Sens. 2020, 12, 557. [Google Scholar] [CrossRef]
- Allan, R.P. The Role of Water Vapour in Earth’s Energy Flows. Surv. Geophys. 2012, 33, 557–564. [Google Scholar] [CrossRef]
- Trenberth, K. Changes in precipitation with climate change. Clim. Res. 2011, 47, 123–138. [Google Scholar] [CrossRef]
- Chen, Y.; Zhai, P. Persistent extreme precipitation events in China during 1951–2010. Clim. Res. 2013, 57, 143–155. [Google Scholar] [CrossRef]
- Feng, Z.; Leung, L.R.; Hagos, S.; Houze, R.A.; Burleyson, C.D.; Balaguru, K. More frequent intense and long-lived storms dominate the springtime trend in central US rainfall. Nat. Commun. 2016, 7, 13429. [Google Scholar] [CrossRef] [PubMed]
- Tzanis, C.G.; Koutsogiannis, I.; Philippopoulos, K.; Deligiorgi, D. Recent climate trends over Greece. Atmos. Res. 2019, 230, 104623. [Google Scholar] [CrossRef]
- Salmi, T.; Määttä, A.; Anttila, P.; Ruoho-Airola, T.; Amnell, T. Detecting Trends of Annual Values of Atmospheric Pollutants by the Mann-Kendall Test and Sen’s Slope Estimates—The Excel Template Application MAKESENS; Finnish Meteorological Institute (FMI): Helsinki, Finland, 2002. [Google Scholar]
| Publisher’s Note: MDPI stays neutral with regard to jurisdictional claims in published maps and institutional affiliations. |
© 2022 by the authors. Licensee MDPI, Basel, Switzerland. This article is an open access article distributed under the terms and conditions of the Creative Commons Attribution (CC BY) license (https://creativecommons.org/licenses/by/4.0/).


