
Main Climatic Characteristics of the International Airport “Antonio Maceo” during the Period 2017–2021 †


Abstract
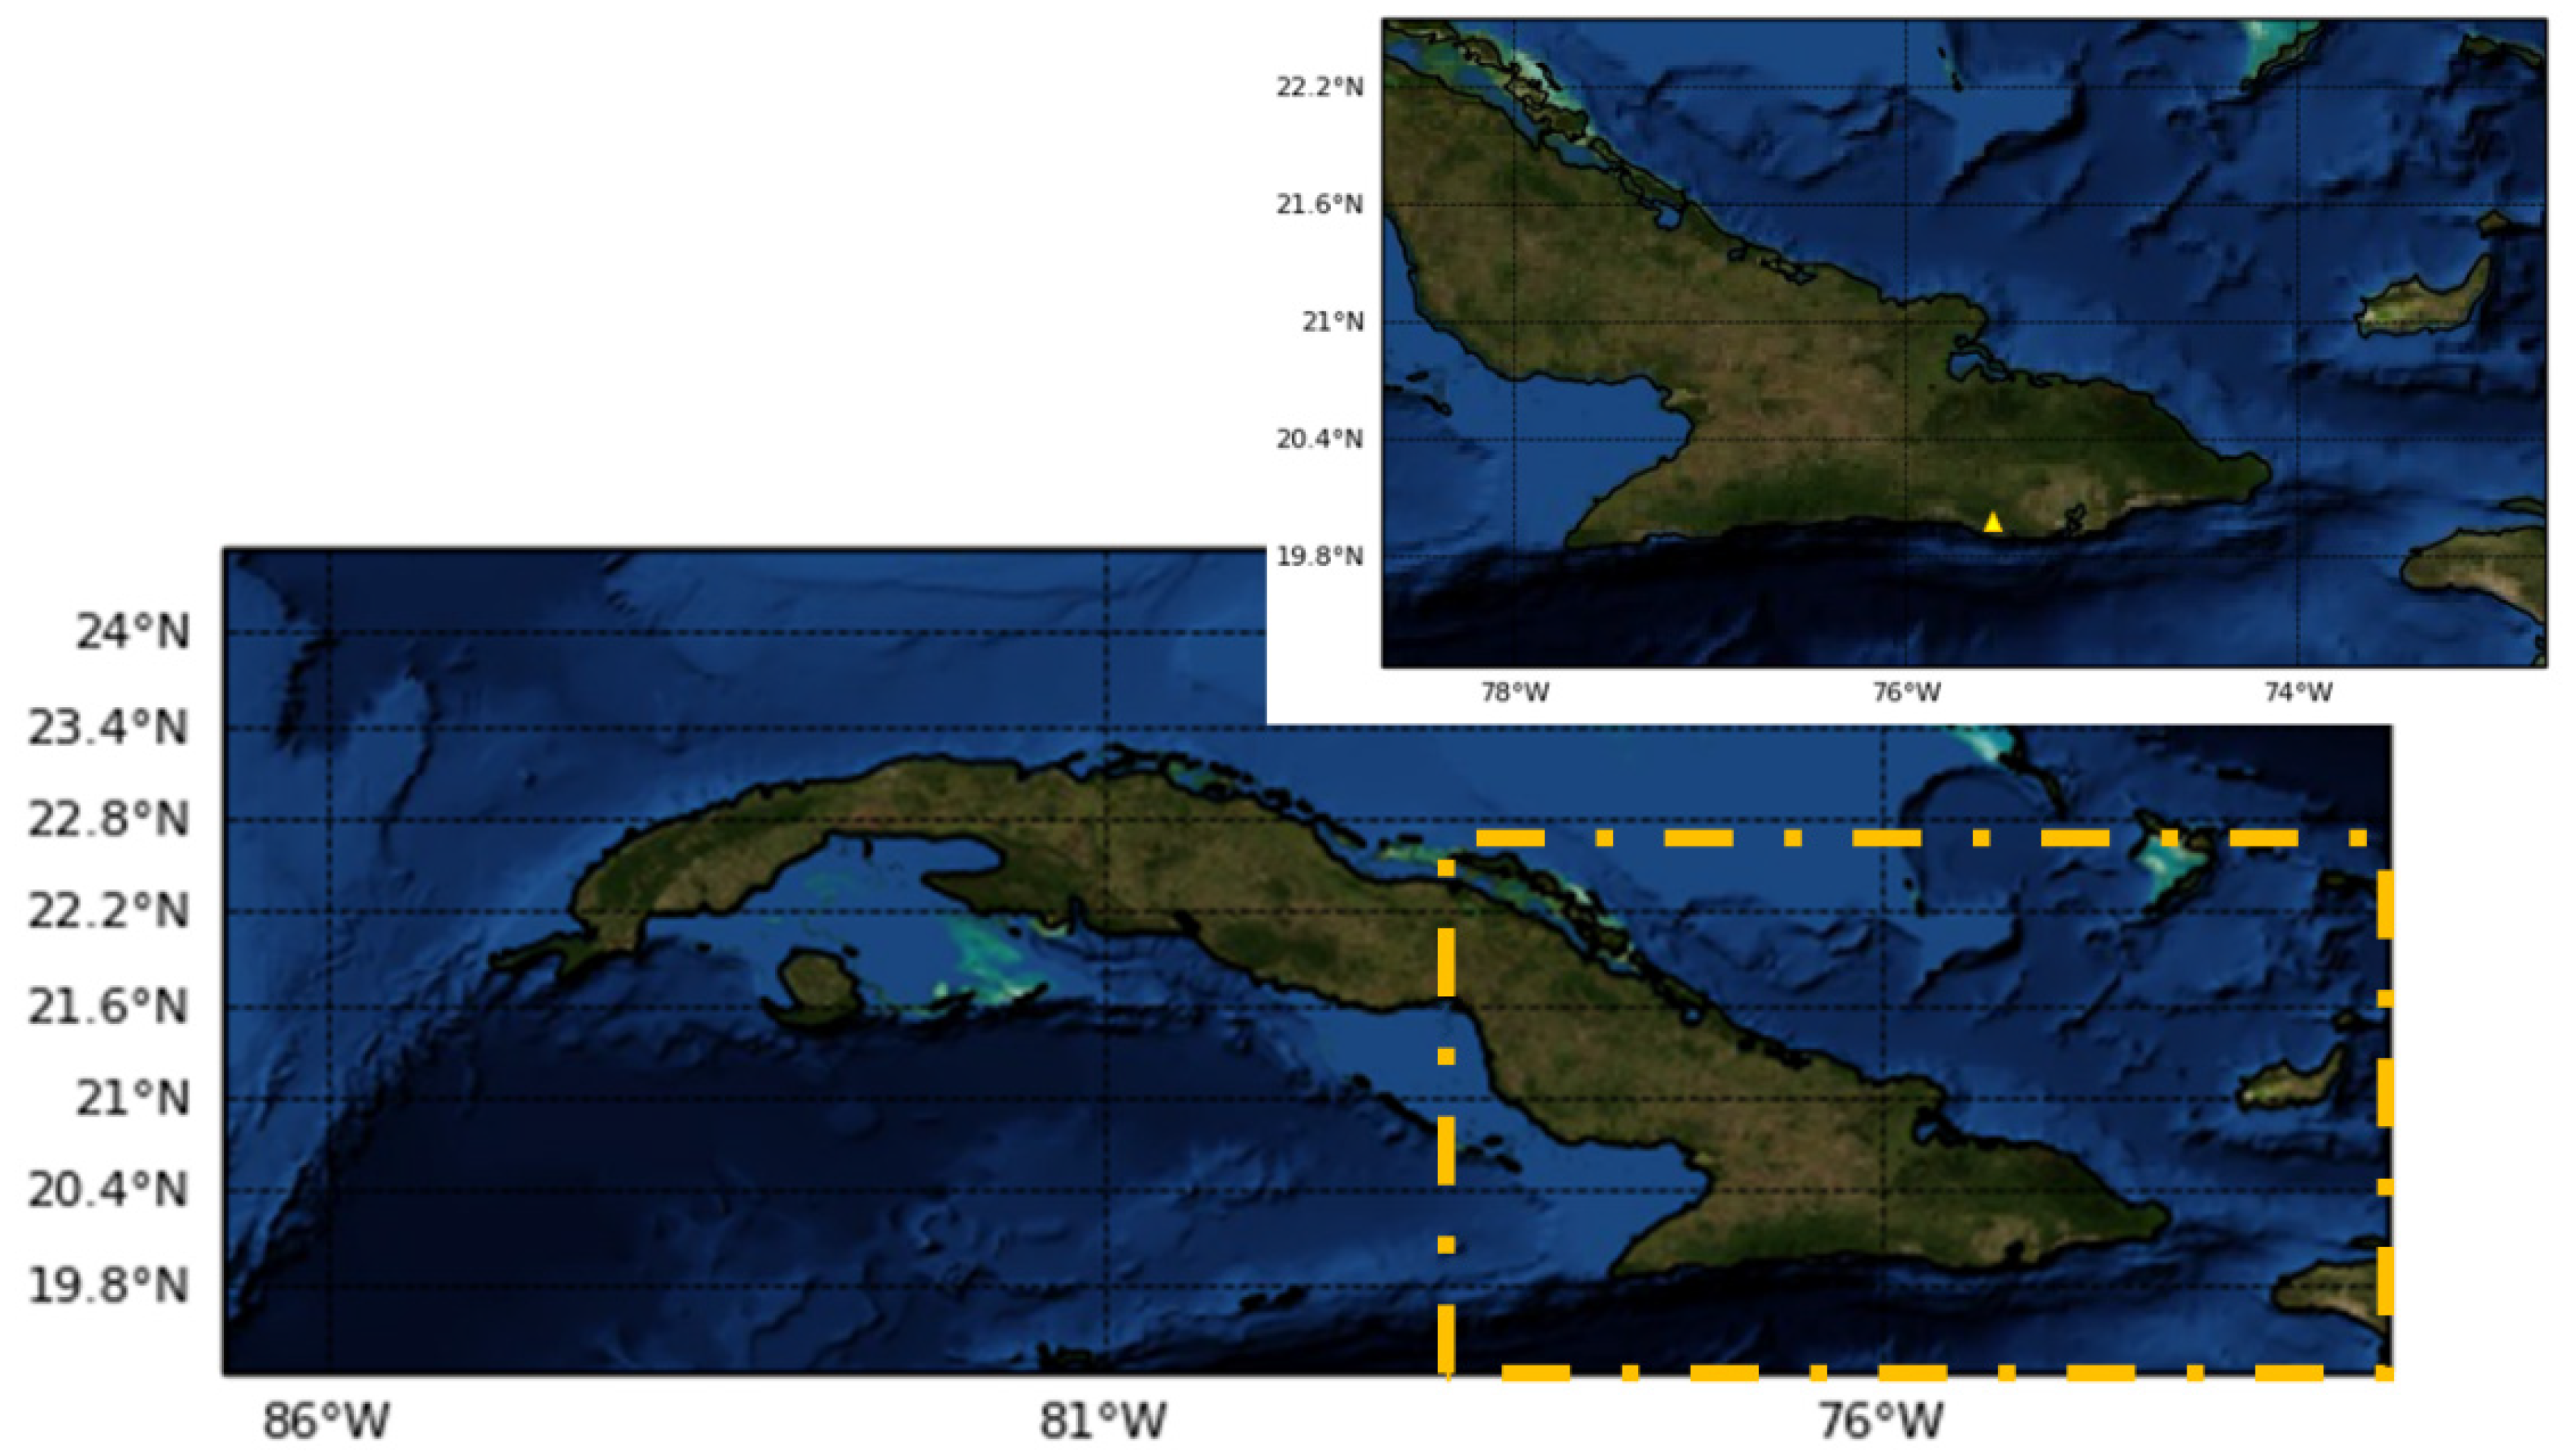
:1. Introduction
2. Materials and Methods
2.1. Statistical Analysis Methods Used for the Study of Meteorological Variables
2.2. Meteorological Variables
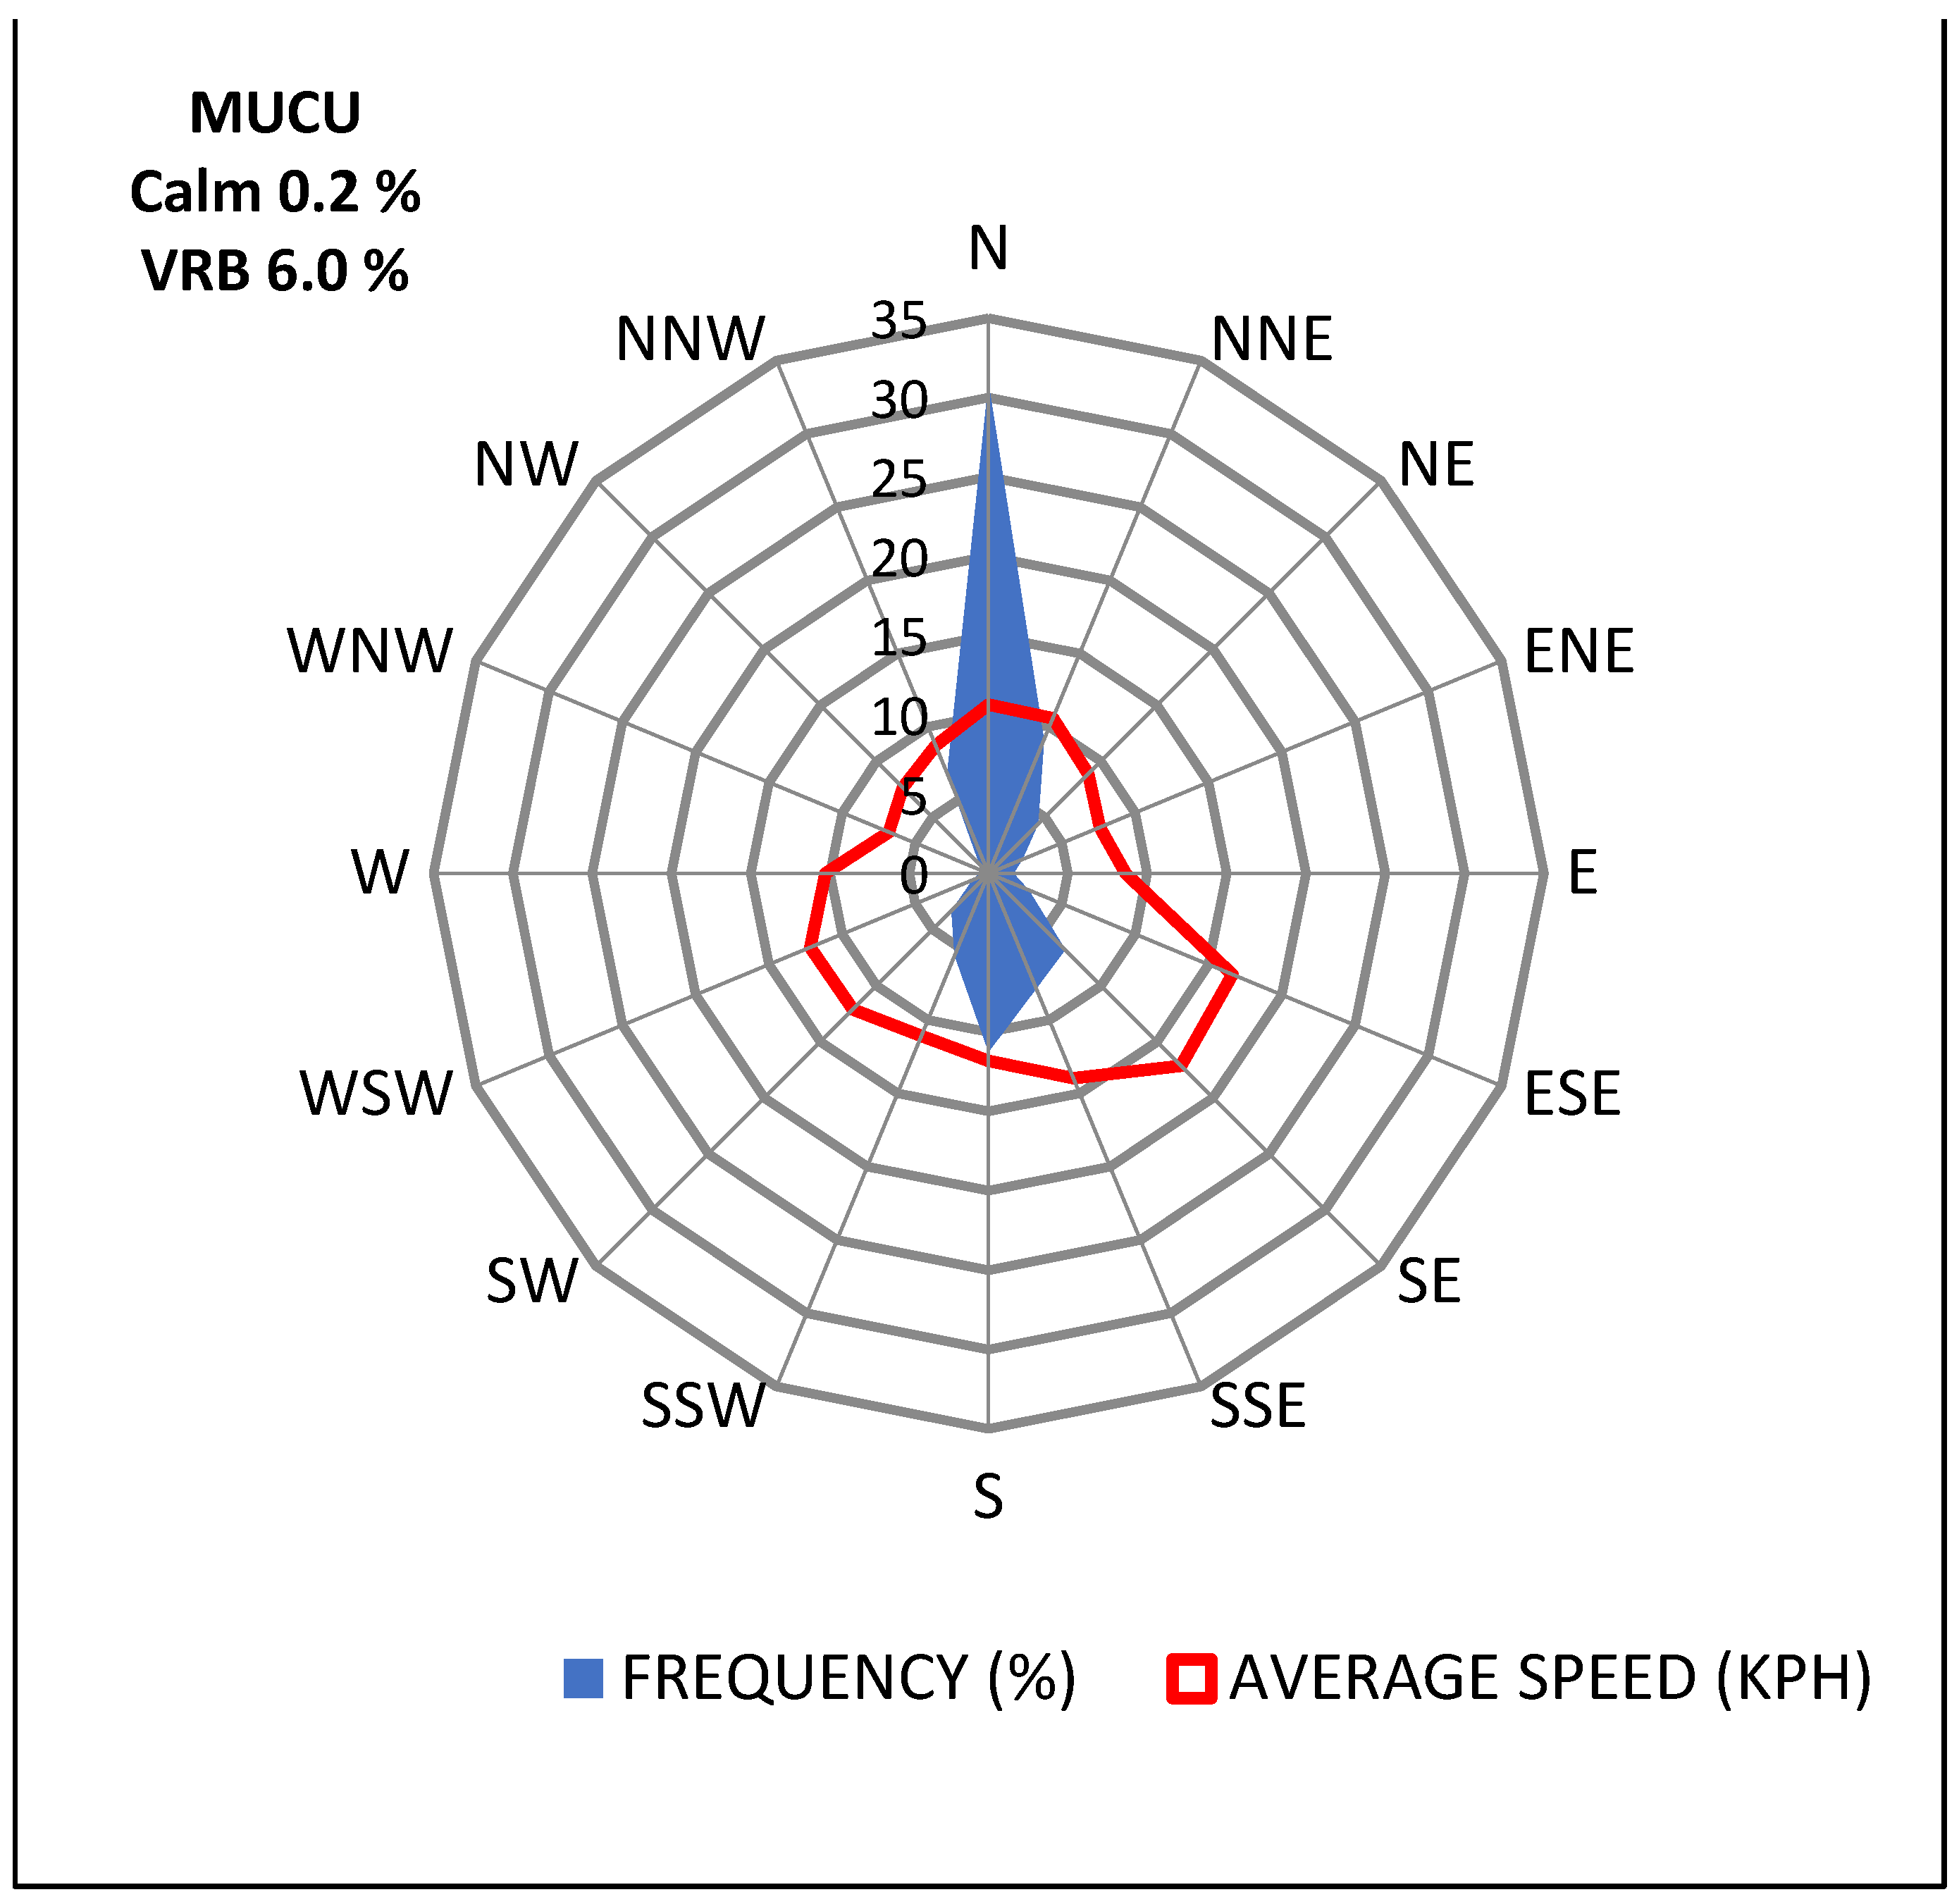
Wind Rose
3. Results
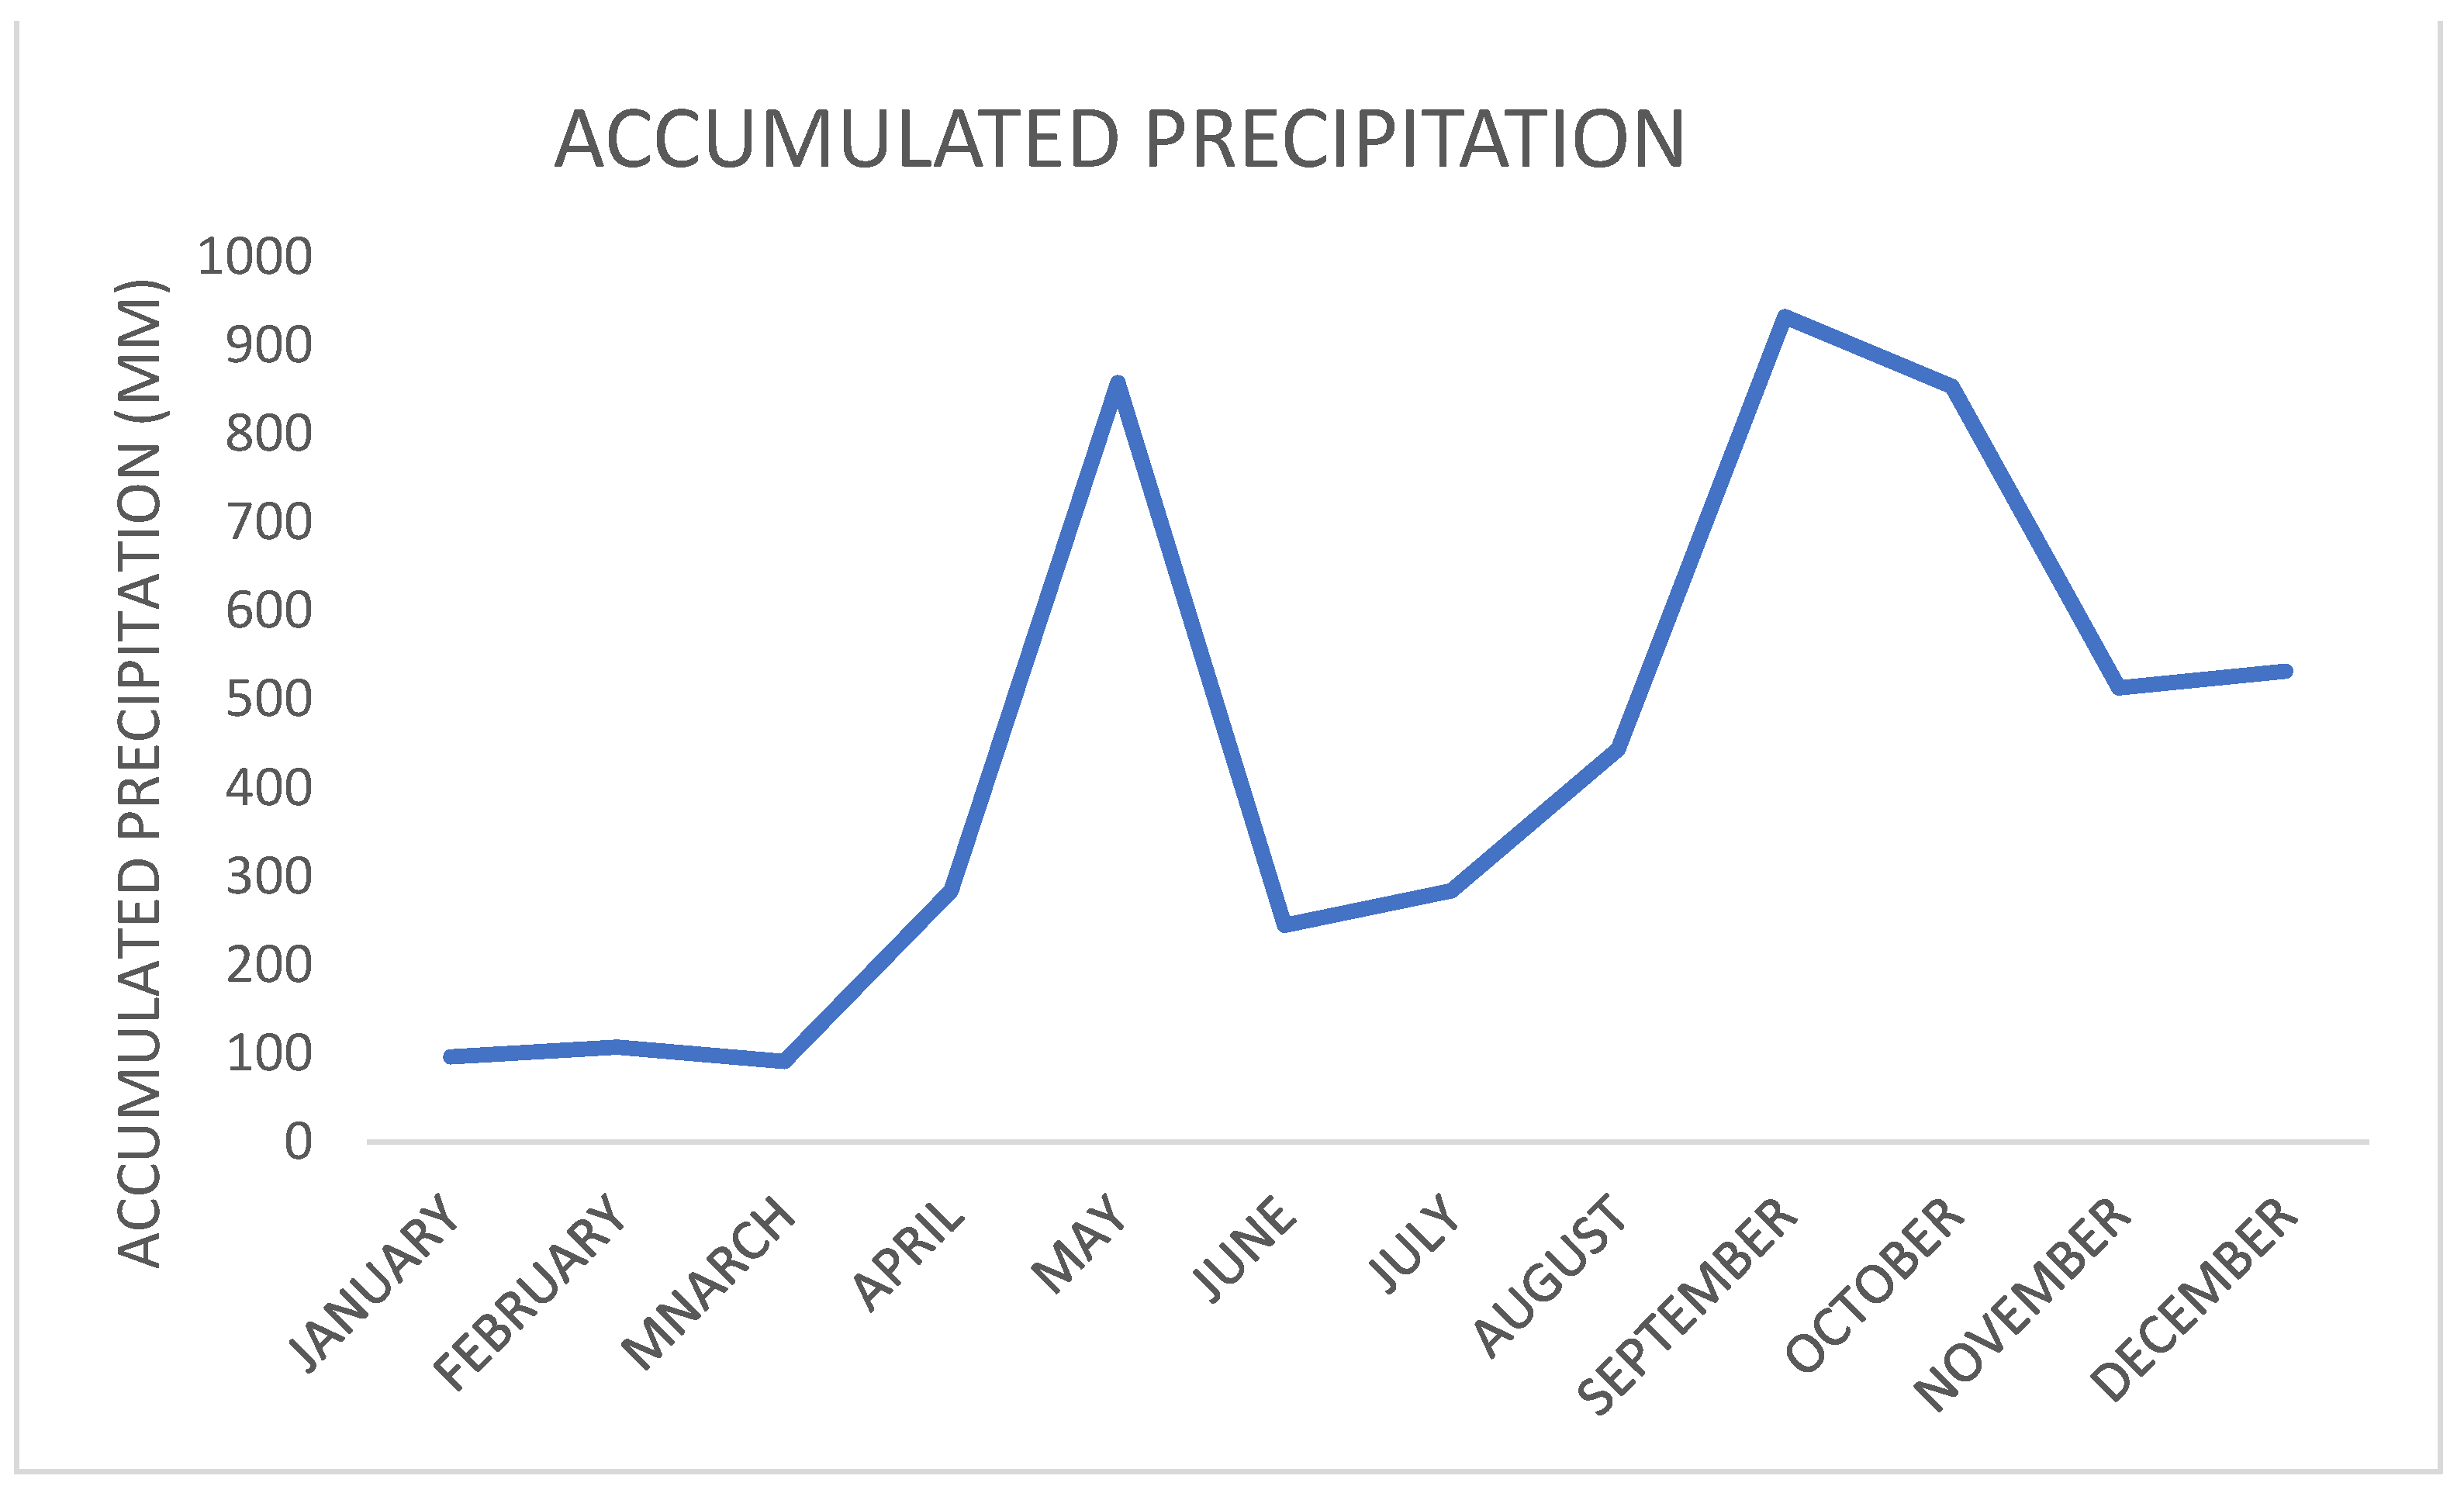
3.1. Behavior of the Meteorological Variables during the Period 2017–2021
3.2. Analysis of the Behavior of the Wind during the Period 2017–2021
4. Conclusions
Author Contributions
Funding
Institutional Review Board Statement
Informed Consent Statement
Data Availability Statement
Conflicts of Interest
References
- Bernal, G.; Rosero, M.; Cadena, M.; Montealegre, J.; Sanabria, F. Estudio de la Caracterización Climática de Bogotá y Cuenca Alta del Río Tunjuelo; Fondo de Prevención y Atención de Emergencias FOPAE; Instituto de Hidrología, Meteorología y Estudios Ambientales IDEAM: Colombia, Bogotá, 2007. Available online: https://www.google.com/url?sa=t&rct=j&q=&esrc=s&source=web&cd=&ved=2ahUKEwiVv-PE74f4AhXYQzABHRFAA3EQFnoECAsQAQ&url=http%3A%2F%2Fdocumentacion.ideam.gov.co%2Fcgi-bin%2Fkoha%2Fopac-detail.pl%3Fbiblionumber%3D18241&usg=AOvVaw1QXJoDxIVwCkCZoH9TlgBJ (accessed on 30 May 2022).
- Bocanegra, J.E.M. Study of the Climatic Variability of Precipitation in Colombia Associated with Meso- and Large-Scale Oceanic and Atmospheric Processes; Informe final de las actividades desarrolladas en el marco del contrato de prestación de servicios No. IDEAM 022-2009; Instituto de Hidrología, Meteorología y Estudios Ambientales IDEAM: Colombia, Bogotá, 2009. Available online: http://www.ideam.gov.co/documents/21021/21789/Estudio+de+la+variabilidad+clim%C3%A1tica+de+la.pdf/643c4c0e-83d7-414f-b2b4-6953f64078d3 (accessed on 10 May 2022).
- ICAO. Annex 3: Meteorological Service for International Air Navigation, 6th ed., La Habana, Cuba. 2007, pp. 1–8. Available online: https://www.google.com/url?sa=t&rct=j&q=&esrc=s&source=web&cd=&cad=rja&uact=8&ved=2ahUKEwjztZC78Yf4AhUwRTABHYJUD9IQFnoECBAQAQ&url=https%3A%2F%2Fwww.icao.int%2Fairnavigation%2FIMP%2FDocuments%2FAnnex%25203%2520-%252075.pdf&usg=AOvVaw1FhpwoKFeySnrIz4kVMnrk (accessed on 20 January 2022).
- Stolz España, W.; Rojas Ureña, J.; Chinchilla, R.G. Aeronautical Climatology (2000–2010) at Tobías Bolaños Palma International Airport; s.l.; National Meteorological Institute: Sofia, Bulgaria, 2012. Available online: https://www.google.com/url?sa=t&rct=j&q=&esrc=s&source=web&cd=&ved=2ahUKEwjp87aq8of4AhVwQzABHSISCagQFnoECAIQAQ&url=https%3A%2F%2Fes.scribd.com%2Fdocument%2F373427291%2FClimatologia-Del-Aeropuerto-Tobias-Bolanos-Pavas&usg=AOvVaw29b9m9iW_WJHQam7qY8hW9 (accessed on 5 May 2022).
- Conde Torrijos, V.; Ballester Valor, G.; Huarte Ituláin, M.T.; Sterling Carmona, F.; Casado Gómez, J.; Corral Corral, F. Climatología Aeronáutica. Madrid (Barajas). In AEMET—Climatologías Aeronáuticas; Agencia Estatal de Meteorología: Madrid, Spain, 2012; Available online: http://hdl.handle.net/20.500.11765/3638 (accessed on 6 May 2022).
- Conde Torrijos, V.; Ballester Valor, G.; Huarte Ituláin, M.T.; Sterling Carmona, F.; Casado Gómez, J.; Corral Corral, F. Climatología Aeronáutica. Fuerteventura. In AEMET—Climatologías Aeronáuticas; Agencia Estatal de Meteorología: Madrid, Spain, 2012; Available online: http://hdl.handle.net/20.500.11765/3604 (accessed on 6 May 2022).
- Conde Torrijos, V.; Ballester Valor, G.; Huarte Ituláin, M.T.; Sterling Carmona, F.; Casado Gómez, J.; Corral Corral, F. Climatología Aeronáutica. Lanzarote. In AEMET—Climatologías Aeronáuticas; Agencia Estatal de Meteorología: Madrid, Spain, 2012; Available online: http://hdl.handle.net/20.500.11765/3609 (accessed on 6 May 2022).
- Conde Torrijos, V.; Ballester Valor, G.; Huarte Ituláin, M.T.; Sterling Carmona, F.; Casado Gómez, J.; Corral Corral, F. Climatología Aeronáutica. Alicante. In AEMET—Climatologías Aeronáuticas; Agencia Estatal de Meteorología: Madrid, Spain, 2012; Available online: http://hdl.handle.net/20.500.11765/3614 (accessed on 6 May 2022).
- Conde Torrijos, V.; Ballester Valor, G.; Huarte Ituláin, M.T.; Sterling Carmona, F.; Casado Gómez, J.; Corral Corral, F. Climatología Aeronáutica. Almería. In AEMET—Climatologías Aeronáuticas; Agencia Estatal de Meteorología: Madrid, Spain, 2012; Available online: http://hdl.handle.net/20.500.11765/3615 (accessed on 6 May 2022).
- Conde Torrijos, V.; Ballester Valor, G.; Huarte Ituláin, M.T.; Sterling Carmona, F.; Casado Gómez, J.; Corral Corral, F. Climatología Aeronáutica. Asturias. In AEMET—Climatologías Aeronáuticas; Agencia Estatal de Meteorología: Madrid, Spain, 2012; Available online: http://hdl.handle.net/20.500.11765/3617 (accessed on 6 May 2022).
- Conde Torrijos, V.; Ballester Valor, G.; Huarte Ituláin, M.T.; Sterling Carmona, F.; Casado Gómez, J.; Corral Corral, F. Climatología Aeronáutica. Melilla. In AEMET—Climatologías Aeronáuticas; Agencia Estatal de Meteorología: Madrid, Spain, 2012; Available online: http://hdl.handle.net/20.500.11765/3612 (accessed on 6 May 2022).
- De Armas Echevarria, A.M.; Cremata Zaldívar, L.; Pérez Hernández, L. Characterization of the direction and strength of the wind at the “Abel Santamaría” International Airport in the period 2011–2015. Rev. Cub. Meteor. 2019, 25, 139–150. Available online: http://rcm.insmet.cu/index.php/rcm/article/download/461/636?inline=1 (accessed on 30 May 2022).
- Ahrens, C.D. Essentials of Meteorology: An Invitation to the Atmosphere; Segunda ed. s.l.; Wadsworth Publishing Company: Belmont, CA, USA, 1998. [Google Scholar]


| Primary | Secondary |
|---|---|
| N (north) | NNE (north northeast) |
| S (south) | ENE (east northeast) |
| E (east) | ESE (east southeast) |
| W (west) | SSE (south southeast) |
| NE (northeast) | SSO (south-southwest) |
| NW (northwest) | WSW (west southwest) |
| SE (southeast) | WNW (west-northwest) |
| SW (southwest) | NNW (north northwest) |
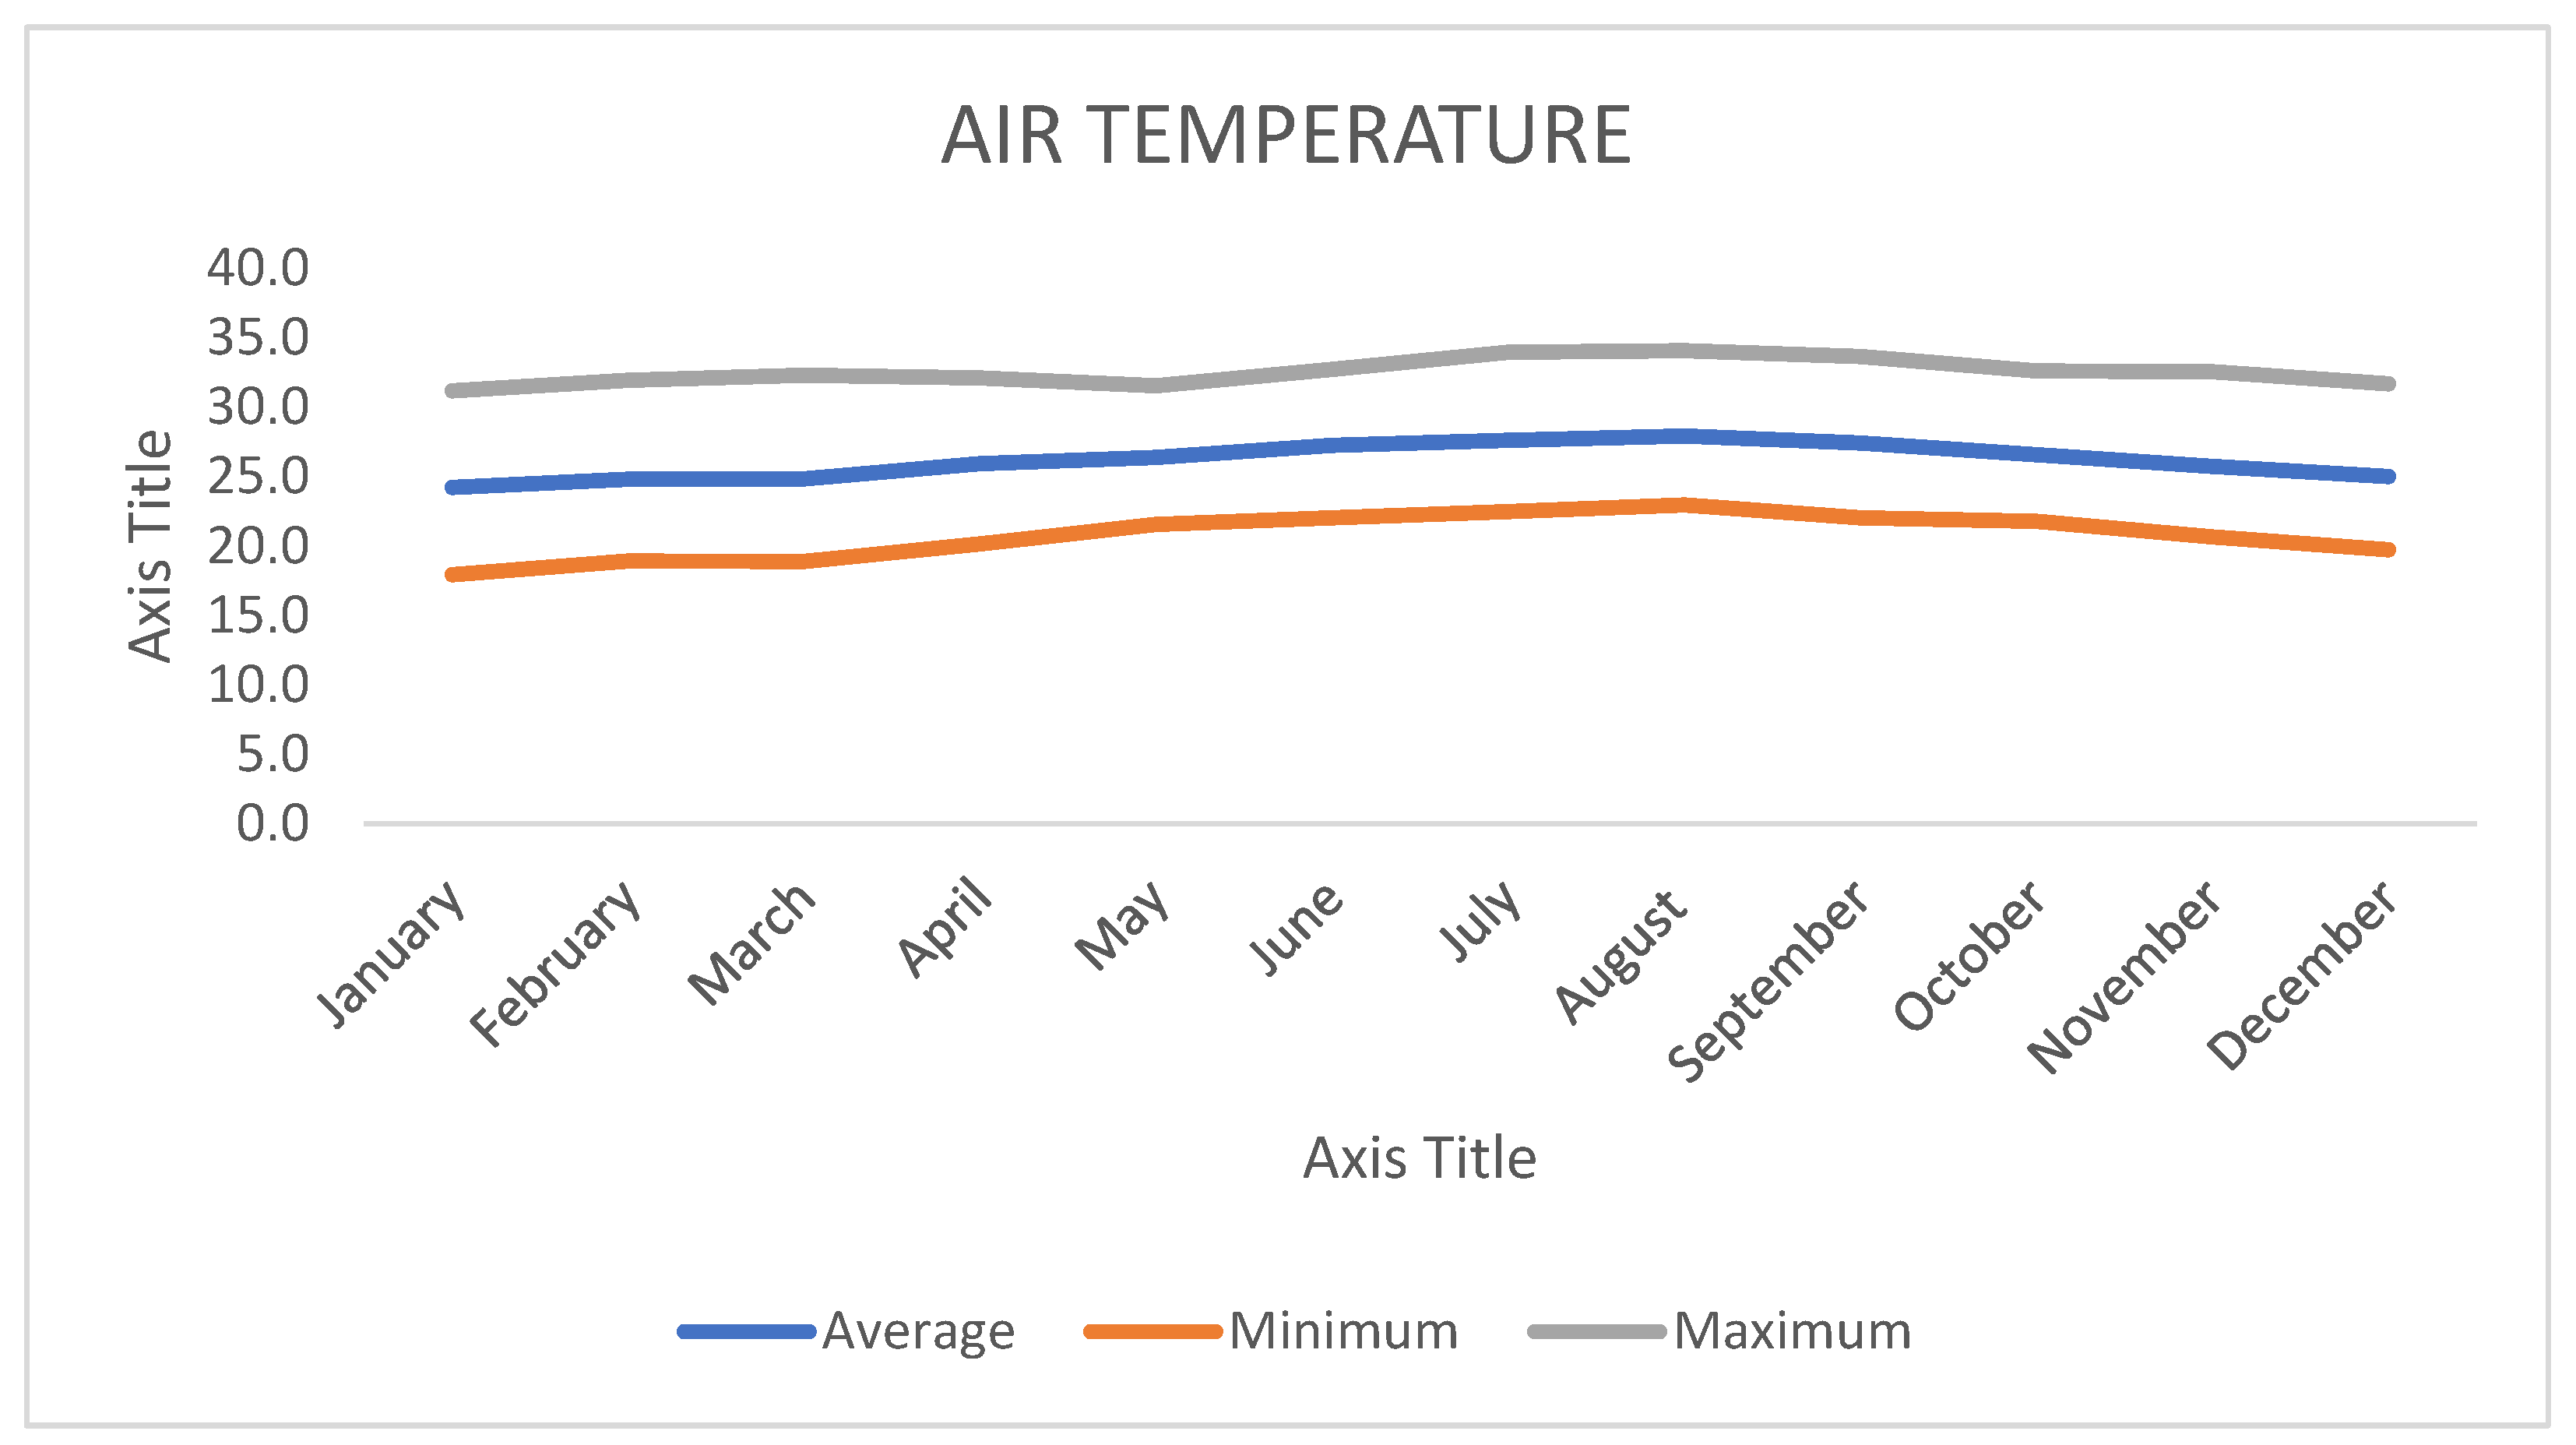
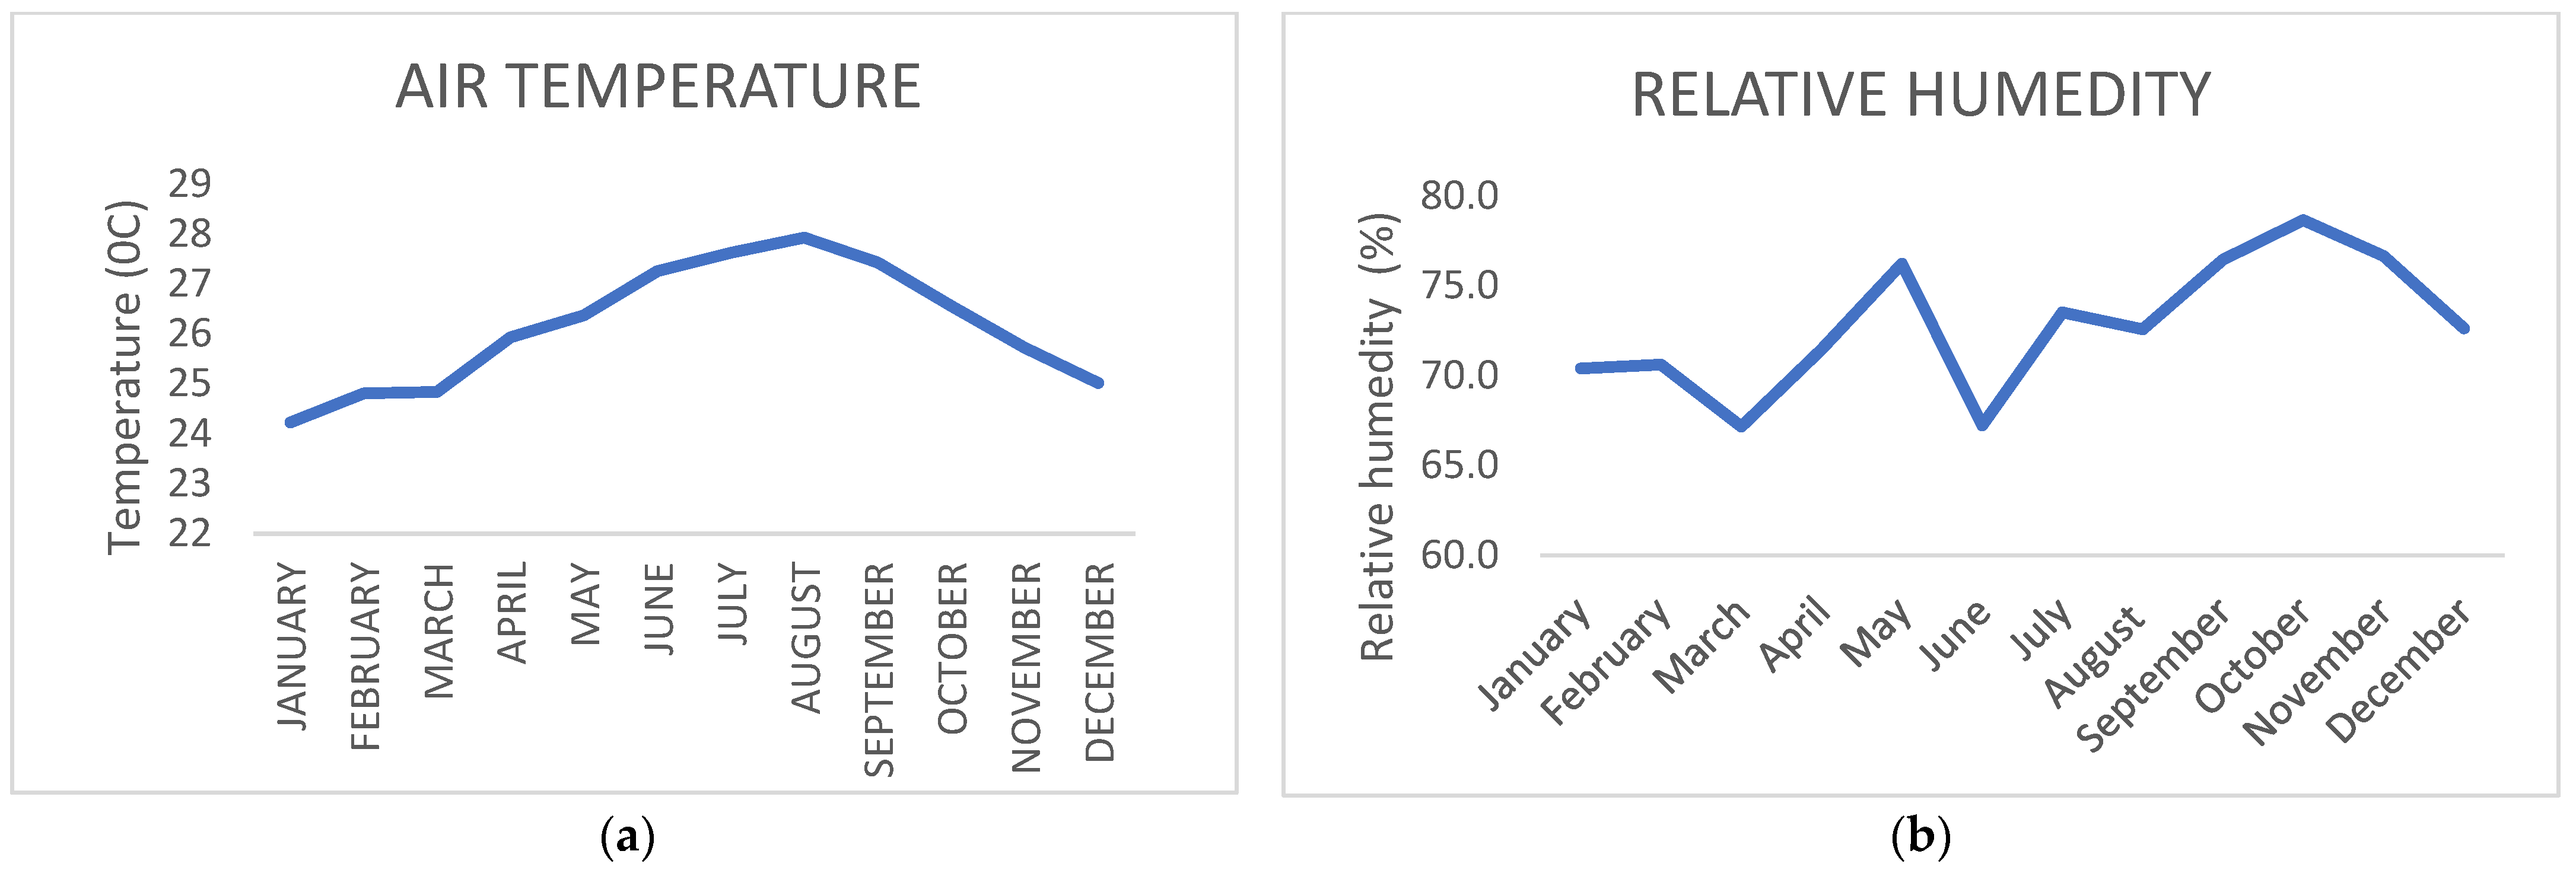
| Months | Mean Temperature (°C) | Minimum Temperature (°C) | Maximum Temperature (°C) | Relative Humidity (%) |
|---|---|---|---|---|
| J | 24.2 | 18.0 | 31.2 | 70.4 |
| F | 24.8 | 18.9 | 31.9 | 70.6 |
| M | 24.8 | 18.9 | 32.3 | 67.2 |
| A | 25.9 | 20.1 | 32.1 | 71.5 |
| M | 26.4 | 21.6 | 31.5 | 76.2 |
| J | 27.3 | 22.0 | 32.7 | 67.2 |
| J | 27.6 | 22.5 | 33.9 | 73.5 |
| A | 27.9 | 23.0 | 34.1 | 72.6 |
| S | 27.4 | 22.0 | 33.6 | 76.4 |
| O | 26.6 | 21.8 | 32.6 | 78.7 |
| N | 25.7 | 20.7 | 32.5 | 76.6 |
| D | 25.0 | 19.7 | 31.7 | 72.6 |
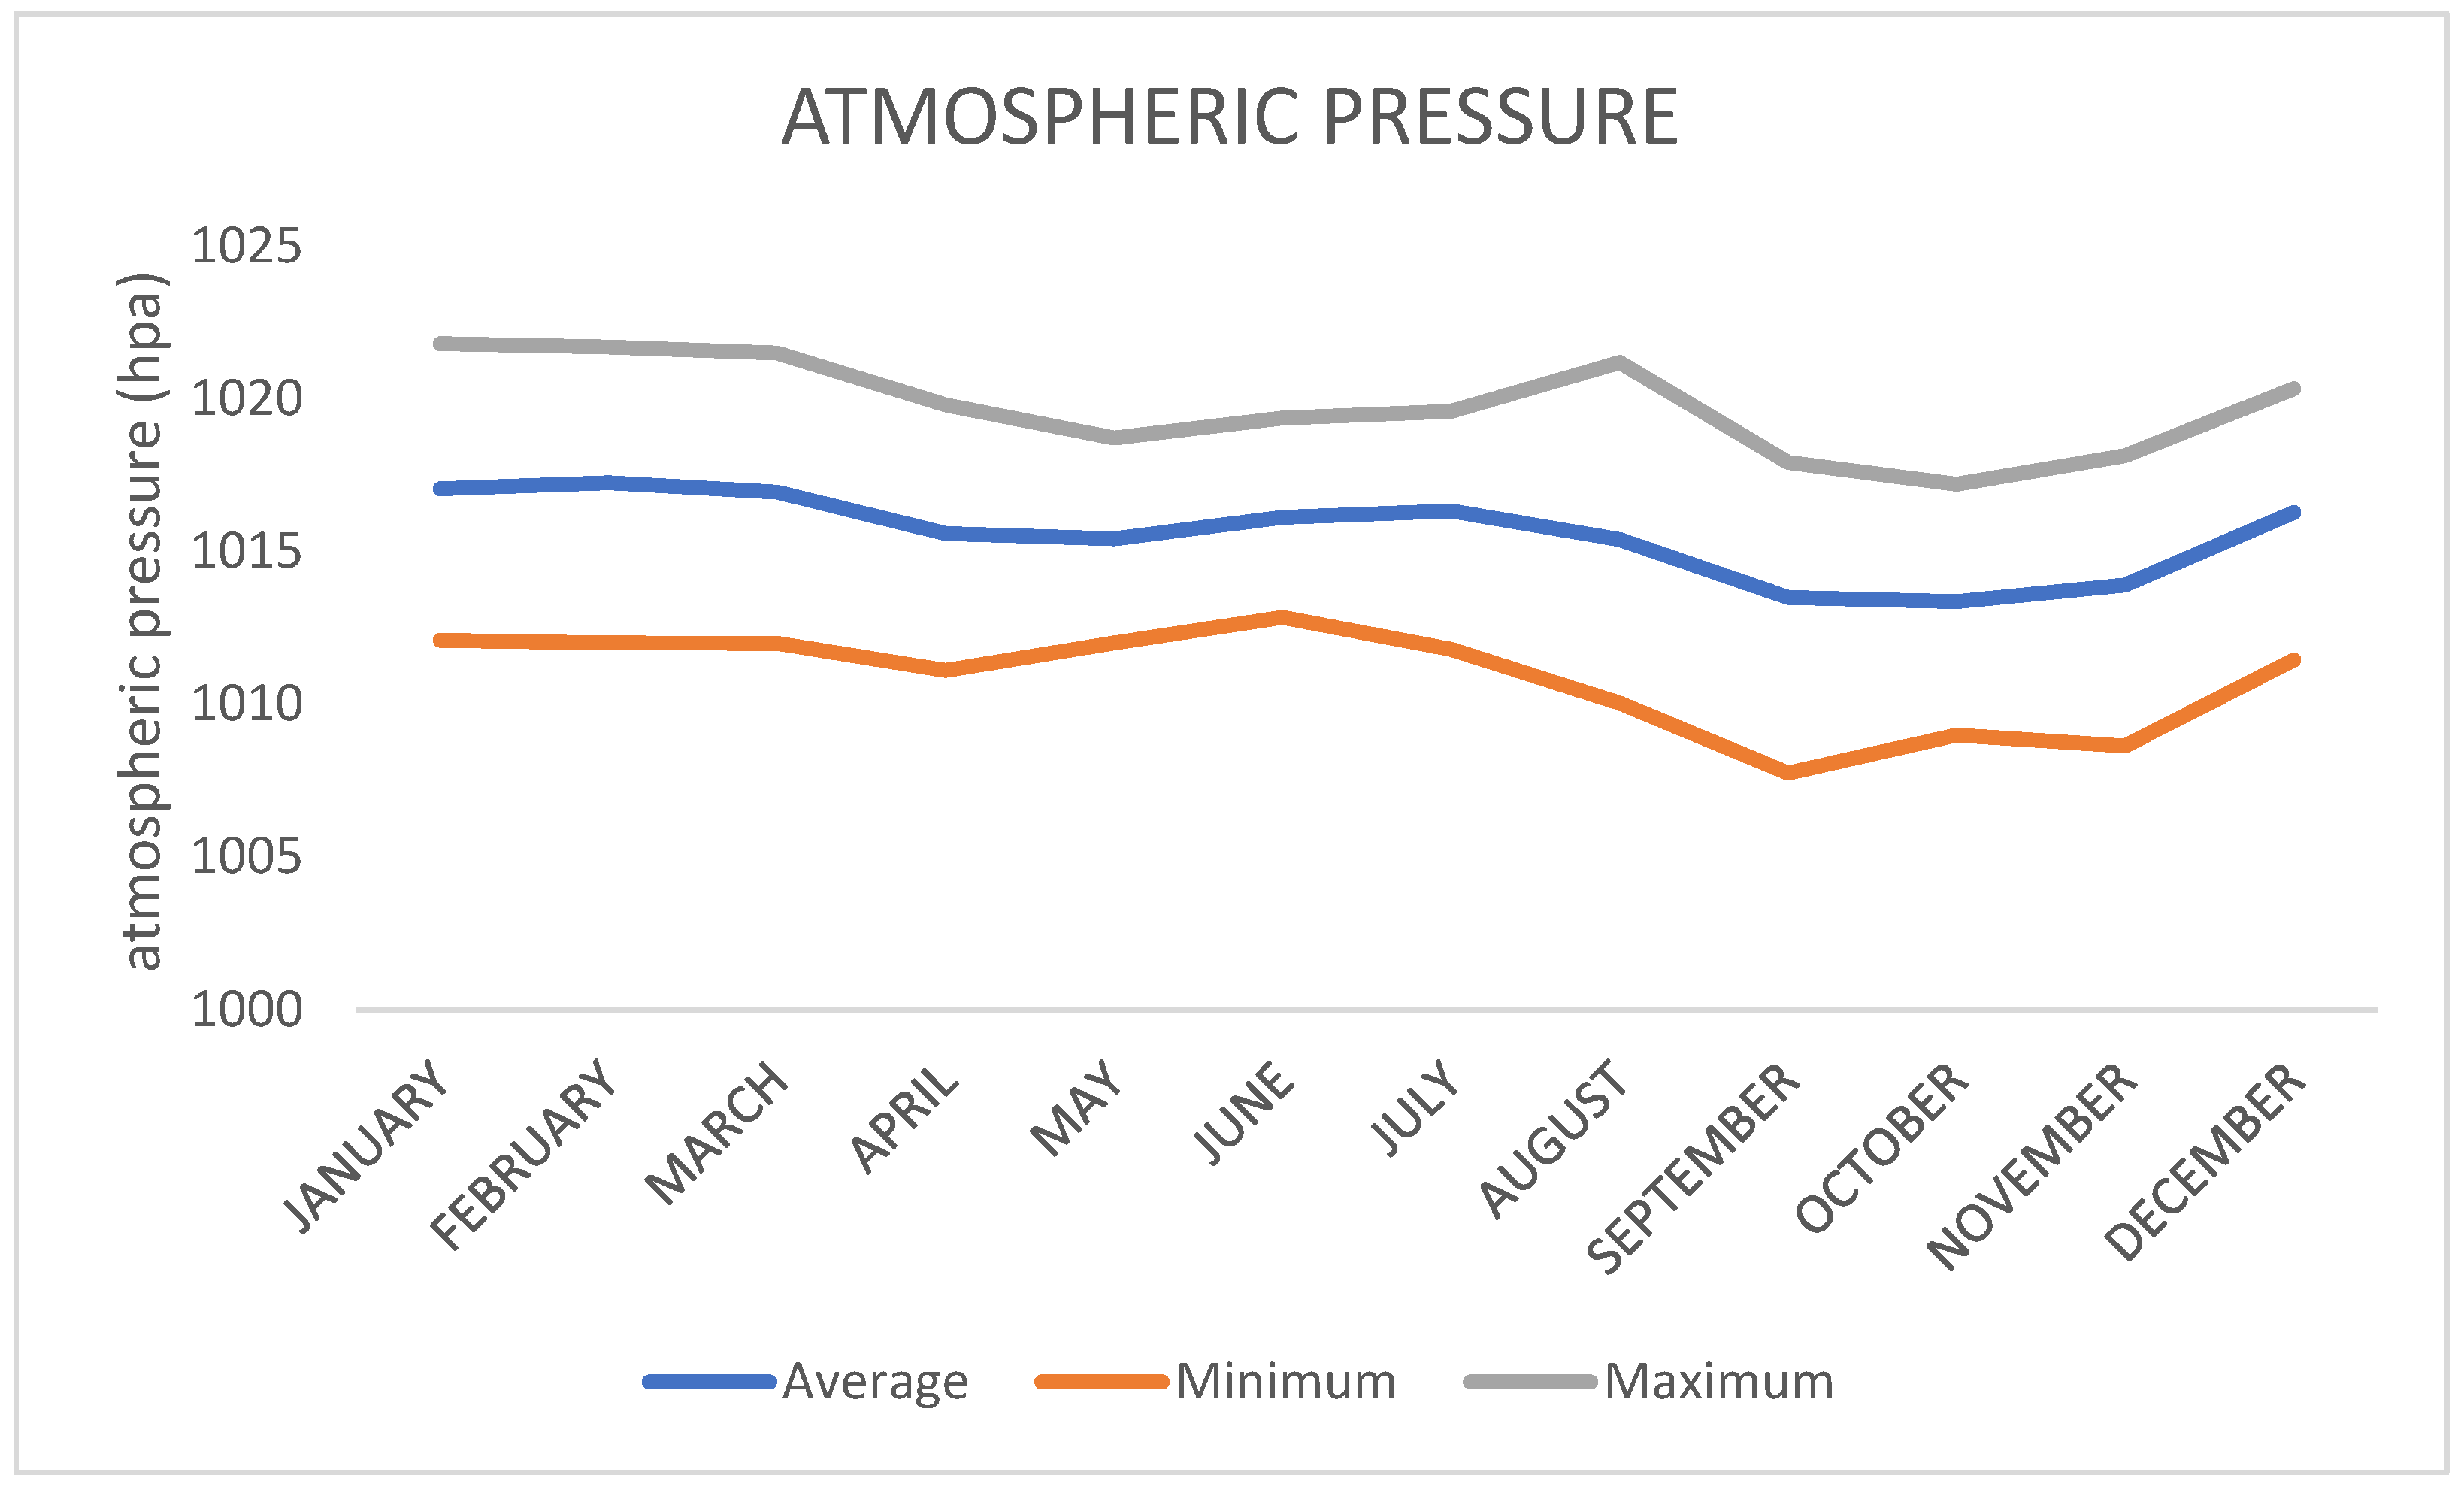
| Month | Mean Atmospheric Pressure (hPa) | Minimum Atmospheric Pressure (hPa) | Maximum Atmospheric Pressure (hPa) |
|---|---|---|---|
| J | 1017 | 1012 | 1022 |
| F | 1017 | 1012 | 1022 |
| M | 1017 | 1012 | 1021 |
| A | 1016 | 1011 | 1020 |
| M | 1015 | 1012 | 1019 |
| J | 1016 | 1013 | 1019 |
| J | 1016 | 1012 | 1020 |
| A | 1015 | 1010 | 1021 |
| S | 1013 | 1008 | 1018 |
| O | 1013 | 1009 | 1017 |
| N | 1014 | 1009 | 1018 |
| D | 1016 | 1011 | 1020 |
Publisher’s Note: MDPI stays neutral with regard to jurisdictional claims in published maps and institutional affiliations. |
© 2022 by the authors. Licensee MDPI, Basel, Switzerland. This article is an open access article distributed under the terms and conditions of the Creative Commons Attribution (CC BY) license (https://creativecommons.org/licenses/by/4.0/).
Share and Cite
Valdés Díaz, B.; De Armas Echevarria, A.M.; Coll-Hidalgo, P. Main Climatic Characteristics of the International Airport “Antonio Maceo” during the Period 2017–2021. Environ. Sci. Proc. 2022, 19, 45. https://doi.org/10.3390/ecas2022-12855
Valdés Díaz B, De Armas Echevarria AM, Coll-Hidalgo P. Main Climatic Characteristics of the International Airport “Antonio Maceo” during the Period 2017–2021. Environmental Sciences Proceedings. 2022; 19(1):45. https://doi.org/10.3390/ecas2022-12855
Chicago/Turabian StyleValdés Díaz, Beatriz, Amanda Maria De Armas Echevarria, and Patricia Coll-Hidalgo. 2022. "Main Climatic Characteristics of the International Airport “Antonio Maceo” during the Period 2017–2021" Environmental Sciences Proceedings 19, no. 1: 45. https://doi.org/10.3390/ecas2022-12855