1. Introduction
The winter period, or the period with little rainfall, in Cuba includes the months from November to April and is defined by the changes that occur in meteorological variables such as pressure, wind direction and speed, temperature, the presence of hydrometeors, and in some cases severe events, with the passage of cold fronts. These meteorological systems are the most important in Cuba after tropical cyclones, not only because of their frequency but also because of the significant impacts that they cause when they are combined with other meteorological conditions, including local factors, such as heavy rains (accumulated 100 mm in 24 h or less).
However, it was not until 2019 that the phenomenon of heavy rains that are associated with cold fronts was studied with a link to meteorological variables and synoptic conditions, when Rodríguez-Acosta E. [
1] identified the synoptic patterns that are associated with cold fronts that generate heavy rains in Cuba. However, in this research, the author did not consider the relationship that this meteorological situation could have with the behavior of the North Atlantic Oscillation (NAO), which significantly influences the winter period in the Northern Hemisphere and is vital in the assessments of a seasonal forecast.
How does the NAO affect cold fronts that generate heavy rains in Cuba? This is a scientific problem to be solved and for this, the general objective is as follows: to determine the behavior of the NAO in the synoptic patterns that are associated with cold fronts that generate intense rains in Cuba. In order to respond to this, the specific objectives are as follows: to identify the mean synoptic patterns in the lower, middle, and upper troposphere that are associated with cold fronts that generate heavy rains in Cuba; to characterize the behavior of the NAO in those winter seasons with heavy rains that are associated with cold fronts in the Cuban archipelago and its influence on them; to determine the mean field of temperature, humidity, and wind and its derived fields that are associated with cold fronts that generate heavy rains and its relation to the NAO teleconnection event.
This research is aimed at increasing the knowledge about the relationship between heavy rainfall that is associated with cold fronts and the NAO. The results are of great importance and interest for meteorologists, particularly in the field of synoptic meteorology, weather forecasting, and climatology-synoptics, due to the knowledge and contributions it provides in these areas, which have a greater weight in the services that contribute to the country’s security.
2. Materials and Methods
The present study is based on the synoptic patterns that generate intense rainfall associated with cold fronts in Cuba, which are defined by the author in [
1] for each region of the country (West, Center, and East), because these systems present different characteristics in each of them and their main fields are deformed as the system advances eastward over the Cuban territory. The geographical environment ranged from 15° N to 70° N and from 110° W to 10° W, because it is representative in the study of the circulatory patterns associated with the CF that affect the Cuban archipelago and the influence of the teleconnection events.
For the preparation of the final sample of the circulatory patterns, only those months in which the most representative patterns by region and those that were repeated at the national level were taken into account.
The NAO index, according to Hurell [
2], is based on the difference in standardized sea level atmospheric pressure anomalies between the stations located in Lisbon (Portugal) and Stykkisholmur (Iceland), since these stations are located closest to the mean position of the centers of action associated with this teleconnection event, and, therefore, they more accurately reflect the meridional gradient between the two barycenters. Hurell [
2], Fonseca [
3], and Acosta [
4] propose that, as a general rule, values greater than 1 and less than −1 are considered to characterize the positive and negative phases of the index, respectively.
3. Results and Discussion
When analyzing the tropospheric patterns that were selected for this research, complying with the previously mentioned criteria, it was possible to observe that some of them coincided in months and year, therefore the final sample was made up of 33 months.
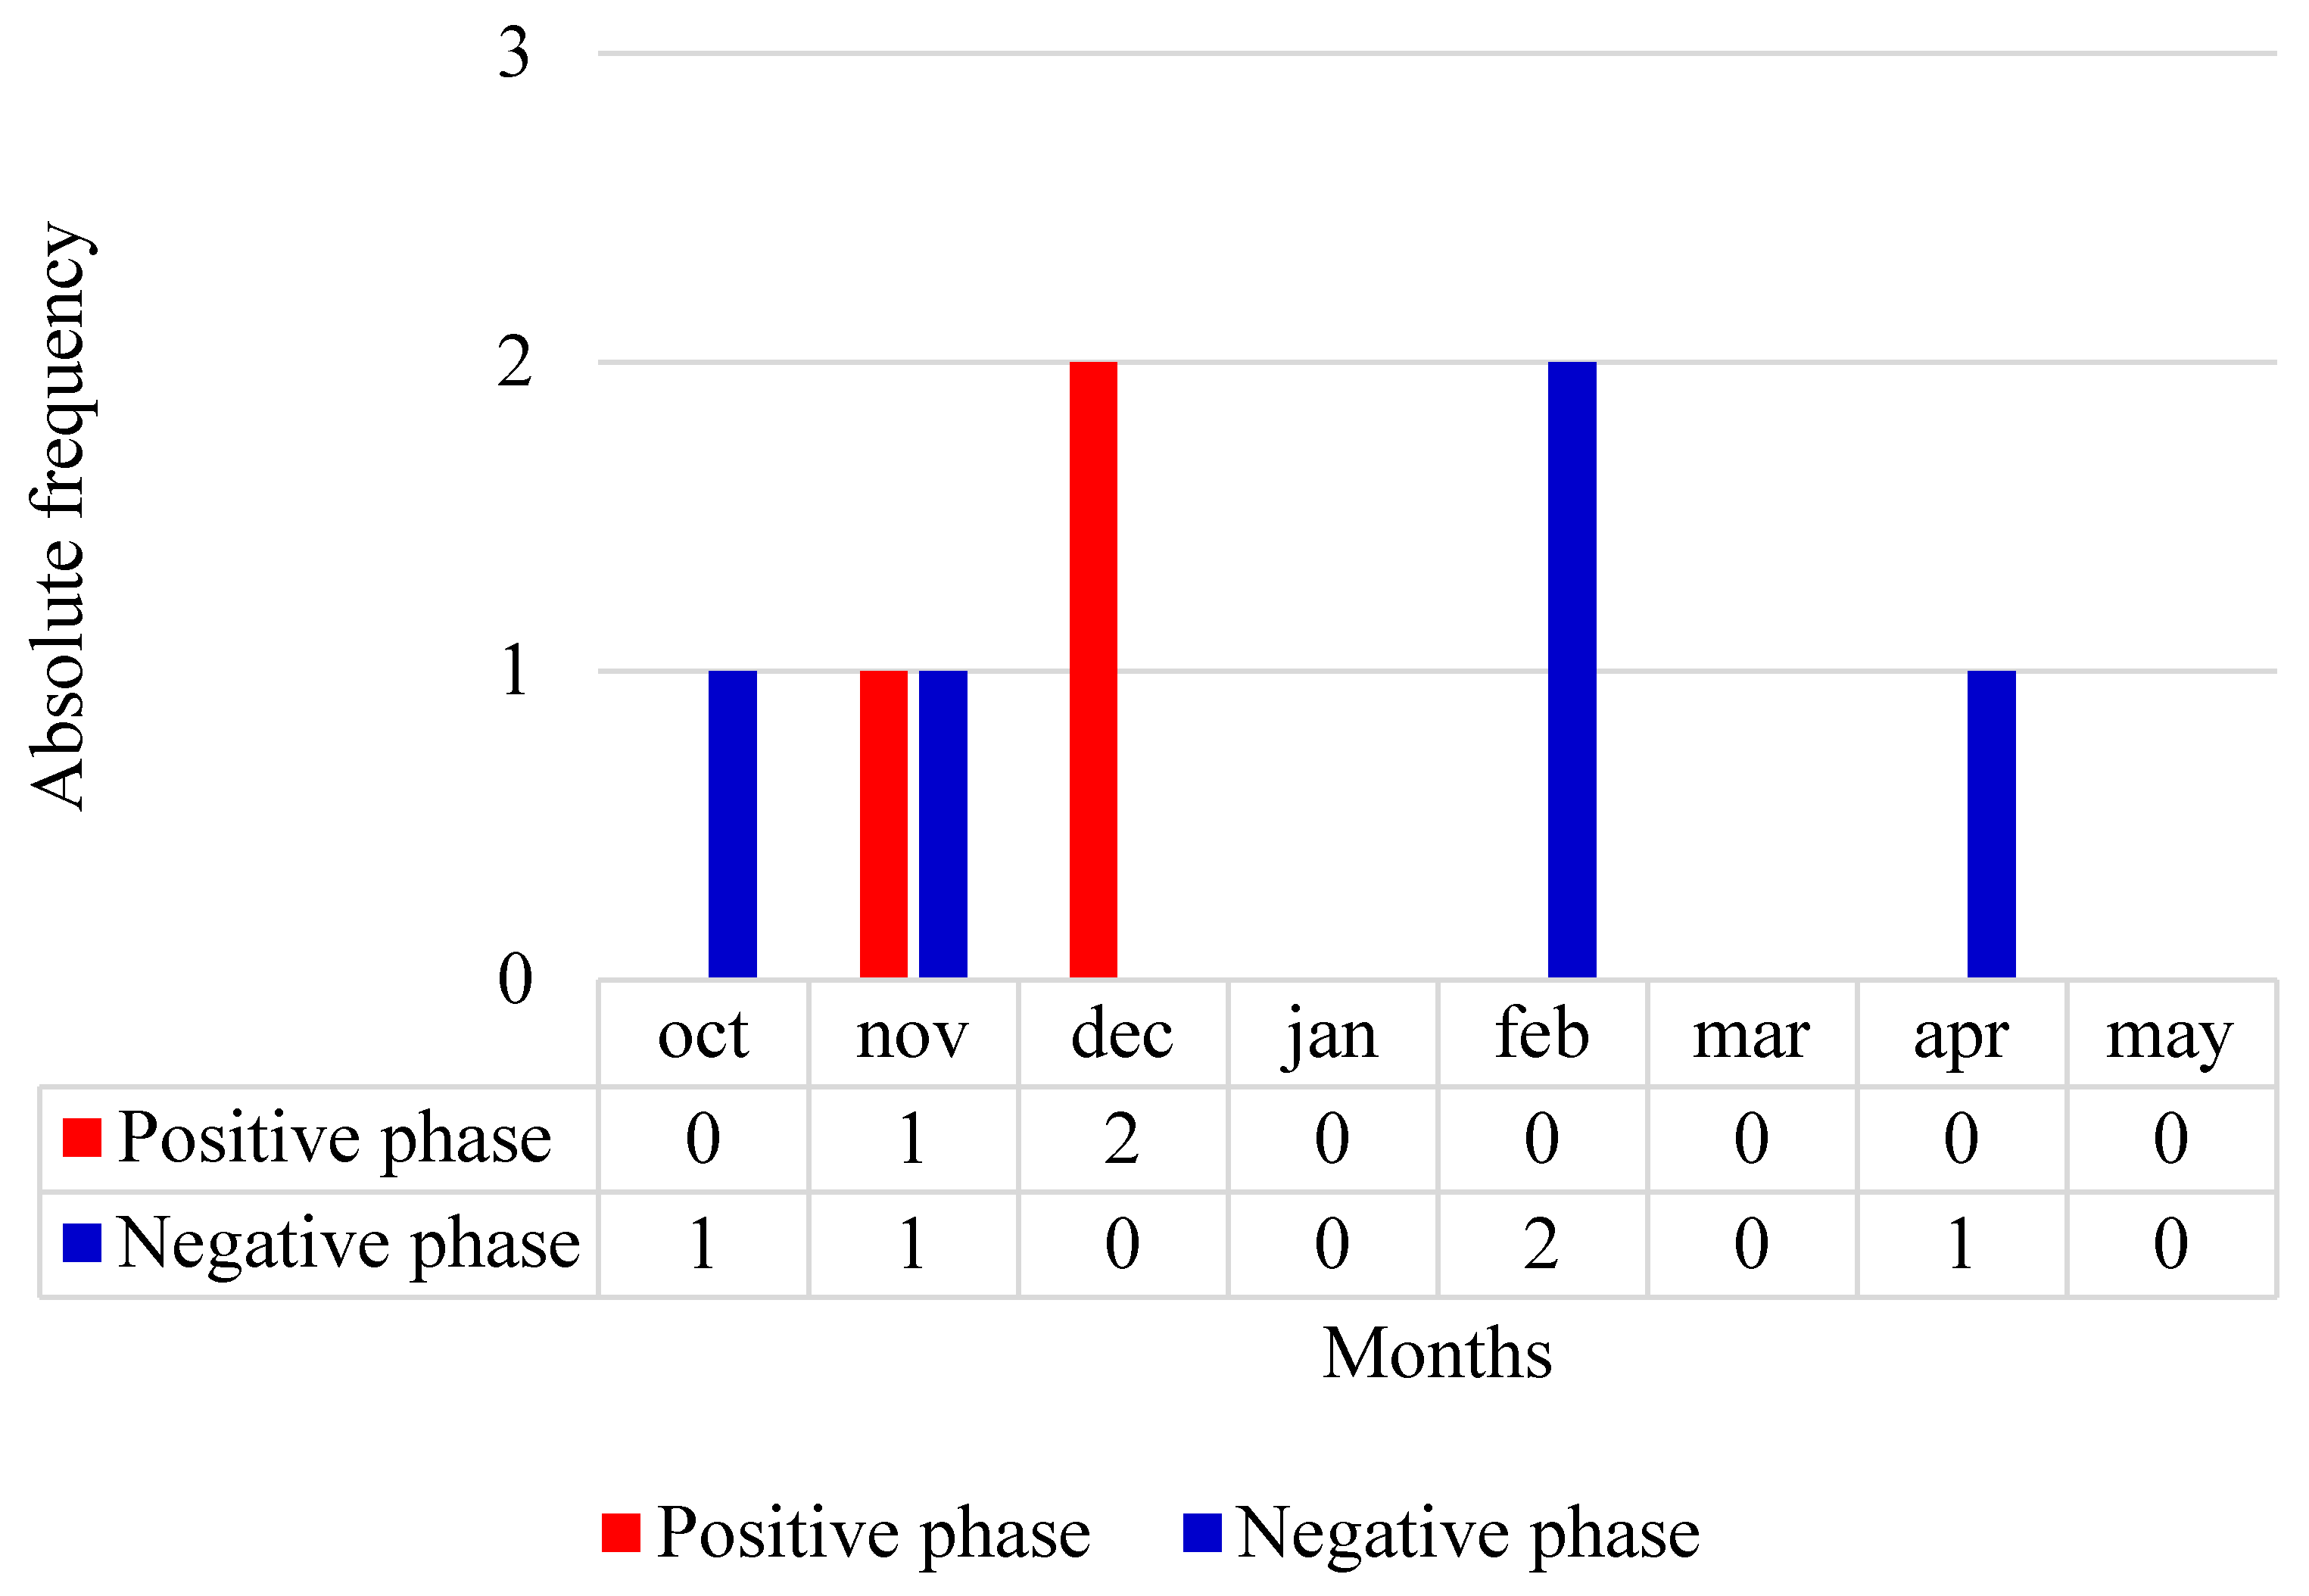
Of these, three months corresponded to the positive phase, representing 9.1% of the total number of months, while five months corresponded to the negative phase, which was more representative than the positive phase, representing 15.2%. The remaining 25 months corresponded to the neutral phase of this oscillation.
Figure 1 shows the monthly absolute frequency of each of the phases of this oscillation in the study sample. The positive phase of this event was more frequent in the month of December, with two cases, and in the month of November, with only one case, while in the rest of the months it was in its neutral phase. The negative phase of this oscillation was most represented in the month of February, with two episodes, while in the months of December, January, March, and May the frequency was zero, and in the remaining months there was only one case.
3.1. NAO Behavior by Tropospheric Patterns
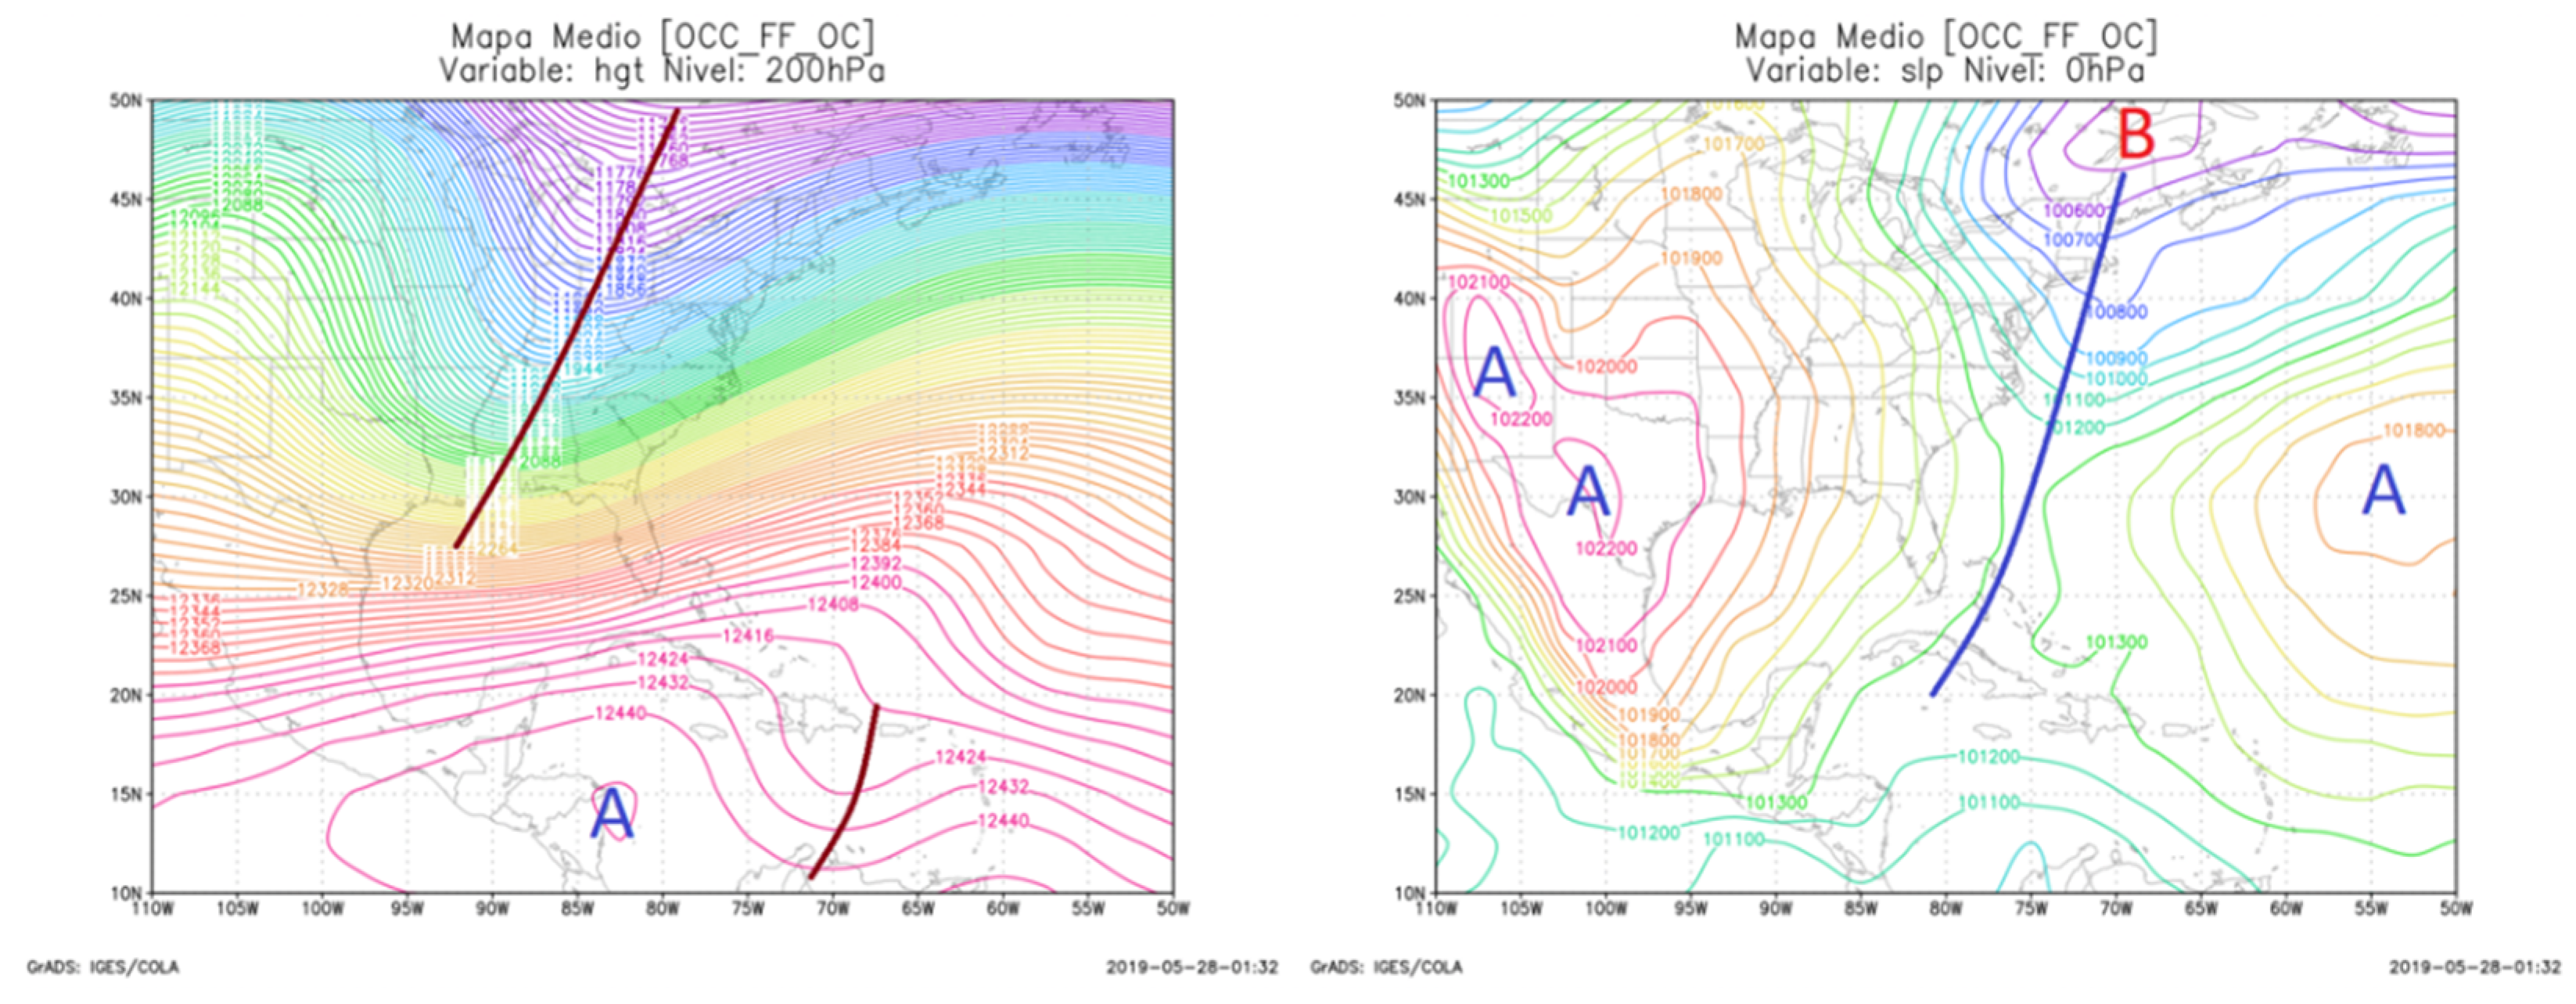
3.1.1. Short-Wave Trough Pattern Associated with Surface Cold Front
Figure 2 shows the short-wave trough pattern that was associated with a surface cold front, in which the NAO was mostly in its neutral phase and the positive phase was only present in 16% of the cases, with the anticyclone having the highest pressures and the Icelandic low having the lowest pressures.
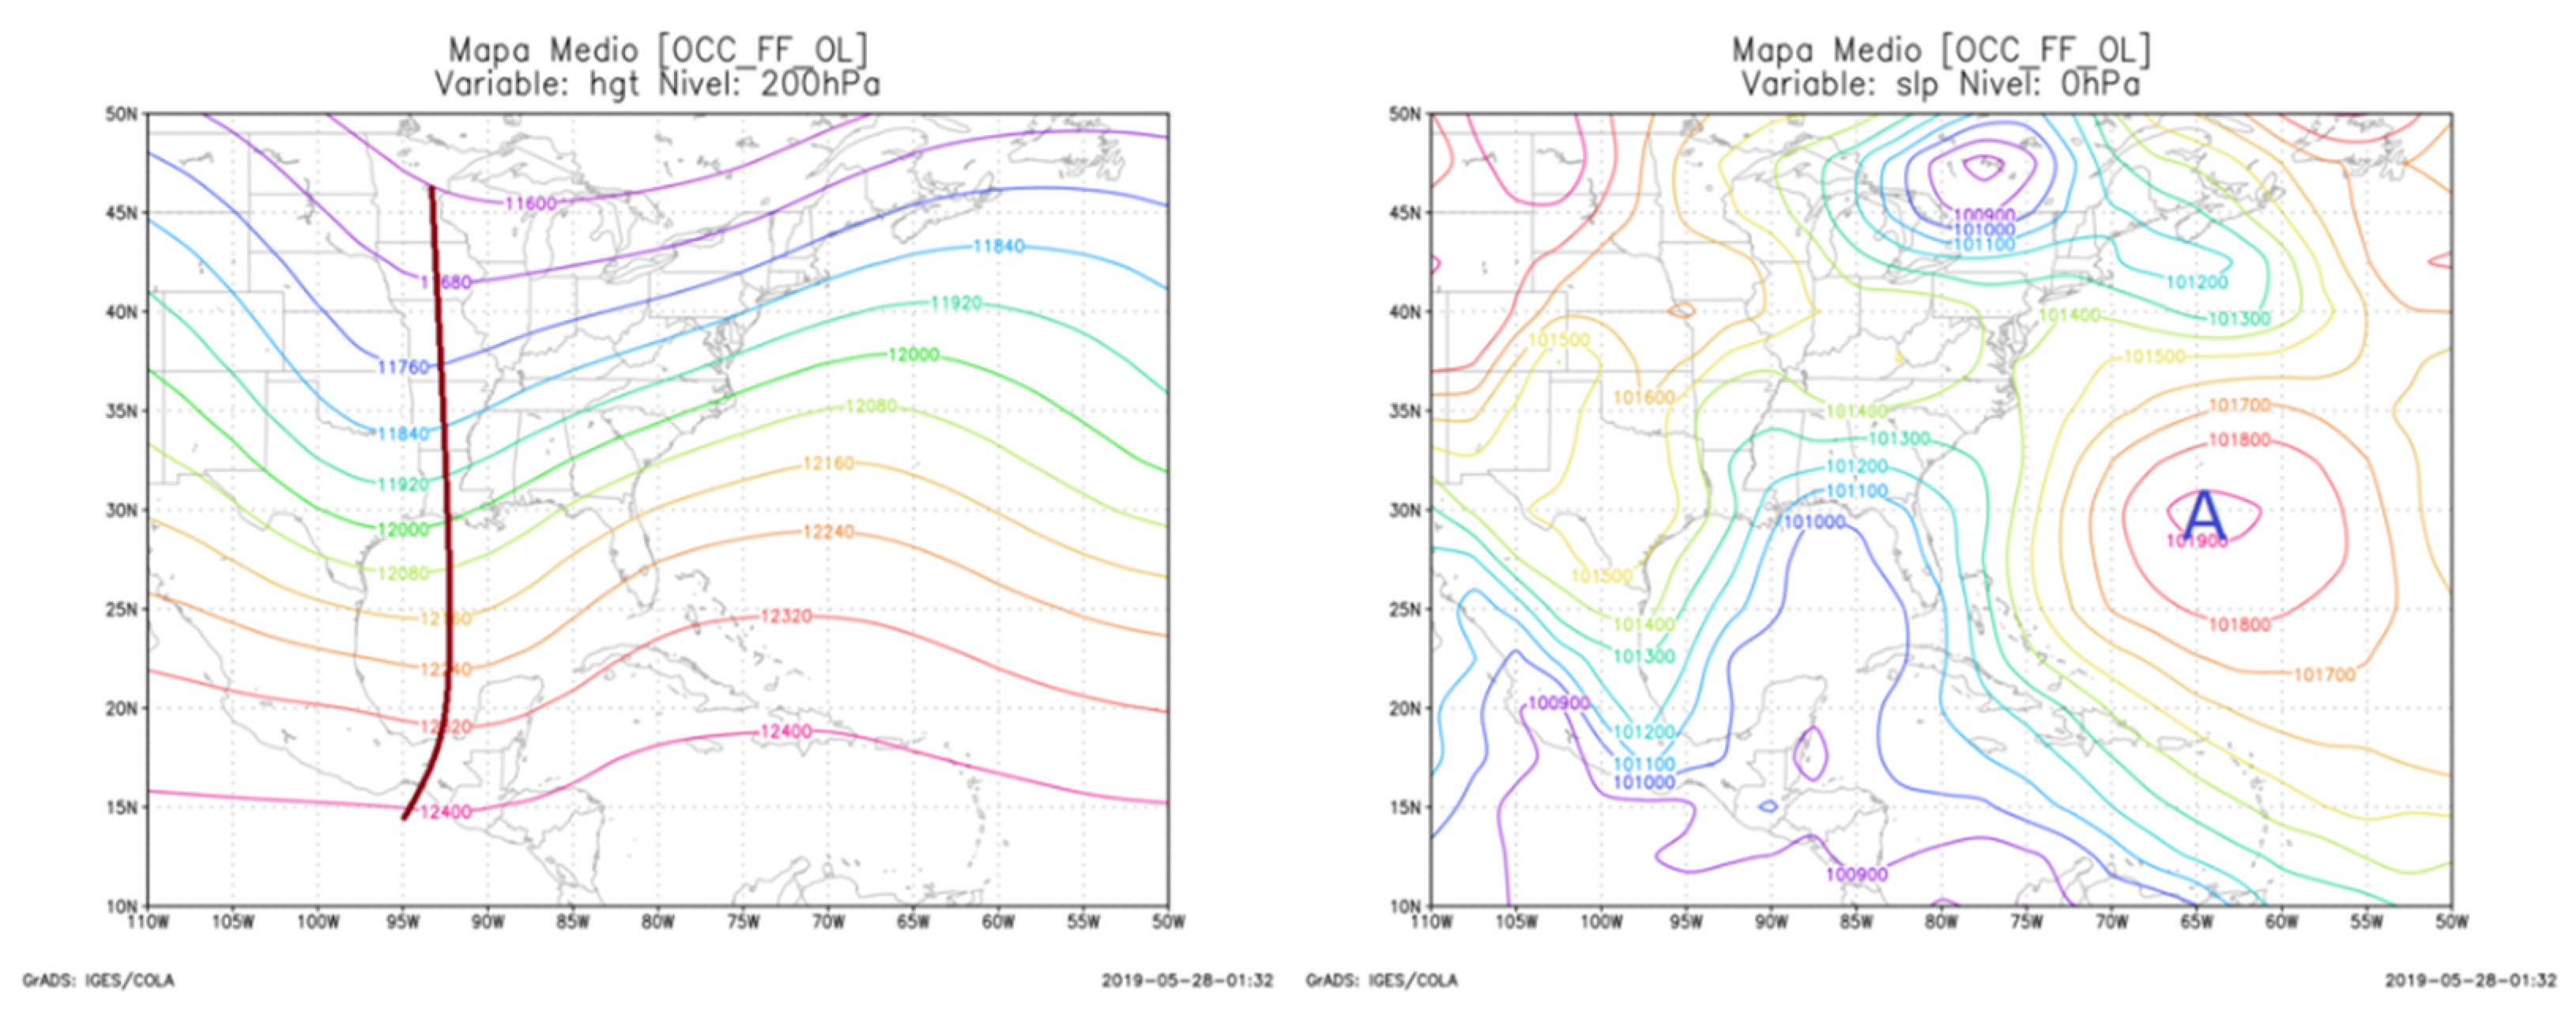
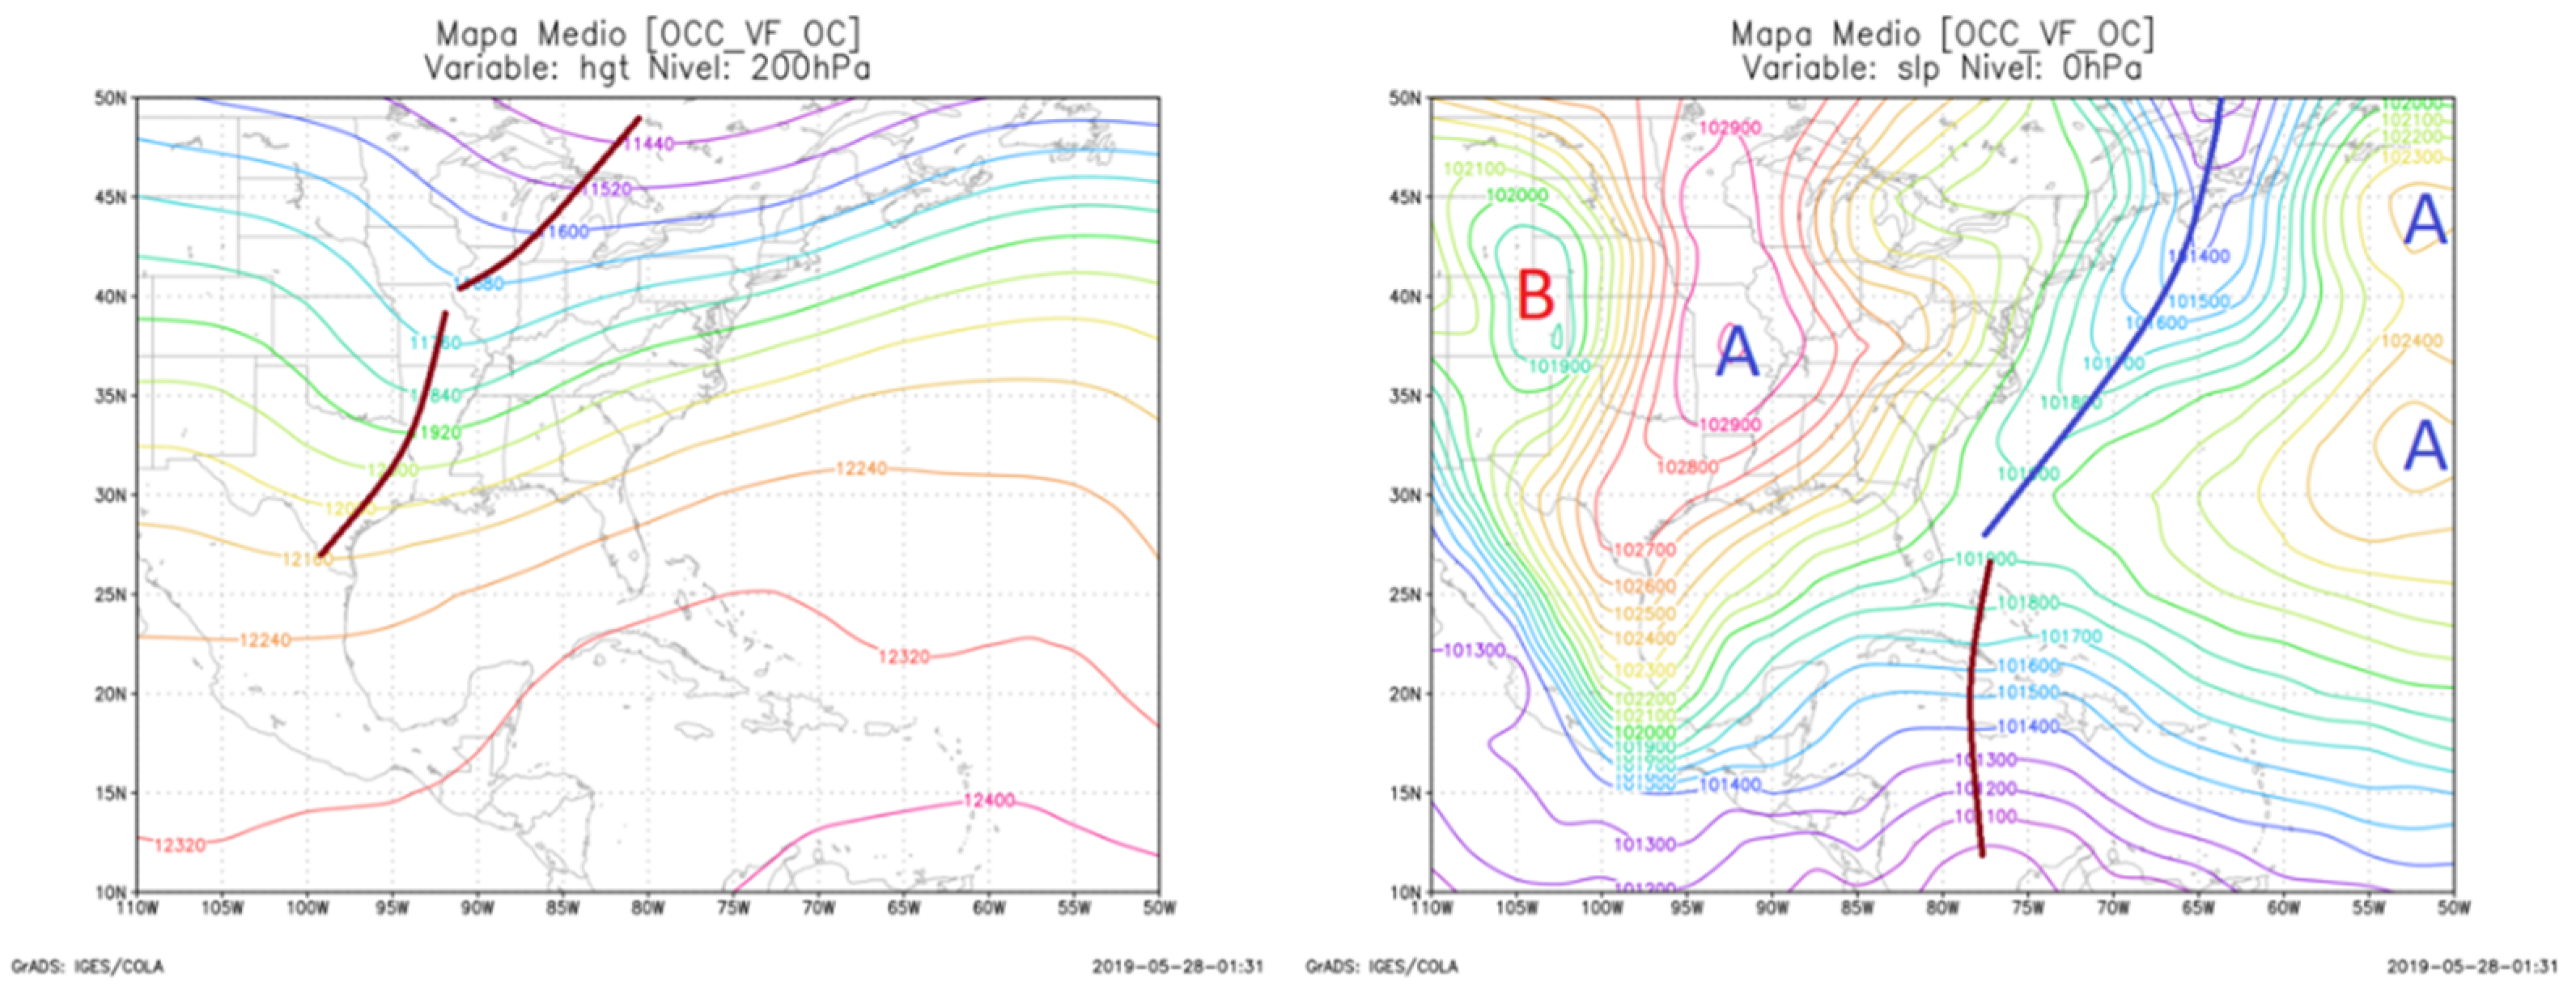
3.1.2. Long-Wave Trough Pattern Associated with Surface Cold Front
In the long-wave trough pattern that was associated with a surface cold front, the NAO was in its neutral phase in 54% of the cases in which any of its phases were present. These were manifested indistinctly, which means that the Icelandic low and the Azores anticyclone showed a weakening or intensity; this pattern is shown in
Figure 3.
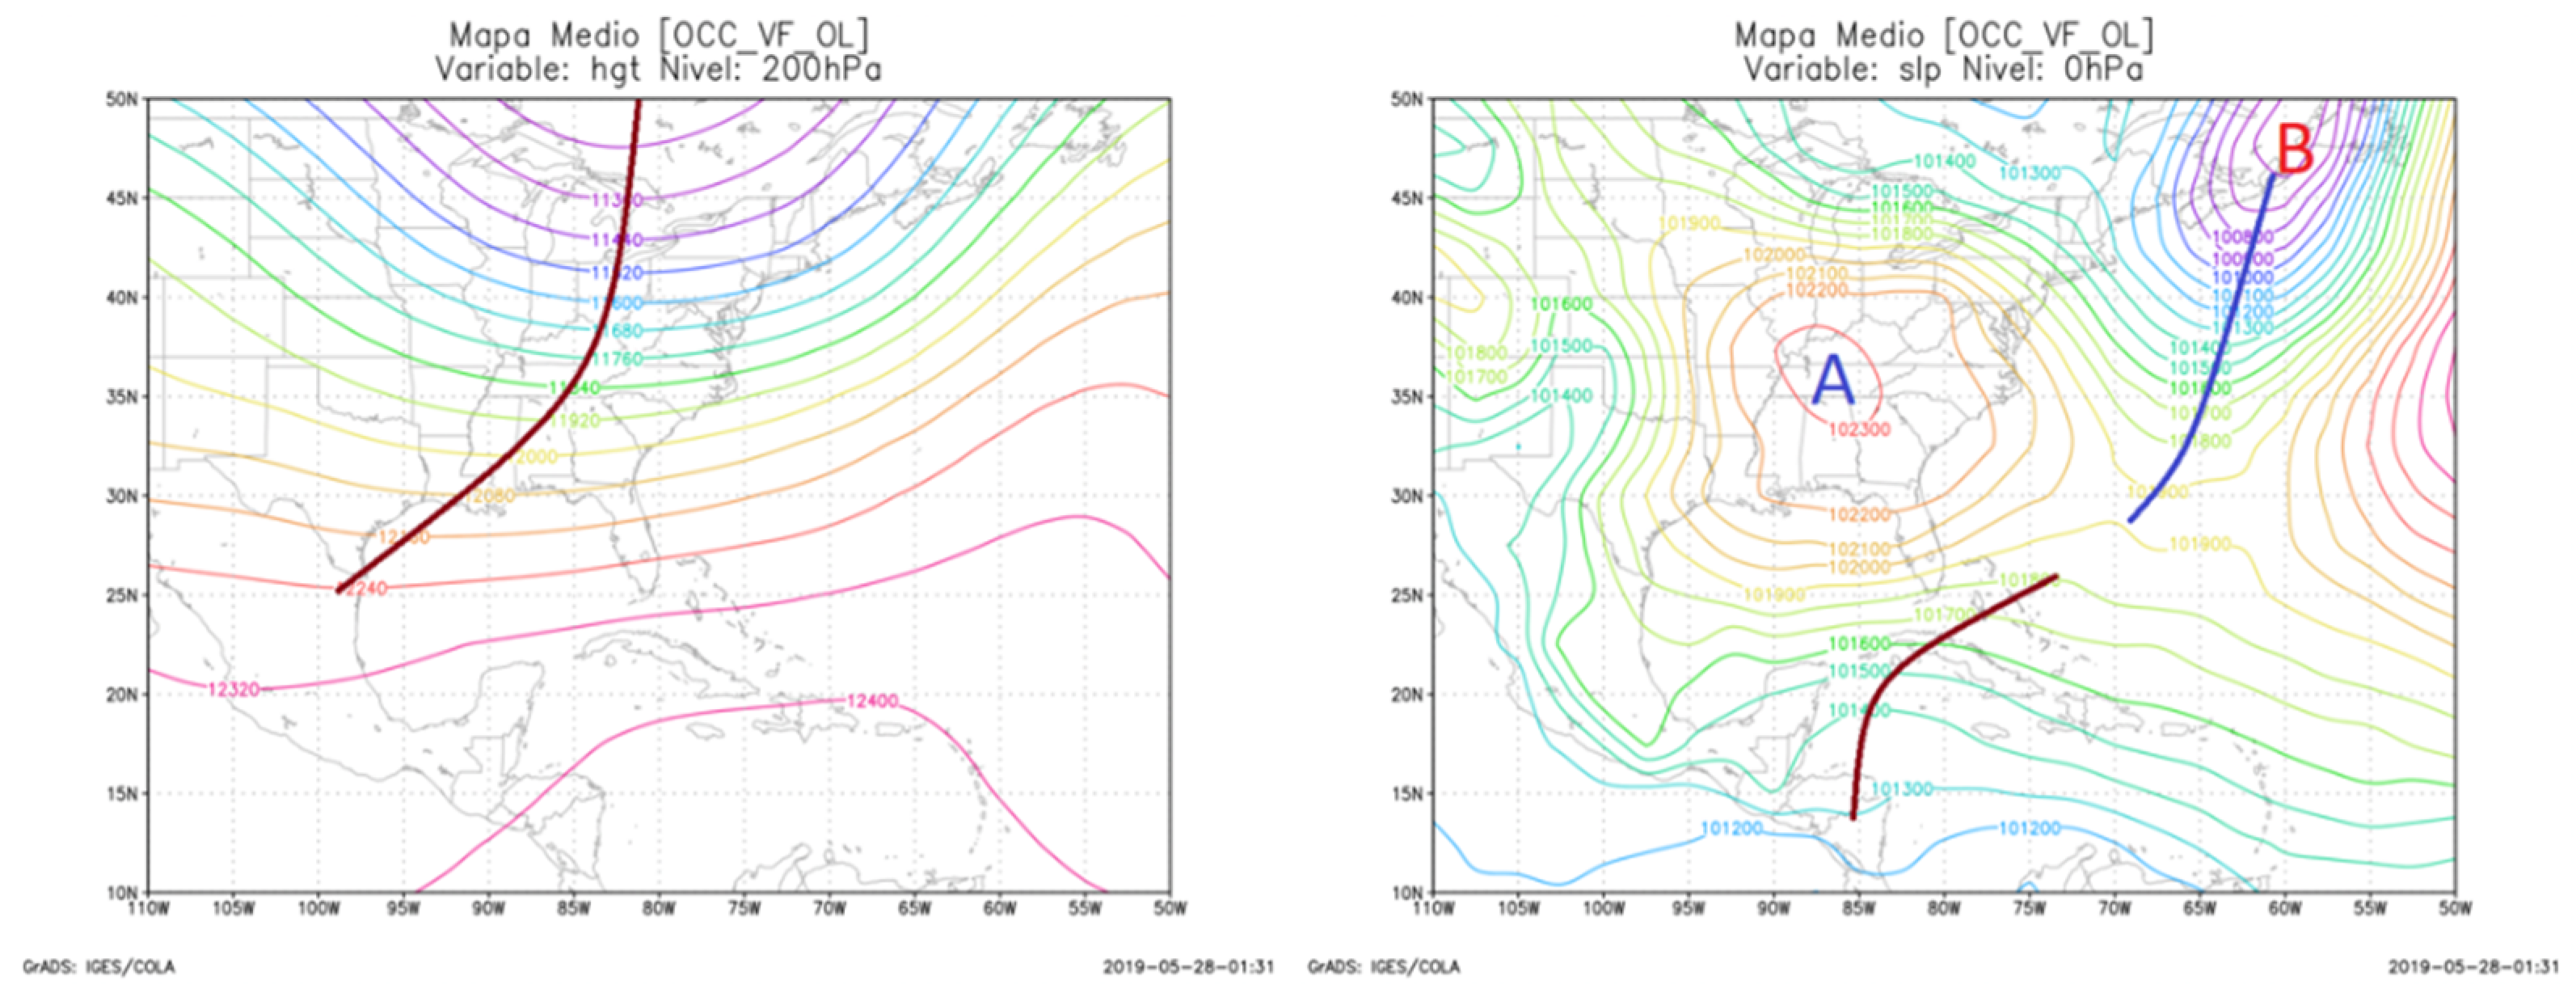
3.1.3. Long-Wave Trough Pattern Associated with Frontal Trough at the Surface
Figure 4 shows the long-wave trough pattern that was associated with a frontal surface trough. In this pattern, this oscillation was mainly in its neutral phase, although its negative trend was manifested in 24% of cases, therefore, the Azores anticyclone was weak and the Icelandic cyclonic cell was not very active.
3.1.4. Short-Wave Trough Pattern Associated with Frontal Trough at the Surface
In the short-wave trough pattern that was associated with a frontal trough on the surface (
Figure 5), the NAO was less present in its negative phase, causing a weakening of the Azores anticyclone and the Icelandic cyclonic cell was not very active.
3.2. Behavior of Meteorological Variables in Each NAO Phase
The determination of the variables of temperature, relative humidity, wind, and their derived fields are closely linked to atmospheric instability and the variable precipitation in order to identify the synoptic background conditions that could have led to the occurrence of heavy rain that is associated with cold fronts and their relationship to this teleconnection event.
3.2.1. Positive Phase
The temperature field at 850 hPa had a mean value of 15 °C and the cell with the maximum thermal value was located west of Mexico, in the vicinity of the Pacific Ocean. The relative humidity in the 1000–700 hPa layer was above 50%, with a mean value of 58%, and the cell with the maximum value was located over Mexico. The wind in its southern component was predominantly negative, with values that did not exceed 3 m/s. At 300 hPa, the average value was −1.3 m/s and at 200 hPa it decreased to −0.6 m/s. The vorticity at 700 and 500 hPa presented negative values, with a mean value of −1.0 × 10⁻⁵ s−1 and −1.6 × 10⁻⁵ s−1, respectively, with maximum values in the vicinity of Florida. The divergence was positive, with a mean value of 6.6 × 10⁻⁸ s−1 at 700 hPa, while at 500 hPa it was 4.3 × 10⁻⁸ s−1. At both of these levels the maximum divergence value was over the Gulf of Mexico.
3.2.2. Negative Phase
As in the positive phase, the average thermal field was 15 °C, not exceeding 17 °C, and the maximum values in the region were located over the Mexican territory. The relative humidity was between 52% and 60%, with an average value of 57%, and the maximum values were located over the Gulf of Mexico. The zonal wind component in the upper levels of the troposphere was mostly positive, with maximum values of 9 m/s, a mean value of 0.3 m/s at 300 hPa, and at 200 hPa the mean value increased to 1 m/s. The vorticity was negative and the divergence was positive. The mean value of vorticity at 700 hPa was −1.1 × 10⁻⁵ s−1 and at 500 hPa the mean value was −1.2 × 10⁻⁵ s−1. The maximum values at both of these levels were located in the Gulf of Mexico. The average divergence at 700 hPa was 1.6 × 10⁻⁷ s−1, increasing at 500 hPa to 3.2 × 10⁻⁵ s−1, and the maximum value cells were over the southern United States.
4. Conclusions
This study has achieved the proposed objectives and has led to the following conclusions:
The most significant synoptic pattern that is associated with cold fronts generating heavy rainfall in the period from 1980–1981 through to 2016–2017 is related to a frontal trough at a high altitude, with short-wave amplitude, followed by the pattern of a cold front generated by a long-wave trough.
The NAO teleconnection event in the period that was studied here showed a preference to be negative.
The mean values of temperature in both phases of the NAO were 15 °C and the mean values of wind and vorticity behaved inversely proportional to the phases of the NAO. However, the divergence was positive in the positive phase and was negative in the negative phase of the oscillation.
Author Contributions
Conceptualization, Y.G.-P. and E.R.-A.; methodology, Y.G.-P.; software, E.R.-A.; validation, Y.G.-P., E.R.-A. and A.J.-Á.; formal analysis, Y.G.-P.; investigation, Y.G.-P., E.R.-A.; resources, Y.G.-P.; data curation, Y.G.-P., A.J.-Á.; writing—original draft preparation, Y.G.-P.; writing—review and editing, Y.G.-P., E.R.-A. and A.J.-Á.; visualization, E.R.-A.; supervision, A.J.-Á. All authors have read and agreed to the published version of the manuscript.
Funding
This research received no external funding.
Institutional Review Board Statement
Not applicable.
Informed Consent Statement
Not applicable
Data Availability Statement
Conflicts of Interest
The authors declare no conflict of interest.
References
- Rodríguez-Acosta, E. Patrones Sinópticos Asociados a los Frentes Fríos que Generan Lluvias Intensas en Cuba. Ph.D. Thesis, University of Havana, Havana, Cuba, 2019. [Google Scholar]
- Hurell, J.W. Decadal trends in the North Atlantic Oscillation: Regional temperatures and precipitation. Science 1995, 269, 676–679. [Google Scholar] [CrossRef] [PubMed]
- Fonseca, C. Patrones Sinópticos Asociados a los Frentes Fríos que Generan Lluvias Intensas en Cuba. Ph.D. Thesis, Univesrity of Havana, Havana, Cuba, 2008. [Google Scholar]
- Acosta, H. La Oscilación del Atlántico Norte y el Comportamiento de la Temporada Invernal en la Región Occidental de Cuba. Ph.D. Thesis, University of Havana, Havana, Cuba, 2014. [Google Scholar]
| Publisher’s Note: MDPI stays neutral with regard to jurisdictional claims in published maps and institutional affiliations. |
© 2022 by the authors. Licensee MDPI, Basel, Switzerland. This article is an open access article distributed under the terms and conditions of the Creative Commons Attribution (CC BY) license (https://creativecommons.org/licenses/by/4.0/).


