Proceeding Paper

Projecting the Potential Evapotranspiration of Egypt Using a High-Resolution Regional Climate Model (RegCM4) †

Egyptian Meteorological Authority, Qobry EL-Kobba, Cairo P.O. Box 11784, Egypt
*
Author to whom correspondence should be addressed.
Presented at 5th International Electronic Conference on Atmospheric Sciences, 16–31 July 2022; Available online: https://ecas2022.sciforum.net/.
Environ. Sci. Proc. 2022, 19(1), 43; https://doi.org/10.3390/ecas2022-12841
Published: 22 July 2022
(This article belongs to the Proceedings of The 5th International Electronic Conference on Atmospheric Sciences)

Abstract

:
A regional climate model (RegCM4) was used to project the potential evapotranspiration (PET) of Egypt under two future scenarios: RCP45 and RCP85. Spatially, the RegCM4 has a higher PET under the RCP85 than the RCP45. Among all locations, the RegCM4 was able to capture the monthly variability in PET with respect to the Climate Research Unit (CRU). In addition, the simulated PET was notably improved when a linear regression model (LRM) was used. Further, future PET projects a strong increased trend under the RCP85; meanwhile, future PET projects a weak increased trend under the RCP45.

1. Introduction

North Africa is vulnerable to climate change impacts, as general circulation models (GCMs) participated in the fifth phase of the coupled model intercomparison project (CMIP5) show a gradual increase in annual temperatures in Northern Africa, higher than the average [1]. Further, potential evapotranspiration (PET) demand will increase with a severe stress on water resources in the region. PET is an important component in the global terrestrial hydrology cycle and it is used for calculating the water needs of different crops and assessing important hydrological impacts, such as meteorological droughts, water balance analysis, and designing and operating irrigation projects.
The Penman Monteith method (PM) is a standard procedure for calculating PET and to validate other PET methods [2]. PET (or λE as a source of latent heat) is computed as [3]:
λ E = Δ s   R n   G +   ρ a   c p VPD r a Δ s +   γ 1 + r s r a
λE (latent heat of vaporization), Rn (surface net radiation), and G (heat storage in soil) expressed in W m−2, VPD is the vapor pressure deficit (kPa), Δs is the slope of saturation vapor pressure curve (kPa °C−1) at air temperature, ρ is the density of air (Kg m−3), cp in J Kg−1 °C−1, γ in kPa °C−1, ra is the aerodynamic resistant (s m−1), and rs is the surface resistance to vapor transport (s m−1). However, the PM method shows an important weak point because it requires specific thresholds and unlimited supply of moisture. Such a condition does not exist under extreme dry conditions [4].
Refs. [5,6] reported that the Hargreaves–Samani method (HS) can be recommended after the PM approach to compute PET. In fact, the HS method has been widely used in many studies [7]. In data-scarce regions, the HS can be used to compute PET with reasonable accuracy [8,9]. According to the HS method, PET is calculated as:
PET HS = 0.0135 × R s × T mean   + 17.8
Tmean is the 2m mean air temperature (in °C). Rs is expressed in units of mm day−1 to show how much energy is used to evaporate water [2]. Ref. [5] showed that inclusion of wind speed and relative humidity did not add much to the calculated PET. The HS method is initially proposed to work under different climate conditions. For instance, Ref. [10] found that the standardized HS and the variable infiltration capacity (VIC-3L) models show a reasonable accuracy for estimating the regional and grid-scale variability in ET in data-scarce regions when field scale measured data are not available.
Correcting the RCMs in both historical and future periods (with respect to the CRU product using the LRM approach) was not conducted in Egypt until the present day. To address such a topic, the current study aims to:
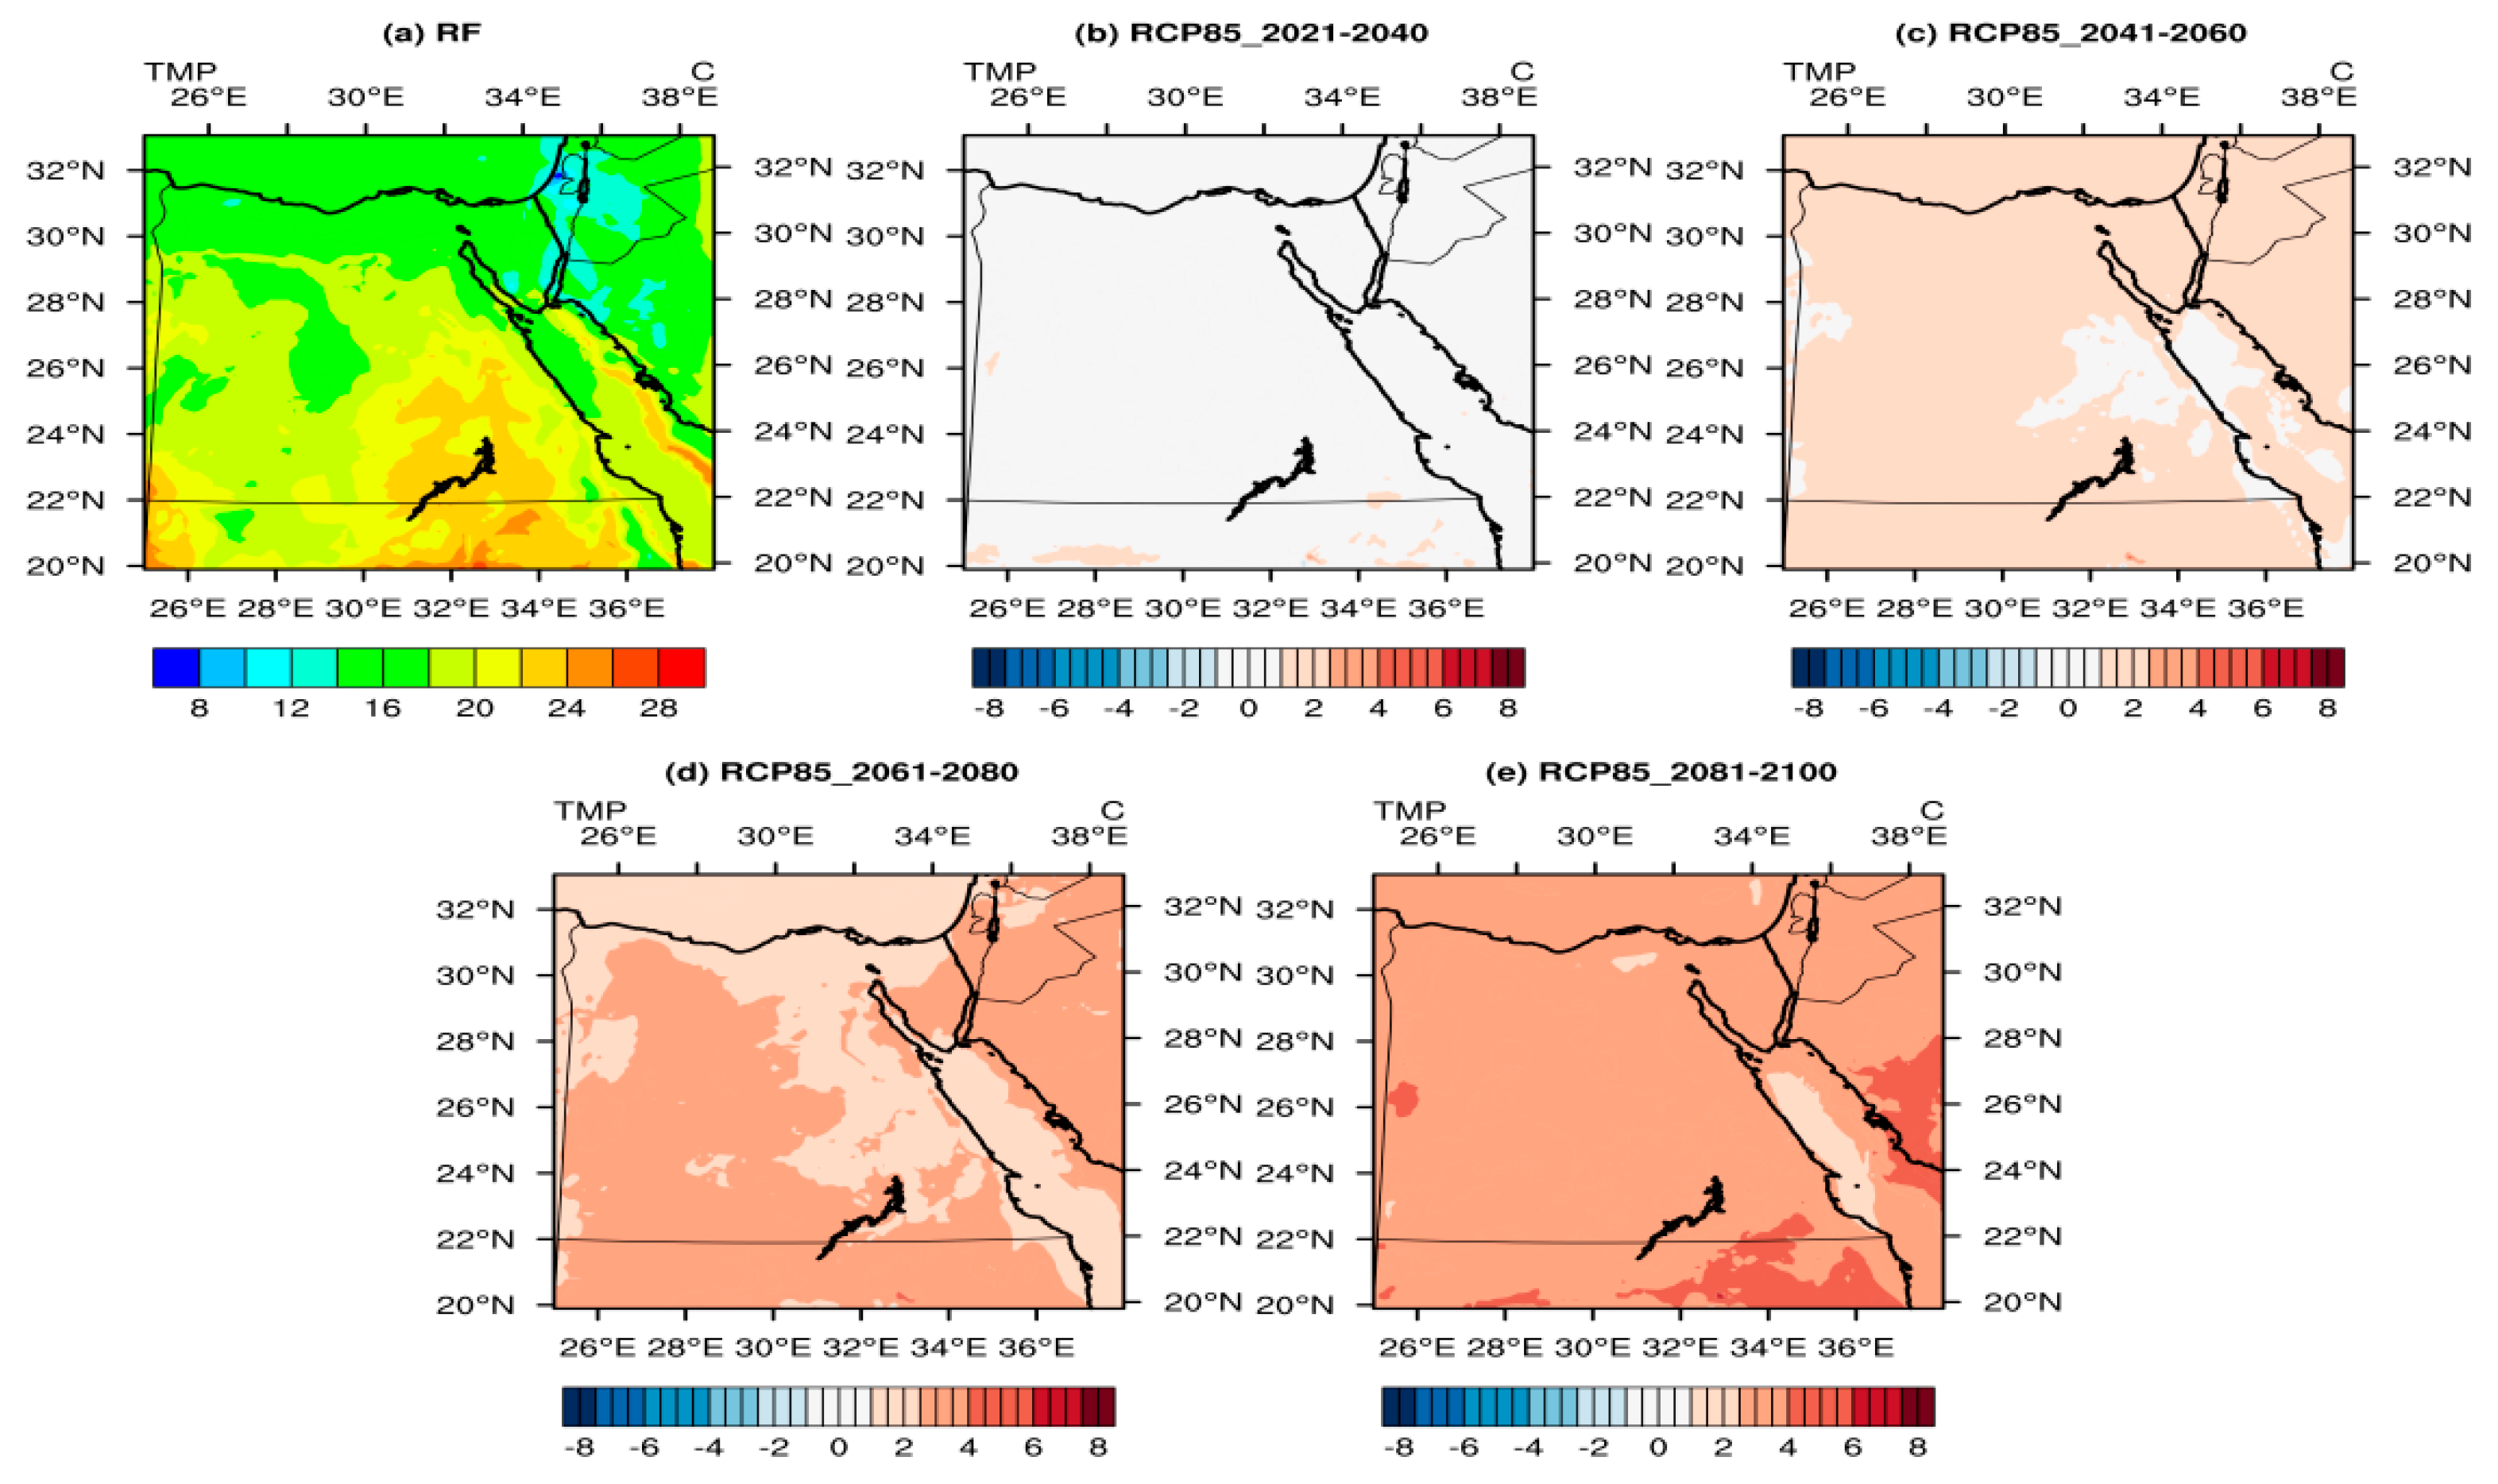
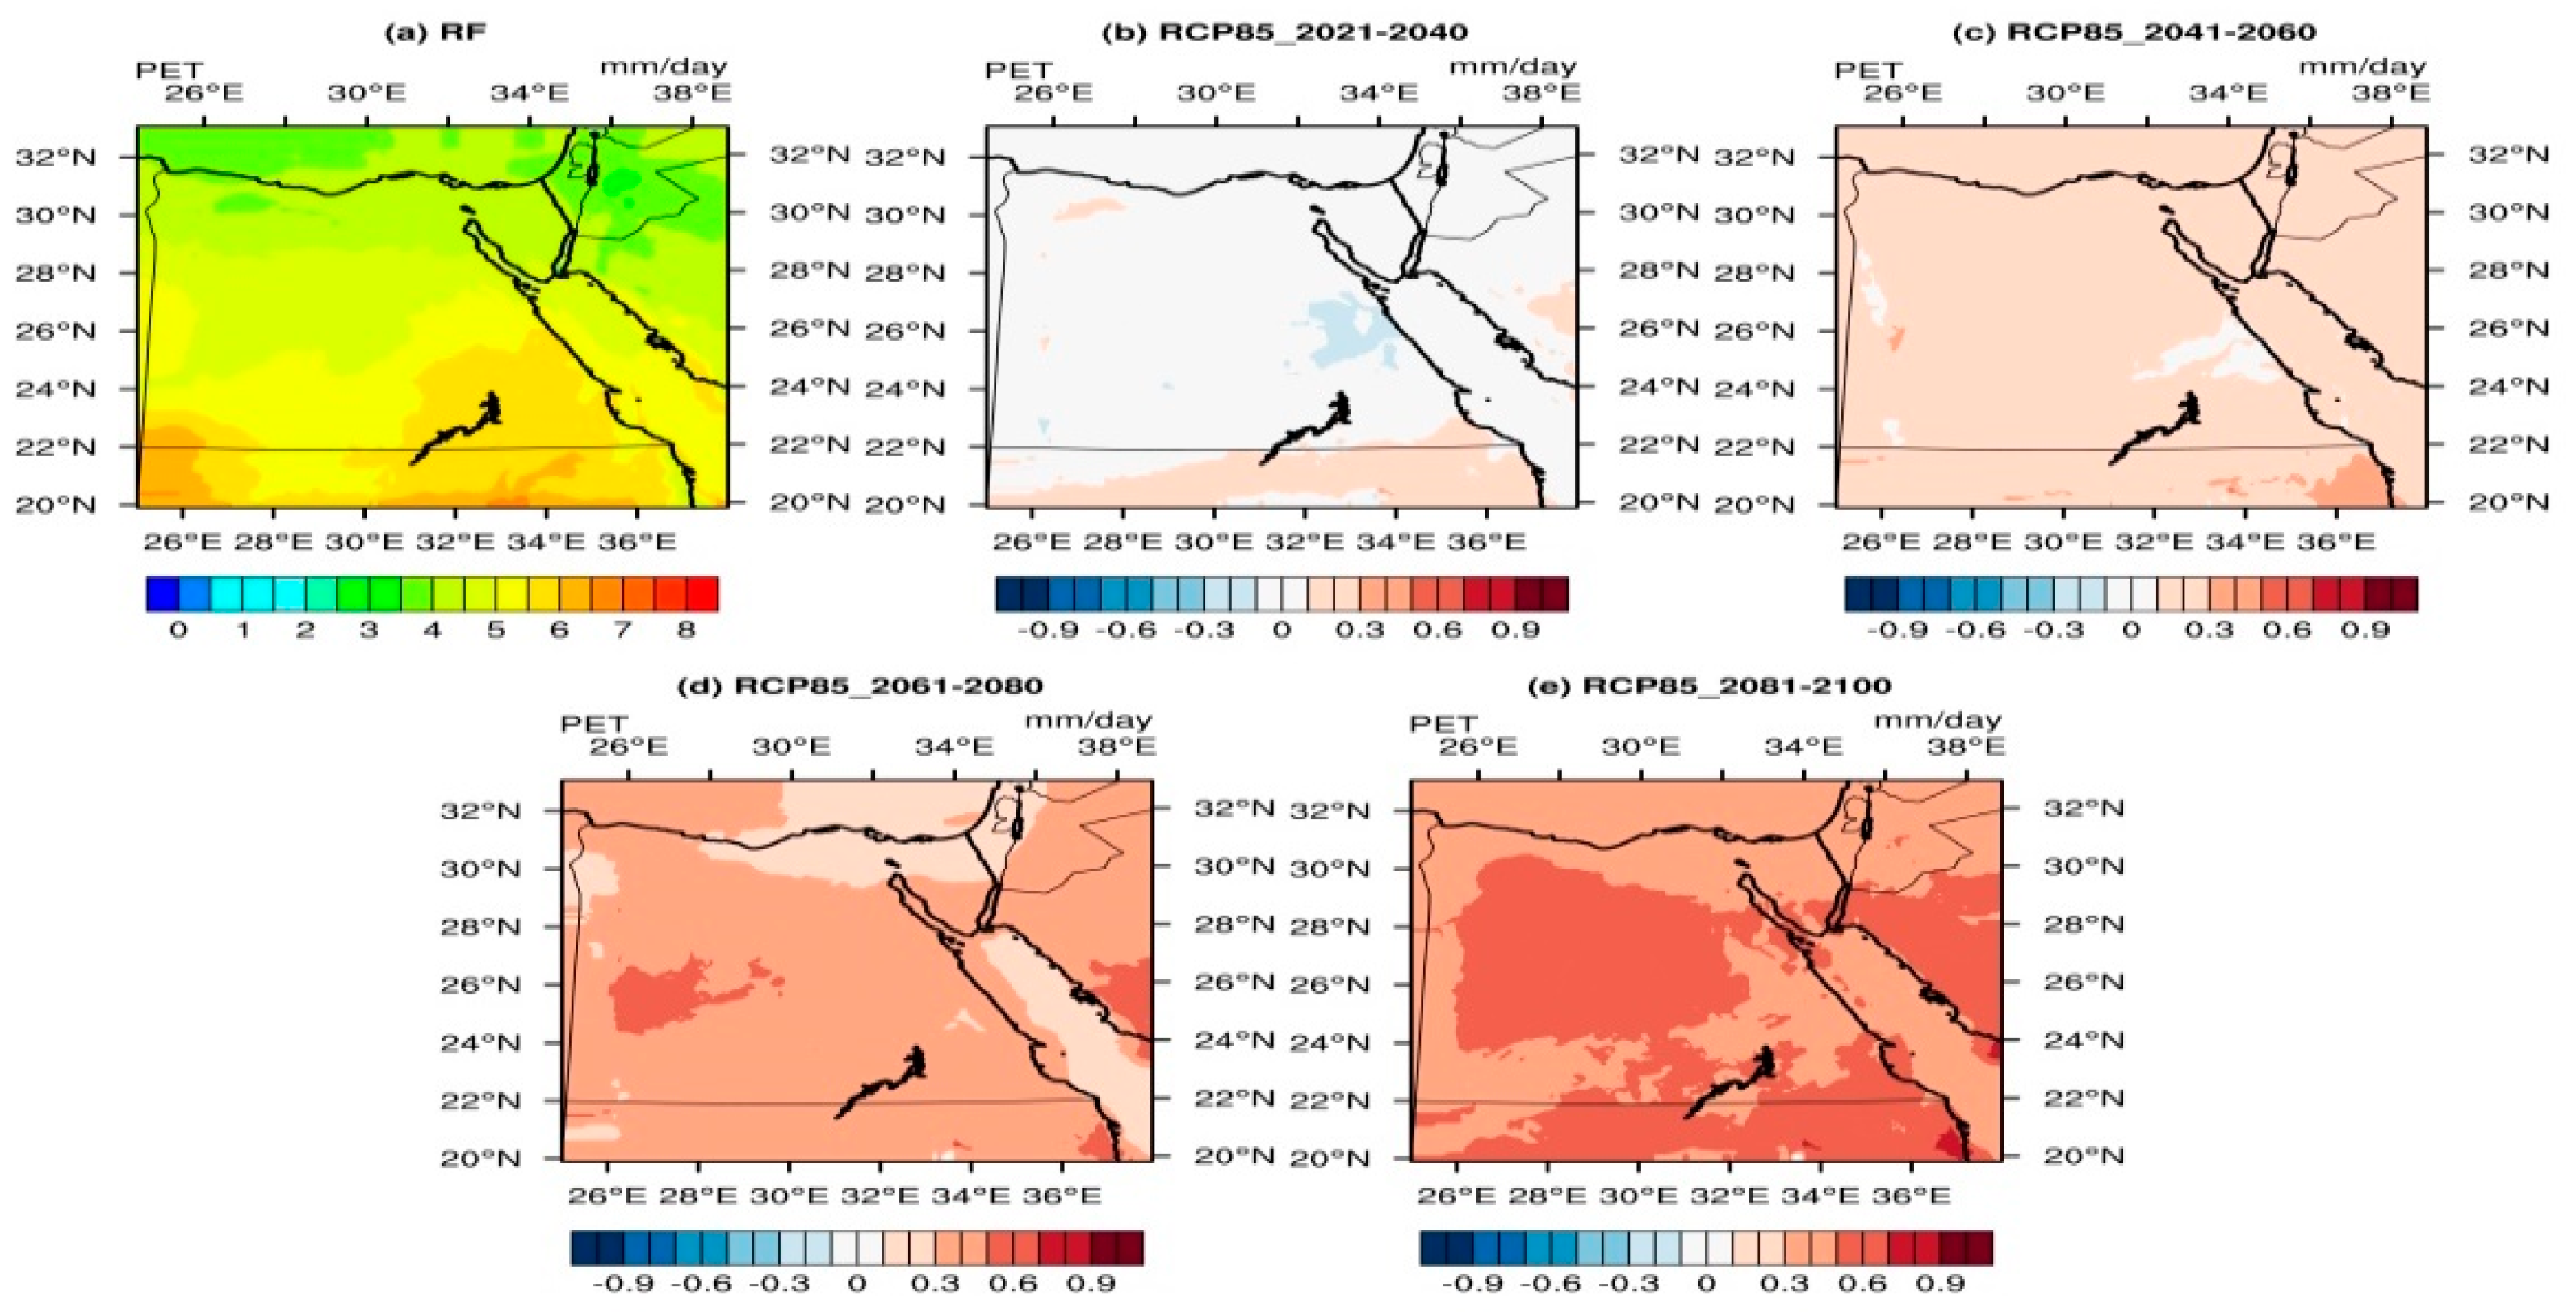
  • Examine the spatial pattern of the simulated PET in a historical period (1986–2005) as well as the PET anomaly in the time segments 2021–2040, 2041–2060, 2061–2080, and 2081–2100 under the two future scenarios: RCP45 and RCP85.
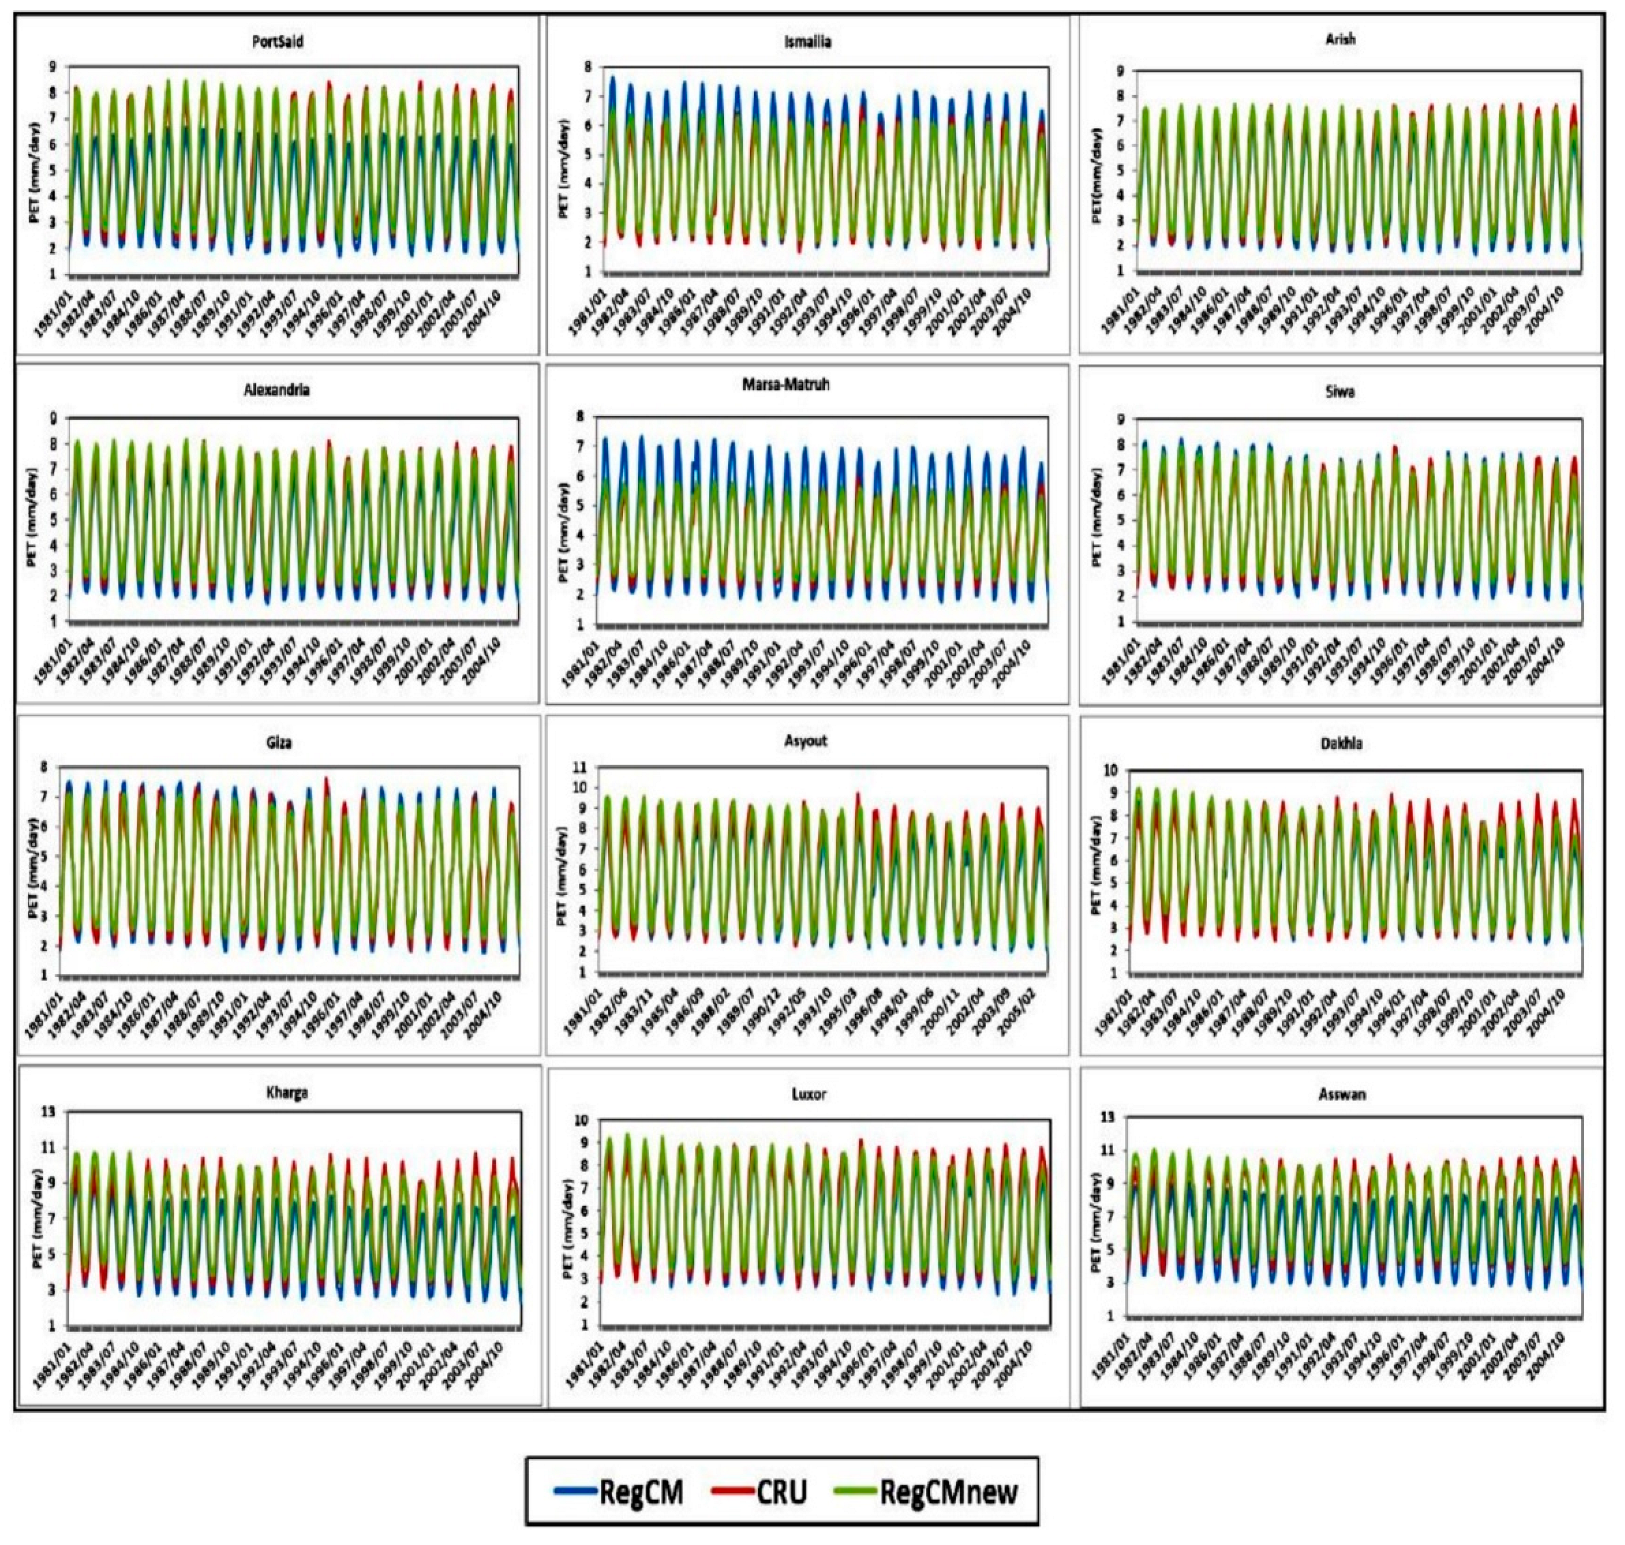
  • Bias correct the simulated PET with respect to the CRU product in the period (1981–2005) for twelve locations (indicated in Table 1).
  • Correct the projected PET of the two future scenarios using the LRM approach for the twelve locations.
Section 2 describes the study area and experiment design; Section 3 shows the results of the study. Section 4 provides the discussion and conclusion.

2. Materials and Methods
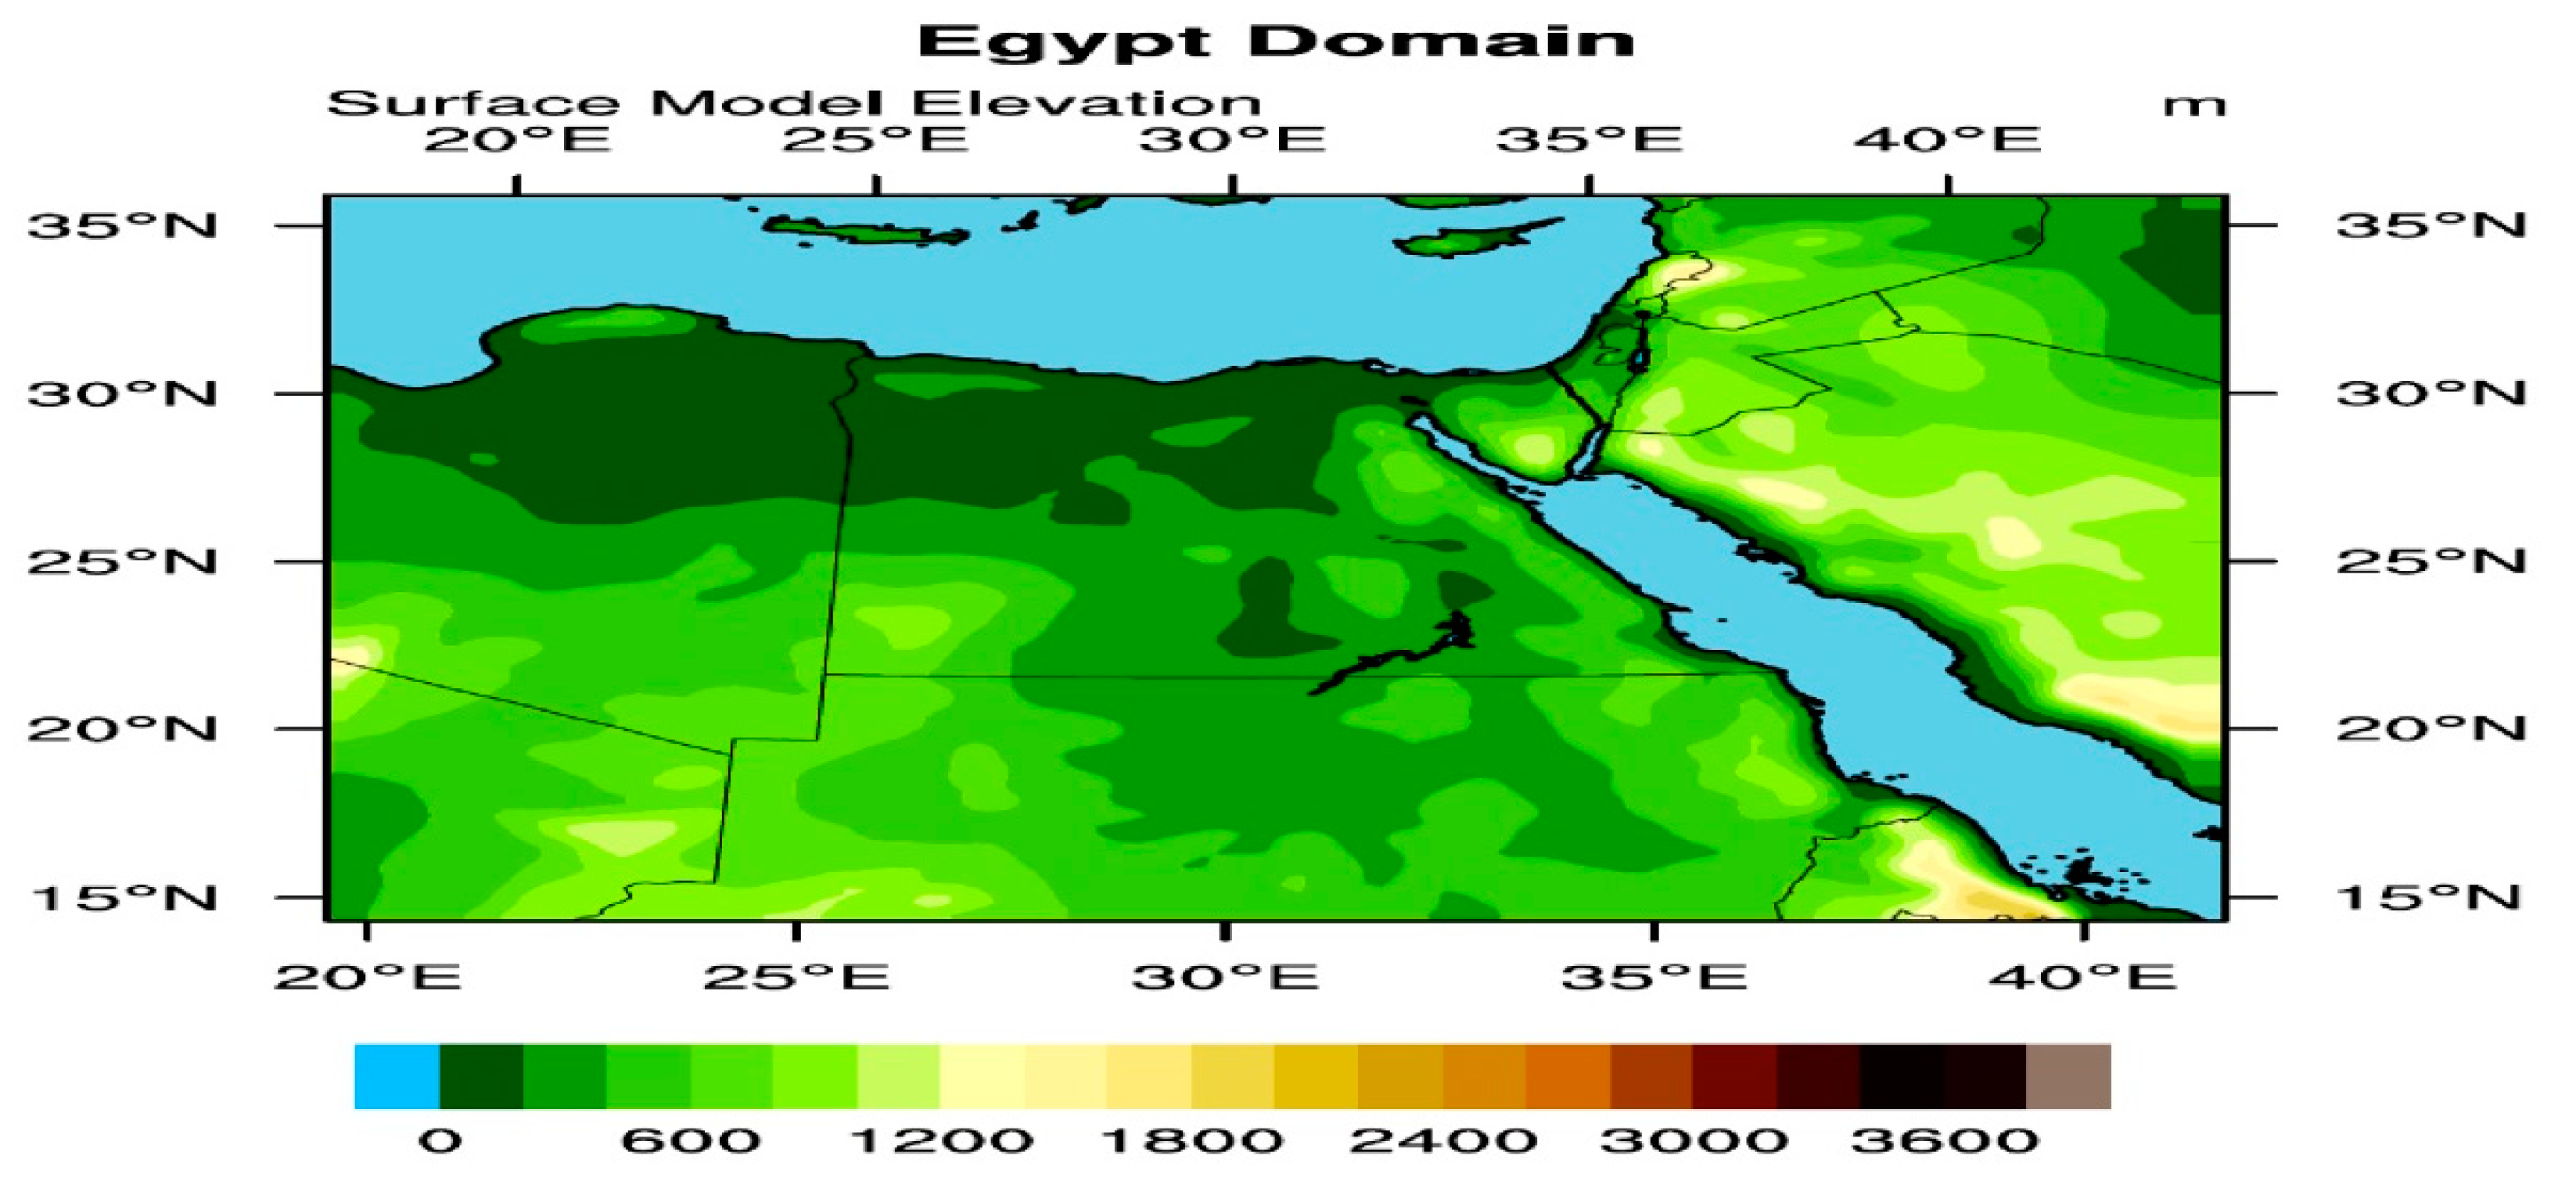
2.1. Study Area

Egypt lies in the north-eastern corner of the African continent and has a total area of about one million km2. Climatologically, Egypt is characterized by hot dry summers and mild winters. Summer temperatures are extremely high, reaching 38 °C to 43 °C with extremes of 49 °C in the southern and western deserts. The northern areas on the Mediterranean coast are much cooler, with 32 °C as a maximum. Annual rainfall ranges between a maximum of about 200 mm in the northern coastal region to a minimum of nearly zero in the south, with an annual average of 51 mm.

2.2. Model Description and Experiment Design

In this study, the Abdus Salam International Centre for Theoretical Physics (ICTP) regional climate model version 4.7 (RegCM-4.7.0, [11]; hereafter RegCM) was used. The RegCM was downscaled by Earth System Model of the Max Planck Institute (MPI-ESM; [12]) of medium resolution (MR; 96 × 192 grid points i.e., 1.875 × 1.875 horizontal degree resolution). This study comprises two domains: (1) the coarse domain which covers the Middle East/North Africa (MENA) region with 50 km horizontal grid spacing, 235 grid points in the zonal direction and 121 grid points in the meridional direction, centered at latitude 19.5° and longitude 24.5°; (2) the nested domain which covers Egypt and surrounding regions with 20 km horizontal grid spacing, 121 grid points in both zonal and meridional directions, centered at latitude 25.5° and longitude 30.5°. For brevity, only the domain dimension and topography height of Egypt is presented in Figure 1. The model simulations were integrated over the historical and future periods 1981–2005 and 2006–2100 for both the moderate future scenario RCP45 and extreme future scenario RCP85.

2.3. Validation Data

Measurement of PET in Egypt is important for monitoring agricultural activity, assessing the water needs and drought monitoring over interval of time scales (ranging from daily to seasonal and annual). However, availability of the observed PET is not feasible for a long time (using the PM method). Instead, the Climate Research Unit (CRU; version 4.05; [13]) dataset was used as the ground truth of observation. CRU is a component of the University of East Anglia. CRU product is integrated over the period 1901–2020 and it includes various variables: cloud cover, diurnal temperature range, frost day frequency, PET, precipitation, 2m mean temperature, maximum and minimum air temperature, as well as vapor pressure. CRU product is available in 0.5 × 0.5 horizontal degree resolution. Further, CRU is considered as the best available reference PET data and so used as the ground truth of observation for global assessment of PET [14]. The current study used the CRU gridded product to correct the simulated PET in both the historical period and the two future scenarios (RCP45 and RCP85) for twelve locations (indicated in Table 1).

3. Results

3.1. Spatial Pattern of 2m Mean Air Temperature and PET under RCP85 Future Scenario

For brevity in analysis, only the RCP85 scenairo is considered. Figure 2 shows the future projected changes in the 2m mean air temperature (hereafter TMP) over Egypt during the period 2021–2100 of the future scenario RCP85 compared to the reference period 1986–2005. From Figure 2, it can be observed that the TMP shows a small increase (0.5 to 1 °C) in the time segments 2021–2040 and 2041–2060 (Figure 2b,c). However during the time segments 2061–2080 and 2081–2100; the TMP shows a high increase (ranging from 3 to 5 °C) overall in Egypt, especially during the time segment 2081–2100 (Figure 2d,e). Under the RCP85 scenario, the PET noted changes are ±0.1 mm day−1 (Figure 3b), while in the time segment 2041–2060, the RegCM shows an increase of the simulated PET (by 0.1 to 0.3 mm day−1) overall in Egypt (Figure 3c). In accordance with the noted changes in TMP, the RegCM shows a higher increase in the simulated PET (by 0.3 to 0.6 mm day−1) than the one observed in the time segments 2021–2040 and 2041–2060 (Figure 3d). Lastly in the time segment 2081–2100, the RegCM exhibits the highest increase in the simulated PET over the majority of Egypt (by 0.5 to 0.9 mm day−1; Figure 3e).

3.2. Correcting the PET in the Historical Period and Future Scenarios

Performance of the RegCM model was evaluated with respect to the CRU gridded product for twelve locations to represent different climate zones in Egypt: Alexandria, Marsa matruh and Siwa representing the north zone; Ismailia, Port-Said, and Arish representing the eastern zone; Giza and Asyout representing Lower Egypt zone; Dakhla and Kharga representing the Middle Egypt zone and 4-Luxor and Asswan representing the Upper Egypt zone (see Table 1). The LRM approach ([15]) was applied by plotting a scatter plot between the RegCM model output and CRU observational-based product in the historical period 1981–2005. The RegCM performance was quantified (before and after applying the LRM) in terms of the statistical metrics: mean bias (MB; calculated as CRU minus RegCM) and standard deviation ratio (SD; which is defined as the ratio between standard deviation of the RegCM4 to standard deviation of the CRU). Figure 4 shows the monthly time series of the PET in comparison with the CRU in the historical period before and after applying the LRM method. In general, the RegCM is able to capture the monthly variability with respect to the CRU product; however, the model underestimates/overestimates the monthly PET depending on the study location. To project the relative future PET changes for the twelve locations, the following steps were conducted:
  • The mean PET of the corrected RegCM output (in the historical period) is calculated.
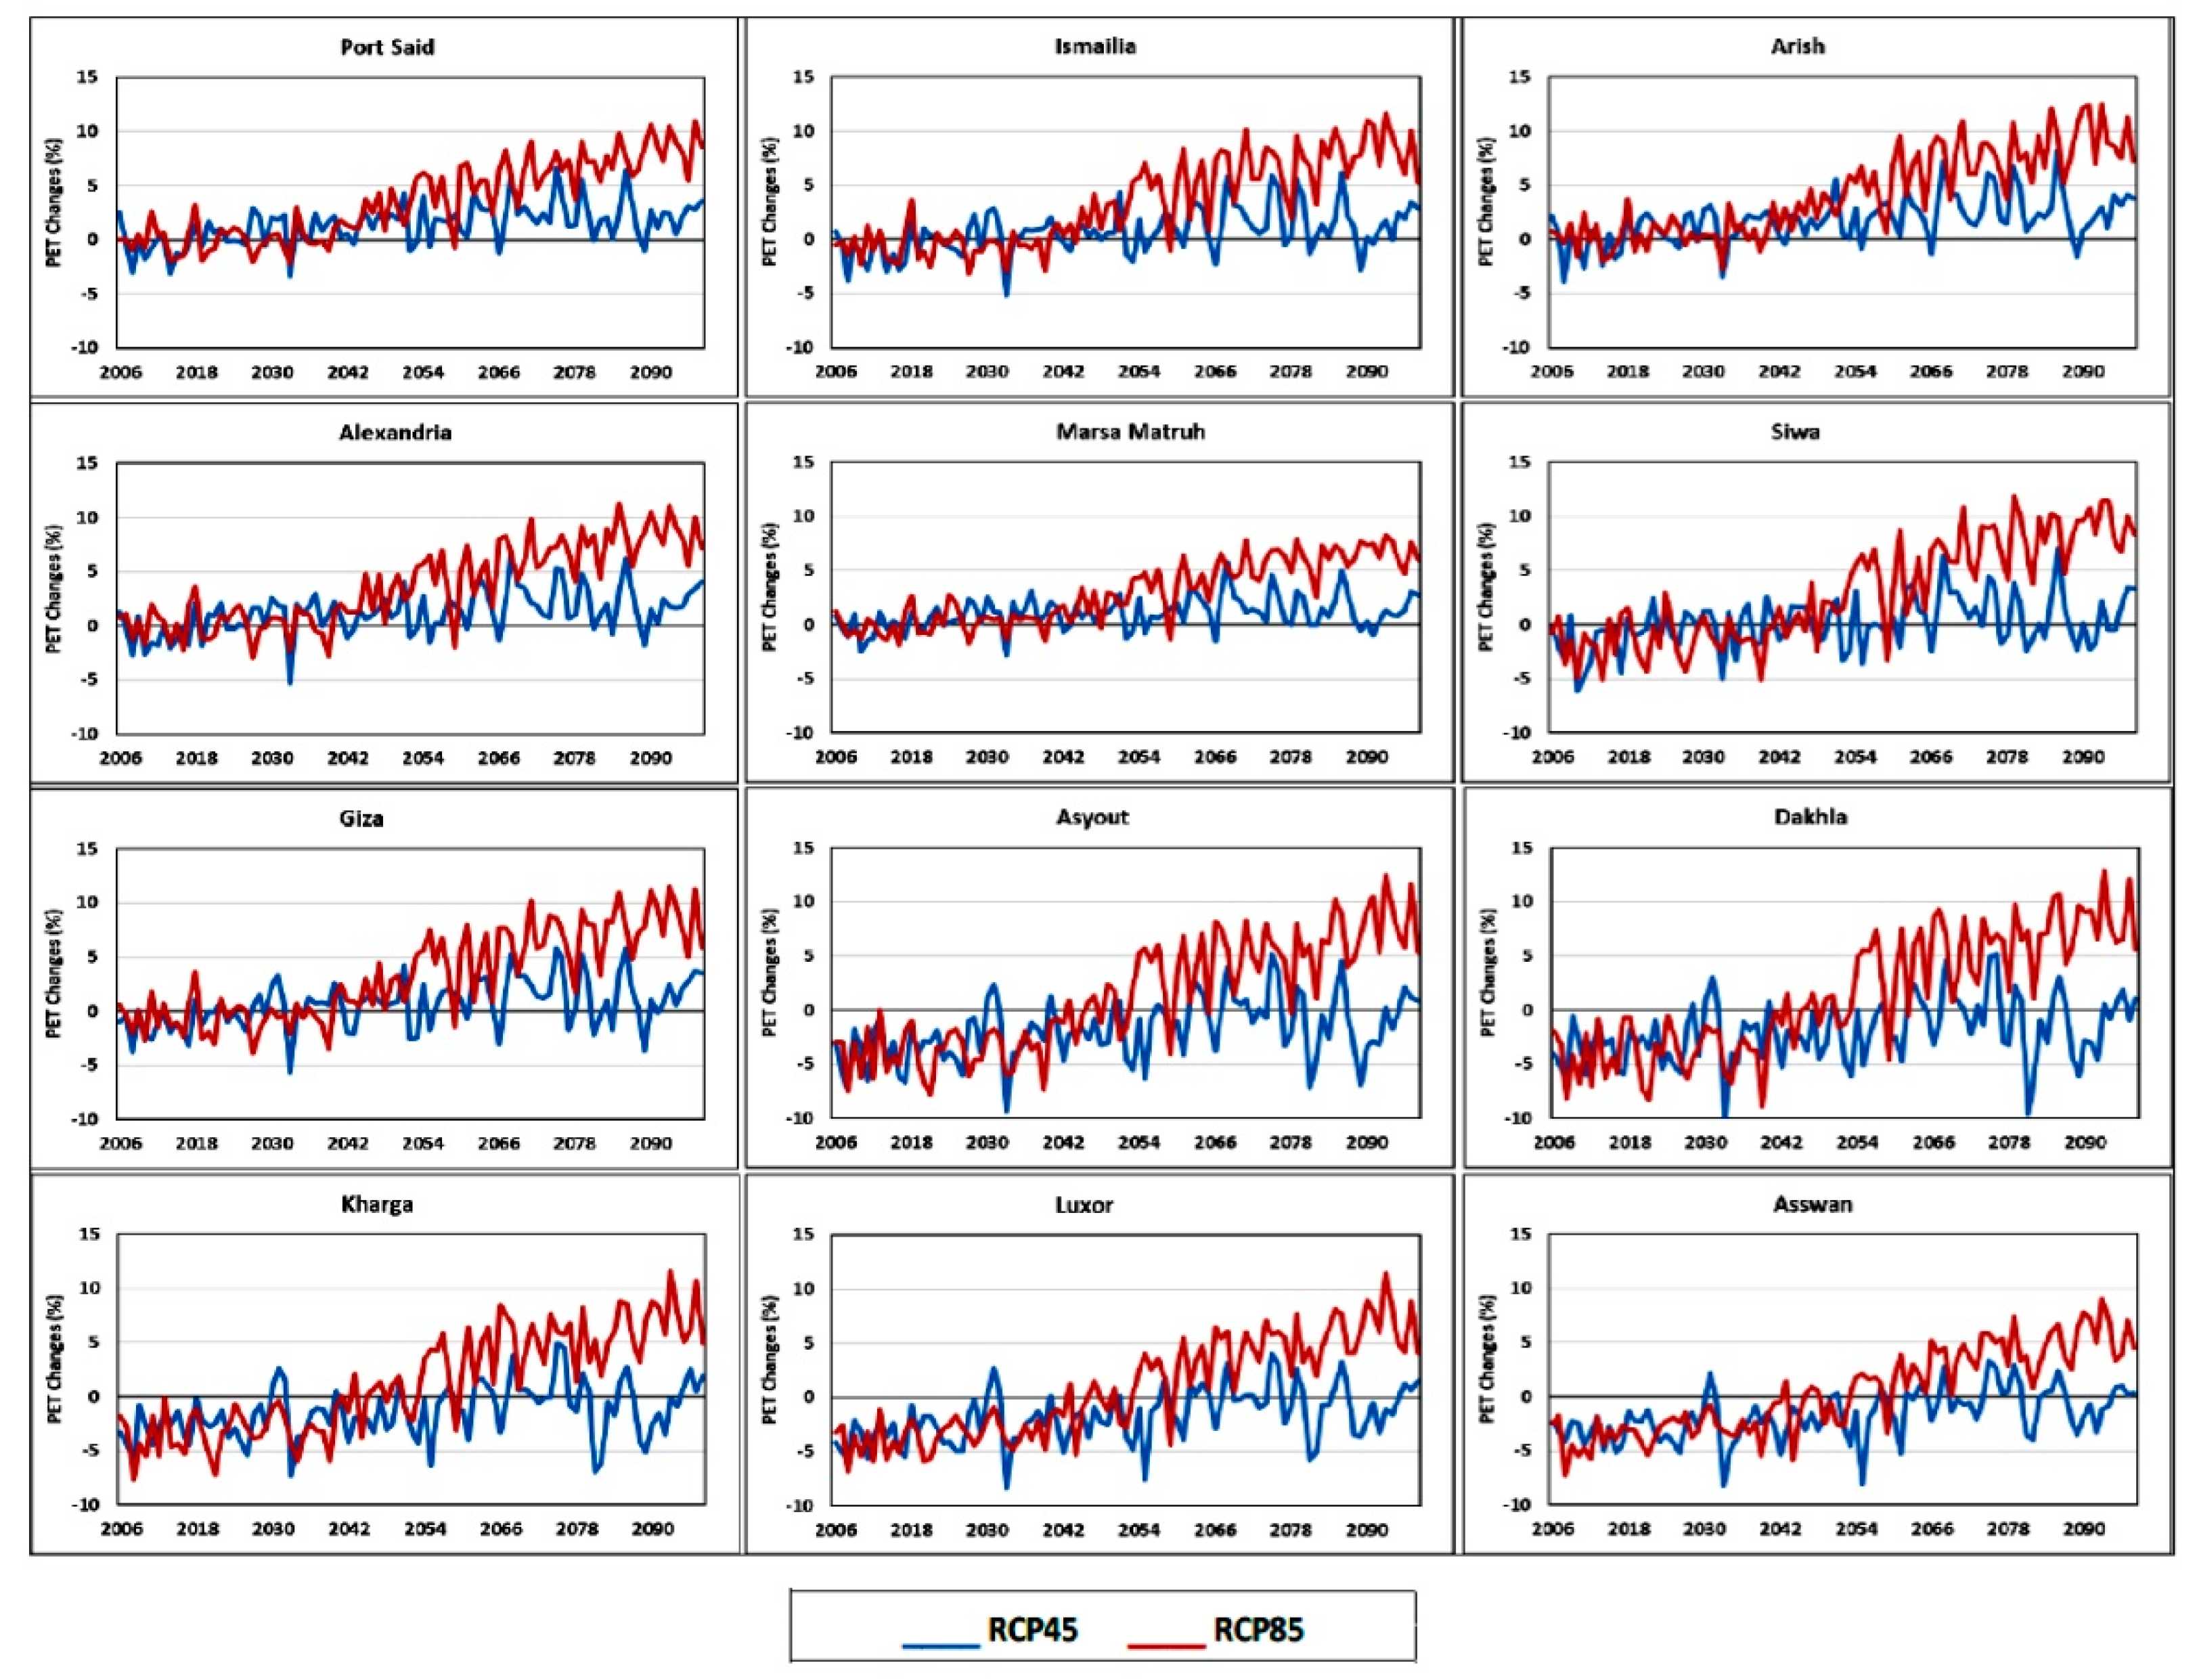
  • The LRM is used to correct the projected PET of the two scenarios: RCP45 and RCP85.
  • The relative PET changes are calculated following [16]:
P E T r e l a t i v e   c h a n g e s = P E T f u t u r e   a n n u a l P E T p r e s e n t   a n n u a l P E T p r e s e n t   a n n u a l
Figure 5 shows the corrected relative future projection of PET under the RCP45 and RCP85 scenarios of the twelve locations. From Figure 5, it can be noticed that the relative changes in PET range from −10% to +12%. Further, the two scenarios are in agreement in the period of 2006–2054; after that, the divergence between the two scenarios becomes evident. In addition, the future PET projects a strong increased trend under the RCP85; meanwhile the future PET projects a weak increased trend under the RCP45.

4. Discussion and Conclusions

In the present study, the RegCM was downscaled by the MPI-ESM-MR over the MENA and then nested over Egypt for the reference period 1980–2005 and under the two future scenarios: RCP45 and RCP85. After that, the RegCM model performance was evaluated with respect to the CRU. The results showed that the projected PET showed a gradual increase from the North zone to Upper Egypt zone; such a finding is consistent with the results reported in [17]. Moreover, the PET was subjected to a moderate increase under the RCP45 scenario and a high increase under the RCP85 scenario. In addition, the RegCM4 model was able to capture the monthly variability with respect to the CRU observational-based product; however, the RegCM over/underestimated the PET depending on location under study.
Furthermore, the RegCM showed an improved performance when the LRM was applied at the location of interest. It is important to highlight that this work provides a first insight for projecting PET in Egypt using a high-resolution regional climate model and bias-correcting the PET in both the historical and two future scenarios using the LRM approach. The current study relies on downscaling one GCM from the pool of the Fifth phase of the Coupled Model Intercomparison Project (CMIP5; [18]). Therefore, future work will consider the following points: (1) using multi-GCMs (CMIP5/CMIP6; [18,19,20]) and their ensemble to further examine the sensitivity of the RegCM to atmospheric forcing and, therefore, the simulated Tmean, Rs and, hence, PET, (2) examining the potential role of aerosols on the simulated Tmean, Rs and eventually PET and (3) evaluating the RegCM4 output with high-resolution gridded PET product (e.g., [21]) along with the CRU (with 0.5°) to account for the uncertainty in the observational-based dataset.

Author Contributions

Conceptualization, S.A.A.; methodology, Z.S.; software, S.A.A.; validation, S.A.A. and Z.S.; formal analysis, S.A.A.; investigation, S.A.A. and Z.S.; resources, W.K. and A.S.Z.; data curation, S.A.A.; writing—original draft preparation, S.A.A.; writing—review and editing, S.A.A. and Z.S.; visualization, S.A.A.; supervision, W.K. and A.S.Z.; project administration, W.K. and A.S.Z. All authors have read and agreed to the published version of the manuscript.

Funding

This research received no external funding.

Institutional Review Board Statement

Not applicable.

Informed Consent Statement

Not applicable.

Data Availability Statement

Not applicable.

Acknowledgments

This work was conducted as a part of the Interactive Map project of the Egyptian Meteorological Authority (EMA). EMA is acknowledged for providing the computational power for conducting the model simulations. The MPI-ESM-MR dataset was retrieved from http://www.clima-dods.ictp.it/RegCM4 (accessed on 15 November 2019). Climate Research Unit (CRU) of the University of East Anglia was acknowledged for providing potential evapotranspiration product through the web-link: https://crudata.uea.ac.uk/cru/data/hrg/cru_ts_4.05/cruts.2103051243.v4.05/pet (accessed on 5 September 2022).

Conflicts of Interest

The authors declare no conflict of interest.

References

  1. Stocker, T.F.; Qin, D.; Plattner, G.-K.; Tignor, M.; Allen, S.K.; Boschung, J.; Nauels, A.; Xia, Y.; Bex, V.; Midgley, P.M. (Eds.) IPCC 2013: Climate Change 2013: The Physical Science Basis. Contribution of Working Group I to the Fifth Assessment Report of the Intergovernmental Panel on Climate Change; Cambridge University Press: Cambridge, UK; New York, NY, USA, 2013; 1535p. [Google Scholar]
  2. Allen, G.R.; Pereira, S.L.; Raes, D.; Smith, M. Crop Evapotranspiration: Guidelines for Computing Crop Water Requirements; Report 56; Food and Agricultural Organization of the United Nations (FAO): Rome, Italy, 1998; 300p. [Google Scholar]
  3. Kjelgaard, J.F.; Stokes, C.O. Evaluating surface resistance for estimating corn and potato evapotranspiration with the Penman monteith model. Trans. ASABE 2001, 44, 797–805. [Google Scholar] [CrossRef]
  4. Brutsaert, W.; Parlange, M.B. Hydrologic cycle explains the evaporation paradox. Nature 1998, 396, 30. [Google Scholar] [CrossRef]
  5. Hargreaves, G.L.; Samani, Z.A. Reference crop evapotranspiration from temperature. Appl. Eng. Agric. 1985, 1, 96–99. [Google Scholar] [CrossRef]
  6. Hargreaves, G.L.; Allen, R.G. History and evaluation of Hargreaves evapotranspiration equation. J. Irrigat. Drain. Eng. 2003, 129, 53–63. [Google Scholar] [CrossRef]
  7. Almorox, J.; Quej, V.H.; Martí, P. Global performance ranking of temperature-based approaches for evapotranspiration estimation considering Koppen climate classes. J. Hydrol. 2015, 528, 514–522. [Google Scholar] [CrossRef]
  8. Traore, S.; Wang, Y.M.; Kerh, T. Artificial neural network for modeling reference evapotranspiration complex process in Sudano–Sahelian zone. Agric. Water Manag. 2010, 97, 707–714. [Google Scholar] [CrossRef]
  9. Traore, S.; Guven, A. New algebraic formulations of evapotranspiration extracted from gene expression programming in the tropical seasonally dry regions of West Africa. Irrig. Sci. 2013, 31, 1–10. [Google Scholar] [CrossRef]
  10. Srivastava, A.; Sahoo, B.; Raghuwanshi, N.S.; Chatterjee, C. Modelling the dynamics of evapotranspiration using Variable Infiltration Capacity model and regionally calibrated Hargreaves approach. Irrig. Sci. 2018, 36, 289–300. [Google Scholar] [CrossRef]
  11. Giorgi, F.; Coppola, E.; Solmon, F.; Mariotti, L.; Sylla, M.B.; Bi, X.; Elguindi, N.; Diro, G.T.; Nair, V.; Giuliani, G.; et al. RegCM4: Model description and preliminary tests over multiple CORDEX domains. Clim. Res. 2012, 52, 7–29. [Google Scholar] [CrossRef]
  12. Stevens, B.; Giorgetta, M.; Esch, M.; Mauritsen, T.; Crueger, T.; Rast, S.; Salzmann, M.; Schmidt, H.; Bader, J.; Block, K.; et al. Atmospheric component of the MPI-M Earth System Model: ECHAM6. J. Adv. Model. Earth Syst. 2013, 5, 146–172. [Google Scholar] [CrossRef]
  13. Harris, I.; Osborn, T.J.; Jones, P.; Lister, D. Version 4 of the CRU TS monthly high-resolution gridded multivariate climate dataset. Sci. Data 2020, 7, 109. [Google Scholar] [CrossRef] [PubMed]
  14. Weiland, F.C.S.; Tisseuil, C.; Dürr, H.H.; Vrac, M.; van Beek, L.P.H. Selecting the optimal method to calculate daily global reference potential evaporation from CFSR reanalysis data for application in a hydrological model study. Hydrol. Earth Syst. Sci. 2012, 16, 983–1000. [Google Scholar] [CrossRef]
  15. Shiri, J.; Nazemi, A.H.; Sadraddini, A.A.; Landeras, G.; Kisi, O.; Fard, A.F.; Marti, P. Comparison of heuristic and empirical approaches for estimating reference evapotranspiration from limited inputs in Iran. Comput. Electron. Agric. 2014, 108, 230–241. [Google Scholar] [CrossRef]
  16. Nistor, M.M.; Mîndrescu, M.; Petrea, D.; Nicula, A.S.; Rai, P.K.; Benzaghta, M.A.; Dezsi, S.; Hognogi, G.; Porumb-Ghiurco, C.G. Climate change impact on crop evapotranspiration in Turkey during the 21st Century. Meteorol. Appl. 2018, 26, 442–453. [Google Scholar] [CrossRef]
  17. Terink, W.; Immerzeel, W.W.; Droogers, P. Climate change projections of precipitation and reference evapotranspiration for the Middle East and Northern Africa until 2050. Int. J. Clim. 2013, 33, 3055–3072. [Google Scholar] [CrossRef]
  18. Taylor, K.E.; Stouffer, R.J.; Meehl, G.A. An Overview of CMIP5 and the Experiment Design. Bull. Am. Meteorol. Soc. 2012, 93, 485–498. [Google Scholar] [CrossRef]
  19. Li, S.; Lü, S.; Gaoa, Y.; Ao, Y. The change of climate and terrestrial carbon cycle over Tibetan Plateau in CMIP5 models. Int. J. Climatol. 2015, 35, 4359–4369. [Google Scholar] [CrossRef]
  20. Eyring, V.; Bony, S.; Meehl, G.A.; Senior, C.A.; Stevens, B.; Stouffer, R.J.; Taylor, K.E. Overview of the Coupled Model Intercomparison Project Phase 6 (CMIP6) experimental design and organization. Geosci. Model Dev. 2016, 9, 1937–1958. [Google Scholar] [CrossRef]
  21. Singer, M.; Asfaw, D.; Rosolem, R.; Cuthbert, M.O.; Miralles, D.G.; MacLeod, D.; Michaelides, K. Hourly Potential Evapotranspiration (hPET) at 0.1degs Grid Resolution for the Global Land Surface from 1981-Present; University of Bristol: Bristol, UK, 2020. [Google Scholar] [CrossRef]
Figure 1. The figure shows the Egypt domain.
Environsciproc 19 00043 g001
Figure 2. The figure shows Average 2m air temperature (hereafter TMP; in °C) over Egypt during 1986–2005 (RF) (a) and the potential change during the period of 2021 to 2040 (b), the period of 2041 to 2060 (c), the period of 2061 to 2080 (d), the period of 2081 to 2100 (e) according to the RCP85 scenario.
Environsciproc 19 00043 g002
Figure 3. The figure shows the average evapotranspiration (in mm/day) over Egypt during 1986–2005 (RF) (a) and potential change during the period of 2021 to 2040 (b), the period of 2041 to 2060 (c), the period of 2061 to 2080 (d), the period of 2081 to 2100 (e) according to the RCP85 scenario.
Environsciproc 19 00043 g003
Figure 4. The figure shows the monthly times series of potential evapotranspiration (PET; in mm/day) by the RegCM in the historical period (1981–2005) of the twelve locations in comparison with the CRU product (in red), before applying the LRM (RegCM; in blue) and after applying the LRM (RegCMnew; in green).
Environsciproc 19 00043 g004
Figure 5. The figure shows the future corrected PET changes (in %) under the two future scenarios (RCP45; in blue) and (RCP85; in red) for the twelve locations.
Environsciproc 19 00043 g005
Table 1. The table shows the linear regression model (LRM) for each station to correct the PET (calculated by the RegCM with respect to the CRU in the historical period 1981–2005).
StationLatLonLinear Regression Model (LRM) to Correct the RegCM4 Output
Port-Said31.2832.23PETcorr = 0.9641 × PETraw
Alexandria31.2029.95PETcorr = 1.057 × PETraw + 0.48
Arish31.0833.83PETcorr = 1.049 × PETraw + 0.294
Marsa-Maturh31.2027.20PETcorr = 0.617 × PETraw + 1.362
Ismailia30.6032.26PETcorr = 0.779 × PETraw + 0.635
Giza30.0531.22PETcorr = 0.847 × PETraw + 0.748
Asyout27.0531.02PETcorr = 1.12 × PETraw
Luxor25.6632.70PETcorr = 0.968 × PETraw + 0.696
Asswan23.9632.78PETcorr = 1.097 × PETraw + 1.103
Siwa29.2625.48PETcorr = 0.861 × PETraw + 0.864
Dakhla25.4829.00PETcorr = 1.049 × PETraw + 0.159
Kharga25.4530.53PETcorr = 1.16 × PETraw + 0.502
Publisher’s Note: MDPI stays neutral with regard to jurisdictional claims in published maps and institutional affiliations.

