3.1. Decadal Characterization of the Fields Obtained from the ERA5 Reanalysis between 2010–2019
The results obtained by the predecessors to ERA5 suggest that in recent decades the North Atlantic anticyclone has expanded, strengthened and changed locations. These variations seem to be more evident in the middle and lower levels of the troposphere, as well as in the last decade, which is why we first analyzed the height variables geopotential, relative humidity, wind and temperature in the period 2010–2019. Upon obtaining the average maps of ERA5, we were able to appreciate a variety of interesting characteristics. At the 1000 hPa level, it is evident that the mid-position of the subtropical ridge extended to the Gulf of Mexico throughout the 2020 wet season, coinciding with the expansion described in Fernandez et al. (2021) [
3].
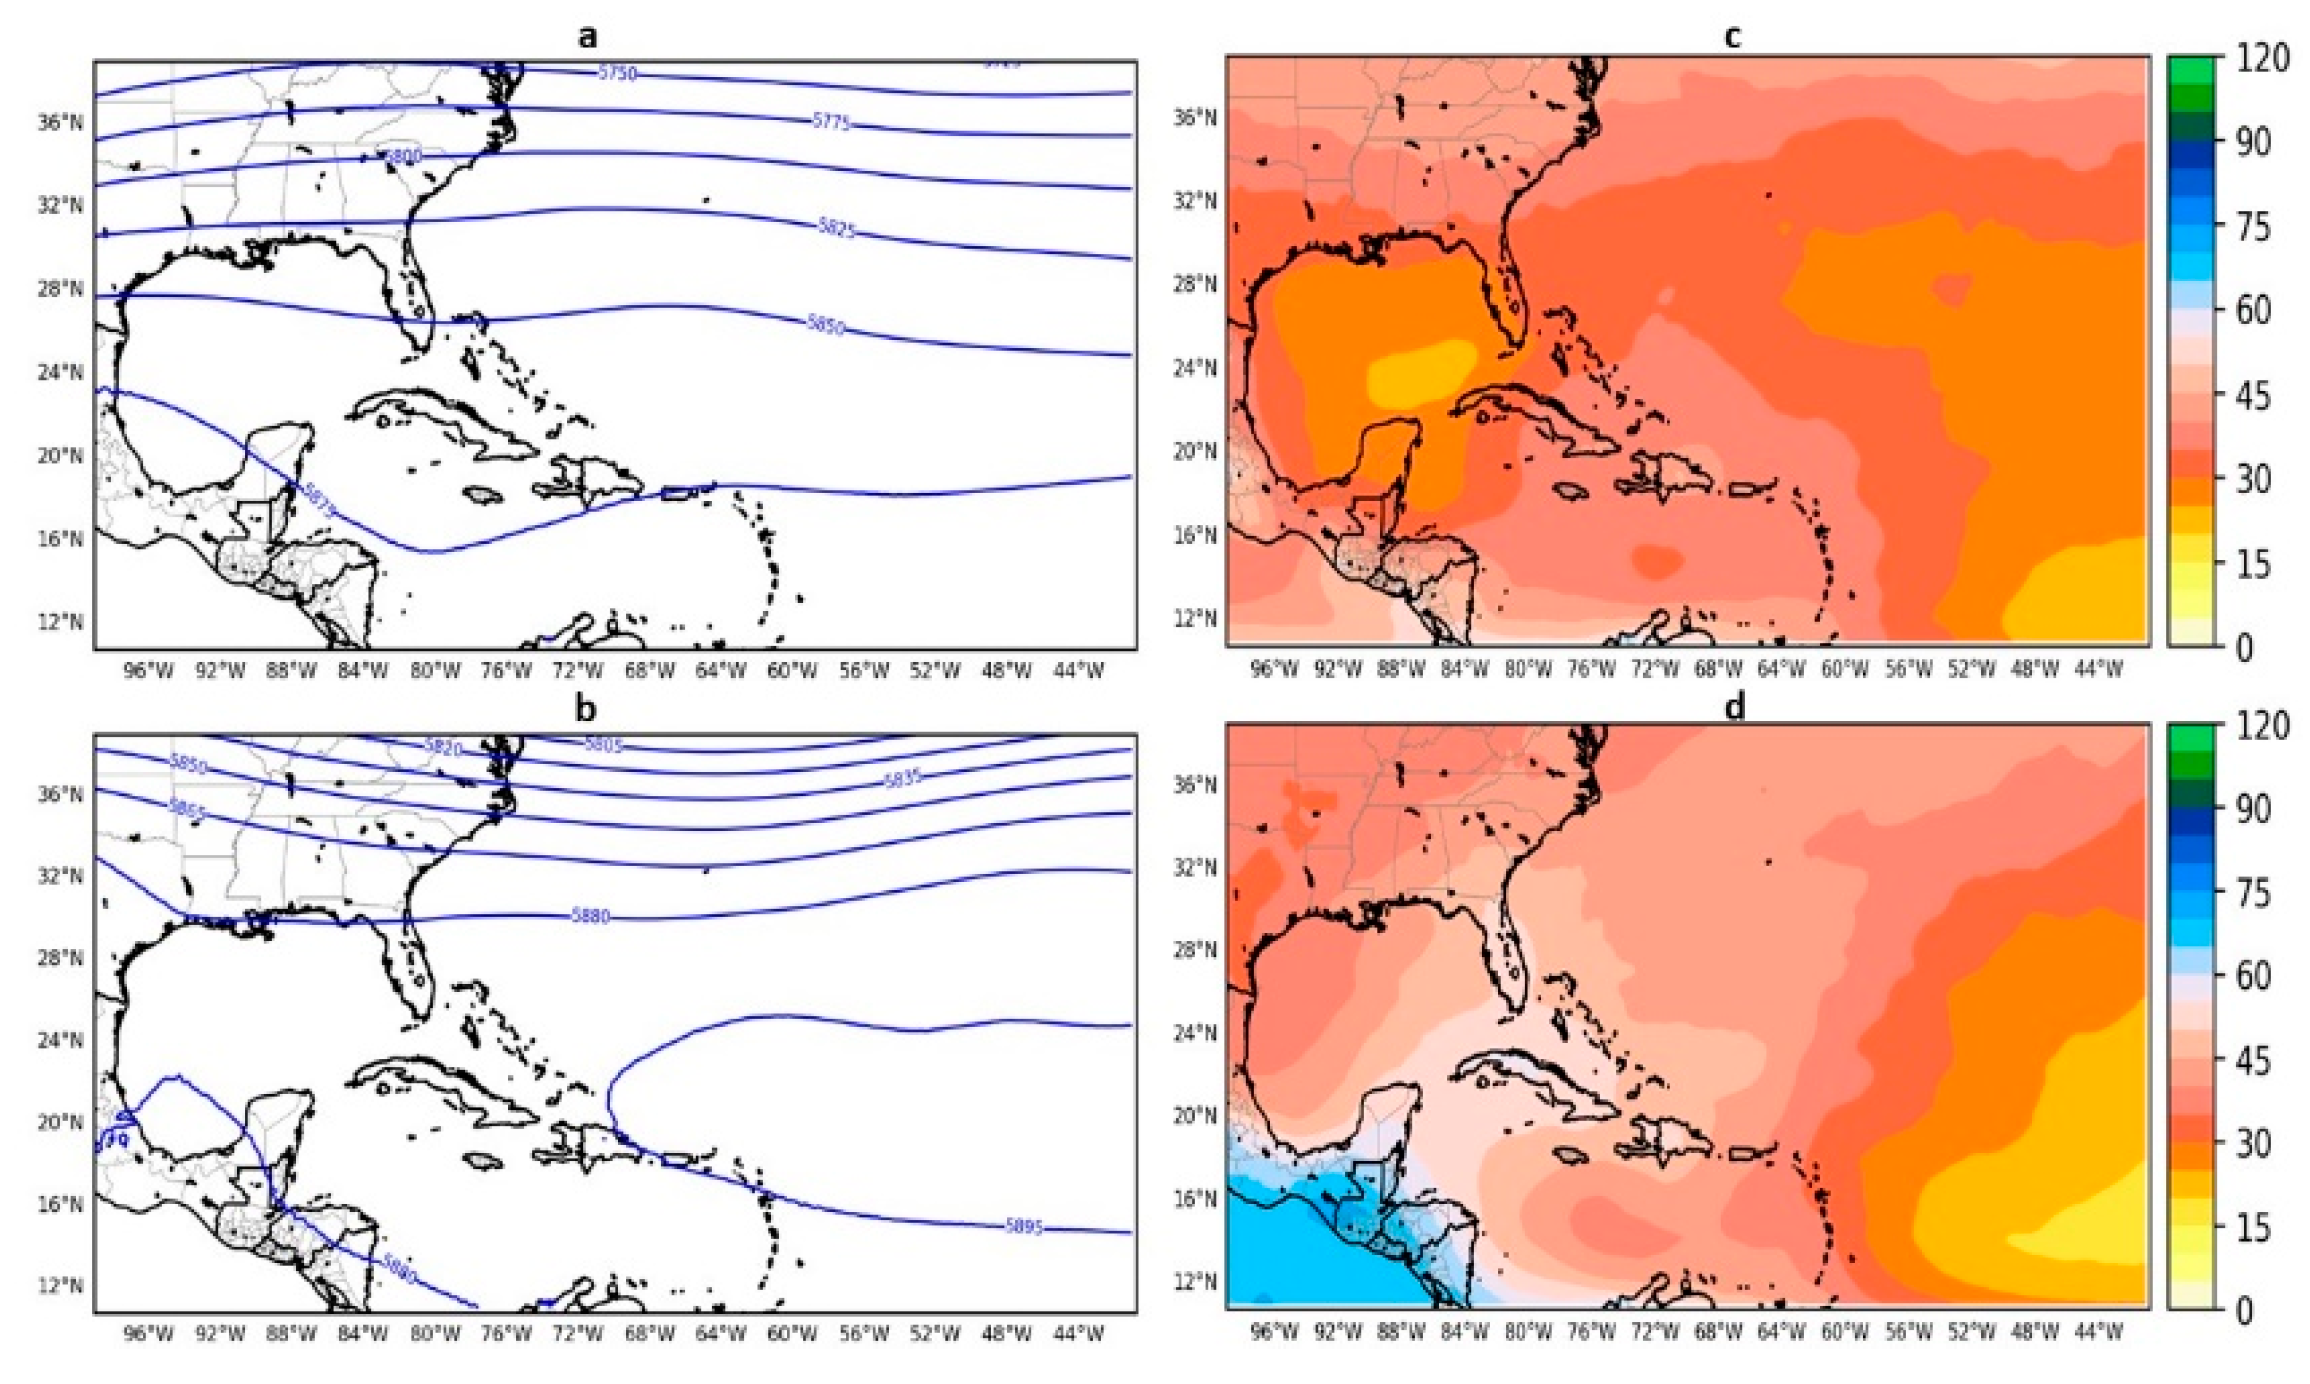
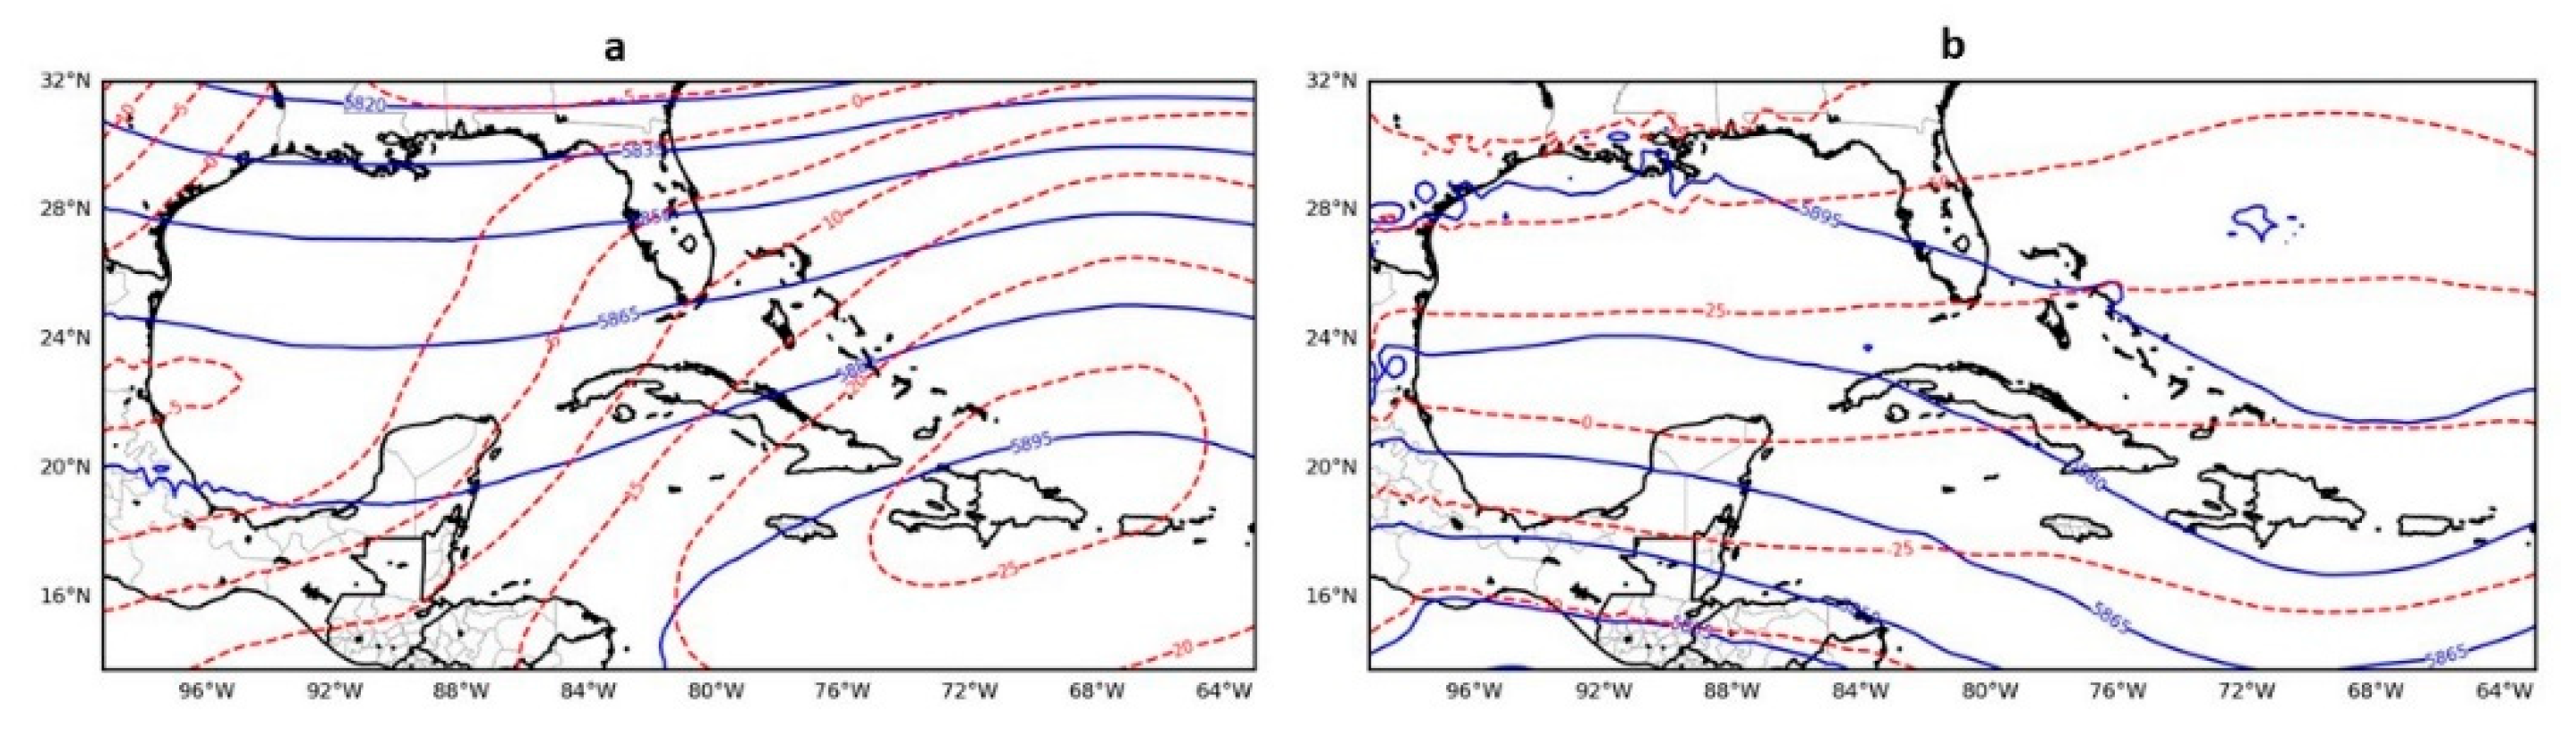
At middle levels of the troposphere at the beginning of the study period, it was observed that the axis of the May–June seasonal trough was moving further east, causing an area of maximum vorticity advection of the trough to be found in the central and eastern regions of the territory, while the driest portion was located in the west. These changes in geopotential fields were also reflected in the relative humidity fields at this level. In May, the driest values on the island were over the west of the country, and the wettest extended along the central and eastern regions, coinciding with the zone of maximum vorticity advection cyclone of the trough. These results indicated that the beginning of the wet season was delayed in Cuba’s western region (
Figure 1). Continuing with the middle levels analysis in summer, similar to what was obtained by Fernández et al. (2021), a belt of high geopotential values close to the Tropic of Cancer was observed, suggesting an interaction between the Mexican and the subtropical ridge. This fact could be the cause of limited exchange between tropic and mid latitudes.
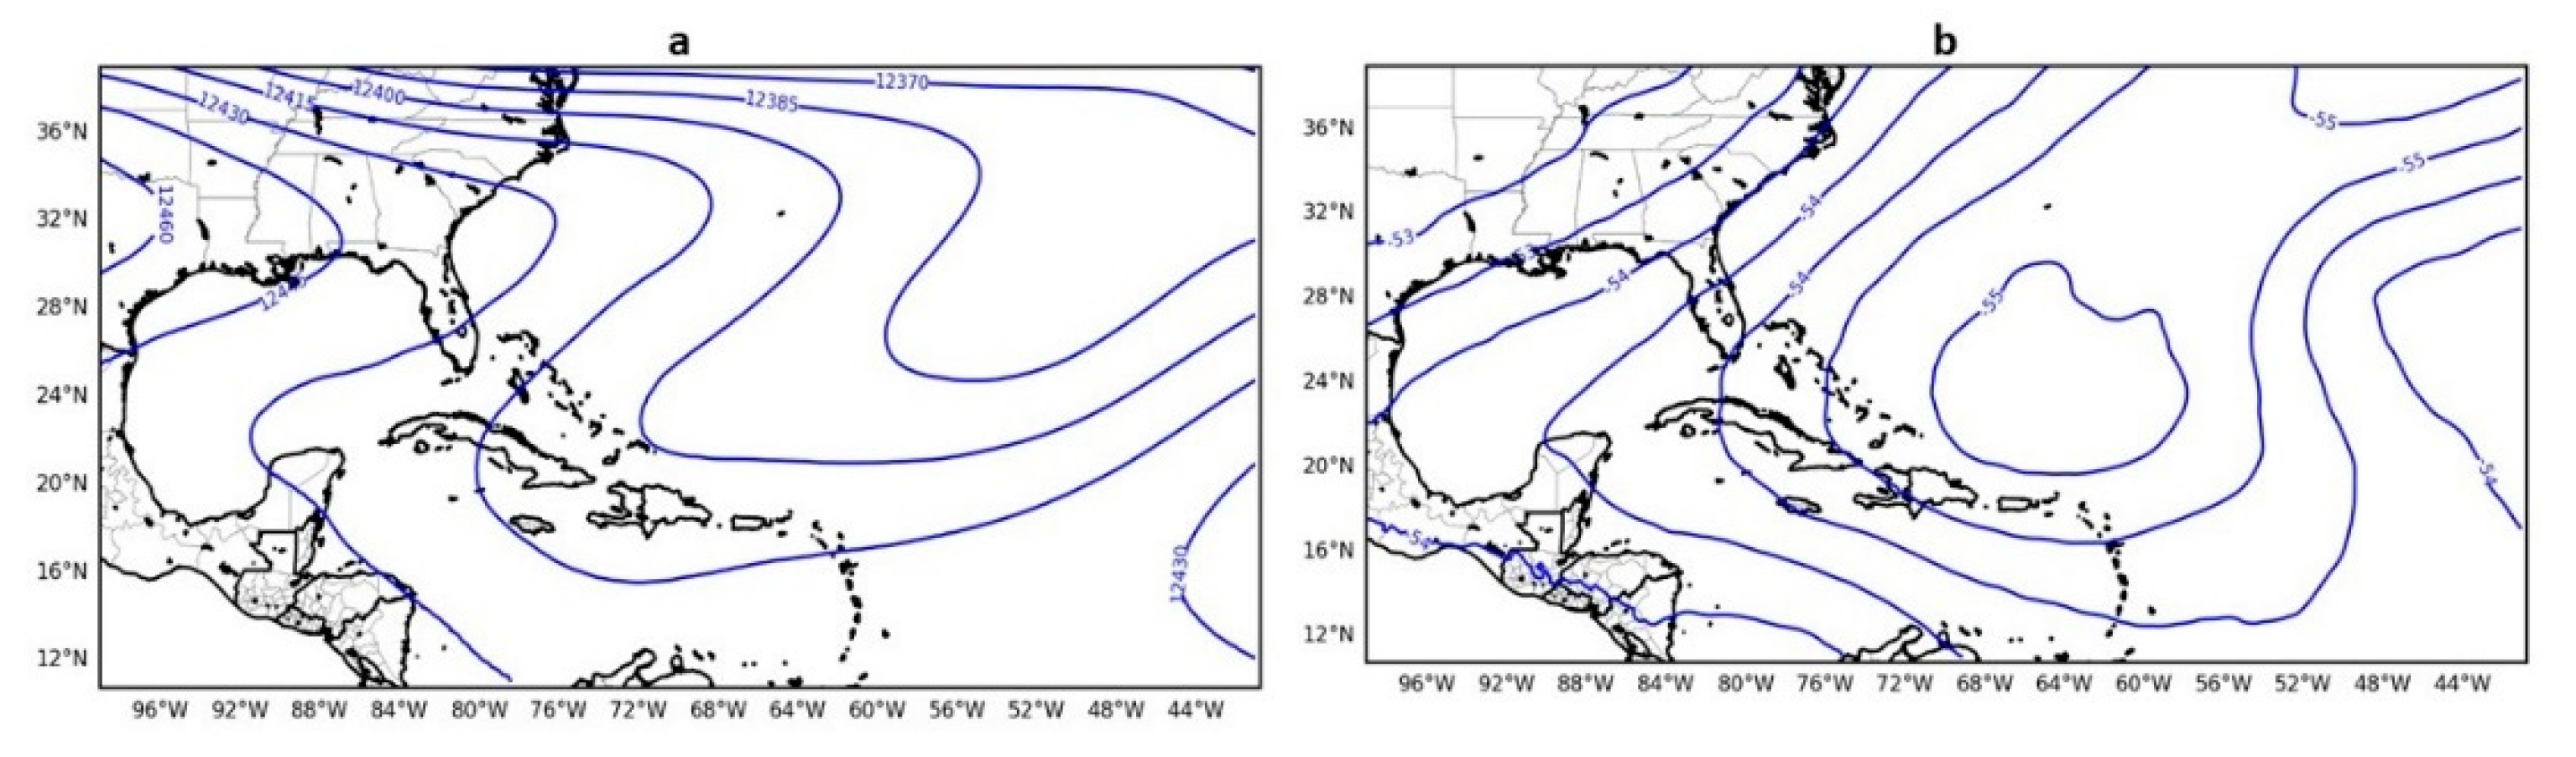
The least significant changes happen at 200 hPa, since the mean position of the tropical upper tropospheric trough (TUTT) has experienced little variation in the last decade. The relative position of the TUTT, according to the isohypses, coincides with a thermal trough that establishes a closed cold center on the mean temperature map located northeast of Hispaniola in July (See
Figure 2). This average cold core could be because of the formation of cold lows, which tend to fall off the TUTT, often causing severe weather, as these upper troughs spawn cold-core depressions aloft called TUTT cells. These cells are known to produce deep convective clouds and precipitation tending to be south and east of the trough, as shown in
Figure 2b.
3.2. 2020 WET Season: Anomalies Compared to Decadal Average
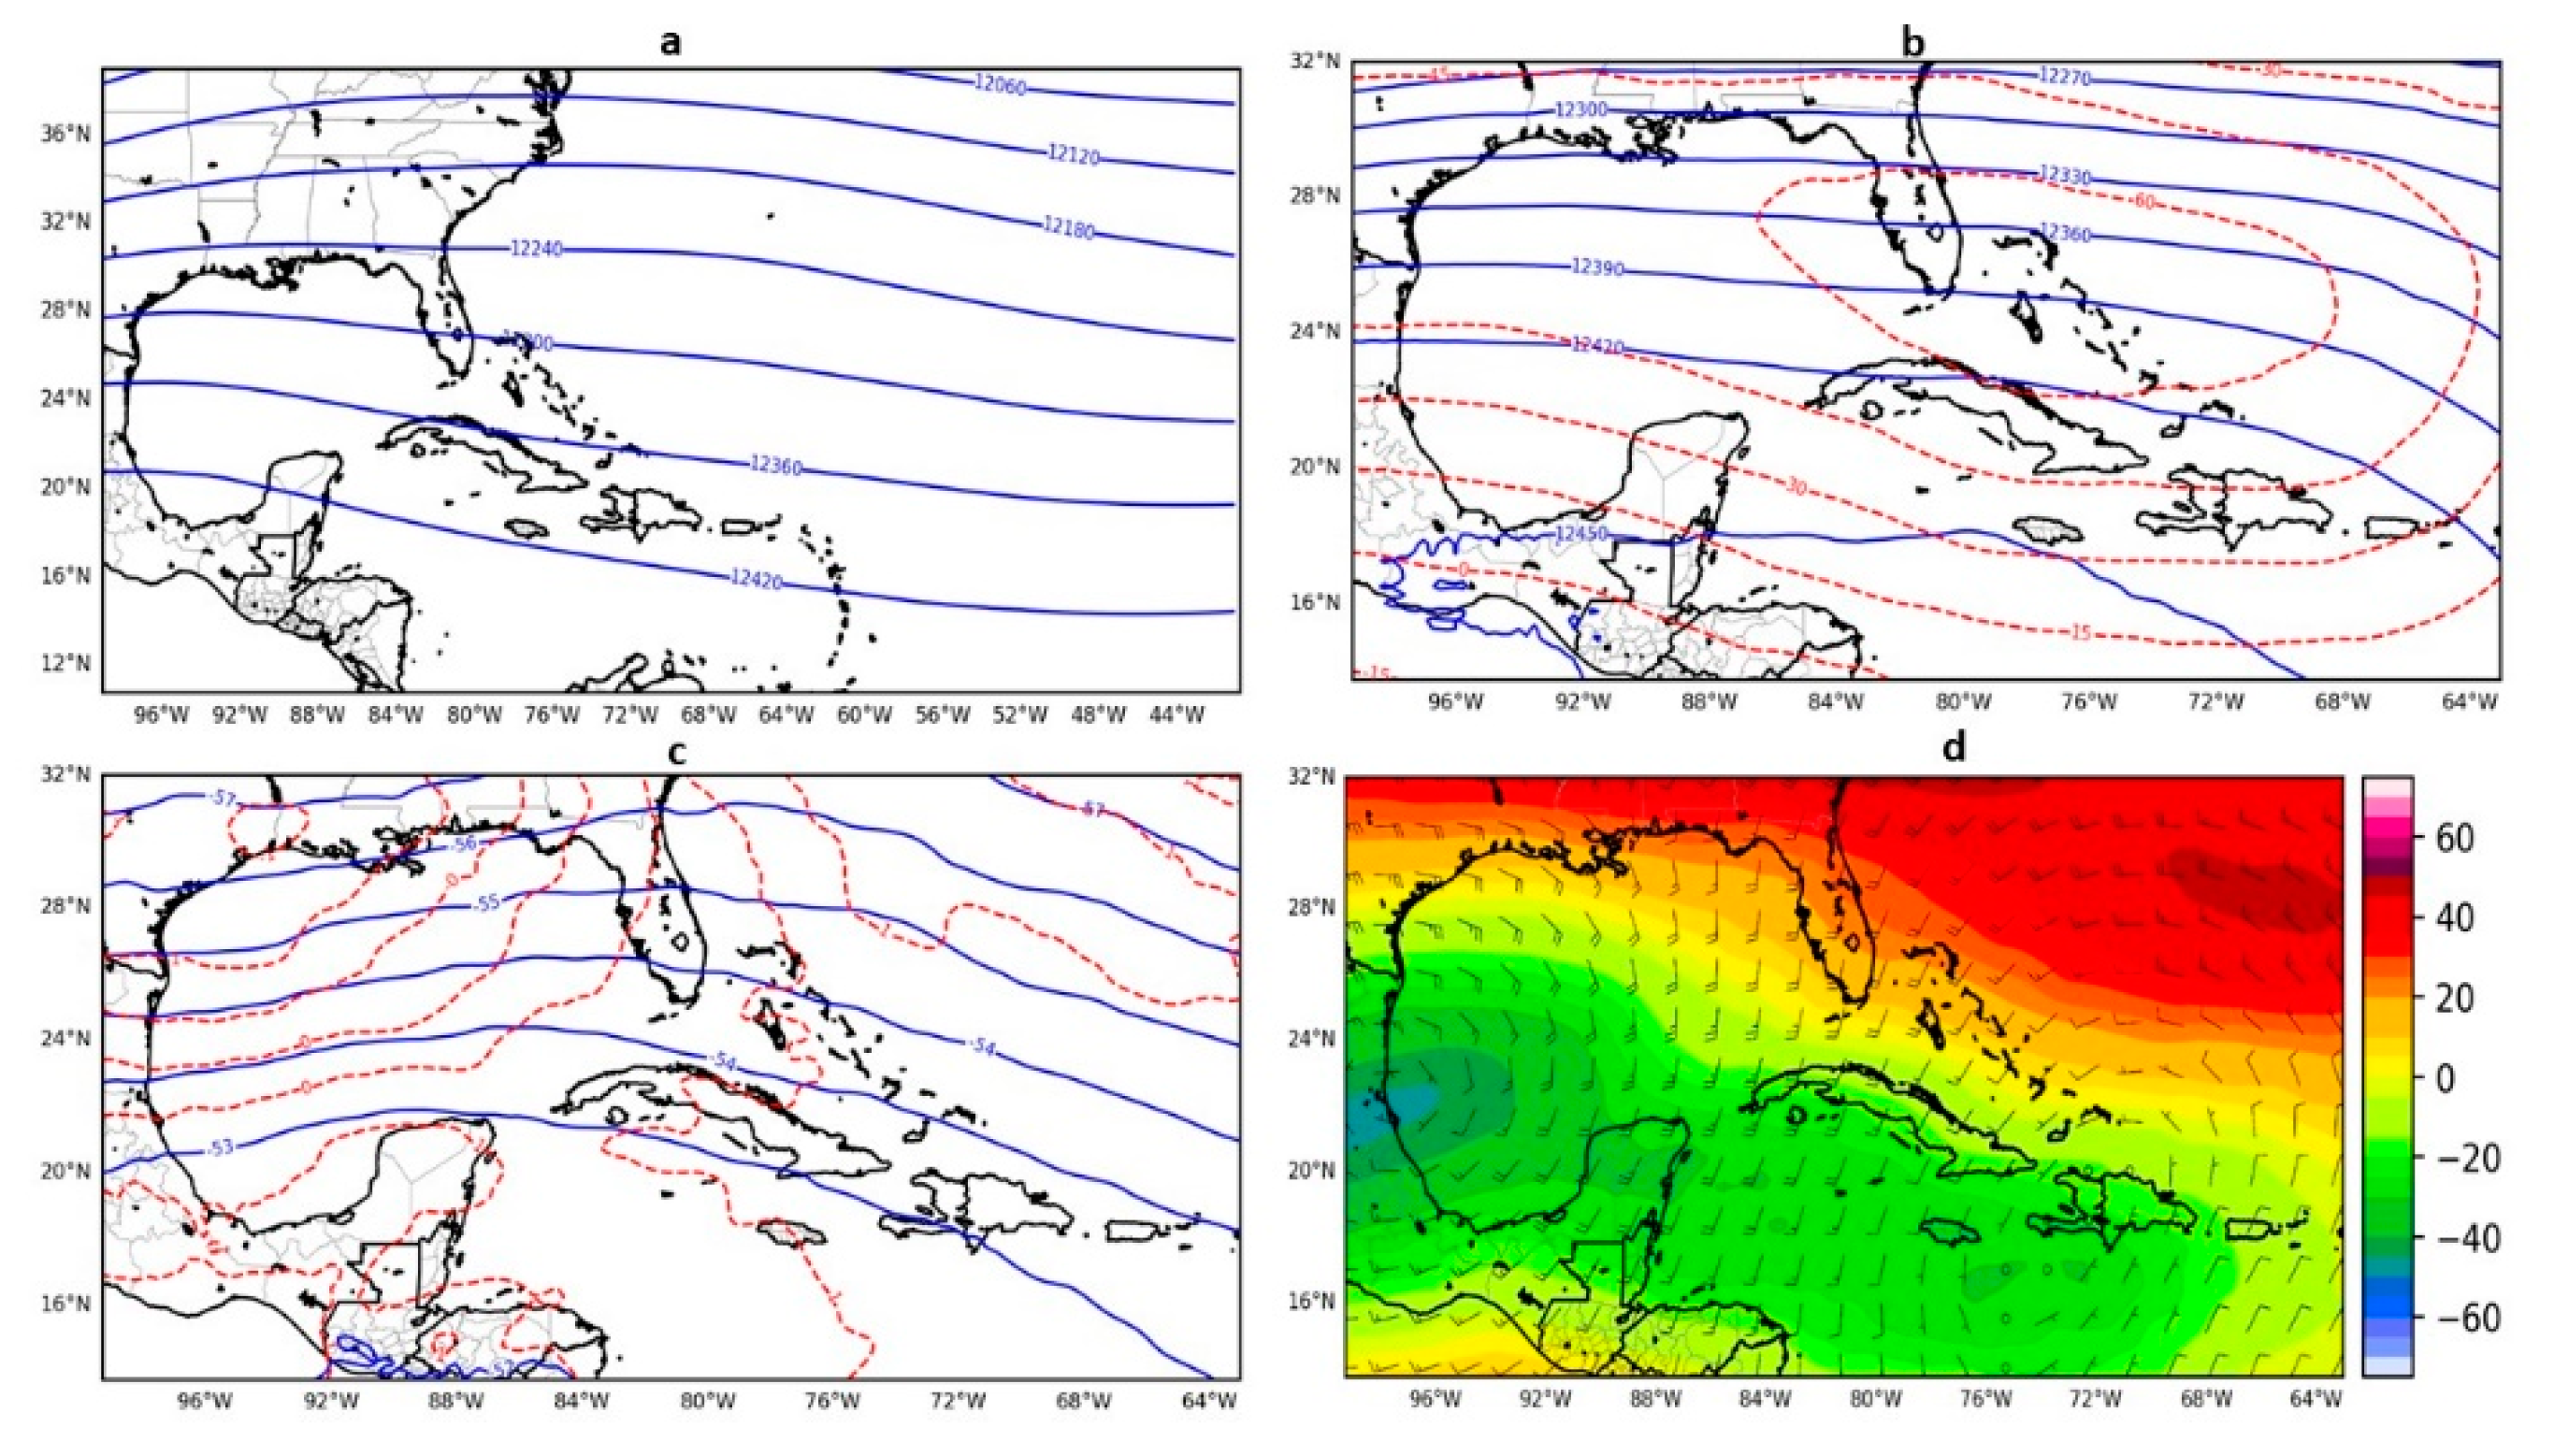
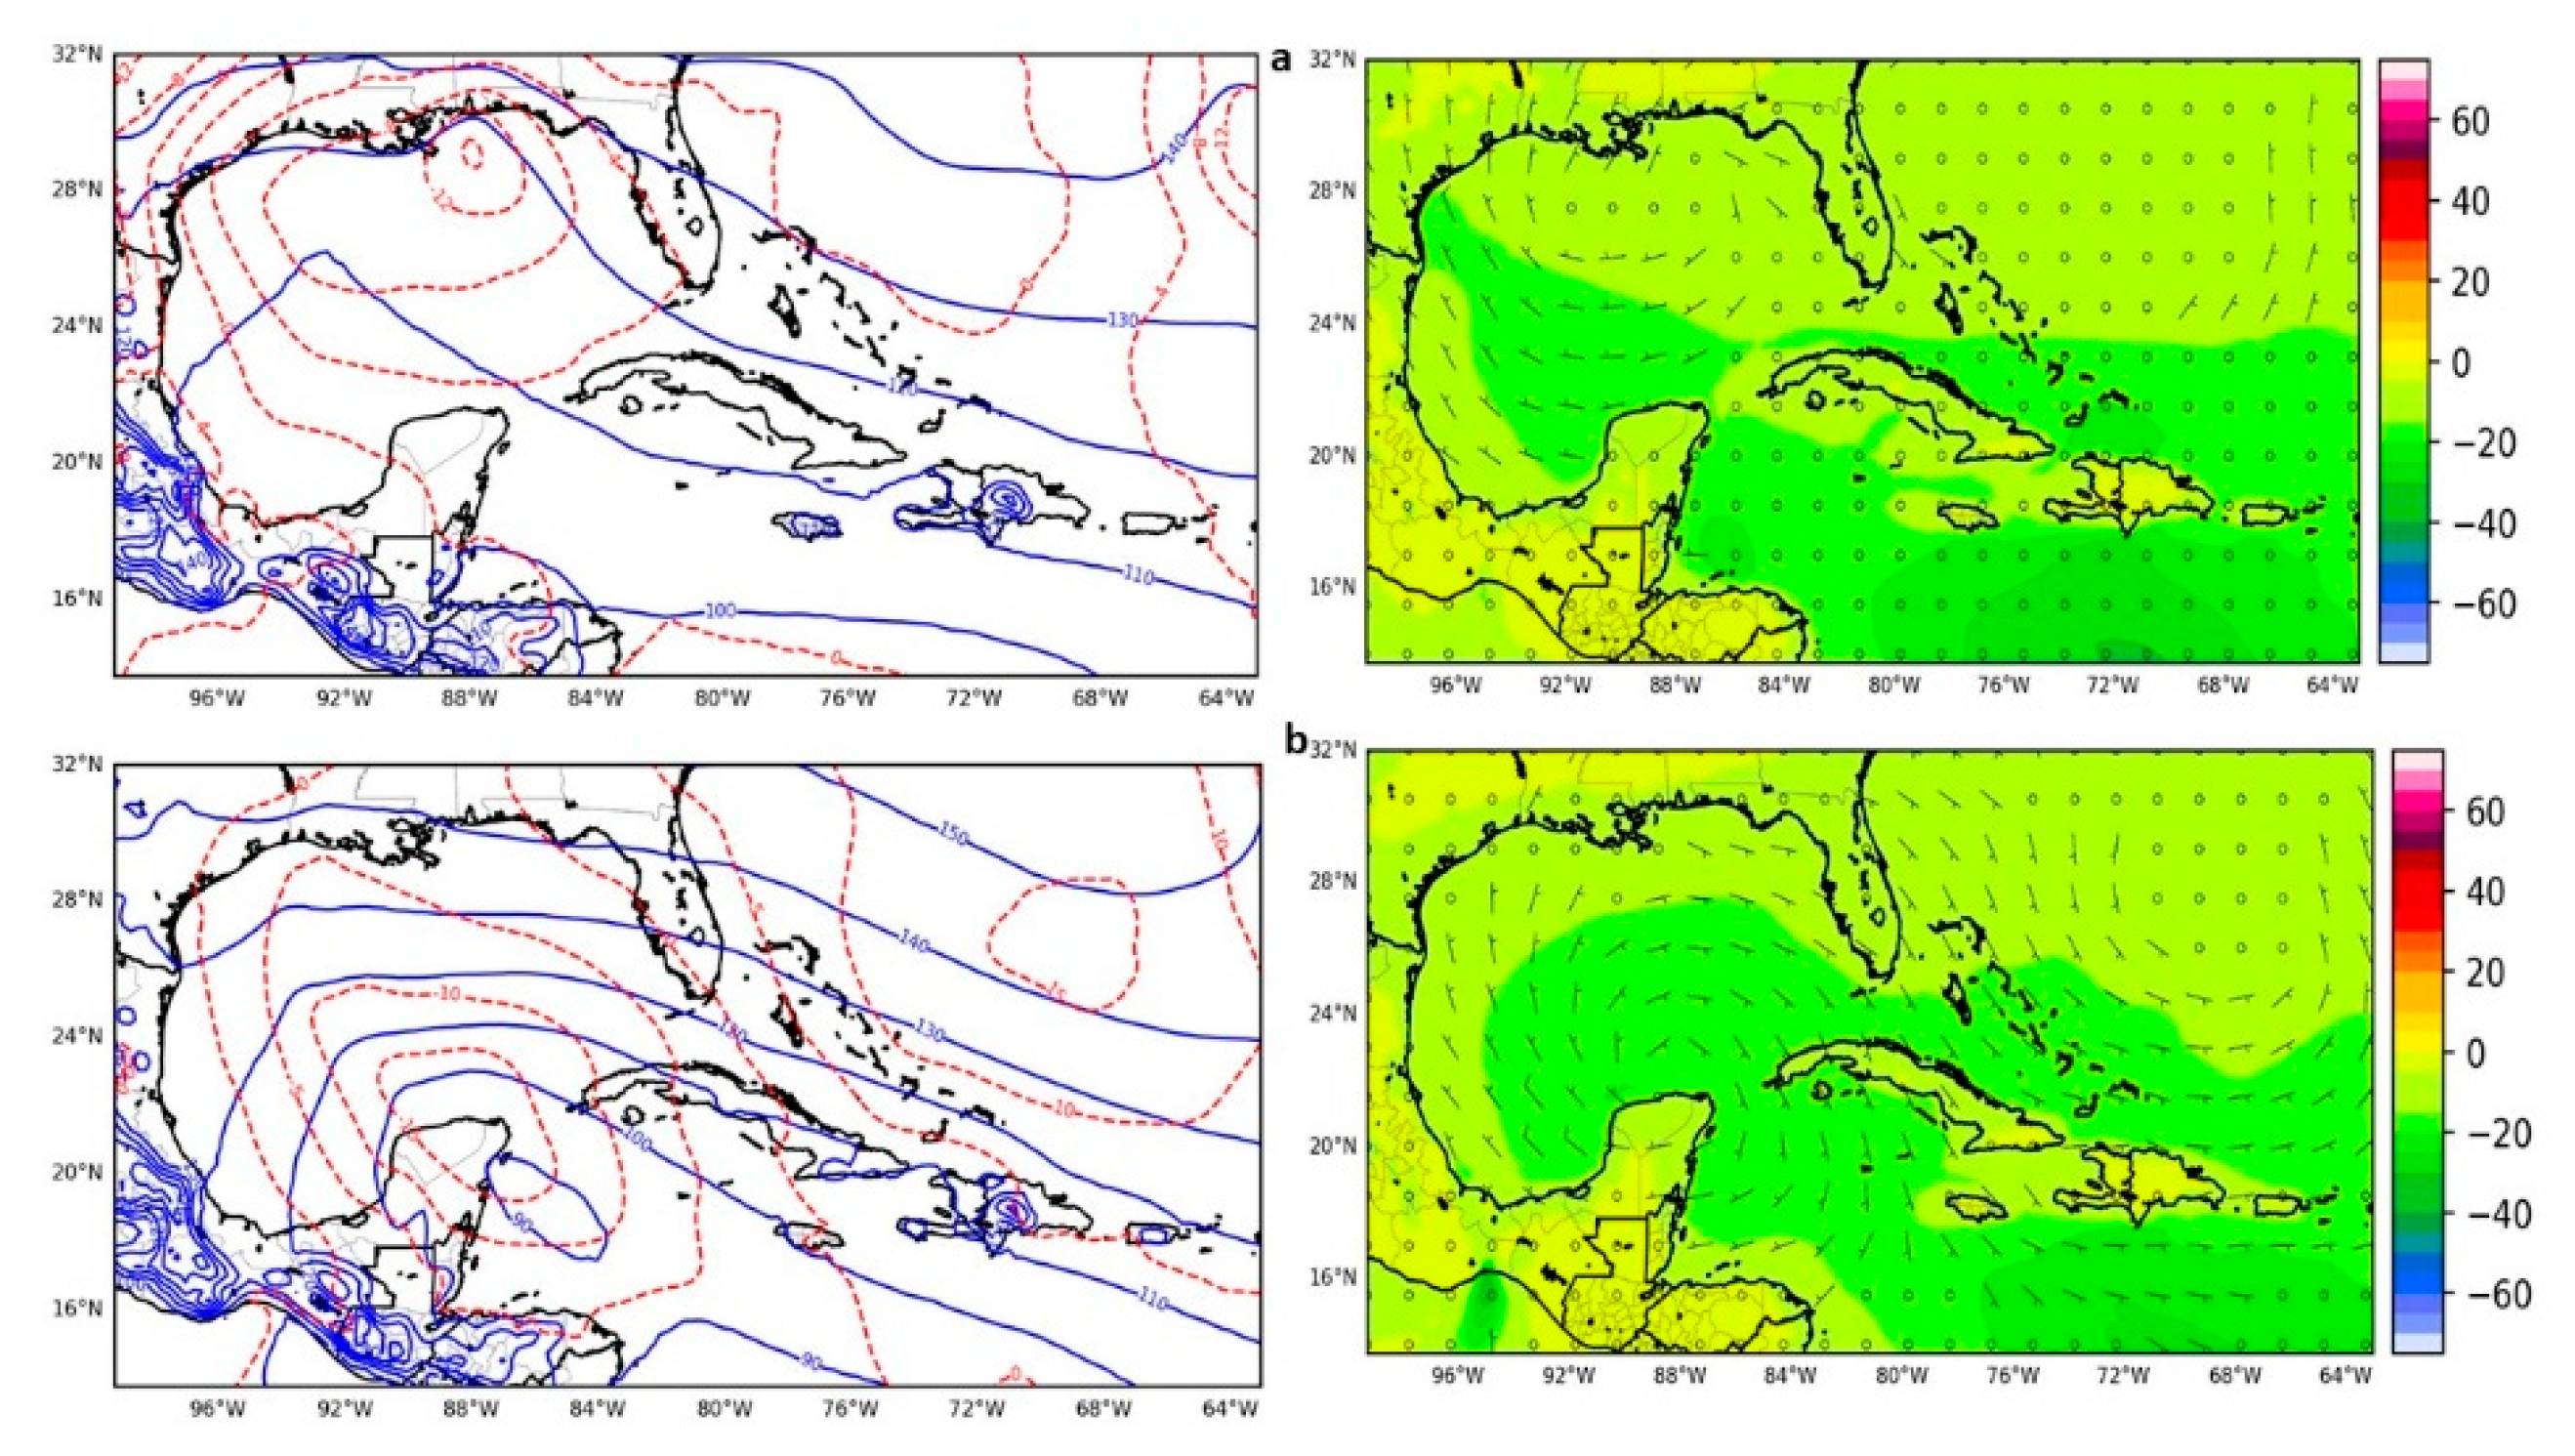
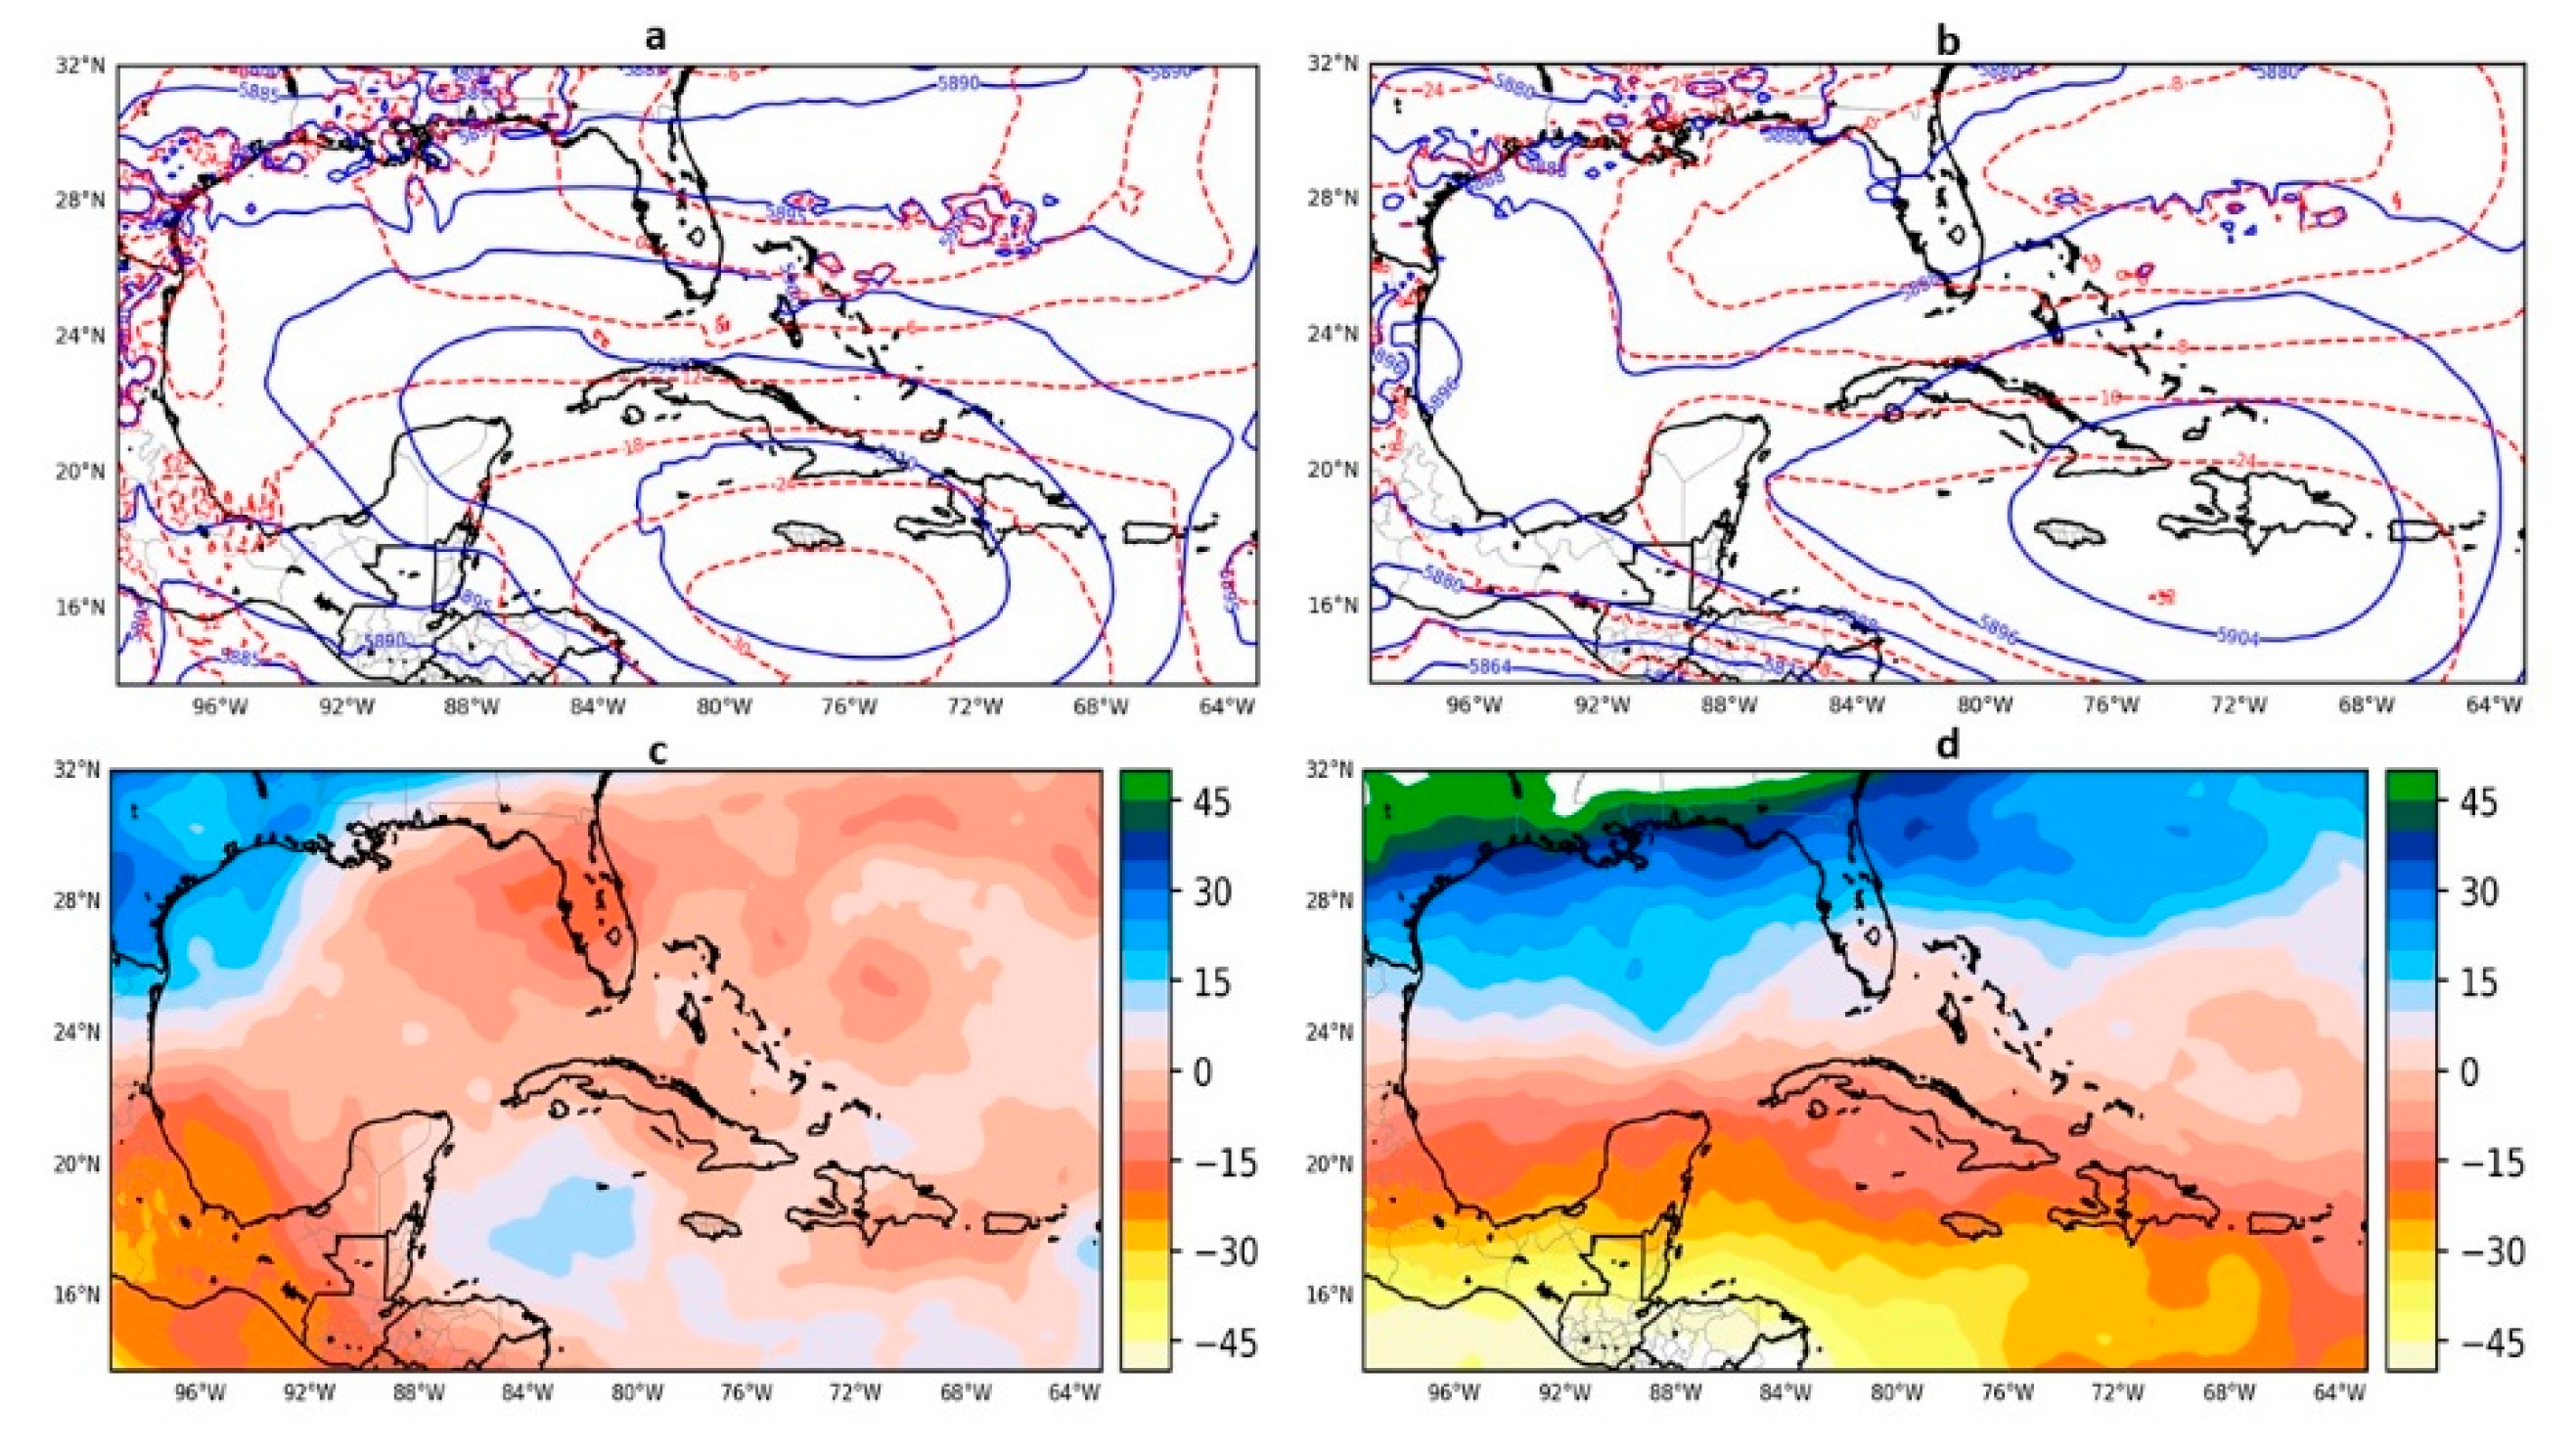
When analyzing the average anomaly maps of the 2020 wet season with respect to the average decade of the ERA5 reanalysis, the greatest changes were observed in the transition months, mainly in May, where positive anomaly values were found in the range between 15 and 60 m
2/s
2, mainly east of the −88° Meridian, with a maximum located northeast of the southern Bahamas (
Figure 3b). The sectors that comprise the Gulf of Mexico and continental America display null variations of the geopotential fields, although their intensity decreases slightly (−15 m
2/s
2) over central portions of Mexico. This could be associated with a strengthening of high geopotential values due to an expansion of the subtropical ridge at high levels, which corresponds to the temperature anomalies obtained, around 1 °C (
Figure 3c), generated by heating due to diabatic compression associated with the anticyclone that heats air layers in the atmosphere. The analysis of the anomalies in the wind field (
Figure 3d) revealed that the speed of the wind increases, with values between 20 and 50 km/h north of the 24° Parallel, coinciding with the region of greater warming, which suggests a certain direct relationship between the behavior of both variables. This behavior could lead to a southward extension of the subtropical jet stream, which may, in turn, lead to more baroclinic environments in the tropical zone. Although the average position of the May–June through led to a decrease in rainy days, especially towards the west, these baroclinic environments could generate favorable conditions for local instability to lead to severe weather manifestations. This fact, although not proven by studies, has been observed and documented in recent years by specialists and amateurs.
In addition, an anomalous anticyclonic circulation centered on the mean wind map stands out approximately over Hispaniola, (see
Figure 3d) which may be in response to the expansion of the subtropical ridge and the consequent formation of secondary anticyclonic circulations in the region of the periphery of the same. Portions where negative anomalies are observed in the geopotential fields coincide with a cooling in high levels and a decrease in winds.
For middle levels in May and June, the anomalies did not exceed 25 m2/s2, and the maximum values are located near Hispaniola and Puerto Rico. These results confirm the presence of the May–June through with a very similar structure to that observed in the average decadal statistics analyzed before; however, there may be a slight displacement to the west.
At low levels, the behavior was similar to that previously explained but to a lesser extent than at levels related to the upper air. In particular, June 2020 was quite similar to the behavior studied in the decadal mean for close to the surface levels. For the following two months at the 200 hPa level, the same trend persisted; however, a slight increase in the geopotential suggests a fundamental TUTT contraction in the tropical zone (
Figure 4a). When analyzing the average temperature map for July 2020, the cold nucleus to the southeast of the TUTT persists; however, to the north of Puerto Rico, entering the Atlantic, a core of warm anomalies appears in response to a further southerly shift of said cold core (
Figure 4b).
For these months in middle levels, the belt of high geopotential values persisted caused by the subtropical ridge expansion, bringing with it the formation of an induced trough caused by the interaction of said dorsal with the Mexican to the southern United States, which is the cause of the negative values in said area.
Another interesting result is found close to surface level for September and October, mainly in the geopotential and wind fields, associated with the active behavior of the 2020 cyclonic season that generated a decrease in the values of these two variables (
Figure 5).
3.3. Analysis of the 2020 Wet Season Represented by SisPI Errors Respect ERA5 Results
The study of the anomalies was useful to better understand the analysis of the errors from SisPI because both were higher at the beginning and the end of the wet season, which is consistent with the stages of transition towards summer in May and towards winter in October when tropical and mid-latitude systems interact. These situations can be sources of uncertainty for the model; however, it became necessary to determine if the errors of the SisPI forecast in the wet season are a result of these anomalies or its own configuration. In addition, the errors were softened more from June to August, where summer conditions are well established, and performance did not vary greatly from the decade. According to the results obtained, SisPI has a peculiarity in that the northern border of the external domain is located in the region where the positive geopotential anomalies were, in addition to the greater warming and greater discontinuities of relative humidity. This leads to greater gradients in the meteorological fields and, consequently, an error source on the northern border. On the other hand, the interaction with the Intertropical Convergence Zone (ITCZ) is located south of the domain, and discontinuities have also been observed in the meteorological fields, although less than to the north.
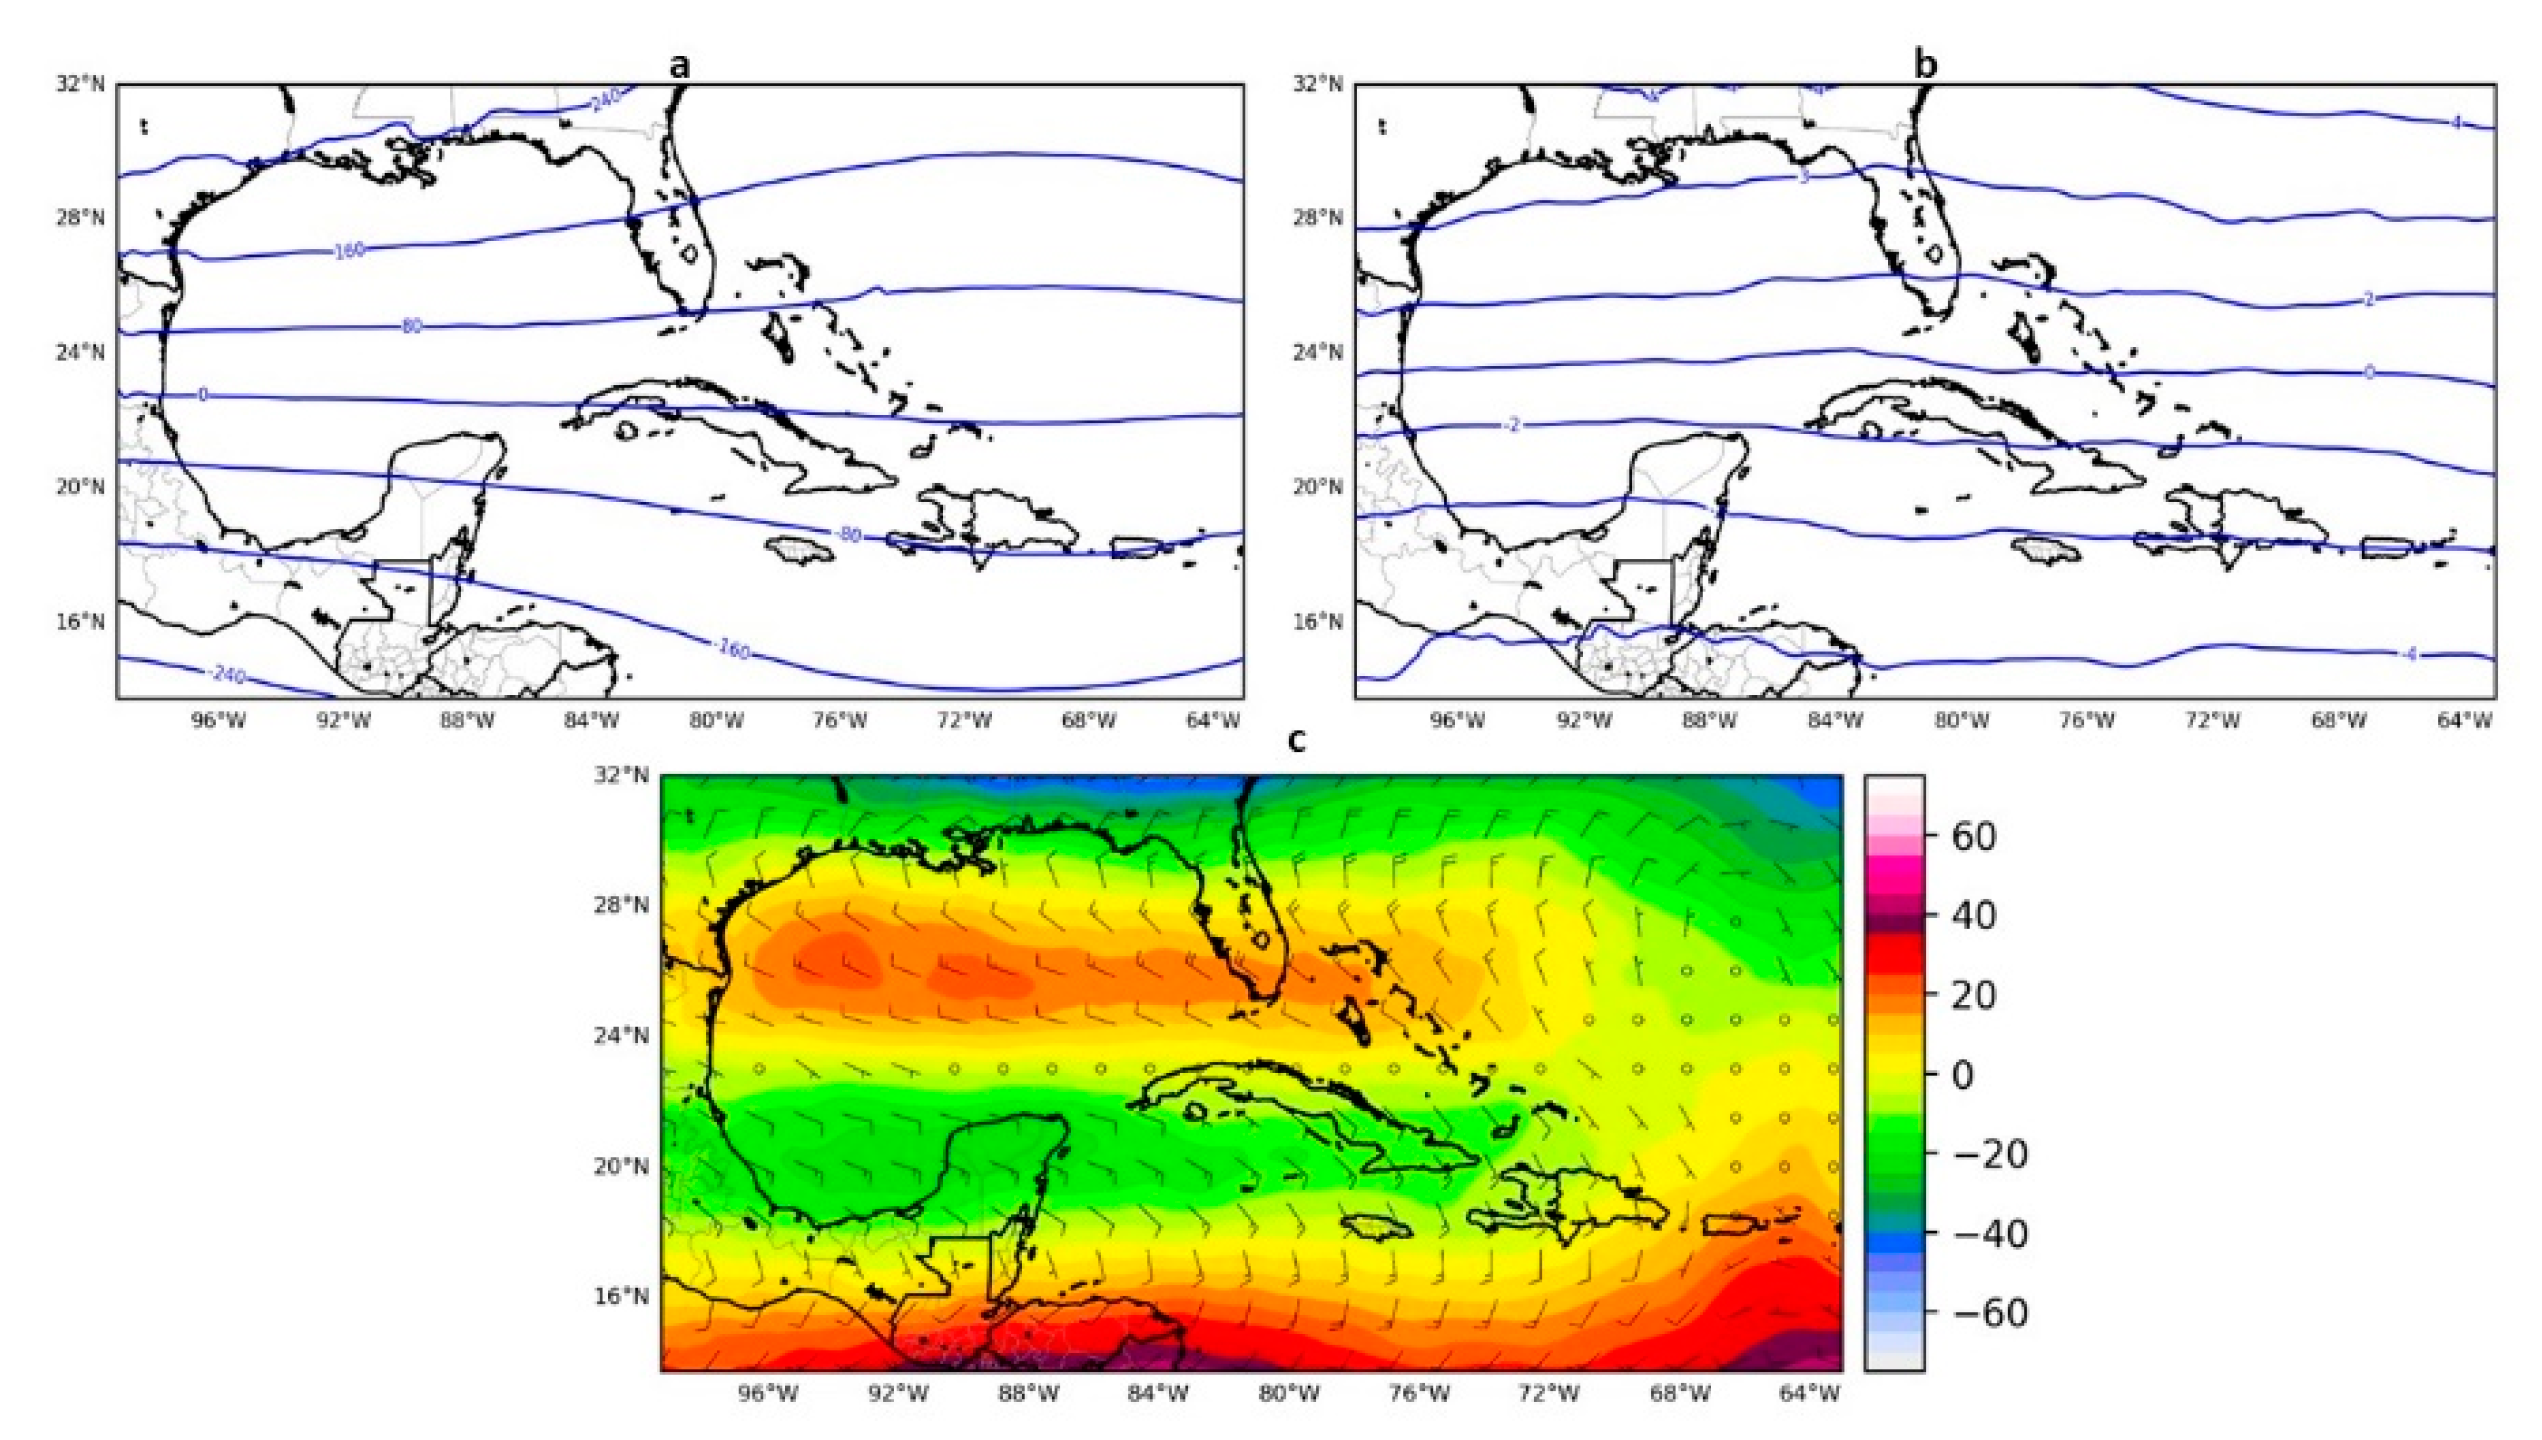
The errors at 200 hPa were greater on the northern and southern borders of the domain with geopotential values similar in both with opposite signs, mainly in May, where they reach values up to 160 m
2/s
2, which suggests additional strengthening of the equatorial trough related to the ITCZ to the south and high pressure areas to the north (
Figure 6a).
As can be seen in
Figure 6b, this geopotential behavior coincides with temperature errors being 2 to 4 °C overestimated to the north while, in contrast, an additional cooling of up to 4 °C difference is seen to the south. However, wind field errors suffered an increase towards the southern border of the domain in relation to the speed in an approximate order of 30–40 km/h (
Figure 6c), while towards the northern border the average wind forecast was weaker than the actual wind by an order of magnitude of 20–40 km/h. This could imply that SisPI was not able to forecast the increasing trend of the more baroclinic conditions in the tropical zone, as well as the latitudinal descent of the subtropical jet, which has weight in the forecast of perturbed states that could lead to locally severe storms (LSS).
These errors are smoothed out in the following quarter, progressively decreasing until reaching a minimum in July before beginning to rise again in August. The most noticeable errors were found in the relative humidity and wind fields. During these months, SisPI generates an additional dryness at high levels. The specific cause of these results is difficult to determine because there are several factors that can influence this. For example, the vertical border is set at this level, and the typical initialization errors and those derived from the parameterizations physics are used by the model.
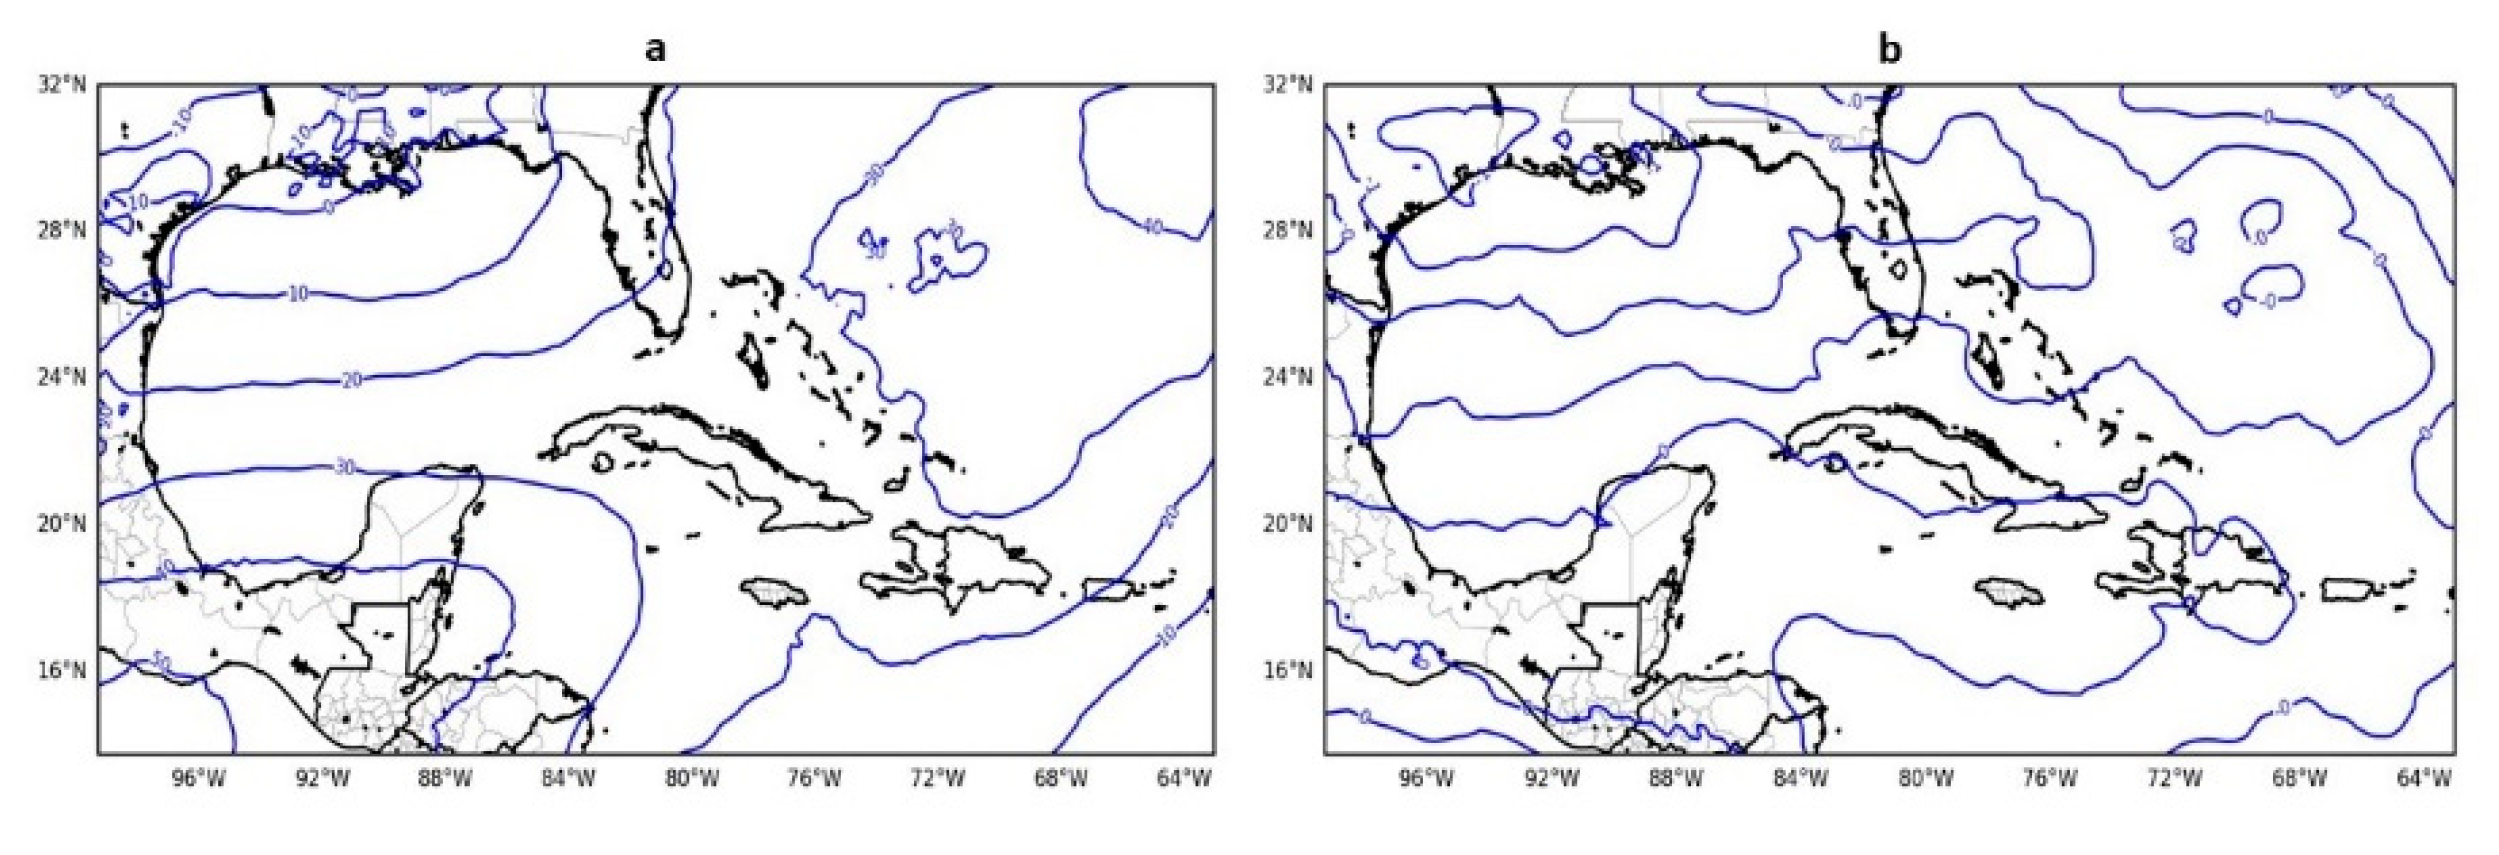
In the case of the TUTT behavior, as can be seen in
Figure 7a, SisPI predicted it to be somewhat more compressed as a result of positive errors in the geopotential field. However, its adequate representation of the temperature fields could detect the cold core region localized over Hispaniola and adjacent seas, a fact that can be seen in
Figure 7b).
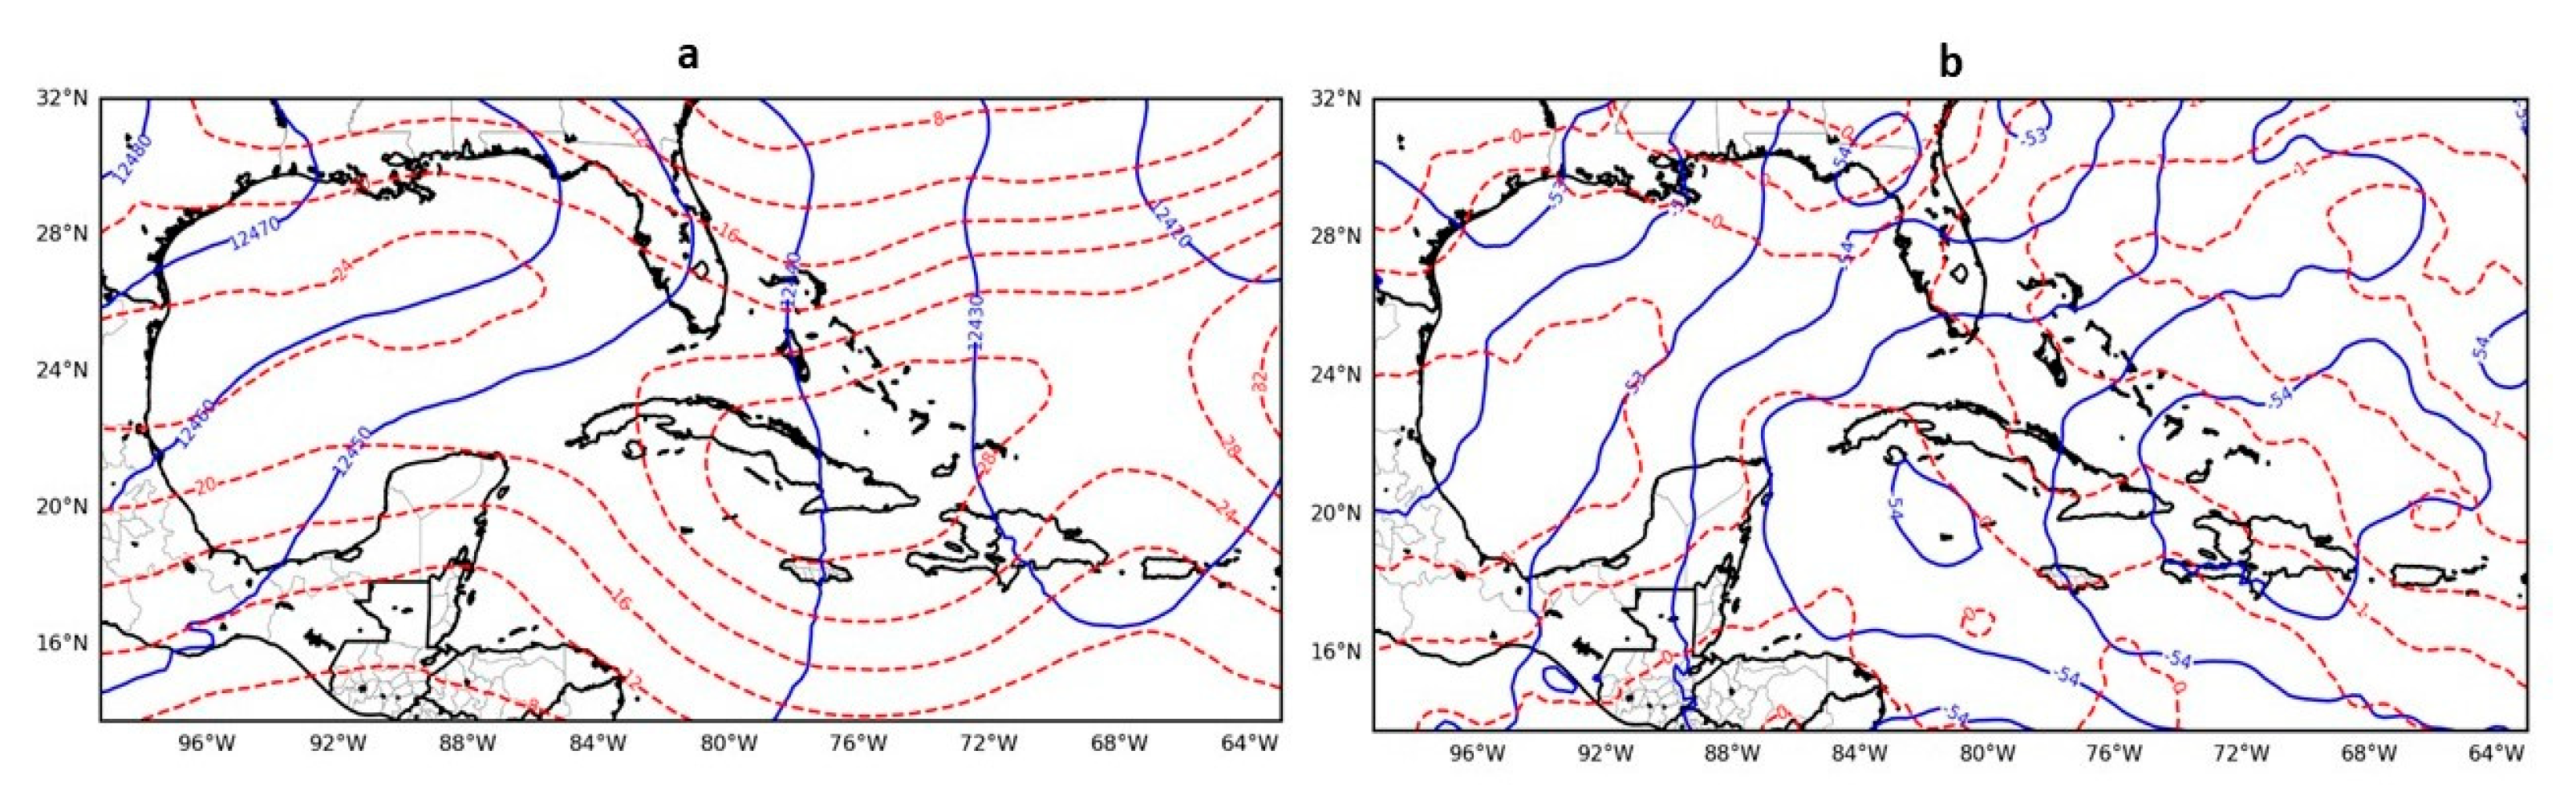
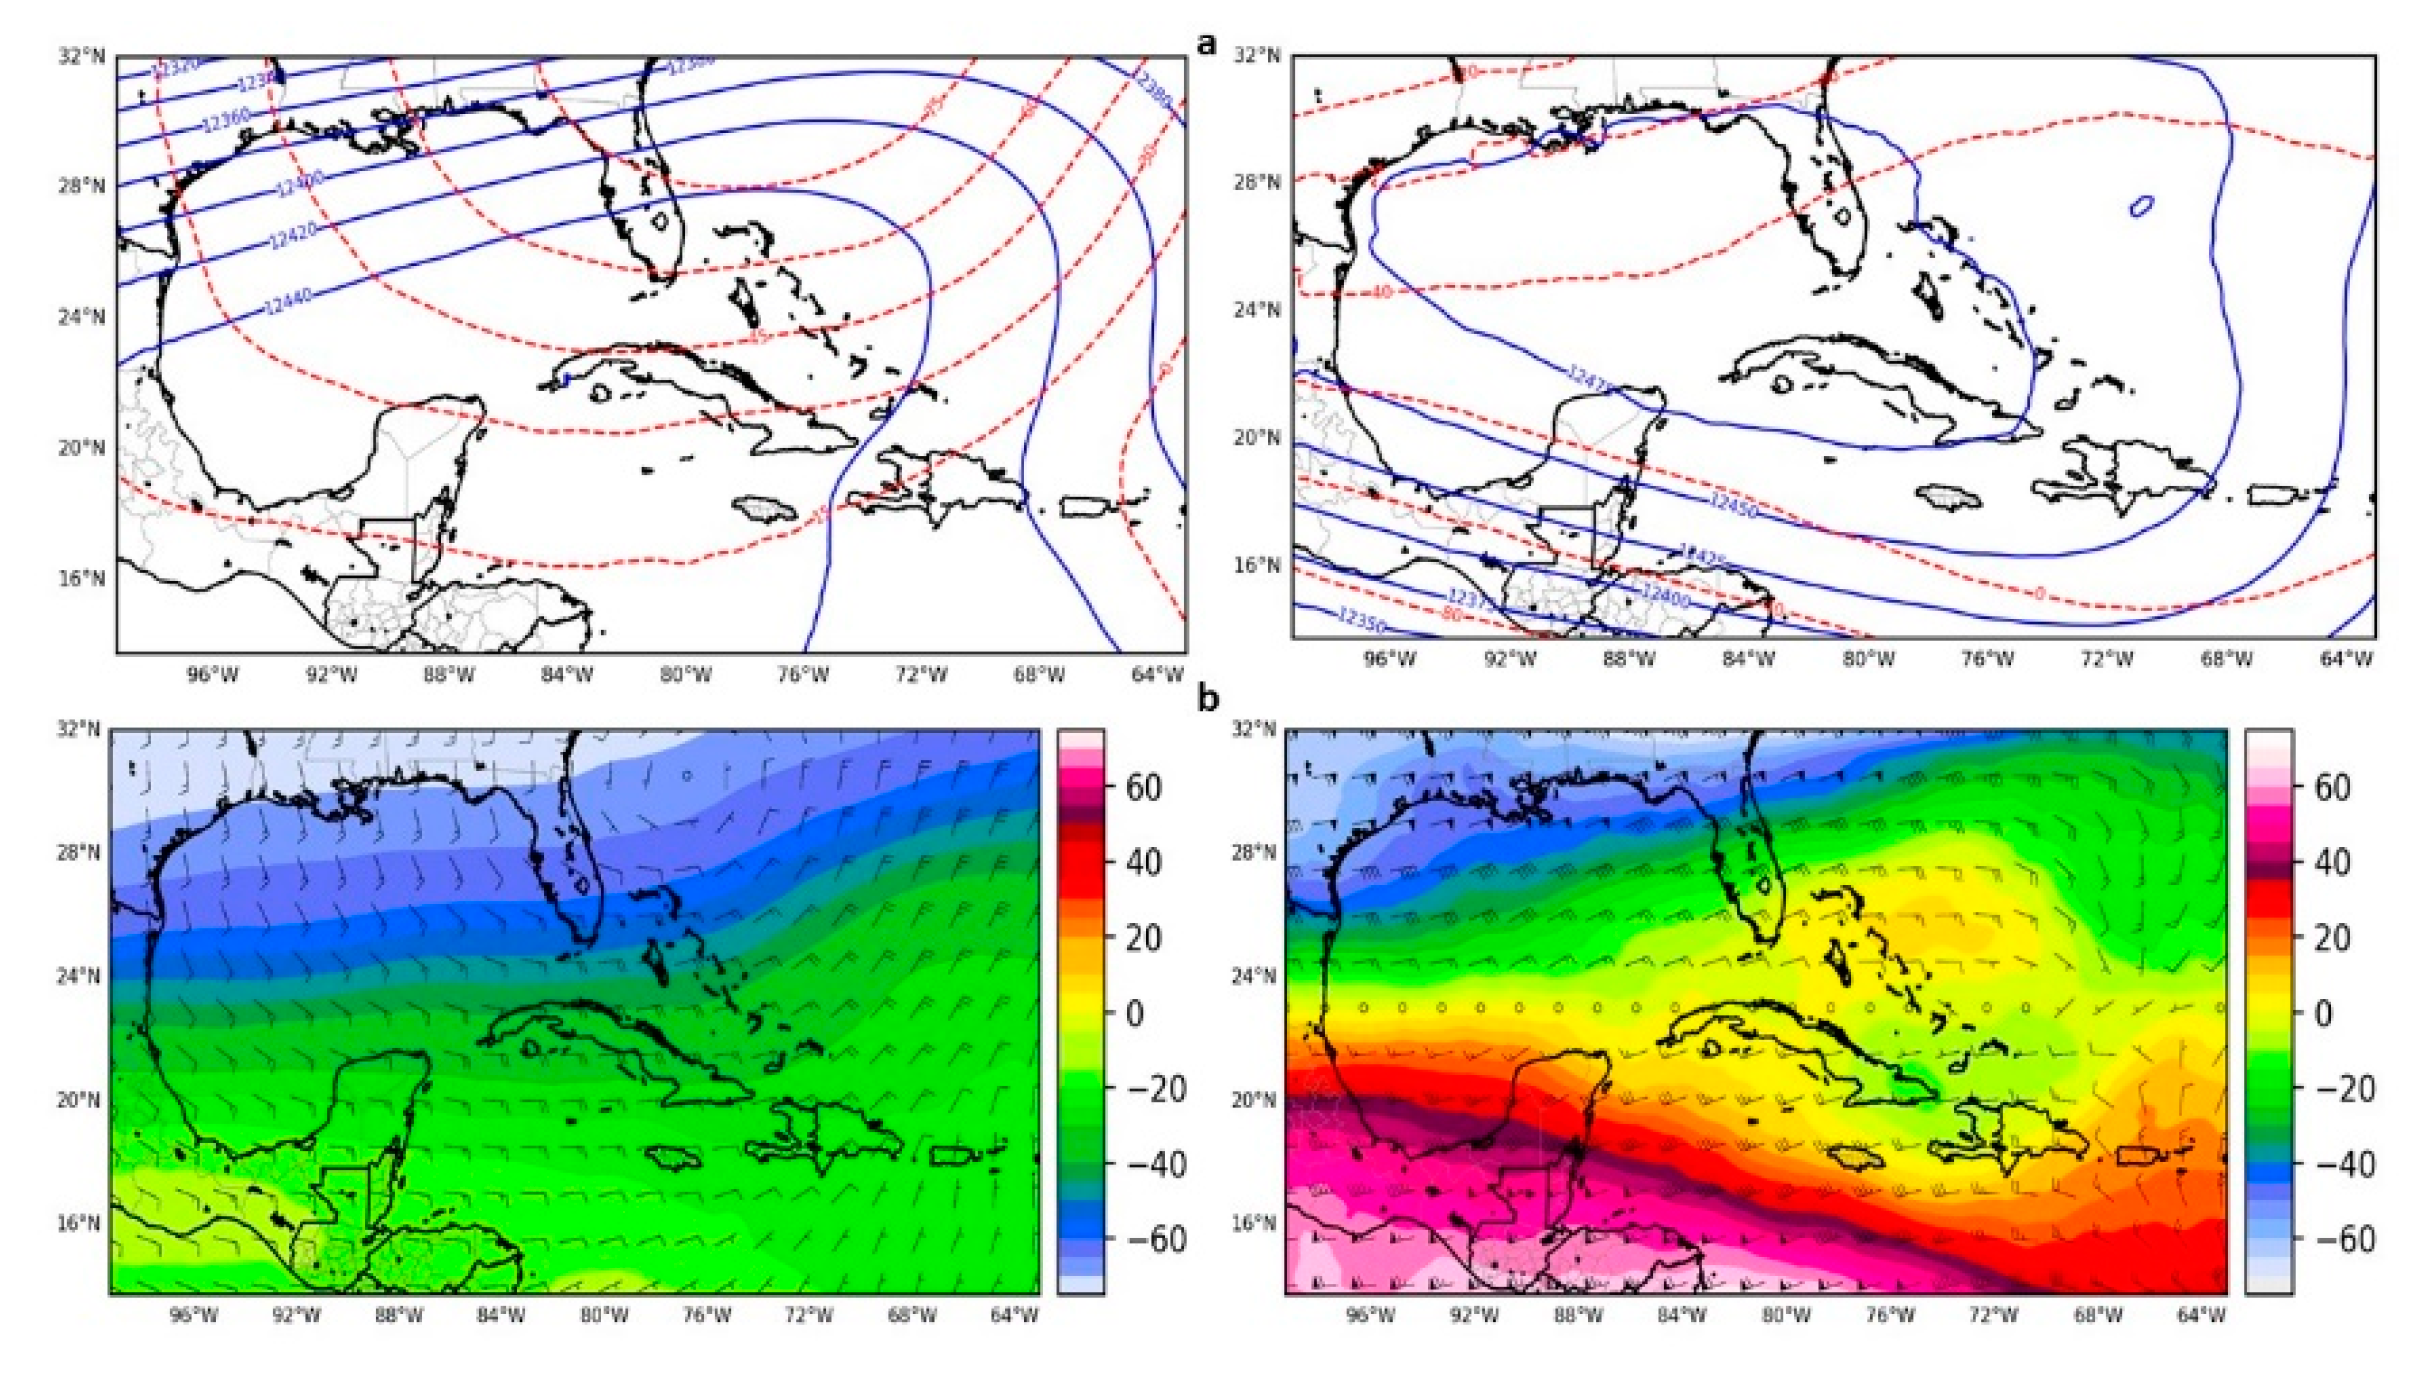
In September and October, the model errors gradually increase on the northern and southern borders of the domain, reaching maximum values in October, but they do not become as high as in May, with the exception of the wind fields. Again, SisPI represents the temperature field well at that level, and the geopotential errors reach positive maximums above 120 m
2/s
2 towards the northern border in October and negative maximums in sectors of the southern border of up to (−80 m
2/s
2) (
Figure 8a). Regarding the wind, the errors acquire characteristics similar to those described in May, although it is observed that they differ in magnitude. Particularly in the month of October, greater errors are observed towards the western border, something that is not revealed in previous months and that suggests deficiencies when it comes to representing the characteristics associated with the Mexican ridge when the subtropical is in contraction (
Figure 8b).
At medium levels, the errors had a similar behavior, being higher in May where, despite being less than the situation obtained at the 200 hPa level, having maximum values of 80 m
2/s
2, SisPI fails in the representation of the sinusoidal flow. It erroneously shows a zone of dorsal, possibly in allusion to the Mexican in the region of the Gulf of Mexico, portions of the west from Cuba and the western Caribbean Sea and a trough area in the southeast quadrant of the domain. This representation contradicts the average obtained for May 2020, which places the trough area and the ridge toward the eastern border of the domain (
Figure 9).
Consequently, with the flow errors represented by SisPI, drier environments were generated in the western half of the domain, although in reality the trend was decreased relative humidity with the exception of small portions of the Atlantic northeast of the Bahamas, where SisPI increased the humidity, probably related to the trough zone that it erroneously represented. The wind speed errors turned out to be insignificant in large areas of the domain and grew coincidentally with the largest localized warming regions over continental America in the upper left corner of the domain (~6 °C) and with the greatest cooling towards the lower left corner (~−6 °C). This has some implications for the SisPI forecasts, particularly in relation to precipitation, whose forecast accuracy has been one of the fundamental objectives of the work team since the creation of the system.
These dorsal conditions and drier environments, especially in the west, could lead to an increase in model failures on May. In June–August, the model makes a more realistic representation of the relative position of systems in the middle layers, where it represents quite accurately the belt of high geopotential values that arises as a consequence of natural expansion of the subtropical ridge and its interaction with the Mexican, which is the most prone to errors because it is located on the west boundary of the domain. For September and October, negative errors were observed north of the Antilles and positive in the central and eastern Caribbean Sea because of deficiencies in the dorsal representation in the upper air characterized by a south displacement of its center with high geopotential values, specifically in the central and eastern Caribbean. This causes errors in the SisPI which forecasts much drier environments over the Caribbean Sea.
At 1000 hPa, a southern relocation of the regions of high geopotential value was observed for May, specifically over the Caribbean Sea. Average flow predicted by SisPI differs from the original pattern, which places the areas of high geopotential values at the north of the Greater Antilles, imposing an almost zonal flow, while SisPI represent a southeast flow over Cuba. Despite this, the geopotential errors at this level are in the −60 to 60 m
2/s
2 order (
Figure 10a).
As a consequence of this, a drier environment is generated in Cuba, fundamentally in the west, which coincides with the previous reasoning, where it is exposed that SisPI inadequately represents the position of the Mexican dorsal. This can bring negative consequences for precipitation forecasts in this month.
In the June–August quarter, the results of the errors do not differ greatly from the characteristics observed at high and medium. Once again, it is corroborated that during summer, SisPI forecasts are usually realistic because stable conditions persists. In September and October, errors increase in the geopotential field, which have two fundamental causes. First, the change of position at the south of the subtropical ridge near the surface and, second, a faster contraction of the anticyclonic ridge occurs, resulting in a greater decrease in the geopotential value in a large part of the domain, mainly in October (
Figure 10). Relative humidity errors were not significant. For temperature forecast, SisPI tends to overestimate towards the northern border, this being one of the most common domain problems. The forecast wind field also does not suffer from very significant errors; however, it stands out that on land the model tends to overestimate speeds in the Antilles and Central America.


