Proceeding Paper

Household Indoor Concentration Levels of Nitrogen Dioxide (NO2) and Ozone (O3) in Eskisehir, Turkey †

Department of Environmental Engineering, Eskisehir Technical University, Eskisehir 26555, Turkey
*
Author to whom correspondence should be addressed.
Presented at the 5th International Electronic Conference on Atmospheric Sciences, 16–31 July 2022; Available online: https://ecas2022.sciforum.net/.
Environ. Sci. Proc. 2022, 19(1), 42; https://doi.org/10.3390/ecas2022-12865
Published: 1 August 2022
(This article belongs to the Proceedings of The 5th International Electronic Conference on Atmospheric Sciences)

Abstract

:
The concentrations of nitrogen dioxide (NO2) and ozone (O3) were determined at five indoor environments (corridor, living area, bedroom, kitchen, bathroom) of two homes located in different regions of Eskisehir, Turkey. Home 1 is located in the city center and urban residential area and Home 2 is located in a suburban area. In order to determine the indoor and outdoor concentration ratios of the pollutants (I/O), outdoor sampling was also carried out simultaneously with indoor sampling. Sampling studies were performed in one-day periods in four seasons using a passive sampling method. The indoor NO2 concentrations varied between 8.80 and 124.18 µg/m3, while O3 concentrations varied between 4.15 and 22.10 µg/m3. The highest NO2 concentrations were determined in the kitchens both in two homes. This can be due to the intensive cooking activities carried out in the kitchens. The variation in O3 concentrations in the measured indoor environments varied in homes. When the outdoor concentrations were examined, it was seen that NO2 concentrations were higher in Home 1 and O3 concentrations were higher in Home 2 in all seasons. This result is related to the location of the homes. The I/O ratios for NO2 were generally >1 for the kitchens. Moreover, all I/O ratios for NO2 in Home 2 were found >1 in autumn season. The I/O ratios for O3 were found to be <1 in both homes in all seasons. Seasonal variations in the pollutant concentration levels were also observed for indoor environments. Indoor NO2 concentrations, especially in Home 1, and O3 concentrations, especially in Home 2, were higher in spring and summer compared to other seasons. The reason for this is thought to be more active natural ventilation due to the warming of the weather in these seasons.

1. Introduction

Indoor air quality (IAQ) is a significant concern due to the amount of time spent indoors. Some studies show that people living in urban environments spend an average of 90% of their time indoors [1,2,3]. Indoor air can be more significantly polluted than outdoor air, even in the biggest and most industrialized cities. For many individuals, the health effects from exposure to indoor air pollution are greater than those outside. IAQ is important because it has a significant impact on human health. Moreover, IAQ is slightly dependent on socioeconomic standing or education level but is highly impacted by variables such as personal products, furniture, and cleaning materials used [4,5]. These conditions may lead to the presence of biological, chemical, and physical pollutants. Ventilation and other techniques are employed to enhance IAQ and minimize pollution; however, ventilation itself may also be considered to be a source of contamination and exposure [6].
According to their physical states, pollutants exist in three basic states and have different qualities and impacts. These are solid, liquid, and gaseous phases. Solid and liquid pollutants are regarded as particle matter. Major gaseous air pollutants are reactive, and participate in photochemical processes or may react directly with material, plant, or biological tissue. They occur as a combination in the atmosphere. Nitrogen dioxide (NO2) and ozone (O3) are among important air contaminants. These harmful gases are released into the atmosphere in large quantities from various sources all around the world.
Indoor NO2 concentrations are directly impacted by high outside concentrations (for example, in cities with increased traffic density) [7]. The proximity of buildings to roads and the proximity of areas used for parking of motor vehicles to homes are among the major sources impacting indoor concentrations [8,9,10]. The most important indoor NO2 sources are combustion processes (heaters, fireplaces, and stoves). Accordingly, indoor NO2 concentrations often exceed outside concentrations [11].
Although O3 is a layer in the upper atmosphere (stratosphere) that protects humans from ultraviolet (UV) radiation, it is a secondary air pollutant formed through a complex series of photochemical reactions that require reactive hydrocarbons, sunlight, and nitrogen dioxide (NO2) in the troposphere. Ozone concentrations are more likely to be lower in areas with motor vehicle exhaust and traffic, whereas NO2 concentrations are higher in these areas. Indoor O3 levels are usually lower when compared to outside levels. Common indoor ozone generators are laser printers, copiers, and electrostatic air cleaners [12,13].
In this study, two homes having different outdoor locations and indoor characteristics were selected in Eskisehir, Turkey. Indoor NO2 and O3 sampling studies were performed in five various microenvironments such as the corridor, living room, bedroom, kitchen, and bathroom in each home. In addition to indoor sampling studies, outdoor samplings were also carried out simultaneously to evaluate the effect of outdoor air on indoor air and to determine indoor/outdoor (I/O) ratios for NO2 and O3. Sampling studies were repeated in four seasons, i.e., winter, spring, summer, and autumn.

2. Materials and Method

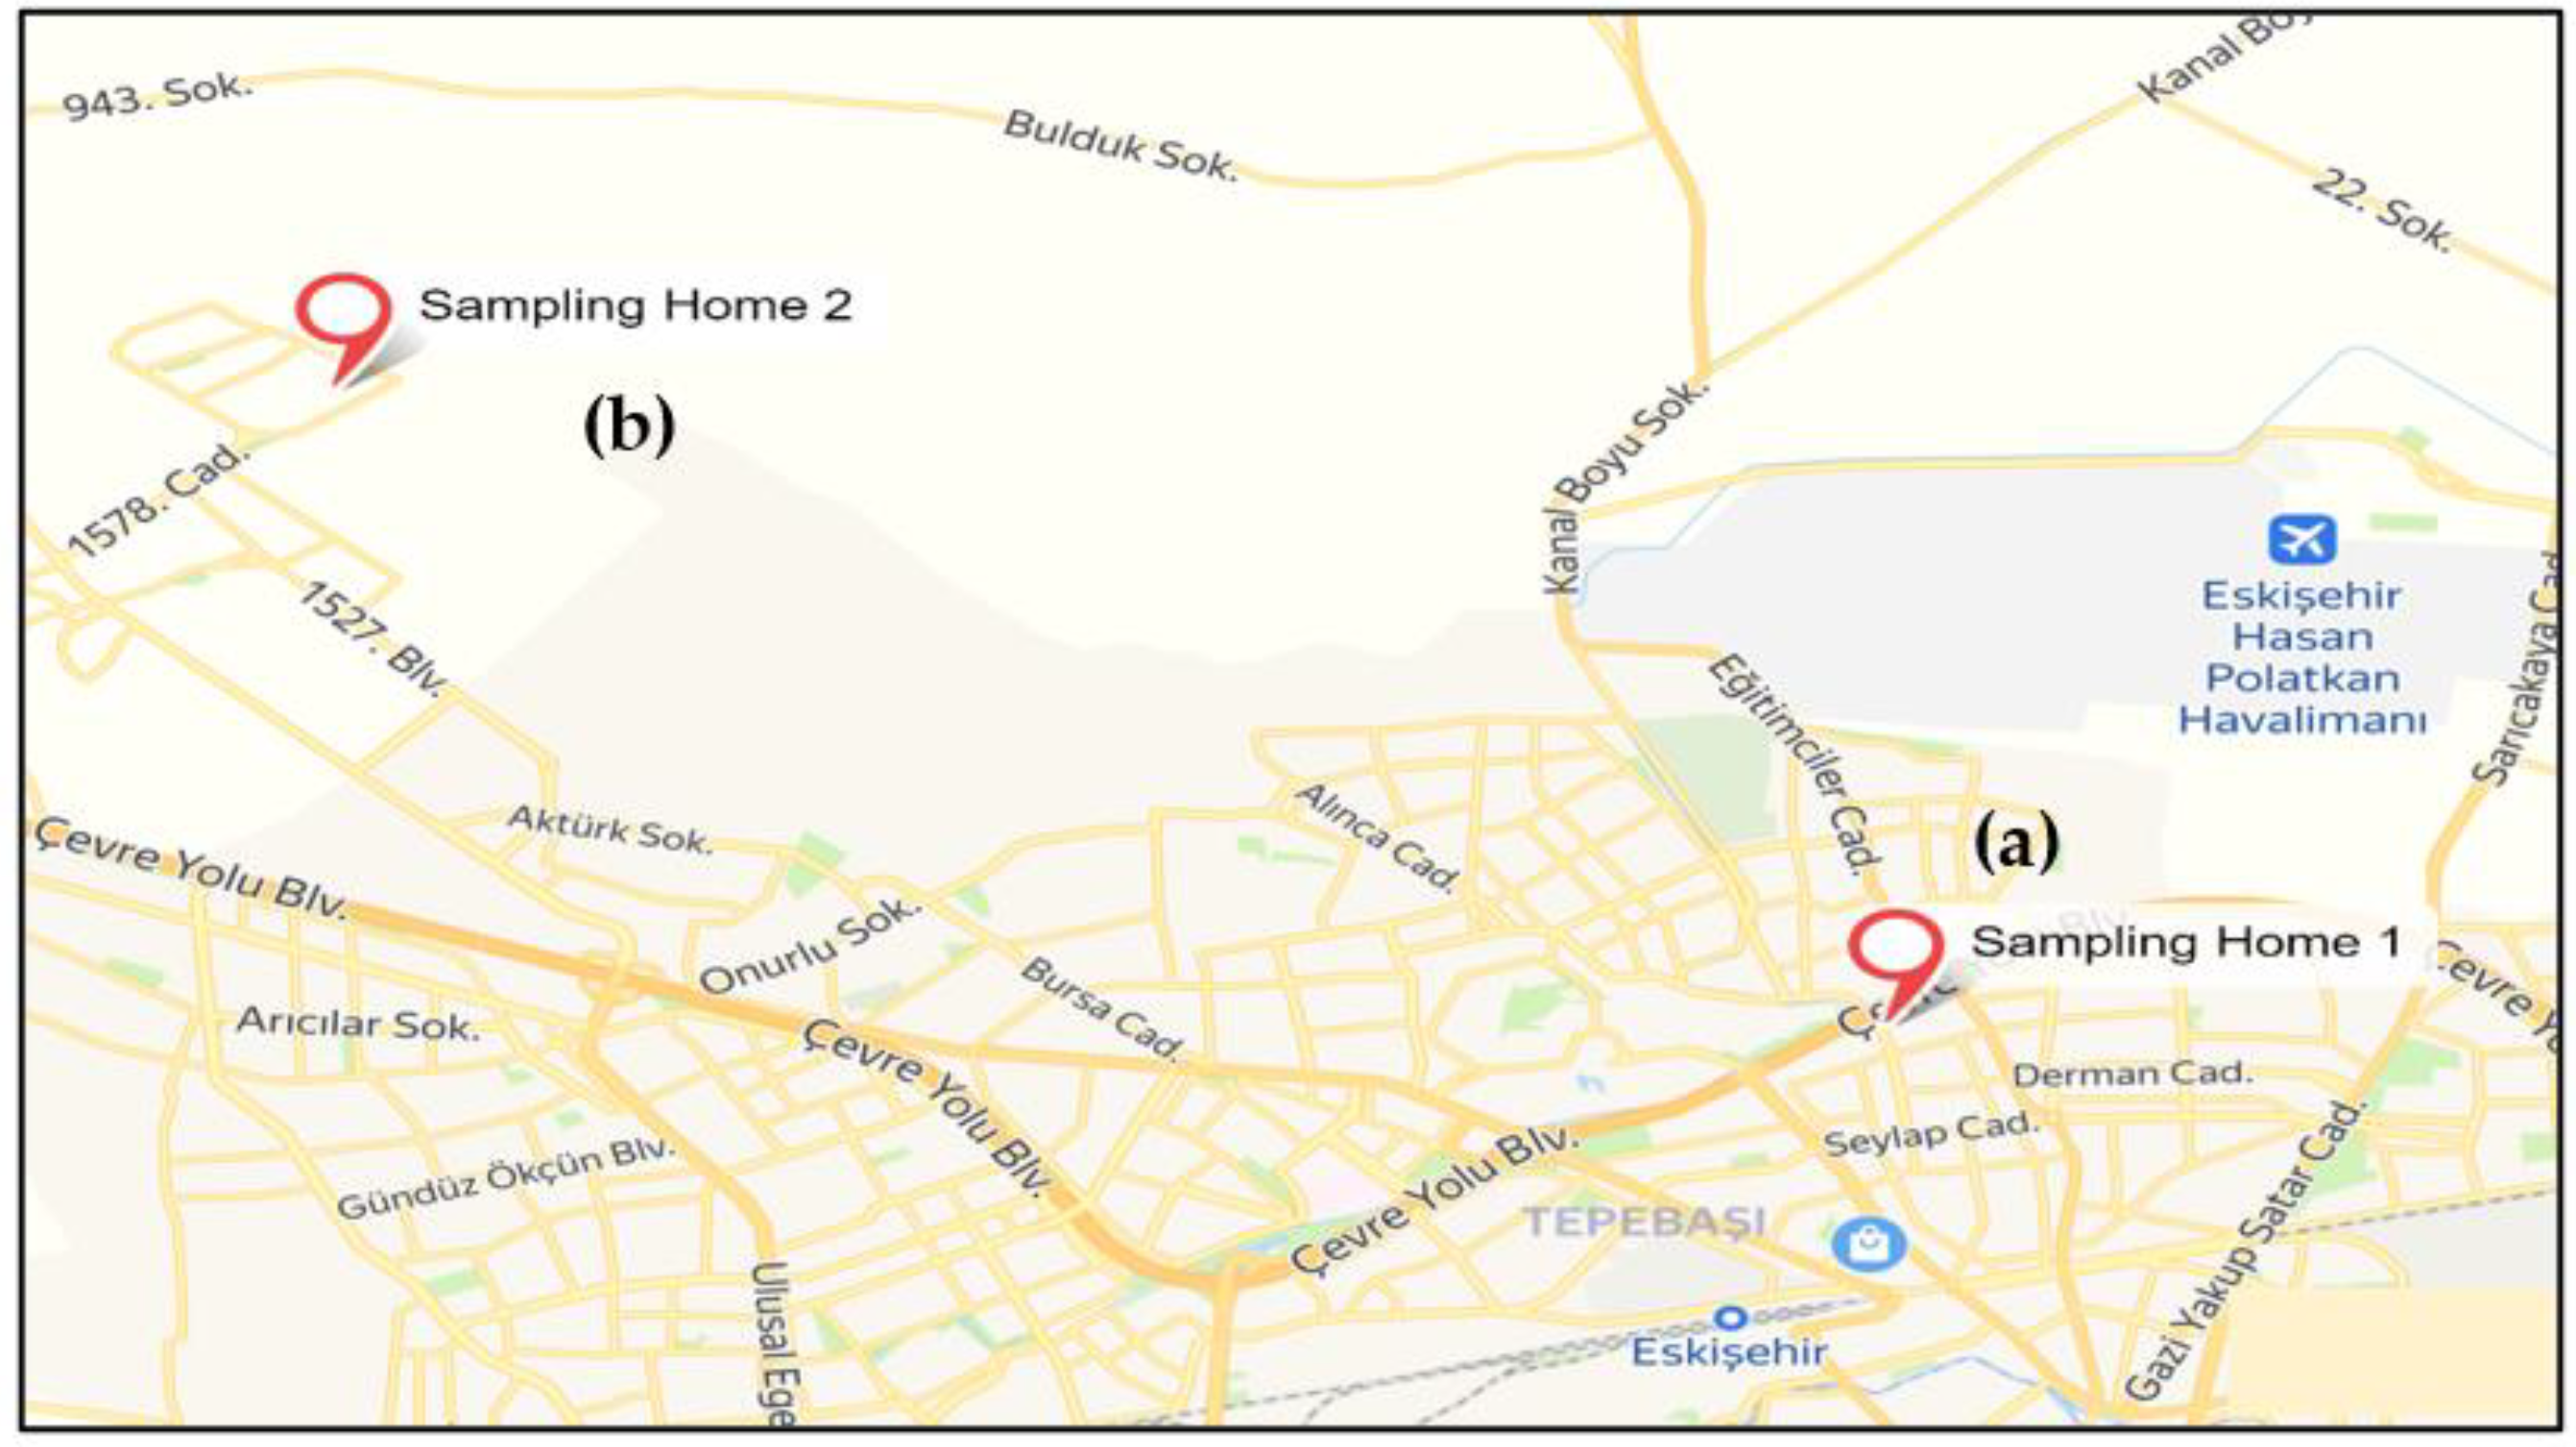
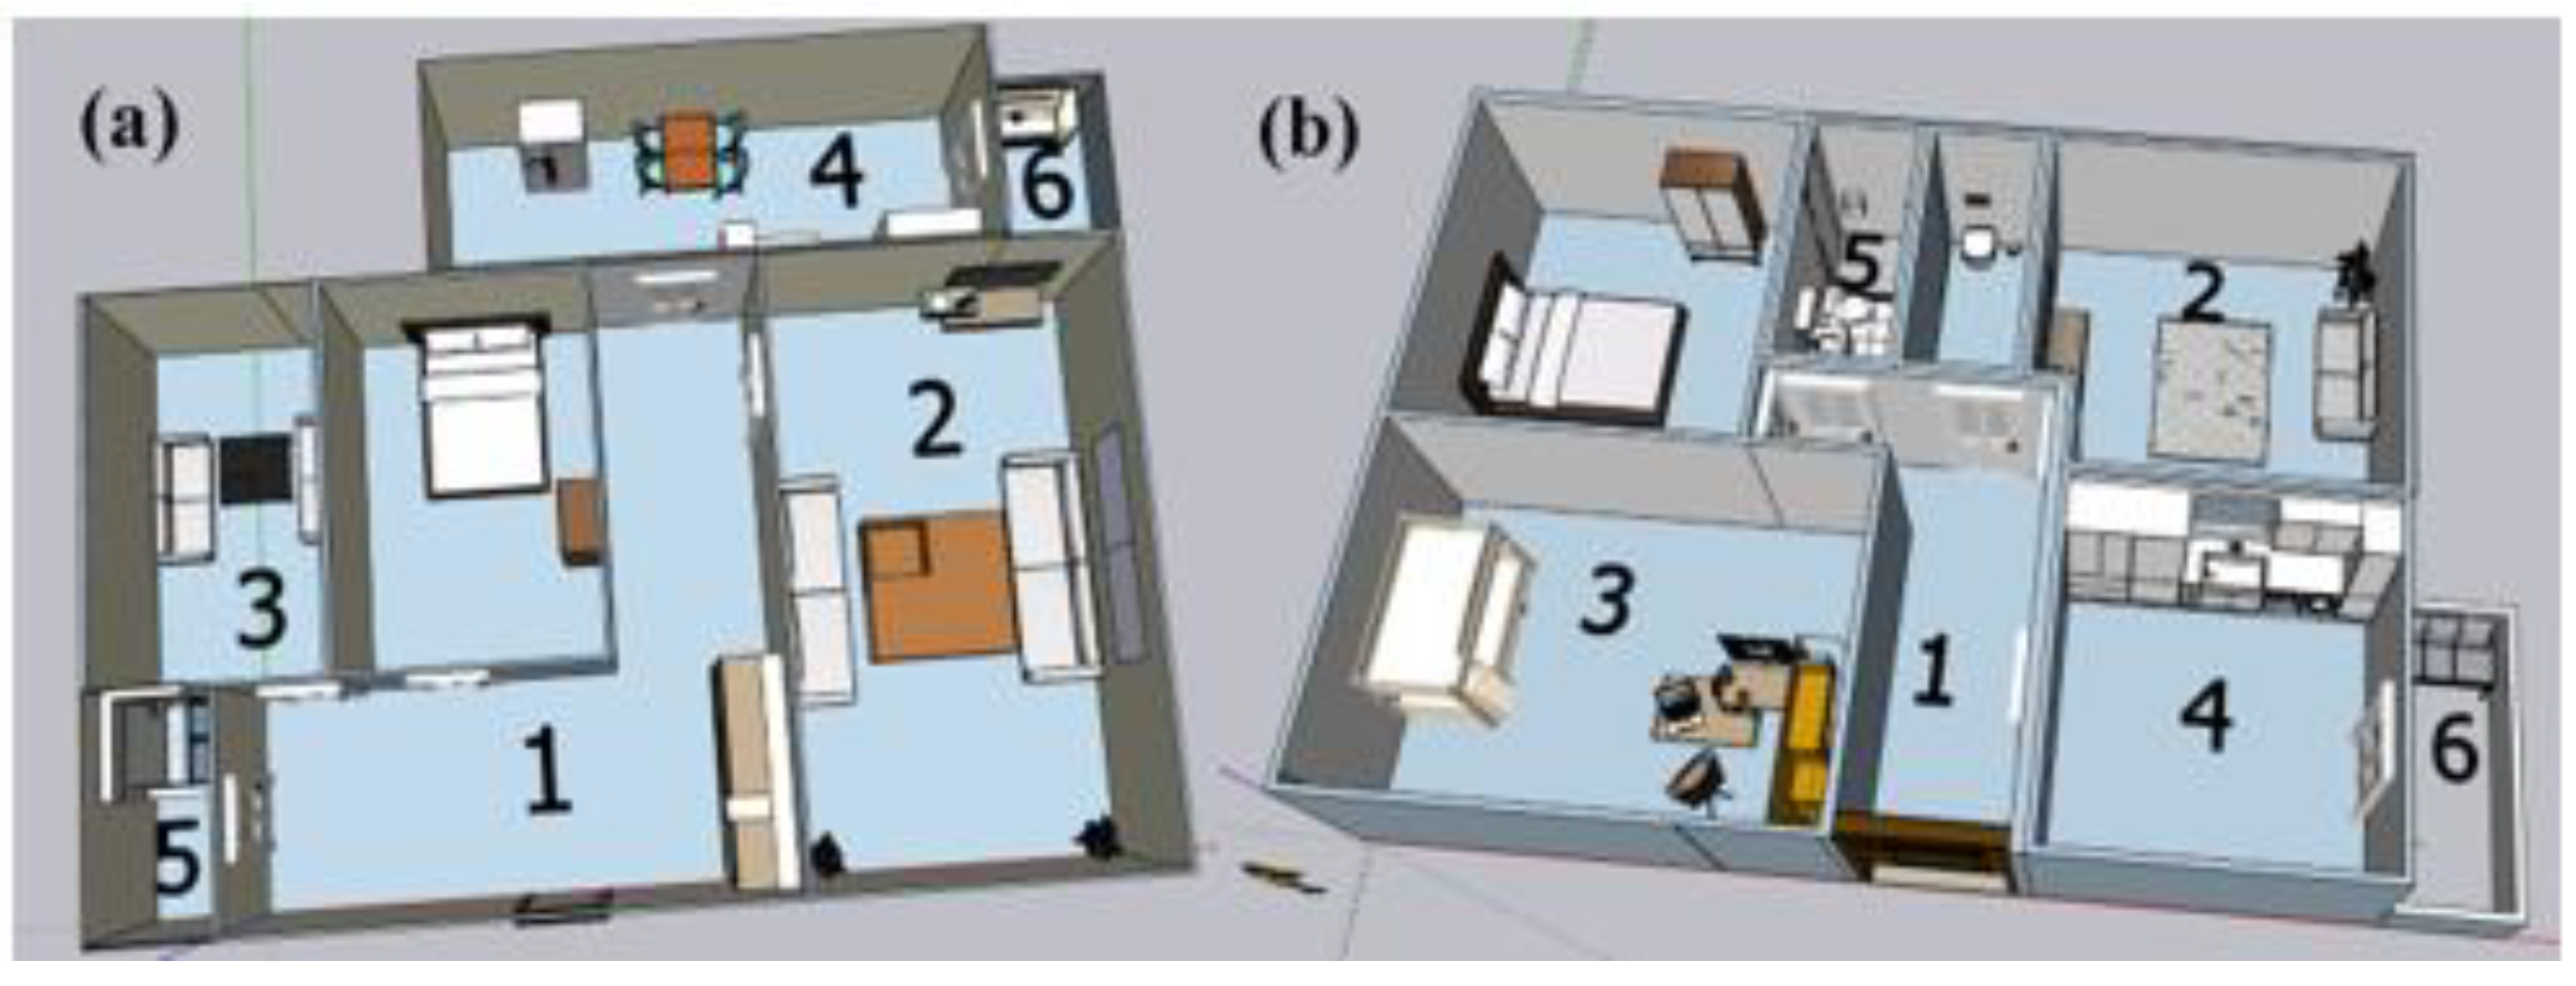
2.1. Characteristics of the Selected Homes

In this study, indoor and outdoor NO2 and O3 concentrations were determined in two selected homes in Eskisehir, Turkey. Some parameters such as the number of people living and working at the homes, the size and locations of the homes, and the number of the rooms were considered when choosing homes. Twenty-four-hour sampling was carried out in the living room, bedroom, kitchen, bathroom, and corridor in each home. The Google Earth view of the homes included in the study is shown in Figure 1.
Specific characteristics of each home are given in Table 1, and the floor plans and sampling points of the selected homes are shown in Figure 2.

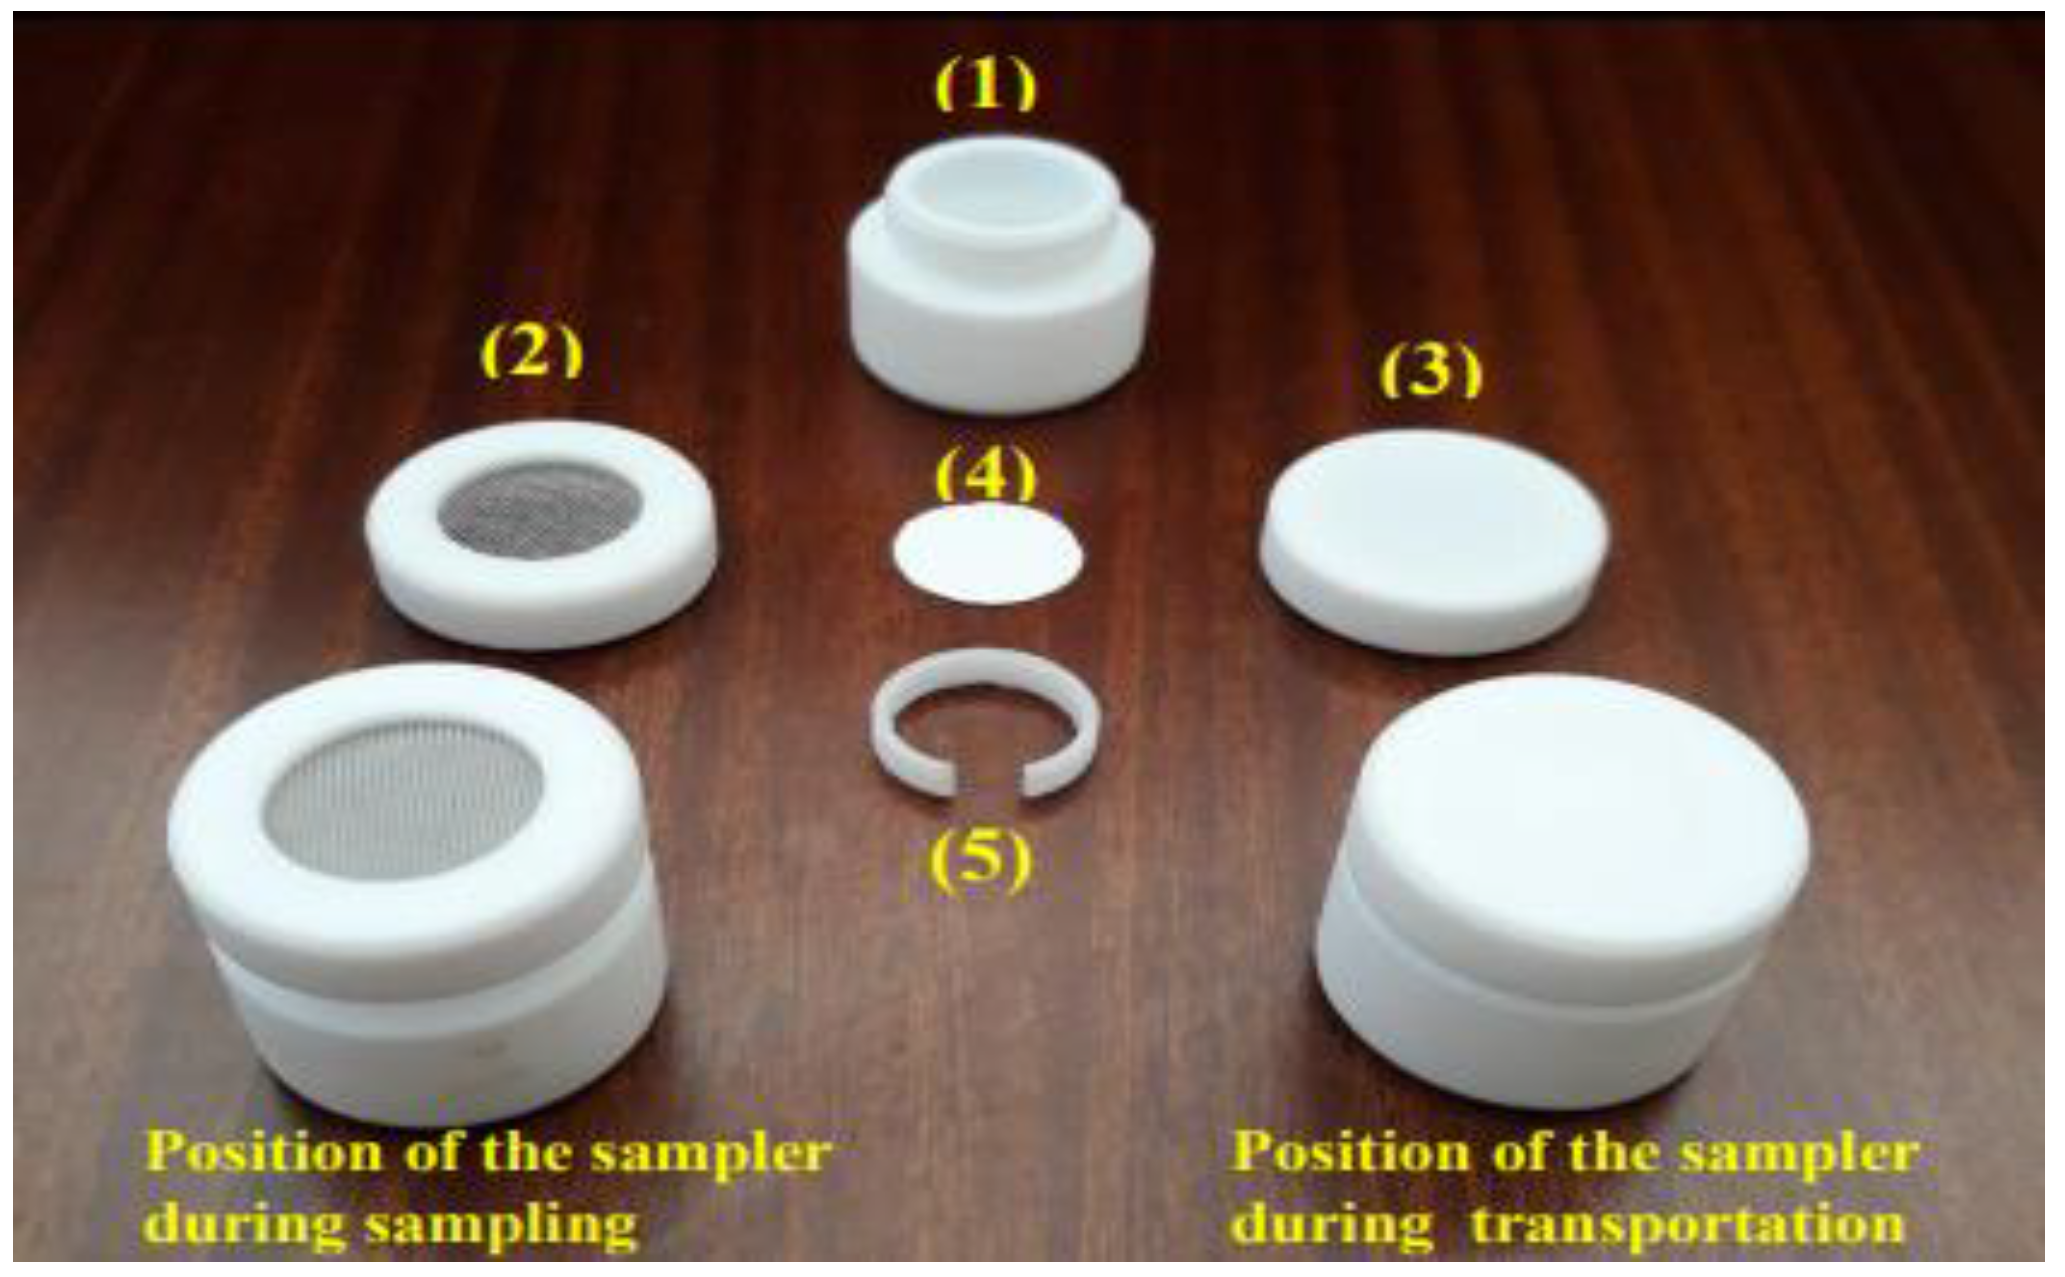
2.2. Sampling Program and Method

In this study, the concentrations of inorganic gas pollutants were determined by a passive sampling technique in different microenvironments (corridor, living room, bedroom, kitchen and, bathroom) of 2 different homes. Twenty-four-hour passive sampling studies were carried out in four seasons, i.e., winter, spring, summer, and autumn. The most suitable sampling point was determined for each indoor environment to best represent the air of the environment to be sampled, and passive samplers were placed at the same points in each sampling period. Indoor and outdoor samplings were performed simultaneously.
The passive samplers used in the study were developed and validated by Eskisehir Technical University Environmental Engineering Department Air Quality Research Group [14,15,16,17,18]. The main parts of the passive sampler are: (1) sampler body, (2) stainless steel mesh barrier, (3) closed cap, (4) filter paper impregnated with specific solution, and (5) fixer ring. The passive sampler body was manufactured from polytetrafluoroethylene (PTFE) for NO2 and delrin for O3. As a collecting medium, Whatman GF/A glass fiber filter papers impregnated with 20% Triethanolamine (TEA) aqueous solution for NO2, and aqueous solution containing 1% NaNO2, 2% Na2CO3, and 2% glycerol for O3, were used. Figure 3 shows an example of the NO2 passive sampler and its parts [19].
Extractions were performed before the analyses of the samples. Extractions of NO2 filter papers were carried out in 10 mL ultrapure water (Milli Q) + 20 µL 35% H2O2 (Merck) solution, and O3 filter papers were extracted in 10 mL ultrapure water (Milli Q) for 15 min. All samples were analyzed using Dionex ICS-1100 ion chromatography.

3. Results and Discussion

3.1. Indoor–Outdoor NO2 and O3 Concentrations

Table 2 shows the determined indoor and outdoor NO2 concentrations. For Home 1, during winter, spring, and autumn, the highest concentrations were measured in the kitchen (26.73, 51.37, and 54.00 μg/m3). The kitchen’s higher exposure to heavy traffic than other rooms, in addition to ventilation provided by opening windows, and cooking and using a stove for breakfast and dinner, are considered to be the causes of high concentrations measured in the kitchen at Home 1. For the summer season, the highest concentration was found in the living room (52.31 μg/m3). The reason for this high concentration may be that the living room is located closer to the street and is under the influence of traffic due to natural ventilation. For Home 2, the highest NO2 concentrations were observed in the kitchen in all seasons. Seasonal variations in the indoor concentrations were observed for both homes. When the outdoor concentrations were examined, the highest concentration was measured for Home 1 in the winter season and for Home 2 in the autumn season. Because the outdoor area is under the influence of more traffic due to its location, its concentrations, measured for Home 1, were found to be higher in all seasons.
Table 3 shows O3 concentrations measured indoors. For Home 1, during winter, spring, and summer, the highest concentrations were measured in the kitchen (6.35, 9.51, 11.34 μg/m3, respectively). The highest concentration was found in the bedroom in autumn (9.08 μg/m3). For Home 2, during winter, spring, and summer, the highest concentrations were measured in the kitchen (6.84, 11.01, 22.10 μg/m3, respectively). The highest concentration was found in the corridor in autumn (7.36 μg/m3). The most important source of indoor ozone pollution was the outdoor air. Moreover, the absence of major indoor ozone sources, such as printers, photocopiers, and many other devices and appliances designed for indoor use (e.g., air cleaners), is the reason for lower indoor than outdoor ozone concentrations. In addition, the age of a building and various housing aspects (carpeting, air conditioning, window fans, and window openings) have been significantly associated with indoor ozone levels. When the outdoor concentrations were examined, it was seen that the concentrations measured for Home 2, which is located far away from the city center, were higher than those of Home 1. Due to significantly elevated outdoor ozone concentrations during summer, summer indoor concentrations are typically elevated. The results of this study also support this situation.

3.2. NO2 and O3 Indoor/Outdoor Concentration Ratios (I/O)

Table 4 shows indoor/outdoor NO2 concentration ratios (I/O). All ratios were <1, except for the ratio found for the kitchen in spring and summer, and that of the living room in the summer at Home 1. The reason for this is that Home 1 is in a high-traffic location, and the outside NO2 concentrations are higher in almost every season than in the indoor environment. Moreover, all I/O ratios for NO2 in Home 2 were found to be >1 in the autumn season.
Table 5 shows indoor/outdoor O3 concentration ratios. For both homes, the I/O ratios for all seasons were <1. This result indicates that there is no significant indoor source of O3 in either home. The ratios found for Home 2 were lower than the ratios found for Home 1. The most important reason for this is the higher outdoor concentrations in Home 2.

4. Conclusions

As a result of the pandemic, people have spent most of their time at homes. For this reason, many people have been more exposed to indoor air pollution than outdoor air pollution, and have thus been affected more. This study was carried out during the COVID-19 pandemic period. In this study, simultaneous indoor–outdoor NO2 and O3 concentrations and indoor/outdoor ratios (I/O) were determined for different home microenvironments in Eskisehir, Turkey. The highest NO2 concentrations were found in the kitchens of both homes. This could be due to the intensive cooking activities that occur in the kitchens. O3 concentrations measured in indoor environments varied depending on the season and also the environment. The reason for this may be the locations of the selected homes and the temperature changes in the seasons. In general, seasonal variations in the pollutant concentrations were observed in indoor environments. In spring and summer, indoor NO2 concentrations, especially in Home 1, and O3 concentrations, particularly in Home 2, were higher than in other seasons. It is thought that the reason for this is that natural ventilation was more active during these seasons due to the warming of the weather. When the outdoor concentrations were evaluated, it was found that NO2 concentrations were higher in Home 1 and O3 concentrations were higher in Home 2 in all seasons. The reason for this is the location of the homes and, accordingly, the level of the impact of traffic density.

Author Contributions

The data presented in this study includes a part of the master thesis carried out by S.N.S. in Eskisehir Technical University. Other authors also serve as thesis advisors (Ö.Ö.Ü. is 1st advisor, S.M. is 2nd advisor). All authors have read and agreed to the published version of the manuscript.

Funding

This research is funded by Eskisehir Technical University Research Fund (22ADP080).

Institutional Review Board Statement

Not applicable.

Informed Consent Statement

Not applicable.

Data Availability Statement

The datasets generated during and/or analyzed during the current study are available from the corresponding author on reasonable request.

Conflicts of Interest

The authors declare that there is no conflict of interest.

References

  1. Diffey, B.L. An overview analysis of the time people spend outdoors. Br. J. Dermatol. 2011, 164, 848–854. [Google Scholar] [CrossRef] [PubMed]
  2. Klepeis, N.E.; Nelson, W.C.; Ott, W.R.; Robinson, J.P.; Tsang, A.M.; Switzer, P.; Behar, J.V.; Hern, S.C.; Engelmann, W.H. The National Human Activity Pattern Survey (NHAPS): A resource for assessing exposure to environmental pollutants. J. Expo. Sci. Environ. Epidemiol. 2001, 11, 231–252. [Google Scholar] [CrossRef] [PubMed]
  3. World Health Organization. Children’s Health and the Environment. Available online: http//www.who.int/ceh (accessed on 16 June 2022).
  4. Fadeyi, M.O.; Weschler, C.J.; Tham, K.W.; Wu, W.Y.; Sultan, Z.M. Impact of human presence on secondary organic aerosols derived from ozone-initiated chemistry in a simulated office environment. Environ. Sci. Technol. 2013, 47, 3933–3941. [Google Scholar] [CrossRef] [PubMed]
  5. Weschler, C.J. Roles of the human occupant in indoor chemistry. Indoor Air 2016, 26, 6–24. [Google Scholar] [CrossRef] [PubMed]
  6. Seguel, J.M.; Merrill, R.; Seguel, D.; Campagna, A.C. Indoor air quality. Am. J. Lifestyle Med. 2017, 11, 284–295. [Google Scholar] [CrossRef] [PubMed]
  7. WHO. WHO Guidelines for Indoor Air Quality: Selected Pollutants; World Health Organization, Regional Office for Europe: Copenhagen, Denmark, 2010. [Google Scholar]
  8. Janssen, N.A.H.; van Vliet, P.H.N.; Aarts, F.; Harssema, H.; Brunekreef, B. Assessment of exposure to traffic related air pollution of children attending schools near motorways. Atmos. Environ. 2001, 35, 3875–3884. [Google Scholar] [CrossRef]
  9. Kodama, Y.; Arashidani, K.; Tokui, N.; Kawamoto, T.; Matsuno, K.; Kunugita, N.; Minakawa, N. Environmental NO2 concentration and exposure in daily life along main roads in Tokyo. Environ. Res. 2002, 89, 236–244. [Google Scholar] [CrossRef] [PubMed]
  10. Nakai, S.; Nitta, H.; Maeda, K. Respiratory health associated with exposure to automobile exhaust. II. Personal NO2 exposure levels according to distance from the roadside. J. Expo. Anal. Environ. Epidemiol. 1995, 5, 125–136. [Google Scholar] [PubMed]
  11. Kattan, M.; Gergen, P.J.; Eggleston, P.; Visness, C.M.; Mitchell, H.E. Health effects of indoor nitrogen dioxide and passive smoking on urban asthmatic children. J. Allergy Clin. Immunol. 2007, 120, 618–624. [Google Scholar] [CrossRef] [PubMed]
  12. Aviado, D.M.; Salem, H. Acute effects of air pollutants on the lungs. Arch. Environ. Health Int. J. 1968, 16, 903–907. [Google Scholar] [CrossRef] [PubMed]
  13. Lippmann, M. Health effects of tropospheric ozone. Environ. Sci. Technol. 1991, 25, 1954–1962. [Google Scholar] [CrossRef]
  14. Bozkurt, Z.; Üzmez, Ö.Ö.; Döğeroğlu, T.; Artun, G.; Gaga, E.O. Atmospheric concentrations of SO2, NO2, ozone and VOCs in Düzce, Turkey using passive air samplers: Sources, spatial and seasonal variations and health risk estimation. Atmos. Pollut. Res. 2018, 9, 1146–1156. [Google Scholar] [CrossRef]
  15. Özden, Ö.; Döğeroğlu, T. Performance evaluation of a tailor-made passive sampler for monitoring of tropospheric ozone. Environ. Sci. Pollut. Res. 2012, 19, 3200–3209. [Google Scholar] [CrossRef] [PubMed]
  16. Özden, Ö.; Dogeroglu, T. A field evaluation of a passive sampler for the simultaneous determination of NO2 and SO2 in anurban and rural area. WSEAS Trans. Environ. Dev. 2006, 2, 1008–1015. [Google Scholar]
  17. Üzmez, Ö.Ö. Atmosferik Uçucu Organik Bileşiklerin Ölçümü Için Pasif Örnekleyici Geliştirilmesi ve Kullanımı; Anadolu University: Eskisehir, Turkey, 2015. [Google Scholar]
  18. Özden, Ö. Hava Kalitesinin Monitorlanmasinda Pasif Örnekleyicilerin Kullanılması; Anadolu University: Eskisehir, Turkey, 2015. [Google Scholar]
  19. Üzmez, Ö.Ö. Atmospheric Concentrations of Inorganic Pollutants (NO2, SO2 and ozone) in Eskisehir: Spatial and Vertical Variations, Weekday-Weekend Differences. Anadolu Univ. J. Sci. Technol. A-Appl. Sci. Eng. 2018, 19, 523–535. [Google Scholar]
Figure 1. The homes included in the study: (a) the location of the first home (Home 1) in Bahçelievler neighborhood; (b) the location of the second home (Home 2) in Aşağı Söğütönü neighborhood.
Environsciproc 19 00042 g001
Figure 2. Floor plan and indoor–outdoor sampling points in: (a) home 1; (b) home 2. 1: Corridor, 2: Living Room, 3: Bedroom, 4: Kitchen, 5: Bathroom, 6: Outdoor.
Environsciproc 19 00042 g002
Figure 3. Parts of the tailor-made passive sampler [19].
Environsciproc 19 00042 g003
Table 1. Specific characteristics of the selected homes.
HomeThe Size and FloorVentilation TypeSampling PointsLocationNumber of People Living in the Home
Home 185 m2. On the 4th floor of a 4-storey buildingAspirator and natural ventilationCorridor, living room, bedroom, kitchen, bathroom and outdoorIn an urban residential area. Fifty meters away from Eskisehir (E90-D200) belt highway. High population and traffic density3 people live in this home. Two of them are actively going to work
Home 290 m2. On the 1st floor of a 4-storey buildingAspirator and natural ventilationCorridor, living room, bedroom, kitchen, bathroom and outdoorIn a suburban area, 10 km from the city center. Low population and traffic density4 people live in this home. One of them is actively working and one of them is a student
Table 2. Indoor–outdoor NO2 concentrations (μg/m3) for selected homes for each season.
WinterSpringSummerAutumn
Home 1
Corridor14.2731.9839.5838.27
Living Room14.6526.9152.3134.78
Bedroom9.9525.3438.9133.24
Kitchen26.7351.3740.9354.00
Bathroom8.8024.0438.7925.77
Outdoor88.7439.0740.7054.46
Home 2
Corridor16.8822.6812.1951.91
Living Room12.0715.7615.2375.03
Bedroom14.4618.8212.8163.41
Kitchen31.5141.7322.60124.18
Bathroom11.0112.6711.6777.98
Outdoor34.4024.6229.8942.54
Table 3. Indoor–outdoor O3 concentrations (μg/m3) for selected homes for each season.
WinterSpringSummerAutumn
Home 1
Corridor5.815.907.126.88
Living Room5.897.728.358.43
Bedroom4.616.868.739.08
Kitchen6.359.5111.346.27
Bathroom4.916.416.915.48
Outdoor62.9873.8161.9355.91
Home 2
Corridor4.639.7411.297.36
Living Room4.158.7713.465.40
Bedroom5.579.3612.985.53
Kitchen6.8411.0122.106.18
Bathroom5.149.0910.226.65
Outdoor95.99169.36157.86133.60
Table 4. Indoor/outdoor ratios of NO2 concentrations.
WinterSpringSummerAutumn
Home 1
Corridor0.160.820.970.70
Living Room0.170.691.290.64
Bedroom0.110.650.960.61
Kitchen0.301.311.010.99
Bathroom0.10.610.950.47
Home 2
Corridor0.490.920.411.22
Living Room0.350.640.511.76
Bedroom0.420.760.431.49
Kitchen0.921.700.762.92
Bathroom0.320.510.391.83
Table 5. Indoor/outdoor ratios of O3 concentrations.
WinterSpringSummerAutumn
Home 1
Corridor0.090.080.110.12
Living Room0.090.100.130.15
Bedroom0.070.090.140.16
Kitchen0.100.130.180.11
Bathroom0.080.090.110.10
Home 2
Corridor0.050.060.070.06
Living Room0.040.050.090.04
Bedroom0.060.060.080.04
Kitchen0.070.070.140.05
Bathroom0.050.050.060.05
Publisher’s Note: MDPI stays neutral with regard to jurisdictional claims in published maps and institutional affiliations.

