Article

Unintentional Recharge of Aquifers from Small Dams and Dykes in Spain: A GIS-Based Approach to Determine a Fractional Volume

by
Enrique Fernández Escalante
1,*,
José David Henao Casas
1,2,
Carlos Moreno de Guerra Per
3,
María Dolores Maza Vera
3 and
Carles Moreno Valverde
3
1
Tragsa I+D+i, Maldonado 58, 28006 Madrid, Spain
2
Agro-Engineering Department, Escuela Técnica Superior de Ingeniería Agronómica, Alimentaria y de Biosistemas, Universidad Politécnica de Madrid, Av. Puerta de Hierro 2–4, 28040 Madrid, Spain
3
Tragsatec, Julián Camarillo 6b, 28037 Madrid, Spain
*
Author to whom correspondence should be addressed.
Earth 2023, 4(3), 584-605; https://doi.org/10.3390/earth4030031
Submission received: 26 June 2023 / Revised: 3 August 2023 / Accepted: 7 August 2023 / Published: 14 August 2023

Abstract

:
Conducting an accurate hydrological water balance at the regional and country-wide scales is paramount to assessing available water resources and adequately allocating them. One of the main components of these balances is the anthropogenic recharge of groundwater either intentionally, through managed aquifer recharge (MAR), or unintentionally, where infiltration from dams and dykes can play a significant role. In Spain, proper management of water resources is critical due to the arid to semiarid conditions prevalent in most of the territory and the relevance of water resources for maintaining a robust agricultural sector. Previous work estimated country-wide recharge from MAR at 150 to 280 Mm3/year. Recently, water authorities pointed out that, according to hydrological water balances, the total unintentional recharge volume from water courses may exceed 500 Mm3/year. The present research aims to present a new inventory of transverse structures (also referred to as small dams and dykes) in Spain and use it to estimate country-wide unintentional recharge. The inventory, compiled by the Spanish Ministry for the Ecological Transition and the Demographic Challenge, has 27,680 structures and includes construction and impoundment characteristics, which allow for estimating the wet perimeter and the infiltration area. To this end, structural data from the inventory were crossed through map algebra in a GIS environment with thematic layers, such as lithology, permeability, the digital elevation model, the transverse structures’ wetted area, the average groundwater levels, and a clogging correction factor. Two analytical formulas to compute infiltration from small dams and dykes were tested. The resulting volume of unintentional recharge from transverse structures ranges between 812.5 and 2716.6 Mm3/year. The comparison against regional and national water balances suggests that the lowest value of the range (i.e., 812.5 Mm3/year) is probably the most realistic. Anthropogenic recharge from MAR and transverse structures is likely in the range of 1012.5–1514.8 Mm3/year. This rough figure can help close the hydrological balance at the national and river basin levels and contribute to calibrating regional models. Furthermore, they provide an order of magnitude for anthropogenic recharge at a national scale, which is difficult to obtain.

1. Introduction

Aquifers can be anthropogenically recharged, either unintentionally or intentionally. Unintentional aquifer recharge can occur via diverse processes, such as percolation through dams, irrigation returns, leakage from sewer and water supply systems, and wastewater disposal, among others. Intentional aquifer recharge is conducted through a variety of methods that entail infiltrating water through permeable surfaces, either through the vadose zone, or directly into the aquifer by means of injection systems [1]. This sort of intentional recharge is often called managed aquifer recharge (MAR) or artificial recharge.
The amount of anthropogenic recharge can be a considerable component of the hydrological balance and make up a large percentage of the annual recharge of a region or even a country.
In Spain, a nation where water stress is tangible across many surface and groundwater bodies, regional water budgets are of paramount importance to properly manage and allocate water resources. In this context, there were various attempts to estimate the contribution of dams of various sizes (also referred to as transverse structures) and MAR systems to groundwater recharge.
Apart from a few large-scale operational schemes located in the regions of Castile and Leon, and Catalonia [1], most of the major MAR implementations in Spain were built experimentally. According to the DINAMAR project [1,2], the total volume of water infiltrated in Spain through MAR (considering 32 schemes) and a primary inventory of nearly 800 dykes, is 380 Mm3/year [1,3,4,5]. During the 2020 CONAMA conference, the Spanish water authorities estimated this value at about 500 Mm3/year [3]. Other references suggest a lower amount in the order of 50 Mm³/year [6]. Recharge from MAR and dykes and dams in urban and forested areas (aimed to flood mitigation and groundwater recharge) were also estimated at 350 Mm³/year [7] and 380 Mm³/year [1,2,7]. The infiltration through the bottom of large dams, which in the Spanish territory ranges between 800 Mm3/year [3] and 1400 Mm³/year [8,9,10], is not included in these estimations, as usually it is considered dammed volumes in large scale water balances.
Given the relatively small recharge volume that MAR represents compared to other sources of unintentional recharge [1,3,7], the mismatch in the estimations above is attributed, principally, to the difference in the number of transversal structures considered and the methodologies employed.
This article has two main objectives: (1) to present the inventory of transverse structures by the Spanish Ministry for the Ecological Transition and the Demographic Challenge (MITERD) and Tragsatec; and (2), to provide a rough calculation of the (un)managed aquifer recharge caused by cross-cutting river structures, such as dykes and small dams over the Peninsular Spanish territory (a total area 492,175 km2).
To the first end, the transversal structure inventory conducted by the MITERD is presented and described [11,12,13], exploring the methodology employed, the attributes provided for each transversal structure, and the level of accuracy involved in the determination of such information. A GIS-based approach relying on various information layers is applied to achieve the second objective.
This analysis does not imply that recharge from dykes and dams is considered an intentional mechanism to increase groundwater storage, and therefore, can be regarded as MAR, but rather that the additional recharge constitutes a secondary effect [14].
The results from this research would help to disseminate the result from the Spanish inventory of transverse structures; contribute to closing knowledge gaps concerning anthropogenic recharge in Spain; provide a methodology to estimate recharge from a large number of structures (dykes and small dams) at the regional level; and ultimately, provide figures to better allocate and manage water resources.

2. Background. River Channel Transverse Structures

River channel works are frequently used in hydrological and forestry restoration efforts [11] to reduce the effect of torrential precipitation by preventing floods [12,15]. These works are also aimed at adjusting and controlling the effects of water flows. For instance, they can act on the riverbed and banks, preventing the formation of flows with high concentrations of solids and a high density of the water caused by erosion and sedimentation of materials [15,16,17].
River channel works can be either longitudinal or transverse. Longitudinal works are built in torrential watercourses for lateral erosion defence, landslide containment, and flood protection. They have a scant or null effect on water infiltration into aquifers [18]. Around 14,643 structures of this type were inventoried in Peninsular Spain. Transverse structures are the most suitable solution to deal with sediment transport, erosion, and flooding processes in torrential watercourses with massive transport of materials, erosion of banks, and destabilisation of adjacent massifs [15,17,18]. These structures are also the best choice when the objective is to retain water.
The technical literature separates “dyke” from “weir”, or small dam. The former term is employed for cross-cutting structures designed predominantly to respond to issues associated with the retention of solid flows, and the consolidation of slopes and beds of water channels, such as torrents, ravines, and wadis [18,19,20]. The latter term, weir, or small dam, involves impounding water for diverse purposes.
As long as the reservoir basin from which they originate stays unlanded, the dam causes the dammed water to slow down the rate at which sediment arrives, resulting in the stagnation of coarser sediments and a decrease in the solid proportion of the discharge flow. This has an essential effect on the type of clogging that accumulates at the bottom and constitutes an impediment to water infiltration [21,22].
Raising the riverbed leads to a lower slope of the embankment, which reduces its velocity, and consequently, its capacity for dragging and erosion. The embankment wedge attached to the construction site also consolidates [23].
Dykes can be further categorised into consolidation and retention dykes. Consolidation dykes (Figure 1) serve the purpose of decreasing river channel erosion and stabilising the slope. Retention dykes (Figure 2) are built to retain solid or liquid flows. In the first case, i.e., to retain solid flows, they are known as closed or semi-hollow dykes, and when aimed at retaining water, they are either detention or recharge dykes [24]. The dykes for retention play a special role in lamination and (un)intentional aquifer recharge [15,20,25].
The main difficulties in designing this type of structure arise from the analysis and forecasting of phenomena related to sediment transport, its influence on the stability of the modified channel (both in terms of the extent of this influence [17]), its evolution over time [15,18], and finally, the “anthropic” seepage variation [1,4,26,27,28].
In addition to these processes, dams can also contribute to infiltrating water into aquifers by increasing water retention times, working as infiltration basins [15,16,17]. The rate at which recharge proceeds is conditioned by factors such as the wet perimeter, the water stage, and the riverbed grain size distribution. As long as the dam impoundment preserves its volumetric capacity, the dam decreases the water–sediment load, slows down the sediment delivery rate, and results in the deposition of fine sediments, a process commonly known as siltation, resulting in a low-permeability layer or clogging that decreases permeation rates [21]. The low-permeability stratum raises the channel bed to the compensation slope [22], which forms when the grain size distribution of the riverbed and the stream are equalised, and there is a balance between the solid fraction entering and leaving the siltation level [20,22].

3. Methodology

The methodology of this article is subdivided into two sections. The first one provides the background and some of the information pertaining to the transverse structure inventory. The second part deals with the estimation of unintentional recharge.

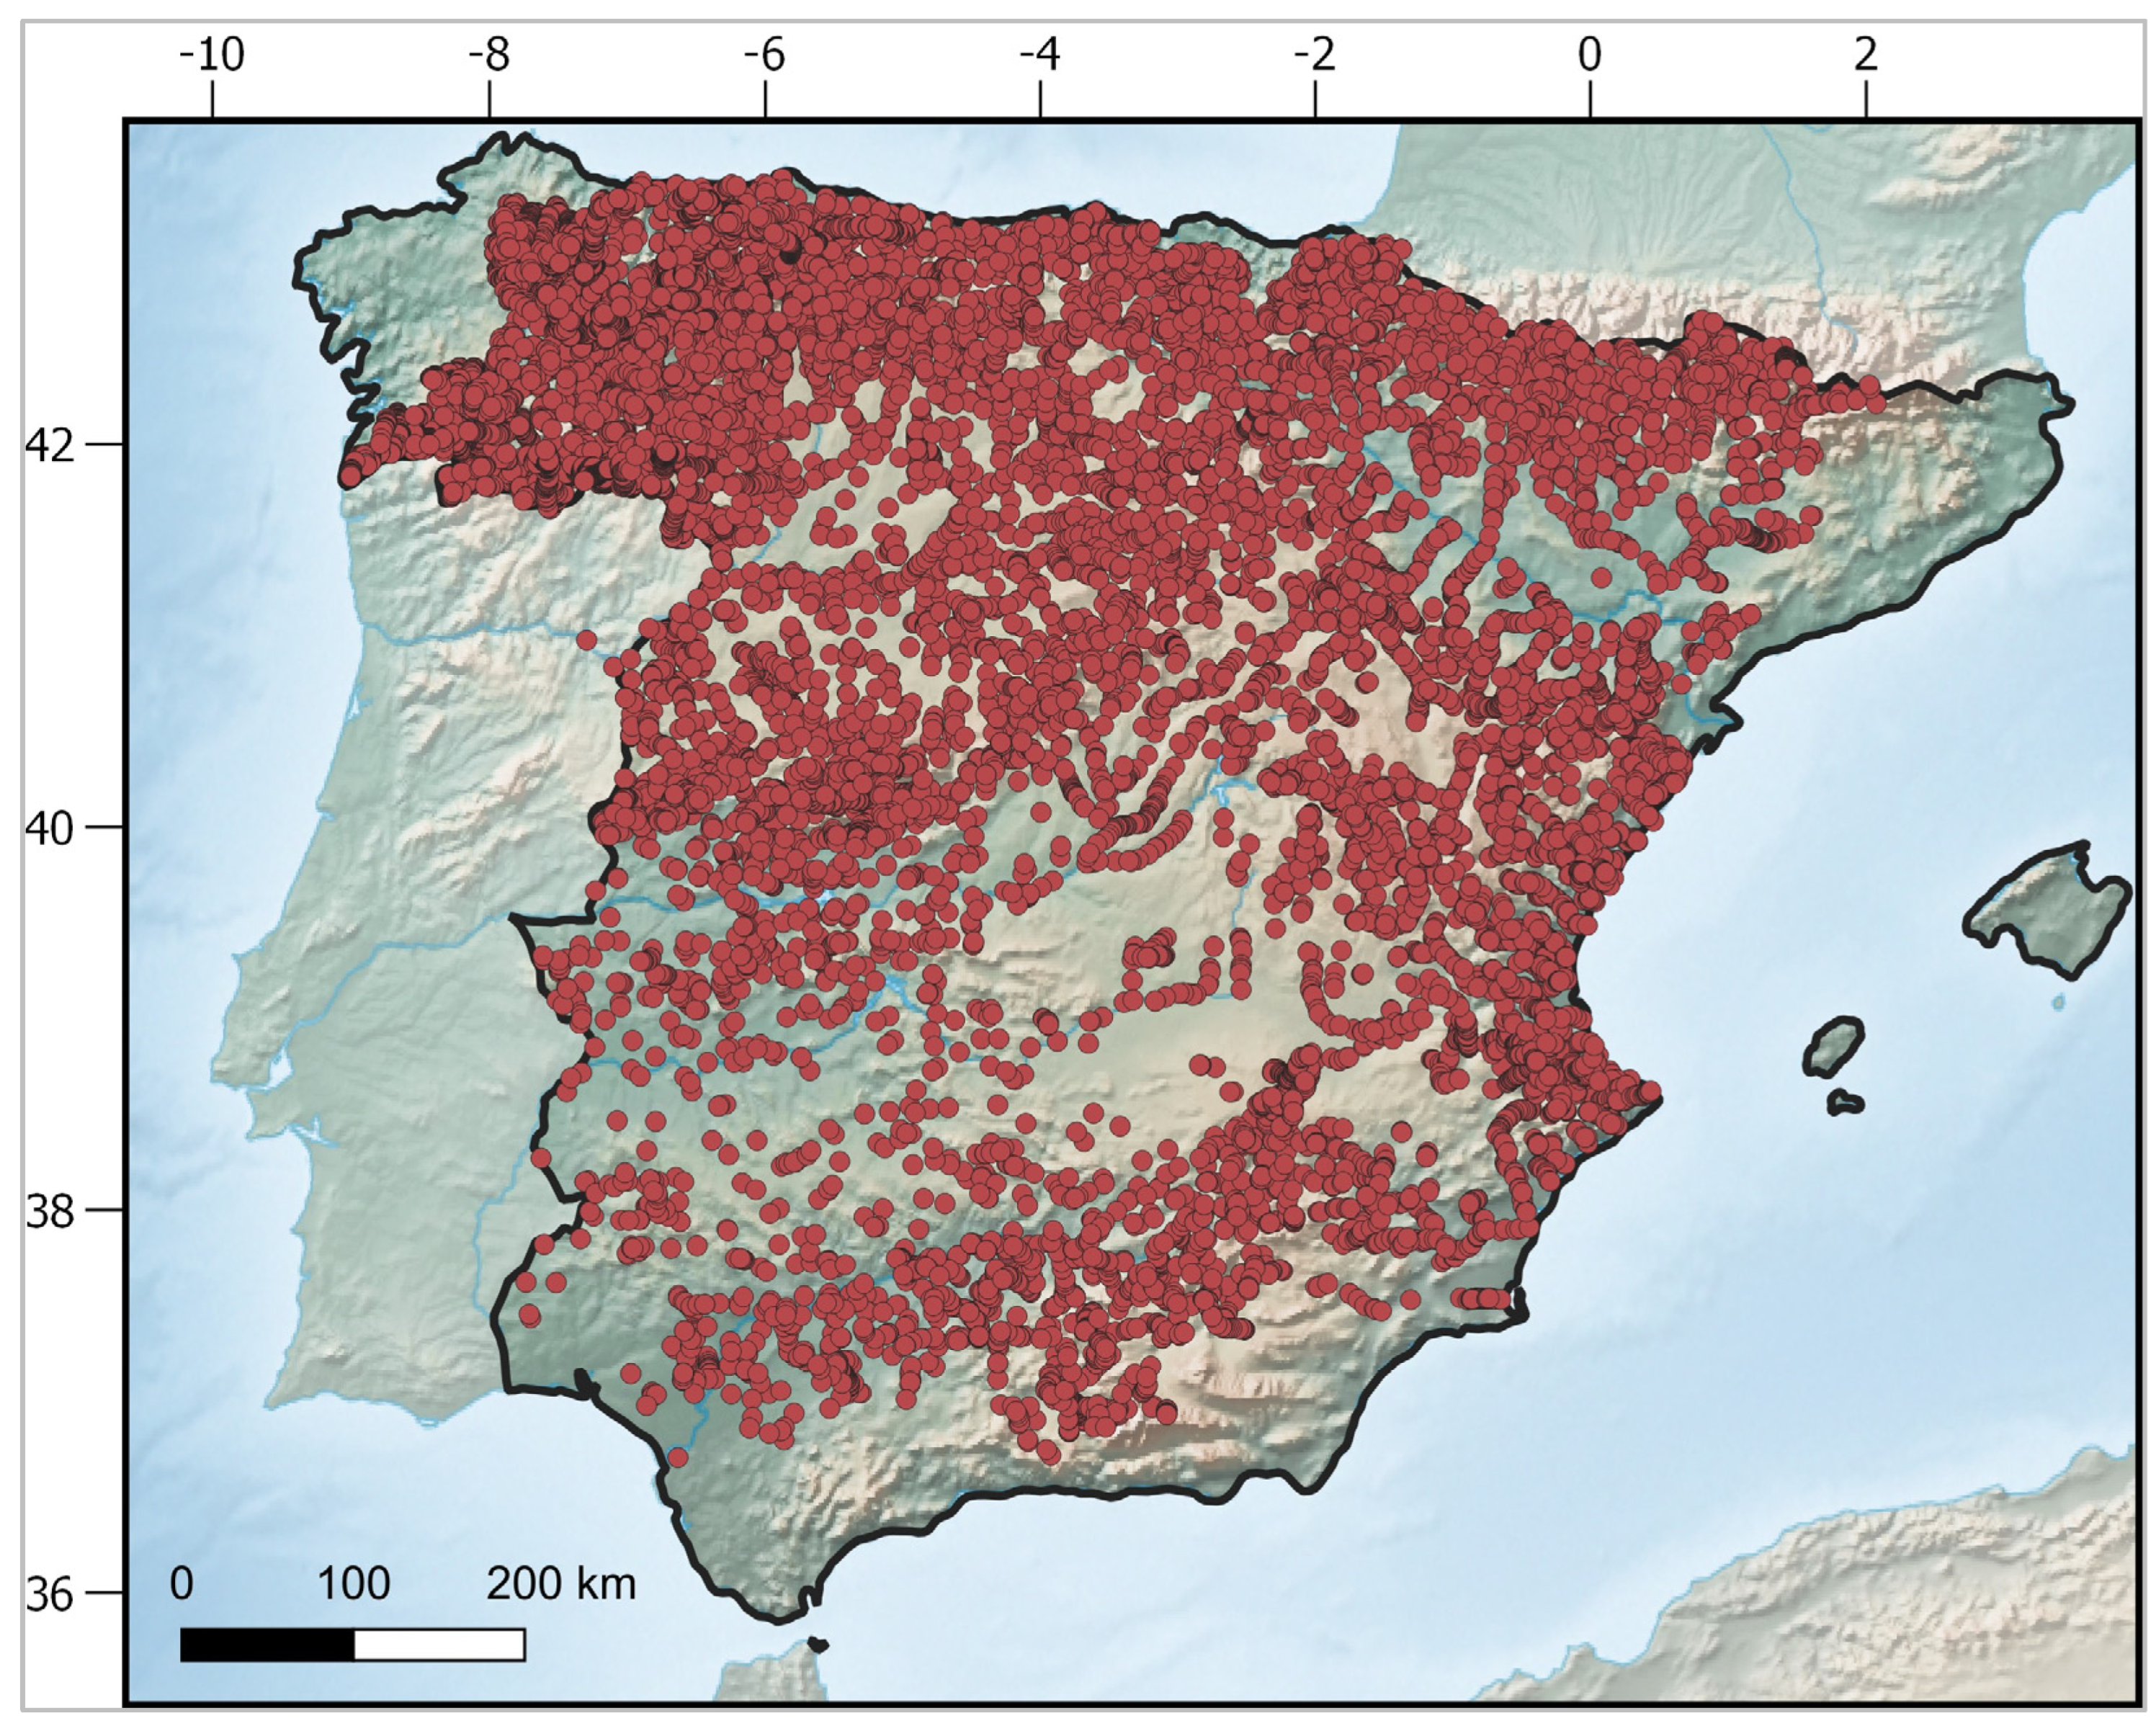
3.1. Inventory of Transverse Structures

In 2019, the Spanish Ministry for the Ecological Transition and the Demographic Challenge (MITERD) requested Tragsatec to conduct and digitalise the first inventory of dykes and transverse structures in watercourses in the Peninsular Spanish territory (excluding the islands), leaving aside the big dams [11,26,27,28,29].
Most of these transversal structures were constructed in the 1950s and 1960s by former institutions, such as the Institute for Nature Conservation (ICONA) and the Institute for Agrarian Reform and Development (IRYDA) [30]. The documents concerning their construction were scattered across numerous libraries. The elaboration of the inventory relied on information from the photointerpretation of orthophotos from the National Aerial Orthophotography Plan (PNOA) using QGIS software, satellite photography from Google Earth, panoramic images at street level from Google Street View, and 4171 field visits to ground truth satellite and remote information.
From 2018 to 2022, the inventory was consolidated, and the resulting number of transverse structures, i.e., 27,680 units, proved that the preliminary estimation of 8000, based on ICONA and IRYDA records [13,30], underestimated the reality [26,27,28,31].
The geographical information of this and other associated inventories dealing with river works was made publicly available online on different websites (Table 1).
An interactive tool at MITERD’s geoportal shows the transverse structures’ location (link provided in Table 1). There are links to download the actual inventory in shape file and KMZ formats and documentation about the transverse structures’ attributes.

3.2. Estimation of the Recharge from Transverse Structures

The starting point is the official and public database of transverse structures. It comprises 27,680 constructions represented as points in a shape file (shp format) (Figure 3). Each point has more than 40 attributes [11,29,31]. An additional database on longitudinal structures along river channels is available on the Internet [15,26,32,33]. Still, it was not considered, as longitudinal structures are irrelevant to the main research question.
The document published by Tragsatec entitled “Data model and storage of information contained in the inventory of transverse barriers and longitudinal defense works” [27], describes the design and content of the database in full detail. The database in which three of the authors were working during four years will be examined in the Section 4, analysis of the database. The inventory utilised includes only structures with a jump height lower than 10 metres. Structures with a higher jump are part of the large dam inventory [9,26].
The calculation of groundwater recharge from transversal structures is based on the following information sources: UTM grids to be sampled [31], the national lithological map [34], Spain’s surface permeability map [35], design information from the new inventory of transversal structures in Spain [11,23,31,32], and layers with additional relevant information; in particular, lithology, permeability, and groundwater levels (surface and deep aquifers) taken from the DINA-MAR hydro-geoportal [36,37].
Equation (1) is the general formula proposed by the authors and employed to compute infiltration from river courses’ transverse structures.
i = 1 n W A i K v i C c f i G W L c f i
where WAi is the wetted area (m2), Kvi is the vertical hydraulic conductivity (m/day), Ccfi is the clogging correction factor, and GWLcfi is the groundwater level correction factor of the ith transversal structure. The results from this formula are validated against available water balances at the regional and national levels. The lack of information on on-site infiltration volumes precludes a detailed calibration and validation of the formulas employed. Therefore, the current approach still entails uncertainty until site-specific data in numbers relevant to the scale of this study are available. Nonetheless, the proposed methodology and the estimated volumes serve as starting points for more robust estimation.
The next subsection describes the methodologies used to estimate each variable in Equation (1).

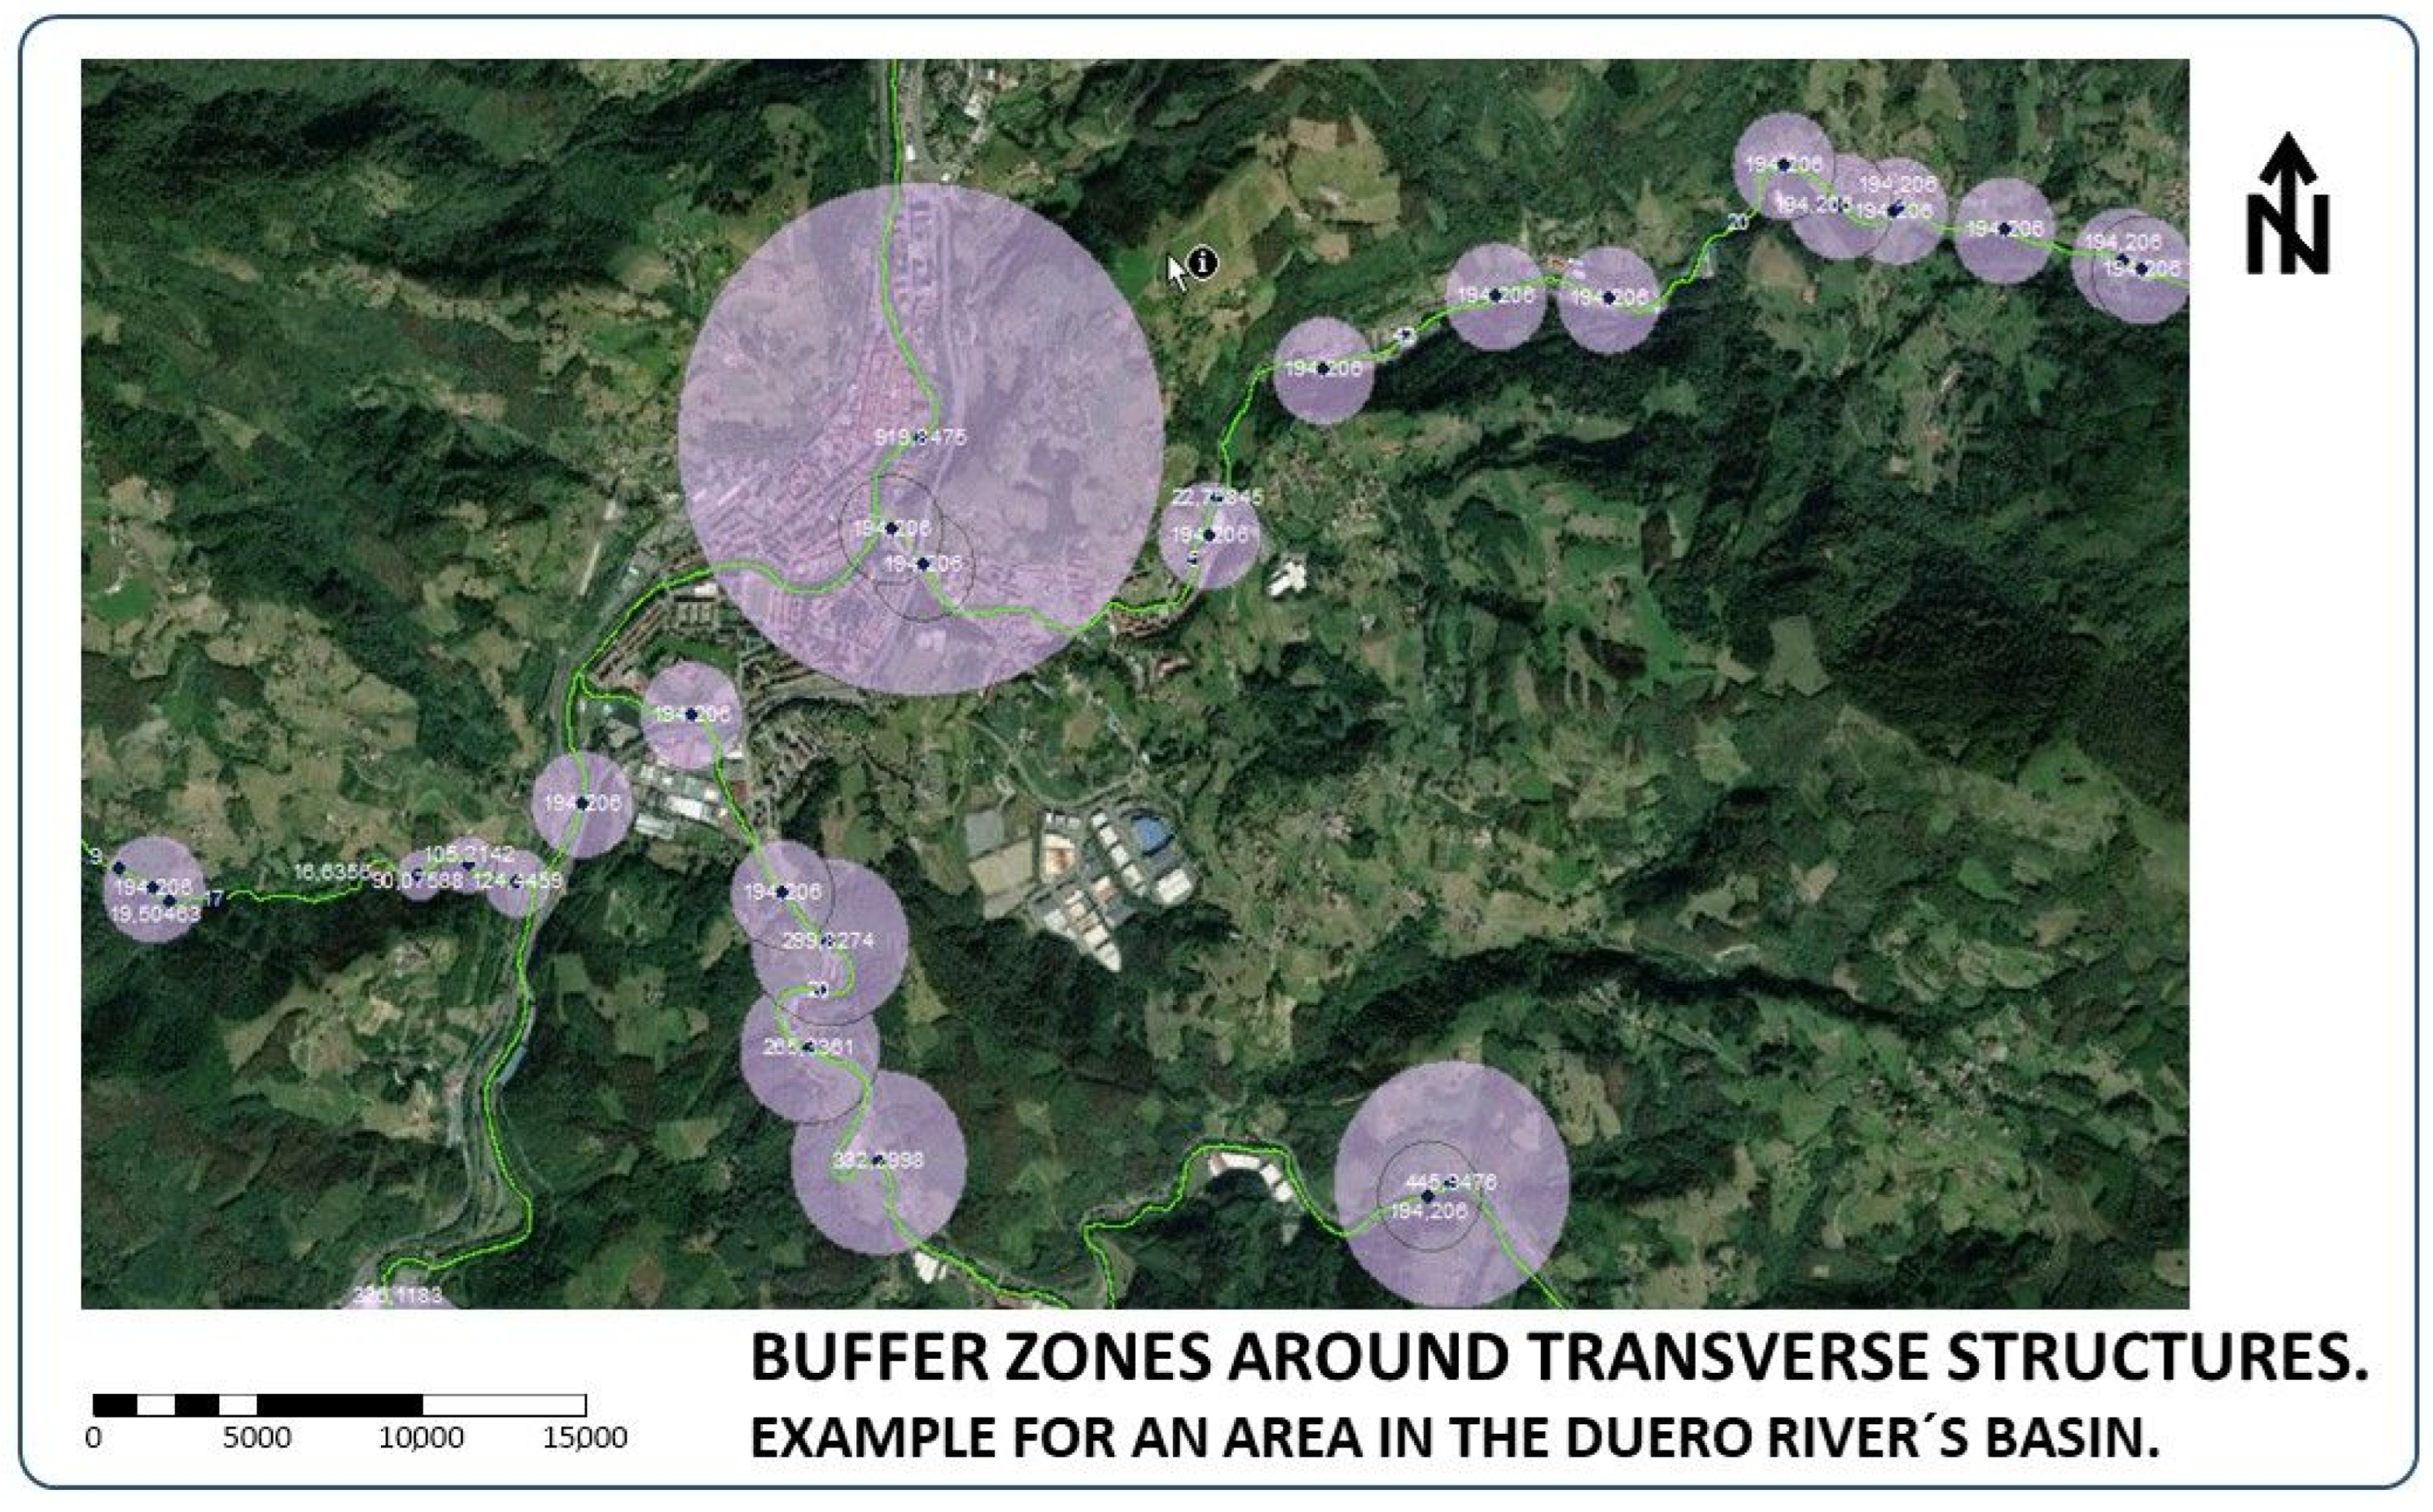
3.2.1. Wetted Area (WAi)

The long-term average wetted area from transverse structures was estimated through design characteristics obtained from the inventory of transverse structures.
The geodatabase [34] includes a layer of the National Flood Zone Mapping System (in Spanish, SNCZI-IPE) [38], with additional cross-cutting obstacles, such as minor vertical jumps, piped crossings, and crossings over faces.
Two methods to estimate the WAi were tested. The first is the formula by Mozzi et al. [39], devised to estimate the recharge from check dams in India. According to these authors, the wetted area can be computed through Equations (2) and (3).
A s u r f = W s H s tan θ
W A = 1 + 2 H s cos α 1 sin α A s u r f
where Asurf is the water surface, Ws is the structure width, Hs is the structure’s height, θ is the stream gradient, and α is the river bank slope. The stream gradient of each transversal structure was calculated as the average between the upstream and downstream slopes from the 1 m resolution DTM PNOA-IGN [40], which is based on all PNOA flight data published to July 2018 [11] (see Section 4).
An alternative method to approximate WA was proposed and relies on a simplified Equation (4) based on the impoundment length and width.
W A = L b w W b w 2
where WAi is the wetted area (m2), Lbw is the length (m), and Wbw is the structure’s wide (m). If a transverse structure misses some of these data (Lbw and Wbw), the average wet area from well-defined structures is assigned, i.e., 6914.9 m2.

3.2.2. Vertical Permeability (Kv)

As groundwater recharge is mainly driven by gravity, vertical hydraulic conductivity (Kv) is a crucial parameter to estimate the contribution of surface water bodies to shallow aquifers.
The methodology to obtain values of Kv at every transverse structure consists of the following steps: (1) assign the predominant lithology to every transverse structure; (2) use this lithology to designate permeability values; and (3) use standard anisotropy coefficients to estimate the vertical hydraulic conductivity.
First, the predominant lithology at every transverse structure was determined as the lithology from the Spanish lithostratigraphic map [34] with the highest cover percentage within a buffer zone (see Section 4).
Subsequently, the assigned lithologies were translated into horizontal permeability values using Spain’s surface permeability map at a scale of 1:200,000 [35] through a GIS-based algebraic operation. This map qualitatively displays lithostratigraphic units’ permeability, establishing five categories: very high, high, medium, low, and very low permeability. In addition, the map considers seven large groups of lithologies: carbonate, granular, quaternary granular, volcanic, meta-granular, igneous, and evaporitic.
For each permeability category, the averages of the range of typical hydraulic conductivity values reported by Terzaghi and Peck [41] and Bendixen et al. [42] were assigned, resulting in the categorisation in Table 2.
Finally, to obtain vertical hydraulic conductivities, the anisotropy coefficient, which relates horizontal hydraulic conductivity (Kh) and Kv, was used [1,43]. The anisotropy coefficients employed (Table 3) were taken from the memory of the Spanish permeability map [34], Bouwer and Rice [43], Chapuis and Ernest [44], and Sridhar et al. [45].

3.2.3. Clogging Correction Factor (Ccfi)

Clogging layers often decrease the vertical hydraulic conductivity of riverbeds. They can control infiltration rates completely, sometimes acting as a bottleneck [40,43] that renders the underlying hydrogeological configuration irrelevant during recharge [46]. Consequently, the infiltration from transverse structures in riverbeds can depend considerably on the hydraulic impedance of the clogging layer [47], often composed of structureless loams, sands, and clays.
The clogging correction factor varies considerably in the hydrogeological literature. There are average values of about 0.75 that consider different types of clogging (e.g., physical and gas) and are based on fieldwork conducted in sites with different lithologies, including alluvial and mudstone formations [48,49]. There are also more conservative correction factors of 0.5 [49,50] that account for different types of clogging, such as leakage, efficiency reduction of the structures, meteorological factors, etc. [50]. Clogging correction features of about 0.8 were also estimated for specific MAR systems (e.g., aquifer storage and recovery (ASR) [51]). A study on check dams in SE Spain obtained a factor of 0.73–0.78 [52].
The Dutch protocol 11,001 approach (Equation (5)) [53] was initially designed for injection wells and boreholes. Thus, it includes factors such as the number of full operation hours, the specific obstruction rate, and the modified fouling index (MFI) [54].
v i n f = 1000 K 150 0.6 v v e r s t o p p i n g 2 M F I   u e q

3.2.4. Groundwater Level Correction Factor (GWLcfi)

The correction factor selected is 1.05 if the groundwater table depth is more than 25 m deep. This factor is purely bibliographic [43,47].

4. Results

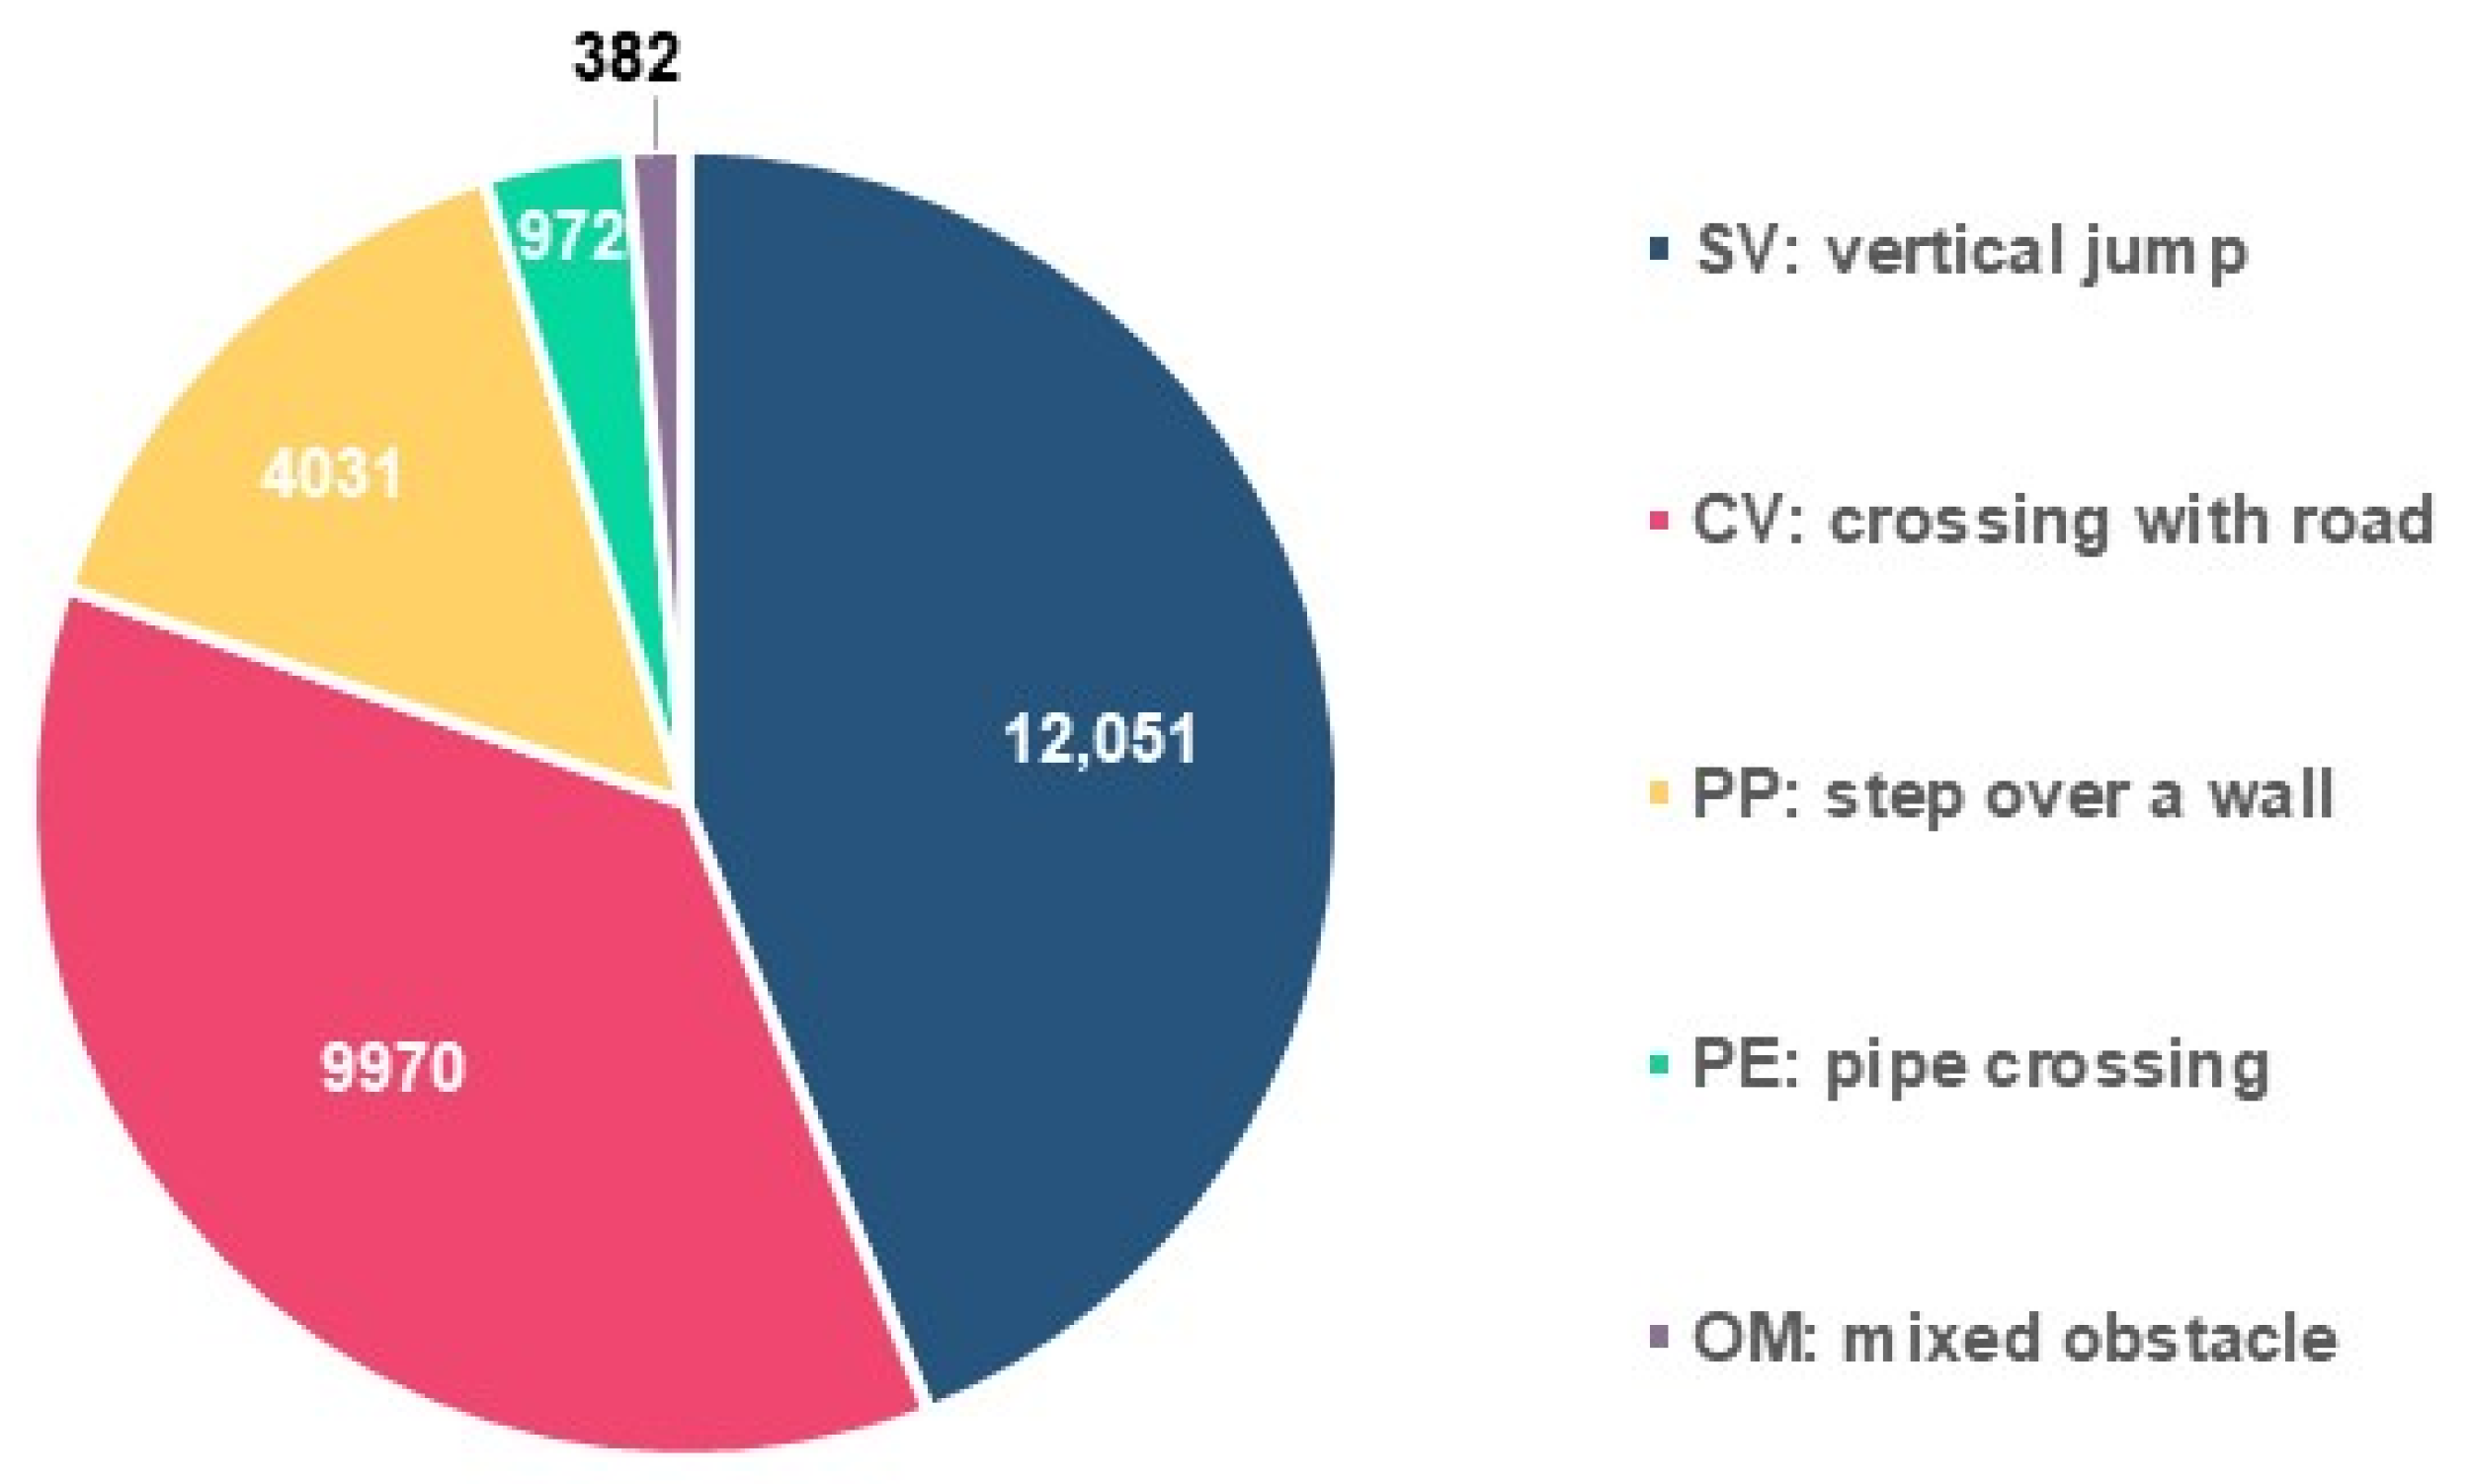
4.1. Description and Analysis of the Database

The following is a description of the official database structure (Figure 4), focusing on the attributes relevant to the conducted calculations, and additional ones of general relevance.
The number of transverse structures within each major Spanish River basin is presented in Figure 5. The majority of structures are located in central and northern eastern Spain, in basins such as the Duero, Júcar, Ebro, Tajo, and Miño-Sil.
The official inventory has more than 40 attributes for 27,680 structures (Figure 6) [11,29]. The degree of detail varies among large river basins.
The database is organised in three tables, providing different information concerning the transversal structure. The distribution of the most relevant attributes is presented in figures and shortly discussed.
The “TRANSGENERALES” table (1st) contains general information related predominantly to the transverse structures’ location in geographical and administrate terms, as well as the data source (Table 3).
In the “TIPO_INFR” attribute, there are five types of structures, namely, vertical jumps crossing with roads and stepping over a wall, pipe crossing, and mixed obstacles (Figure 6). The most common are vertical jumps, which account for nearly half of all structures (44%), followed by crossing with roads (36%) and step over a wall (15%). The other two types have a marginal share.
The “CIERTO” attribute concerns the degree of certainty in the type of structure allocated, which is based on the quality of the information collected to determine the type of structure, particularly satellite imagery. The majority of structures have a medium to high degree of certainty (70%) (Figure 7). A total of 4171 structures were visited in the field between 2018 and 2022, improving the general quality of the database.
The “TRANSTECNICOS” table (2nd) includes technical information on the structure (Table 4), and for some constructions, other information is not described here in detail, such as secondary uses of the infrastructure, conservation quality, concession date (if applicable), and type of passage (considered irrelevant for the calculation). The construction date is important to estimate the clogging accumulation (in general, the oldest the structure, the more clogged the riverbed) and the structural fatigue (the oldest the structure, the greater the amount of stored sediment and the greater the confining pressure).
There are 22 uses among the inventoried structures (Figure 8). The main among such uses are road crossing (10,317 structures, 37%) and irrigation-related purposes (3664 structures, 20%).
The “EFECTO-BARRERA” table (barrier effect) (3rd), contains information about the design and construction of the transverse structures, as well as the parameters related to the damming effect. It constitutes the main source of information for the calculation of unintended recharge. The main information is shown in Table 5.
Approximately 20% of entries contain all the parameters in this table. Field inspections of 4171 structures (out of 27,680) (Figure 9) were highly relevant to arrive at the computed values. Furthermore, 2461 transverse structures, out of the 4171 with field inspections, count with complete design and backwater dimension data (including Lbw and Wbw), contributing to extrapolating missing data.
This information is complemented with attributes concerning the existence of a device that allow fish to pass (EXIS_PASO” attribute), such as fish ladder (yes/no), or lateral diversions, a side channel in the structure (yes, no, or unknown), grating, crossing device, the difficulty of ascent at the foot of the structure, call effect, whether there is significant turbulence, the roughness of the face, slopes or changes in gradient, absence of a clear gradient of velocity in the dammed area, passage through turbines, mills or falls of more than 10 m, accessibility of the channel to the downstream crossing device, call effect on the ascent, lift at the foot of the structure, and accessibility of the crossing device to the upstream channel, among others.
It is worth highlighting the vast effort implied in the data collection for 27,680 structures during four years, and the complexity of organising and publishing the database.

4.2. Estimation of Unintentional Recharge from Transverse Structures

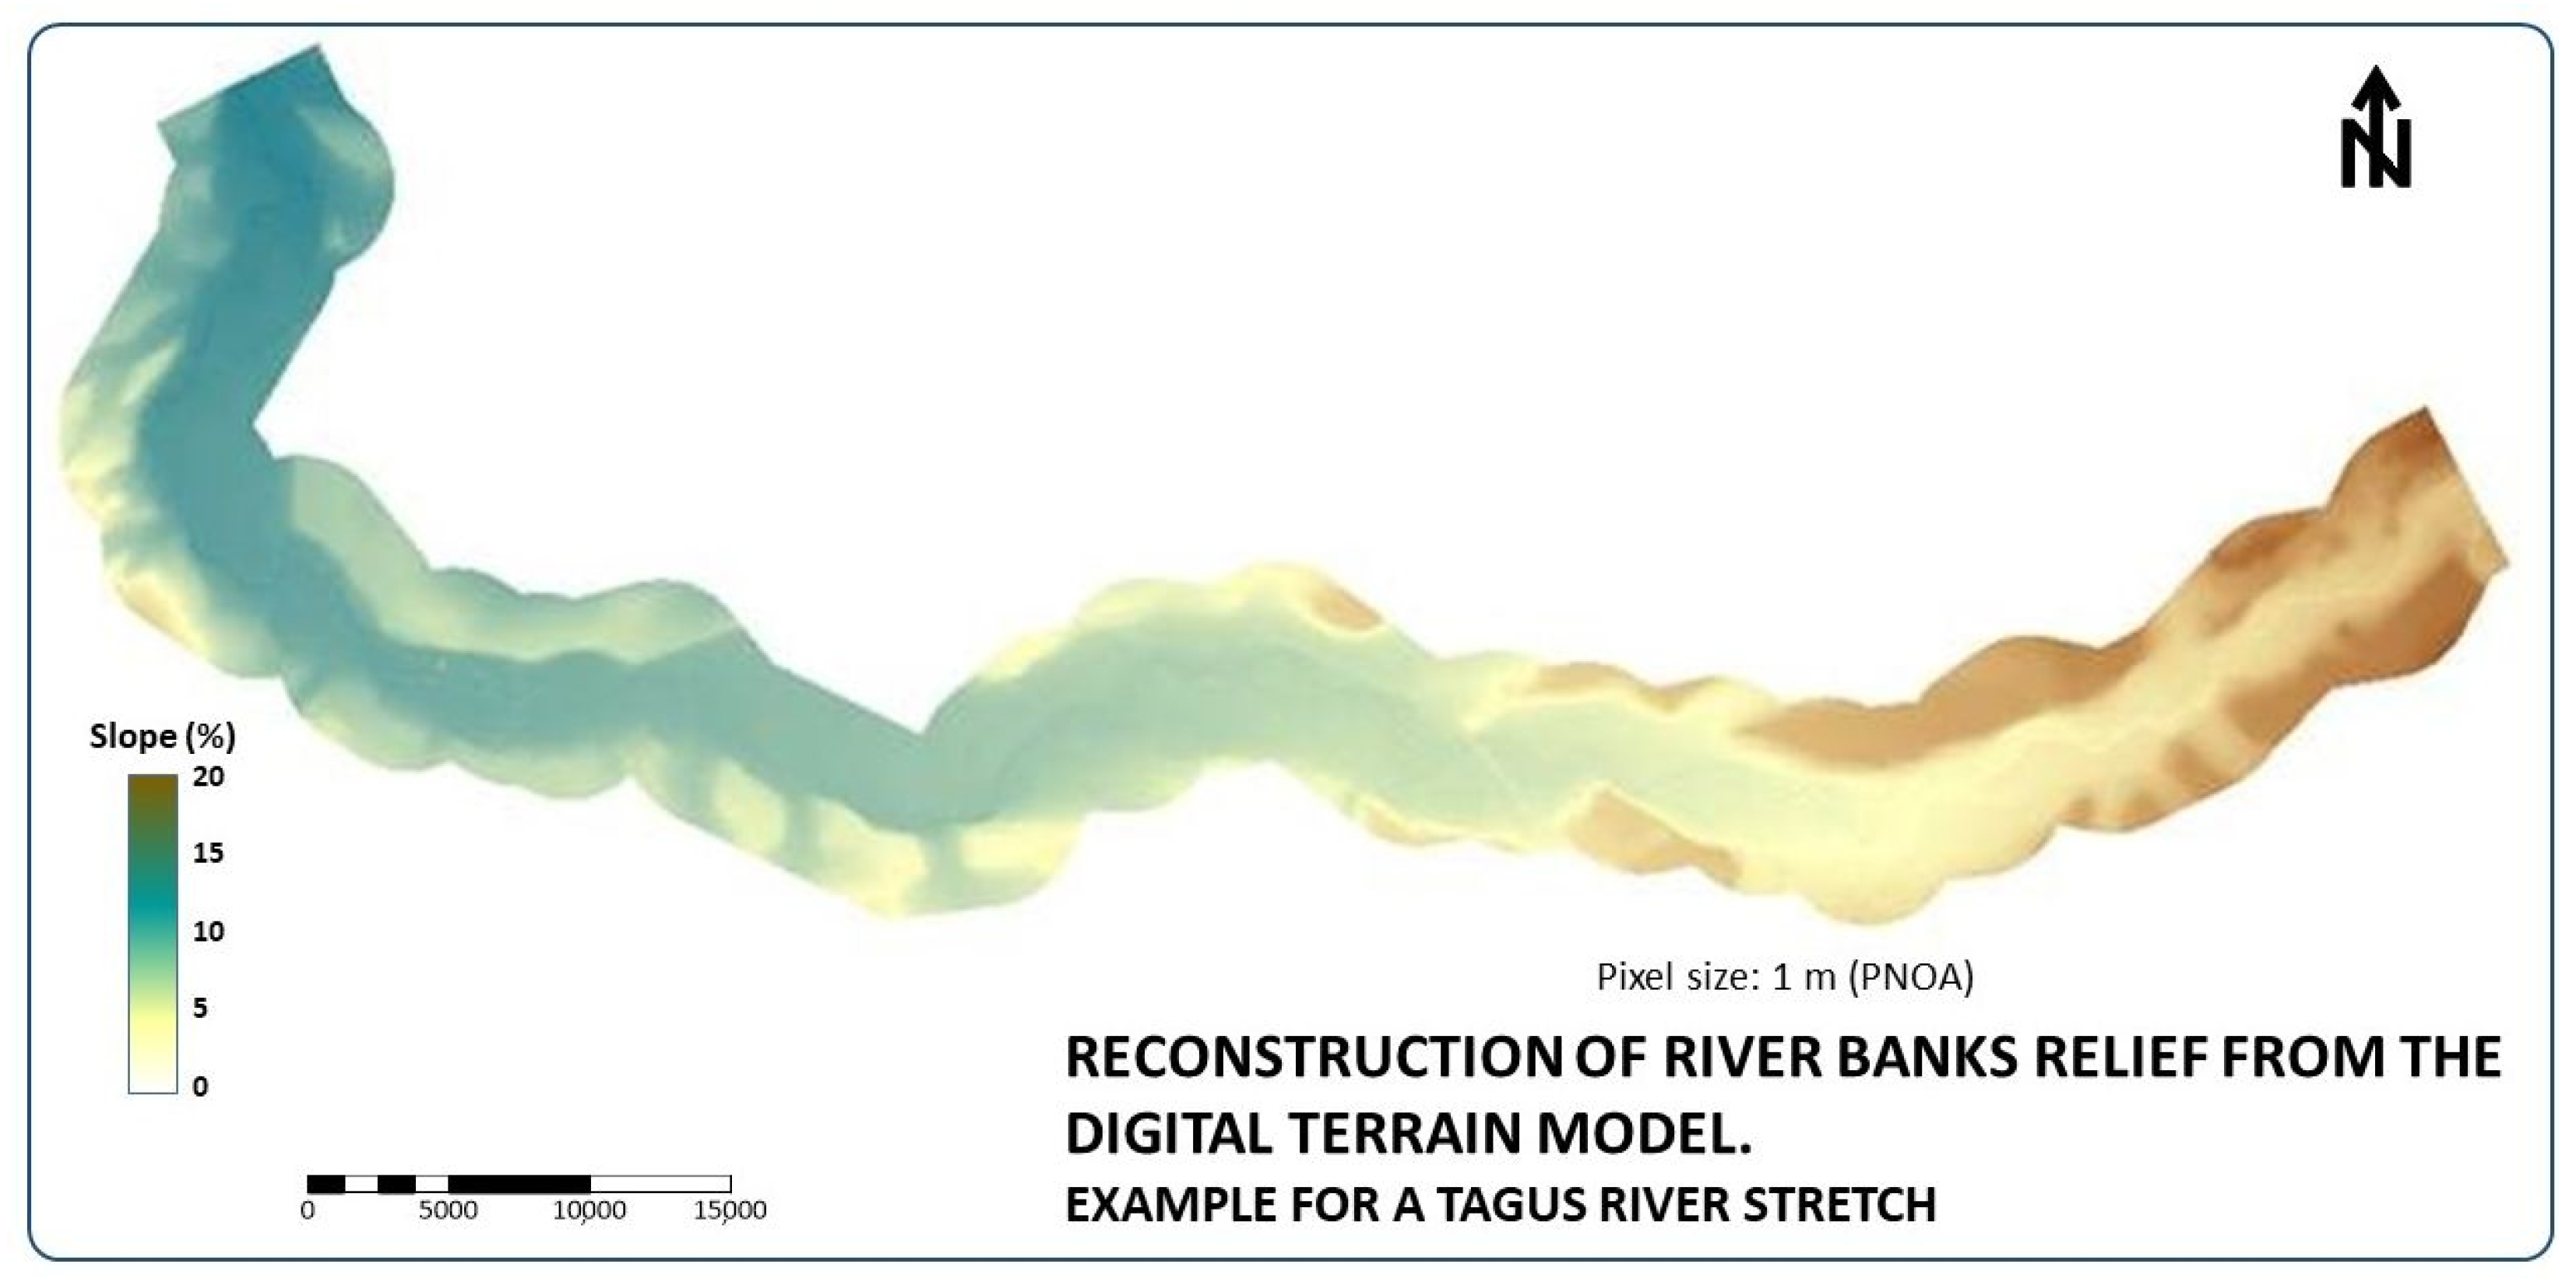
4.2.1. Wetted Area Calculation behind Each Transverse Structure

The wetted area (WAi) was determined from each damming structure, its characteristics, and the environmental conditions, applying both formulas.
As per the Mozzi et al. formula [39], the total surface covered by water behind dykes and small and medium dams results in 546.6 km2. In case of missing values, the mean wetted area, which is 19,747.4 m2 based on 1694 transverse structures with all required information, was assigned.
According to the proposed formula, the total WAi infiltrating water into the aquifers is 191.4 km2. The mean wetted area from 2461 transverse structures with full data is 6914.9 m2. This value is more realistic than the one obtained through the formula by Mozzi et al., according to photointerpretation from the National Aerial Orthophotography Plan (PNOA) [40].
The attribute “COLMATACION” indicates whether the structure is clogged (yes or no), especially from field observations. In the calculation, the authors considered an incipient degree of clogging for the unclogged structures (marked as no), and for those constructed less than five years ago.

4.2.2. Calculation of Kv below Each Transverse Structure

Special attention requires the GIS-based calculations of the slopes up and down each transverse structure and the determination of the prevailing lithology underneath when more than one geological unit is present.
The methodology employed was validated at several Tagus, Duero, and Segura River basin sites. Figure 10 represents one such example in the Tagus River basin, constructed from the 1 m resolution DTM PNOA-IGN [40].
The buffer zone around each transverse structure (Figure 11) was defined using the length of the wet perimeter. In case this value was missing, the average was employed.
After performing the GIS-based operations to determine the predominant lithology beneath each transverse structure and assigning representative hydraulic conductivity values, the final number of transverse structures within each permeability range is obtained and presented in Table 6.
The vertical hydraulic conductivities were obtained by conducting another algebraic operation, multiplying horizontal permeability values by each anisotropy coefficient (Table 7).

4.2.3. Application of the Groundwater Level Correction Factor (GWLcfi)

A new GIS-based operation has been made to modify the cells of the associated table that have these characteristics (if the groundwater table depth is more than 25 m deep, applies the correction factor × 1.05).

4.2.4. Application of the Clogging Correction Factor (Ccfi)

Clogging factors were assigned between a conservative value of 0.5, frequent in volcanic settings, and 0.8, based on frequently cited references [51,52] (Table 7). In addition, the total infiltrated volume was also computed for a scenario in which all lithologies have a conservative clogging correction factor of 0.5.

4.2.5. Final Results about Unintentional Recharge from Dykes and Small Dams in Peninsular Spain

Two different formulations were used to estimate the wetted area to compute the unintentional recharge in Peninsular Spain. According to the formula by Mozzi et al., the total surface covered by water behind dykes and small dams is 546.6 km2. This formula requires more information; consequently, only 1694 transverse structures had complete data to apply it. The mean WA based on these expressions is 19,747.4 m2, resulting in an unintentional recharge in Peninsular Spain between 1901.8 and 2716.8 Mm3/year, using correction factors of 0.5 and those assigned in Table 3, respectively.
According to the author’s formula, the total WA is 191.4 km2. In this case, the required information is less. Therefore, 2461 transverse structures were used (i.e., the ones that count with Lbw and Wbw data); resulting in a mean wetted area of 6914.9 m2, better fitting the reality according to the photo interpretation from PNOA [40]. The total recharge resulting from this approach ranges between 812.5 Mm3/year (applying the conservative clogging correction factor of 0.50) and 1234.8 Mm3/year (using the assigned clogging correction factor for each lithology (see Table 3), with a geometrical mean value of 62% (0.62).
In this regard, distinguishing efficiency, capacity, and effectiveness of the term recharge, these figures relate especially to capacity, as the efficiency is out of the scope because it is not intentional, and the effectiveness (intentional recharge in areas where it is really needed) is only partial, as infiltrated volumes might be used or not.

4.2.6. Sensitivity Analysis

The general equation proposed to compute infiltration at a single site is the product of four variables: wetted area, vertical hydraulic conductivity, water depth, and clogging correction factors.
In the estimation of the wetted area through the formula by Mozzi et al. [39], the slope and groundwater depth values had a relatively minor effect on infiltration volumes, always below one magnitude order. Furthermore, the 1 m resolution raster provides a relatively accurate slope estimation.
Determining the vertical permeability below each transverse structure relied upon methods of general acceptance. Furthermore, hydrogeological parameter variations will likely not have a substantial impact because averages are being used and the sample size is large (27,680 structures), guaranteeing that over- and sub-estimations compensate. This is particularly true for permeabilities, which had classical figures in the literature since at least 1967 [41], with slight or no considerable modifications since then [42]. By changing this parameter to the range’s extreme, the computed infiltration volumes do not exceed one order of magnitude. Consequently, Kv moderately influences infiltration volumes and is not a critical variable.
The anisotropy coefficient, used to convert Kh into Kv, has a larger degree of variation and could severely impact the estimations conducted here. For instance, in volcanic areas (heterogeneous and anisotropic means), this factor can vary by as much as five orders of magnitude. In contrast, granular geological formations rarely show variations beyond one order of magnitude.
The second critical element is the clogging correction factor. There is no robust information for Spain based on field observations. Mozzi et al. [39] discussed the impact of clogging layers. They mention that as impedance reaches 100 days (30 cm of silt with a hydraulic conductivity of 0.003 m/day), infiltration is reduced between 20 and 50% for check dams in India. This range is consistent with the results of the author’s simplified method, although it is not as consistent concerning the final infiltrated volume. In this study, the range in which the clogging correction factor varies is relatively wide (0.50–0.80 according to the references), and therefore, results are modified by the same factor, but always inside one order of magnitude.
Other factors, such as the catchment surface area, runoff coefficient, and aquifer thickness, were also reported to have a limited impact on infiltration volumes [39].
The rest of the elements used in the calculation modify the final result about or below one order. Any other reasonable variation or combination of input parameters hardly modifies the computed range of 812.5–1234.8 Mm3/year as the end result for the infiltrated volume from dykes and small dams in Peninsular Spain.

5. Discussion and Limitations

The values of unintentional recharge computed through the approaches by Mozzi et al. [39] (1901.8–2716.8 Mm3/year) and the one proposed here (812.5–1234.8 Mm3/year) are in the same order of magnitude as previous estimations. Nonetheless, the calculated volumes considerably exceed previous estimations by the Water General Directorate of the Spanish Ministry (500 Mm3/year, according to its estimations [3]). It is also significantly above the DINAMAR project’s figure, 380 Mm3/year [4], considering the combined recharge of operative MAR systems and a limited inventory of about 800 transverse structures [1,2,4]. Therefore, the value obtained using the conservative clogging factor (i.e., 812.5 Mm3/year) is the closest to previous estimations.
These values are also contrasted with the SIMulación Precipitación-Aportación (SIMPA) quasi-distributed hydrological model (SIMulation Precipitation-Input), developed by CEDEX [29,31] for the Ministry of Ecological Transition. Its latest version (the period between hydrological years 1980/81 and 2017/18) gridded Spain into approximately 2,000,000 square cells of 500 m on each side. It computes the hydrological balance, resulting in a series of published maps displaying precipitation (PRE), potential evapotranspiration (ETP), actual evapotranspiration (ETR), soil moisture (HUM), infiltration (INF), surface runoff (ASP), groundwater runoff (ASB), and runoff (AES), or total input (APN) [28].
According to the SIMPA model, the total recharge in Spain from river courses, including dams of all sizes and dykes, is 1946 Mm3 [31]. In this respect, the recharge from transverse structures computed through the proposed formula ranges between 41.7% and 62.6%, considering the most conservative and less astringent clogging correction factors (i.e., 0.5 and 0.8, respectively). The rest of the infiltration found through SIMPA, and not accounting for the recharged volume, estimated in this research would proceed from large dams and from the water courses’ direct infiltration.
Values are also compared to the HEC-RAS modeling of watercourses for the Southeastern Iberian Peninsula using HEC-RAS modeling on watercourses [52]. Variations in the flow rate in tributary river courses provide information about the infiltration rate from both the bottom and the banks. The model performance was therefore validated against the observed measurements in the semiarid conditions of the SE of Spain. The HEC-RAS model at the regional scale for SE Spain ([52], pp. 991–993) found a Ccf between 0.73 and 0.78 for areas around check dams, which are not far from the estimations through SIMPA and in the present research.
According to the current analysis, note that the recharge from transverse structures (812.5–1234.8 Mm3/year) exceeds by more than four times the volume infiltrated from MAR (150 to 280 Mm3/year). Furthermore, the anthropogenic recharge from MAR, dykes, and small to medium dams (referred to as transverse structures) likely ranges in the interval 1012.5–1514.8 Mm3/year (Figure 12).
This article’s novelty is that it proposes a new methodology to determine a fractional volume for the (un)intentional aquifer recharge in Peninsular Spain. It also presents the main characteristics of the transverse structure inventory by MITERD. The figures provided here could guide the calibration of regional hydrological models and contribute to accurately closing hydrological balances at the national level. According to standardised groundwater level indexes [55], Spain and other sites across the Mediterranean face water stress, and water resources are becoming increasingly scarcer due to drought and unsustainable water demand [56], particularly for irrigation [57]. In this context, accurate water balances are crucial to properly managing water resources under such critical conditions.
Calculations using the simplified methodology proposed here reflect mean values for the wetted area, which is a factor in close correlation with precipitation, runoff, and meteorological variables.
Algebra mapping operations conducted in ARC/GIS are secure to guarantee the certainty of the results. QGIS software was also employed for the photointerpretation of orthophotos from the National Aerial Orthophotography Plan (PNOA) [40].
Regional data may represent a substantial limitation when extrapolating results to the scale of one country. Future studies on correction factors determined by the composition and development of clogging processes under different environmental conditions will be necessary.
An assessment of the deviation in our estimations at the scale of punctual transverse structures is majorly precluded by the lack of actual infiltration volumes, which is one of the main barriers towards robust calculations. The estimated recharge volumes were contrasted with previous studies and models at the national and regional levels. A more accurate appraisal could involve water balances at the scale of large river basins or even sub-basin levels.
Apart from the limitations mentioned above, the present work could greatly benefit by considering the following factors:
  • The meteorological variability can modify the wetted perimeters of the transversal structures over time, especially given climate change.
  • Considering the geometrical configuration of the wetted area using the slopes around each structure in detail, i.e., constructing a micro-elevation model.
  • The clogging correction factor could be further improved by considering the year of construction of the structures, assigning a higher value to older structures.
  • A mean water table to differentiate between shallow and deep aquifers could also be included.
  • The overall moisture conditions of the basin or sub-basin.
  • The use of some cartographic information from previous works with a sufficient degree of detail, e.g., the “hydro-geoportal” [37,38], which has detailed information on the vertical permeability (Kv) of the aquifers throughout Spain.
  • Calculus for the deviation from point estimations of recharge (sub-basin scale).
  • Capture of new field data concerning clogging correction factors and anisotropy coefficients.

6. Conclusions

This article presented the inventory of Spanish transverse structures in river channels recently made publicly available by the Spanish Ministry for the Ecological Transition and the Demographic Challenge. This inventory comprises 27,680 transverse structures distributed over Peninsular Spain and all major river basins. Each structure in the inventory comprises more than 41 attributes, which provide general and technical information about the infrastructure and relevant parameters of the impoundments resulting from damming.
Technical information and data related to the impoundment were used to approximate a volume of (un)intentional recharge from transverse structures at the national level. The methodology relies on GIS procedures, general hydrogeological relationships, and two mathematical formulations to approximate the wetted area. The total (un)managed aquifer recharge from transverse structures ranges between 812.5 and 1234.8 Mm3/year, depending on the clogging correction factor considered for the wetted area expression proposed here. The lowest obtained value (i.e., 812.5 Mm3/year) is considered the most realistic, as it matches water balances at the national and regional scales.
The alternative formulation by Mozzi et al. devised for typical conditions in India resulted in an unintentional recharge of 1901.8–2716.8 Mm3/year. These results do not match the reviewed figures based on water balances as much as the author´s formula does.
The volume infiltrated into the aquifers from transverse structures (unintentionally and excluding large dams) is exceeded by more than four times the volume from (intentional) managed aquifer recharge in Spain (about 200 Mm3/year). Therefore, the unintentional recharge of aquifers from dykes and small dams poses an interesting figure for water management. The recharge from MAR and transverse structures (intentional plus (un)intentional excluding conduction´s leakages) ranges in the interval 1012.5–1514.8 Mm3/year (Figure 12).
Anisotropy coefficients and the clogging correction factors are the variables with the highest sensitivity. Additional meteorological and site-specific data, as well as on-site recharge measurements for various transverse structures, could greatly improve the quality of the large-scale estimations to be conducted in future assessments.

Author Contributions

Conceptualisation, E.F.E.; methodology, E.F.E.; validation (with a certain uncertainty degree), E.F.E., J.D.H.C., C.M.d.G.P., M.D.M.V. and C.M.V.; formal analysis, E.F.E. and J.D.H.C.; investigation, E.F.E., J.D.H.C., C.M.d.G.P., M.D.M.V. and C.M.V.; resources, E.F.E., J.D.H.C., C.M.d.G.P., M.D.M.V. and C.M.V.; data curation, E.F.E. and C.M.V.; writing—original draft preparation, E.F.E. and J.D.H.C.; writing—review and editing, E.F.E., J.D.H.C., C.M.d.G.P., M.D.M.V. and C.M.V.; visualisation, E.F.E., J.D.H.C., C.M.d.G.P., M.D.M.V. and C.M.V.; supervision, E.F.E.; project administration, M.D.M.V. (transverse structures) and E.F.E. (MARSoluT); funding acquisition, E.F.E. All authors have read and agreed to the published version of the manuscript.

Funding

The research leading to these results has received funding from the European Union’s Horizon 2020 research and innovation program under the Marie Skłodowska-Curie grant agreement no 814,066 (Managed Aquifer Recharge Solutions Training Network—MARSoluT) [58].

Institutional Review Board Statement

Not applicable.

Informed Consent Statement

Not applicable.

Data Availability Statement

Not applicable.

Acknowledgments

The authors thank the Water General Directorate of the MITERD for allowing access to the database with the inventory of transverse structures; to the Spanish Geological Survey (IGME) for permitting to consult the unpublished data of the Spanish permeability map. The authors also thank IAH-MAR Commission [59] members, who kindly provided information about (un)intentional recharge appraisal methods. Finally, special thanks to SIX (6) anonymous reviewers, who kindly improved in a substantial manner the quality of this article.

Conflicts of Interest

The authors declare no conflict of interest. The funders had no role in the design of the study; in the collection, analyses, or interpretation of data; in the writing of the manuscript; or in the decision to publish the results.

References

  1. DINA-MAR. DINA-MAR: La Gestión de la Recarga de Acuíferos en el Marco del Desarrollo Sostenible. Desarrollo Tecnológico (DINA-MAR: Management Aquifer Recharge in the Framework of Sustainable Development. Technological Development); Fernández Escalante, E., Ed.; Grafinat: Madrid, Spain, 2010; ISBN 978-84-614-5123-4. [Google Scholar]
  2. Fernández Escalante, E.; San Miguel Fraile, M.Á.; Sánchez Serrano, F. El hidrogeoportal DINA-MAR. Aplicación en soporte GIS para determinar zonas susceptibles de aplicar técnicas de recarga gestionada en España (The DINA-MAR hydrogeo-portal. GIS application to determine areas susceptible to the application of managed aquifer recharge techniques in Spain). Bol. Geol. Min. 2014, 125, 341–368. Available online: https://aguas.igme.es/Boletin/2014/125_3/9_%20Articulo%206.pdf (accessed on 13 July 2023).
  3. Arqued Esquía, V.M. Nuevos Planes Hidrológicos de Cuenca. Novedades en la Política del Agua y Nuevo Ciclo de Planificación Hidrológica y Gestión de Riesgos (ST 31) (New River Basin Management Plans. Novelties in Water Policy for the New Cycle on Water Planning and Risk Management, Technical Session 31). CONAMA2020 proceedings, Madrid, Spain. 2020. Available online: http://www.conama.org/conama/download/files/conama2020/STs%202020/5505_ppt_VArqued.pdf (accessed on 13 July 2023).
  4. Fernández Escalante, E.; Gil, R.C.; San Miguel Fraile, M.Á.; Serrano, F.S. Economic Assessment of Opportunities for Managed Aquifer Recharge Techniques in Spain Using an Advanced Geographic Information System (GIS). Water 2014, 6, 2021–2040. [Google Scholar] [CrossRef] [Green Version]
  5. MAPAMA. Gestión de la Recarga de Acuíferos: Su Implicación en la Lucha Contra la Desertificación. Tipologías y Dispositivos de Recarga Artificial; MAPAMA: Madrid, Spain, 2008. Available online: https://www.miteco.gob.es/es/biodiversidad/temas/desertificacion-restauracion/0904712280144db8_tcm30-152640.pdf (accessed on 13 July 2023).
  6. IGME. Identificación de Acciones y Programación de Actividades de Recarga Artificial de Acuíferos en las Cuencas Intercomunitarias; Sahún, B., Mudillo, J.M., Eds.; IGME: Madrid, Spain, 2000. [Google Scholar]
  7. MIMAM. Libro Blanco del Agua en España (White Book of the Water in Spain); MITECO: Madrid, Spain, 2000; ISBN 84-8320-219-0. Available online: https://www.miteco.gob.es/es/agua/temas/planificacion-hidrologica/water-in-spain_tcm30-527170.pdf (accessed on 13 July 2023).
  8. MITECO. Libro Digital del Agua (Water´s Digital Book); MITECO: Madrid, Spain, 2020; Available online: https://www.miteco.gob.es/eu/agua/temas/planificacion-hidrologica/sia-/infolibrodigital.aspx (accessed on 13 July 2023).
  9. MAPAMA. Large Dams Inventory. Viewer with Diverse Thematic Coverages; MITECO: Madrid, Spain. Available online: https://sig.mapama.gob.es/geoportal/index.html?services=60005&herramienta=ServiceTree&dir=Agua|Inventario%20de%20Presas%20y%20Embalses (accessed on 13 July 2023).
  10. MITECO. Inventario de Grandes Presas y Embalses de España (Spain´s Dams Inventory); MITECO: Madrid, Spain, 2018; Available online: https://www.miteco.gob.es/es/cartografia-y-sig/ide/descargas/agua/inventario-presas-embalses.aspx (accessed on 13 July 2023).
  11. MITECO. Inventario de Barreras Transversales de España (Spain´s Transverse Obstacles Inventory); MITECO: Madrid, Spain, 2020; Available online: https://www.miteco.es/app/descargas/descargafichero.aspx?f=iot.zip (accessed on 13 July 2023).
  12. MITECO. Análisis de Resultados de la Caracterización de Estructuras Transversales Potenciales Para el Paso de Fauna Identificadas en un Muestreo en Infraestructuras Lineales de Transporte de España, Año 2018 (Analysis of the Results of the Characterisation of Potential Transverse Structures for the Passage of Wildlife Identified in a Sampling of Linear Transport Infrastructures in Spain, Year 2018). Ed. SILCO, Estadística y Aplicaciones Ambientales SL; Madrid, Spain. 2018. Available online: https://www.miteco.gob.es/es/biodiversidad/temas/ecosistemas-y-conectividad/estruct_poten_fauna_tcm30-485847.pdf (accessed on 13 July 2023).
  13. MITERD. Public Thematic Coverages for Spain. 2022. Available online: https://www.miteco.gob.es/es/cartografia-y-sig/ide/descargas/agua/default.aspx (accessed on 13 July 2023).
  14. Henao Casas, J.D.; Fernández Escalante, E.; Ayuga Téllez, F.; Standen, K.; Costa, L.; Monteiro, J.P.; Vlassopoulou, A.; Kallioras, A.; Caligaris, E.; Rossetto, R.; et al. Report on the Performance of Optimal MAR Designs; MARSOLut: Darmstadt, Germany, 2023. [Google Scholar]
  15. MITECO. La Corrección de Cauces Torrenciales: Obras Transversales y Longitudinales (Correction of Torrential Watercourses: Transverse and Longitudinal Works); MAPAMA: Madrid, Spain, 2021. Available online: https://www.miteco.gob.es/es/biodiversidad/temas/desertificacion-restauracion/restauracion-hidrologico-forestal/rhf_caracteristicas_correcion_cauces.aspx (accessed on 13 July 2023).
  16. Fernández Escalante, E. Passive and Intermittent Systems as an Adaptation Mechanism to Climate Change. Examples. Legal Framework. Third Lecture of the Short Course on Managed Aquifer Recharge Systems and Water Harvesting Techniques. MAYA Project. University of Sassari, Sassari, Italy. 2018. Available online: https://youtu.be/vRxHFDNvGDs (accessed on 13 July 2023).
  17. Nicolás Rodríguez, J. Restauración hidrológico-forestal de la cuenca del torrente de Arás. Grupo TRAGSA-TRAGSATEC, Madrid, Spain. Tragsa Group-Tragsatec 2001, 221. DL. M-39692-2001. [Google Scholar]
  18. MITECO. Plan Nacional de Actuaciones Prioritarias en Materia de Restauración Hidrológico-Forestal, Control de la Erosión y Defensa Contra la Desertificación; MITECO: Madrid, Spain, 2022; Available online: https://www.miteco.gob.es/es/biodiversidad/temas/desertificacion-restauracion/restauracion-hidrologico-forestal/rhf_plan_restauracion.aspx (accessed on 13 July 2023).
  19. Closas, A.; Molle, F. Groundwater Governance in the Arab World—Taking Stock and Addressing the Challenges. IWMI Project Report 1. 2016. Available online: https://www.iwmi.cgiar.org/archive/wle/project/groundwater-governance-arab-world-taking-stock-and-addressing-challenges/index.html (accessed on 13 July 2023).
  20. Mintegui, J.A.; Fábregas, S.; Robredo, J.C.; Huelin, P. Evaluación de los Efectos de la Restauración Hidrológico-Forestal en la Atenuación de los Riesgos Naturales en las Cuencas de Montaña: Aplicación en el Pirineo Aragonés. Lucas Mallada No. 18, Artículos, 2016, pp. 311–378, ISSN-e 2445-060X. Available online: http://revistas.iea.es/index.php/LUMALL (accessed on 13 July 2023).
  21. Fernández Escalante, A.E.; Calero Gil, R.; Villanueva Lago, M.; San Sebastian Sauto, J. Managed Aquifer Recharge to Combat Groundwater Overexploitation at the Los Arenales Site, Castilla y León, Spain. MARSOL Deliverable 5.4., Madrid, Spain. 2016. Available online: http://marsol.eu/35-0-Results.html (accessed on 13 July 2023).
  22. Fernández Escalante, E. MAR as a Climate Change Adaptation Mechanism, and MAR in Semiarid and Arid Areas. Second Lecture of the Short Course on Managed Aquifer Recharge Systems and Water Harvesting Techniques. MAYA Project. University of Sassari, Sassari, Italy. 2018. Available online: https://youtu.be/nSX5d2CBNw8 (accessed on 13 July 2023).
  23. MITECO. Realización de un Inventario de Obras de Defensa Frente a Inundaciones, Impacto Sobre Hidromorfología y Análisis de Impacto del Cambio Climático (Inventory of Flood Defence Works, Impact on Hydromorphology and Climate Change Impact Analysis); MITECO: Madrid, Spain, 2021; Available online: https://www.miteco.gob.es/ca/agua/temas/delimitacion-y-restauracion-del-dominio-publico-hidraulico/estrategia-nacional-restauracion-rios/Plan-PIMA-ADAPTA-inventario-obras-defensa-inundaciones.aspx (accessed on 13 July 2023).
  24. Schneider, C.; Laizé, C.L.R.; Acreman, M.C.; Flörke, M. How will climate change modify river flow regimes in Europe? Hydrol. Earth Syst. Sci. 2013, 17, 325–339. [Google Scholar] [CrossRef] [Green Version]
  25. González-Hidalgo, J.; Brunetti, M.; de Luis, M. Precipitation trends in Spanish hydrological divisions, 1946–2005. Clim. Res. 2010, 43, 215–228. [Google Scholar] [CrossRef]
  26. MAPAMA. Geoportal MAPAMA. 2020. Available online: https://sig.mapama.gob.es/geoportal/ (accessed on 13 July 2023).
  27. MAPAMA. Manual for the Identification of Pressures and Impact Analysis in Surface Water; Chapter 2; MAPAMA: Madrid, Spain, 2020. Available online: https://www.miteco.gob.es/es/agua/publicaciones/impress_tcm30-214065.pdf (accessed on 13 July 2023).
  28. Tragsatec. Modelo de Datos, Inventario y Almacenamiento de la Información Contenida en el Inventario de Barreras Transversales y de Obras Longitudinales de Defensa (Data Model, Inventory and Storage of Information contained in the Inventory of Transverse Barriers and Longitudinal Defence Works); Technical Report; Tragsatec: Madrid, Spain, 2022. [Google Scholar]
  29. CEDEX. Evaluación de Recursos Hídricos en Régimen Natural en España, 1940/41–2017/18. (Assessment of Natural Water Resources in Spain, 1940/41–2017/18); CEDEX: Madrid, Spain, 2020; Available online: https://www.miteco.gob.es/es/agua/temas/evaluacion-de-los-recursos-hidricos/cedex-informeerh2019_tcm30-518171.pdf (accessed on 13 July 2023).
  30. BOE. Real Decreto 1444/1981, de 22 de Mayo, Sobre Actuación de los Institutos Nacionales de Reforma y Desarrollo Agrario (IRYDA) y Para la Conservación de la Naturaleza (ICONA) en los Programas Extraordinarios del Gobierno Para Combatir el Desempleo Agrario (Action by the National Institutes for Agrarian Reform and Development (IRYDA) and for Nature Conservation (ICONA) in the Government’s Extraordinary Programmes to Combat Agricultural Unemployment). BOE-A-1981-16139. 1981. Available online: https://vlex.es/vid/institutos-iryda-conservacion-icona-254471858 (accessed on 13 July 2023).
  31. CEDEX. Encomienda de Gestión al CEDEX Para la Realización de Trabajos de Asistencia Técnica de la Dirección General de calidad y Evaluación Ambiental y Medio Natural (2014–2016). Actuación No. 8: Actividades de Preparación: Recopilación de Información, Definición del Modelo de Datos y Selección de las Cuadrículas UTM a Muestrear. Informe A8T1, No. 51-414-5-002, Madrid, Spain. 2014. Available online: https://www.miteco.gob.es/es/biodiversidad/temas/ecosistemas-y-conectividad/modelo-datos-estructuras-conectividad_tcm30-195883.pdf (accessed on 13 July 2023).
  32. MITERD. Inventario de Obras Longitudinales de Protección Frente a Inundaciones. Memoria. (Longitudinal Defence Construction Inventory. Memory); Geoportal viewer; Ministerio de la Transición Ecológica y el Reto Demográfico: Madrid, Spain, 2022. Available online: https://sig.mapama.gob.es/Docs/PDFServicios/ZI_IOL.pdf (accessed on 13 July 2023).
  33. MITERD. Acceso al Inventario de Obras Longitudinales de Protección Frente a Inundaciones (Longitudinal Defence Construction Inventory Access); Ministerio de la Transición Ecológica y el Reto Demográfico: Madrid, Spain, 2022. Available online: https://www.miteco.gob.es/es/agua/temas/gestion-de-los-riesgos-de-inundacion/planes-gestion-riesgos-inundacion/Acceso-Inventario-obras-de-proteccion-frente-a-inundaciones.aspx (accessed on 13 July 2023).
  34. IGME. Mapa Litoestratigráfico de España a Escala 1/200,000. (Lithostratigraphycal Map of Spain, Scale 1:200,000); IGME: Madrid, Spain, 2021; Available online: https://igme.maps.arcgis.com/home/webmap/viewer.html?webmap=3dc3fcb142594d6e821c5f645b16ffa1#! (accessed on 13 July 2023).
  35. IGME. Mapa de Permeabilidades de España (Permeability Map of Spain); IGME: Madrid, Spain, 2010; Available online: https://catalogo.igme.es/geonetwork/srv/spa/catalog.search#/metadata/espigmepermeabilidades200continuodigital20100805637842 (accessed on 13 July 2023).
  36. Tragsa. Hidrogeoportal DINA-MAR (DINA-MAR Hydro-Geoportal); Tragsa: Madrid, Spain, 2020; Available online: https://sjc-arcgis.tragsatec.es/portal/apps/webappviewer/index.html?id=d43af99e5b0e4ca8b89a8bc41902545d (accessed on 13 July 2023).
  37. Tragsa. Visor Hidrogeoportal DINA-MAR. Manual de Usuario (Hydrogeoportal DINA-MAR, User´s Manual); Tragsa: Madrid, Spain, 2020; Available online: https://dinamar.tragsa.es/file.axd?file=/PDFS/Visor%20Hidrogeoportal-manual%20de%20usuario.pdf (accessed on 13 July 2023).
  38. MITERD. Sistema Nacional de Zonas Inundables, (National Flood Zone Mapping System, General Cartography), (SNCZI-IPE). 2022. Available online: https://sig.mapama.gob.es/snczi/index.html?herramienta=Presas (accessed on 13 July 2023).
  39. Mozzi, G.; Pavelic, P.; Alam, M.F.; Stefan, C.; Villholth, K.G. Hydrologic Assessment of Check Dam Performances in Semiarid Areas: A Case Study from Gujarat, India. Front. Water 2021, 3, 628955. [Google Scholar] [CrossRef]
  40. IGN. Plan Nacional de Ortofotografía Aérea. Plan Nacional de Observación del Territorio (PNOA-IGN MDT 1 m), (National Aerial Orthophotography Plan. National Plan for Territory Observation, PNOA-IGN DTM 1 m). 2021. Available online: https://pnoa.ign.es/web/portal/pnoa-lidar/tercera-cobertura (accessed on 13 July 2023).
  41. Terzaghi, K.; Peck, R.B. Technology & Engineering; John Wiley & Sons: New York, NY, USA, 1967; 752p. [Google Scholar]
  42. Bendixen, T.W.; Hershbergeb, M.F.; Slater, S. A basis for classifying soil permeabilities. J. Agric. Res. 1944, 77, 157–168. [Google Scholar]
  43. Bouwer, H.; Rice, R.C. Effect of water depth in groundwater recharge basins on infiltration. J. Irrig. Drain. Eng. 1989, 115, 556–567. [Google Scholar] [CrossRef]
  44. Chapuis, R.P.; Gill, D.E. Hydraulic anisotropy of homogeneous soils and rocks: Influence of the densification process. Bull. Eng. Geol. Environ. 1989, 39, 75–86. [Google Scholar] [CrossRef]
  45. Sridhar, G.; Robinson, R.G.; Karpurapu, R. Horizontal Coefficient of Consolidation from Inward and Outward Flow Tests. Proc. Inst. Civ. Eng. Ground Improv. 2017, 171, 159–166. [Google Scholar] [CrossRef]
  46. Bouwer, H. Artificial recharge of groundwater: Hydrogeology and engineering. Hydrogeol. J. 2002, 10, 121–142. [Google Scholar] [CrossRef] [Green Version]
  47. Bouwer, H. Theory of seepage from open channels. Adv. Hydrosci. 1969, 5, 121–172. [Google Scholar] [CrossRef]
  48. Fernández Escalante, E. Practical Management to Minimise the Effects of Clogging in Managed Aquifer Recharge Wells at Two Sites in the Guadiana Basin, Spain. J. Hydrol. Eng. 2015, 20, B5014002. [Google Scholar] [CrossRef]
  49. Fernández Escalante, E.; Henao Casas, J.D.; San Sebastián Sauto, J.; Calero Gil, R. Monitored and Intentional Recharge (MIR) A Model for Managed Aquifer Recharge (MAR) Guideline and Regulation Formulation. Water 2022, 14, 3405. [Google Scholar] [CrossRef]
  50. MITERD. Plan Nacional de Depuración, Saneamiento, Eficiencia, Ahorro y Reutilización—Plan DSEAR (National Plan for Purification, Sanitation, Efficiency, Savings and Reuse—DSEAR Plan); Ministerio de la Transición Ecológica y el Reto Demográfico: Madrid, Spain, 2021. Available online: https://www.miteco.gob.es/content/dam/miteco/es/agua/temas/planificacion-hidrologica/plan_dsear_final_tcm30-529674.pdf (accessed on 13 July 2023).
  51. Versteeg, P.; Peña, K.; Gallegos, J.; Fernández-Escalante, E. Urban Waterbuffer Zorrilla, Valladolid. Pilot Project for Managed Aquifer Recharge and Rainwater Recovery for Irrigation. Field Factors Report. 2021. Available online: https://www.fieldfactors.com/case-studies/urban-waterbuffer-zorrilla-stadium-in-valladolid-spain (accessed on 13 July 2023).
  52. Martín-Rosales, W.; Gisbert, J.; Pulido-Bosch, A.; Vallejos, A.; Fernández-Cortés, A. Estimating groundwater recharge induced by engineering systems in a semiarid area (southeastern Spain). Environ. Geol. 2007, 52, 985–995. [Google Scholar] [CrossRef]
  53. SIKB. Ontwerp, Realisatie en Beheer van het Ondergrondse Deel van Bodemenergiesystemen. Dutch Protocol 11001. 2014. Available online: https://www.sikb.nl/doc/BRL11000/Protocol_11001_v_2_0_20141002.pdf (accessed on 13 July 2023).
  54. Schippers, J.C.; Verdouw, J. The modified fouling index, a method of determining the fouling characteristics of water. Desalination 1980, 32, 137–148. [Google Scholar] [CrossRef]
  55. Bloomfield, J.P.; Marchant, B.P. Analysis of groundwater drought building on the standardised precipitation index approach. Hydrol. Earth Syst. Sci. 2013, 17, 4769–4787. [Google Scholar] [CrossRef] [Green Version]
  56. Bloomfield, J.; Brauns, B.; Hannah, D.M.; Jackson, C.; Marchant, B.; Van Loon, A.F. The Groundwater Drought Initiative (GDI): Analysing and understanding groundwater drought across Europe. Proc. IAHS 2020, 383, 297–305. [Google Scholar] [CrossRef]
  57. Spanish Groundwater Action Plan. Available online: https://www.miteco.gob.es/es/agua/participacion-publica/Plan_Accion_Aguas_Subterraneas_2023_2030.aspx (accessed on 13 July 2023).
  58. MARSOLUT Project Web Site. Available online: Marsolut-itn.eu (accessed on 13 July 2023).
  59. IAH. Commission on Managing Aquifer Recharge. International Association of Hydrogeologists. Available online: https://recharge.iah.org (accessed on 13 July 2023).
Figure 1. Consolidation dyke. Válor River, Granada, Spain. Source: TRAGSATEC.
Earth 04 00031 g001
Figure 2. Retention dyke. Santa Cruz de la Zarza, Toledo, Spain. Source: TRAGSA.
Earth 04 00031 g002
Figure 3. Inventoried transverse structures in Spain from the publicly available shape file [11] (Table 1). Latitude and longitude are in the reference coordinate system EPSG: 4632.
Earth 04 00031 g003
Figure 4. Organization of the database of the inventory of transverse structures.
Earth 04 00031 g004
Figure 5. Distribution of the transverse structures into major river basins. Latitude and longitude are in the reference coordinate system EPSG: 4632.
Earth 04 00031 g005
Figure 6. Distribution of the type of transverse structure.
Earth 04 00031 g006
Figure 7. Degree of certainty of the actual location and existence of each transverse structure.
Earth 04 00031 g007
Figure 8. Distribution of the main use of the structures.
Earth 04 00031 g008
Figure 9. Availability of construction data for transverse structures.
Earth 04 00031 g009
Figure 10. Reconstruction of a riverbank relief from the PNOA’s digital terrain model at 1 m resolution [40]. Example in the Tagus River.
Earth 04 00031 g010
Figure 11. Scheme of buffer zones for various transverse structures to determine the prevailing lithology. Example of an area in the Duero River basin.
Earth 04 00031 g011
Figure 12. Scheme representing the intentional and the unintentional recharges from managed aquifer recharge (MAR) systems and transverse structures in Peninsular Spain. The inventory of MAR sites is taken from [1] and https://dinamar.tragsa.es/post/documentacion-tecnicanoticias (accessed 13 July 2023). The anthropogenic recharge from intentional and (un)intentional MAR (excluding infiltration from large dams and conductions leakages) ranges between 1012.5 Mm3/year and 1514.8 Mm3/year.
Earth 04 00031 g012
Table 1. Link to the websites that present the results of the inventories of dykes, dams, and water obstacles in water courses. All websites were accessed on 13 July 2023.
ThemeNumber of Inventoried StructuresWebsite
Large and medium size dams inventory1773https://sig.mapama.gob.es/snczi/index.html?herramienta=Presas. Accessed on 13 July 2023.
Dykes and small dams (either longitudinal or transverse)42,323https://www.miteco.gob.es/es/cartografia-y-sig/ide/descargas/agua/inventario-presas-embalses.aspx. Accessed on 13 July 2023.
Transverse structures27,680https://www.miteco.es/app/descargas/descargafichero.aspx?f=iot.zip. Accessed on 13 July 2023.
Longitudinal structures14,643https://www.miteco.gob.es/es/agua/temas/gestion-de-los-riesgos-de-inundacion/planes-gestion-riesgos-inundacion/Acceso-Inventario-obras-de-proteccion-frente-a-inundaciones.aspx. Accessed on 13 July 2023.
MITERD’s geoportal- (Viewer)https://sig.mapama.gob.es/geoportal/. Accessed on 13 July 2023.
Table 2. Permeability categories and assigned horizontal hydraulic conductivity (K).
CategoryK (m/day)
Very low0.02
Low0.07
Medium1.02
High4.5
Very high6
Table 3. Code and description of the attributes in the “TRANSGENERALES” table.
CodeDescription
AutoUIDAlphanumeric identifier code.
ID_CLAVECode based on the type of structure and water body.
CODMASCode of the surface water body.
TRAMO_CODCode of the hydromorphological section.
NOM_CCAASpanish autonomous Community where the structure is located.
NOM_PROVSpanish province where the structure is located.
NOM_MUNICISpanish municipality where the structure is located.
NOM_RIORiver in which the structure is built.
DEMARCACIOMajor river basin where the structure is located.
TIPO_INFRType of transverse structure.
CIERTODegree of certainty in the type of transverse structure assigned.
REVISIONESSpecifies whether a structure was visited in the field.
FECHA REVISIONDate on which the structure was visited.
CORD_XX coordinate in ETRS89.
CORD_YY coordinate in ETRS89.
ORIGENSpecify the origin of the information.
BBDD_CONFSpecifies whether it was present in previous databases.
MOD_IMPRESSSpecifies whether the structure information is included or matches the information of the IMPRESS document [27].
Table 4. Code and description of the attributes in the “TRANSTECNICOS” table.
CodeDescription
USO_PMain use of the structure
AÑO_CONSTYear in which the structure was built
Table 5. Code and description of the design and construction information included in the “EFECTO_BARRERA” table.
CodeDescription
H_TOTALTotal height of the construction site, from crest to foundation.
H_SALTOHeight of the fall from the sheet of water to its crest. It may coincide with the total height of the obstacle, depending on the flow conditions.
PROF_POZADepth of the rising pool at the foot of the obstacle.
LONG_CORLength of the infrastructure at the crest.
ANCHO_CORWidth of infrastructure at the crest.
H_AGUA_CORWater depth on the crest.
V_ AGUA Water velocity at the crest, inside pipe or canal, depending on obstacle.
H_ AGUA_TUB Water draught in passage pipe.
PENDIENTEThe slope of the facing (%).
H_ AGUA _PARWater draught on facing.
DIST_COR Distance from the foot of the construction site to the crown of the crest.
LONG_REMLength of the impoundment created by the structure.
ANCH_REMWidth of the impoundment created by the structure.
PROF_REMDepth of impoundment created by the structure.
ANCHO_PREMAverage width of the channel before the impoundment created by the structure.
PROF_PREMMean channel draught before the impoundment created by the structure.
“COLMATACION”Specifies whether there is clogging.
EXIS_PASOIndicates if the structure has a fish ladder (yes/no) or a lateral diversion.
Table 6. Number of transverse structures above lithologies with assigned mean horizontal hydraulic conductivity values.
Permeability CategoryNumber of Structures in the Category
Very low1167
Low11,666
Medium3113
High7265
Very high4469
Table 7. Anisotropy coefficient and clogging correction factor (Ccf) for each categorised lithology in which the structures were built. Kh: horizontal hydraulic conductivity; and Kv: vertical hydraulic conductivity.
LithologyNumber of Transverse StructuresAnisotropy Coefficient (Kv/Kh)Clogging Correction Factor
(Ccf)
Granular30040.10.75
Karstic213410.80
Alluvial16,1390.010.65
Metamorphic40140.00010.30
Volcanic230.010.50
Evaporitic250.50.60
Intrusive23410.010.6
Disclaimer/Publisher’s Note: The statements, opinions and data contained in all publications are solely those of the individual author(s) and contributor(s) and not of MDPI and/or the editor(s). MDPI and/or the editor(s) disclaim responsibility for any injury to people or property resulting from any ideas, methods, instructions or products referred to in the content.

