Article

Influence of Infiltrations on the Recharge of the Nkoabang Aquifer Located in the Center Region, Cameroon

by
Monique Makuate Tagne
1,
Merlin Simo-Tagne
2,*,
Nnaemeka R. Nwakuba
3,
Estelle Ndome Effoudou-Priso
4,
Jules Rémy Ndam Ngoupayou
1,
Michel Mbessa
1,
Ablain Tagne Tagne
1 and
Razika Kharchi
5
1
Faculty of Sciences, University of Yaoundé 1, Yaoundé P.O. Box 812, Cameroon
2
CFA—CFPPA of Mirecourt, 22 rue du Docteur Grosjean, 88500 Mirecourt, France
3
School of Engineering and Engineering Technology, Federal University of Technology, Owerri PMB 1526, Nigeria
4
Higher Teacher’s Training College, University of Yaoundé 1, Yaoundé P.O. Box 47, Cameroon
5
Centre de Développement des Energies Renouvelables, CDER, P.O. Box 62, Alger 16340, Algeria
*
Author to whom correspondence should be addressed.
Earth 2023, 4(1), 23-39; https://doi.org/10.3390/earth4010002
Submission received: 20 December 2022 / Revised: 28 December 2022 / Accepted: 29 December 2022 / Published: 1 January 2023

Abstract

:
Due to the limited reach of the drinking-water delivery network, Yaoundé’s surrounding communities (such as Nkoabang) rely on well water, boreholes, and springs. This study conducted a Thornthwaite water-balance analysis in the watershed in order to understand its hydrology capability and investigated the influence of the flows and infiltrations on the recharge of the aquifer of Nkoabang (Centre Region, Cameroon). The methodology of this work consisted of updating the rainfall and temperature data of the Mvan meteorological station in Yaoundé to carry out the hydrological and water balances of the Nkoabang aquifer and performing the piezometric monitoring of seven wells and one spring in the dry season and the rainy season. The average rainfall height for the period between 1951–2017 was 1577 ± 222 mm, while the monthly temperatures ranged from 22.8 (July) to 25.4 °C (February) for an average of 24.1 °C ± 0.8 °C. The average interannual infiltration was 137 mm, corresponding to an infiltration coefficient of 8.68%. The value of the piezometric levering varies between 706 and 718 m for an average of 711.76 m during the dry season. It fluctuates between 706 and 719 m during the rainy season for an average of 712.95 ± 4.09 m. Irrespective of the season, the highest and lowest values are those of P6 and P3, respectively. Piezometric level values vary little from one season to another but are higher in the rainy season than in the dry season. Wells in the study area generally show small variations in piezometric level amplitude, ranging from 0.4 to 3.3 m with an average of 1.19 ± 1 m. The analysis of the piezometric map of the Nkoabang aquifer shows a flow in the NE-SW direction; storage areas south of the study areas and the water supply area in the peaks and NE of Nkoabang. The daily indicative flow rates of the spring (S) are 0.15 m3 (dry season), which can supply in the dry and rainy seasons 36 to 46 people, respectively, based on a ratio of 0.1 m3 per day per habitant.

1. Introduction

During the United Nations meetings and conference of Rio on environment and development in 1945 and 1992, respectively, the water right has been mentioned as a capital necessity for humanity. In recent decades, the demographic increase and the new model of industrial and urban life in towns of poor countries have destroyed the rural medium and saturated the towns. This saturation state of the urban towns of poor countries creates a shortage of drinking water in cities because the distribution network of water does not increase with the same kinetic as the demographic increase.
In Yaoundé, the political capital of Cameroon, the capacity of the distribution of drinking water is around 150,000 m3/day; 100,000 m3/day from the Nyong river and 50,000 m3/day from the Mefou river [1]. Considering the annual rate of the demographic increase of Yaoundé (5.8% [2]), the population number is near 3,000,000 in Yaoundé and more than 300,000 m3/day of water is needed [1].
Due to this deficit, the population has a recourse in groundwater. In the Nkoabang quarter (the geographical space of this study), 80% of the inhabitants use rainwater, 13% use boreholes, and the remaining 7% obtain water from natural fountains. In Yaoundé, 43.6% of inhabitants obtain water from boreholes, 47.7% from natural fountains and rainwater, and the rest from mineral water [3]. However, a galloping demography raises questions about the rational use of groundwater resources. It seems of capital importance that a study of the hydrodynamic behaviour of the aquifer at Nkoabang is carried out.
Several studies have been carried out to determine the physical and hydrodynamic characteristics of the aquifers of the sub-basins of the Mefou river, precisely the sub-basins of Ekozoa [4], Mingoa [5], Ntem [6], Ebogo-Ewoué [7], Olézoa [8], Biyémé [9], Ntsomo [10], Anga’a [11], Nkié [12], Odza [13], and Mingosso and Abiergué [14]. In the Anga’a watershed sub-basin, southeast of the city of Yaoundé, many works have been carried out by Djeuda Tchapnga et al. [15,16], Medza Ekodo [17], and Fouépé Takounjou et al. [11,18] on circulation models, recharge mechanisms, and groundwater residence time of alternates on piezometric, hydro-dynamics, groundwater beating, groundwater flow modelling, and mass transport simulation in a shallow aquifer, respectively. However, the studies of Ntsama [19], carried out in Nkoabang-East (North-East of Anga’a and South-West of Afamba), have contributed to the knowledge of favourable areas for the establishment of the catchment in the long dry season and the long rainy season.
Water infiltration in an infiltration recharge basin is affected by temperature and air entrapment [20]. In effect, applied in Lyon (France) during different seasons, the study [20] showed that the infiltration rate is influenced by the season. Thus, it is critical to study the water infiltration according to the season and the position. Other studies such as Samanta [21] and Revueltas-Martínez et al. [22] agree with this point of view. Qi et al. [23] studied water infiltration under constant head conditions. Niyazi et al. [24] analyzed the infiltration models for groundwater recharge in Al Madinah Al Munawarah Province, Saudi Arabia. Using the Philip, Horton, Kostiakov, and Green–Ampt infiltration models, they concluded that groundwater recharge is strongly influenced by the infiltration process. Applied to the southwestern United States, Thomas et al. [25] concluded that precipitation intensity affects groundwater recharge. Rapid urbanization influences groundwater recharge [26]. Mathematical models can be used to manage groundwater infiltrations [27,28,29,30]. Before modelling the groundwater infiltration of a town, an experimental study is critical to adapting results to the studied space [31].
The main objective of this work lies in the qualitative comparison and examination of the influence of infiltrations on the groundwater of Nkoabang in order to justify the management of water surplus and water deficit of this city. Its specific objectives are to update rainfall data to assess infiltration in Nkoabang, to carry out the piezometric monitoring of wells and boreholes in the short rainy season and then in the short dry season in order to determine the piezometric level and to assess its amplitudes, and to deduce an evolutionary trend from the estimated values of seasonal infiltration and the average values of piezometric levels.

2. Materials and Methods

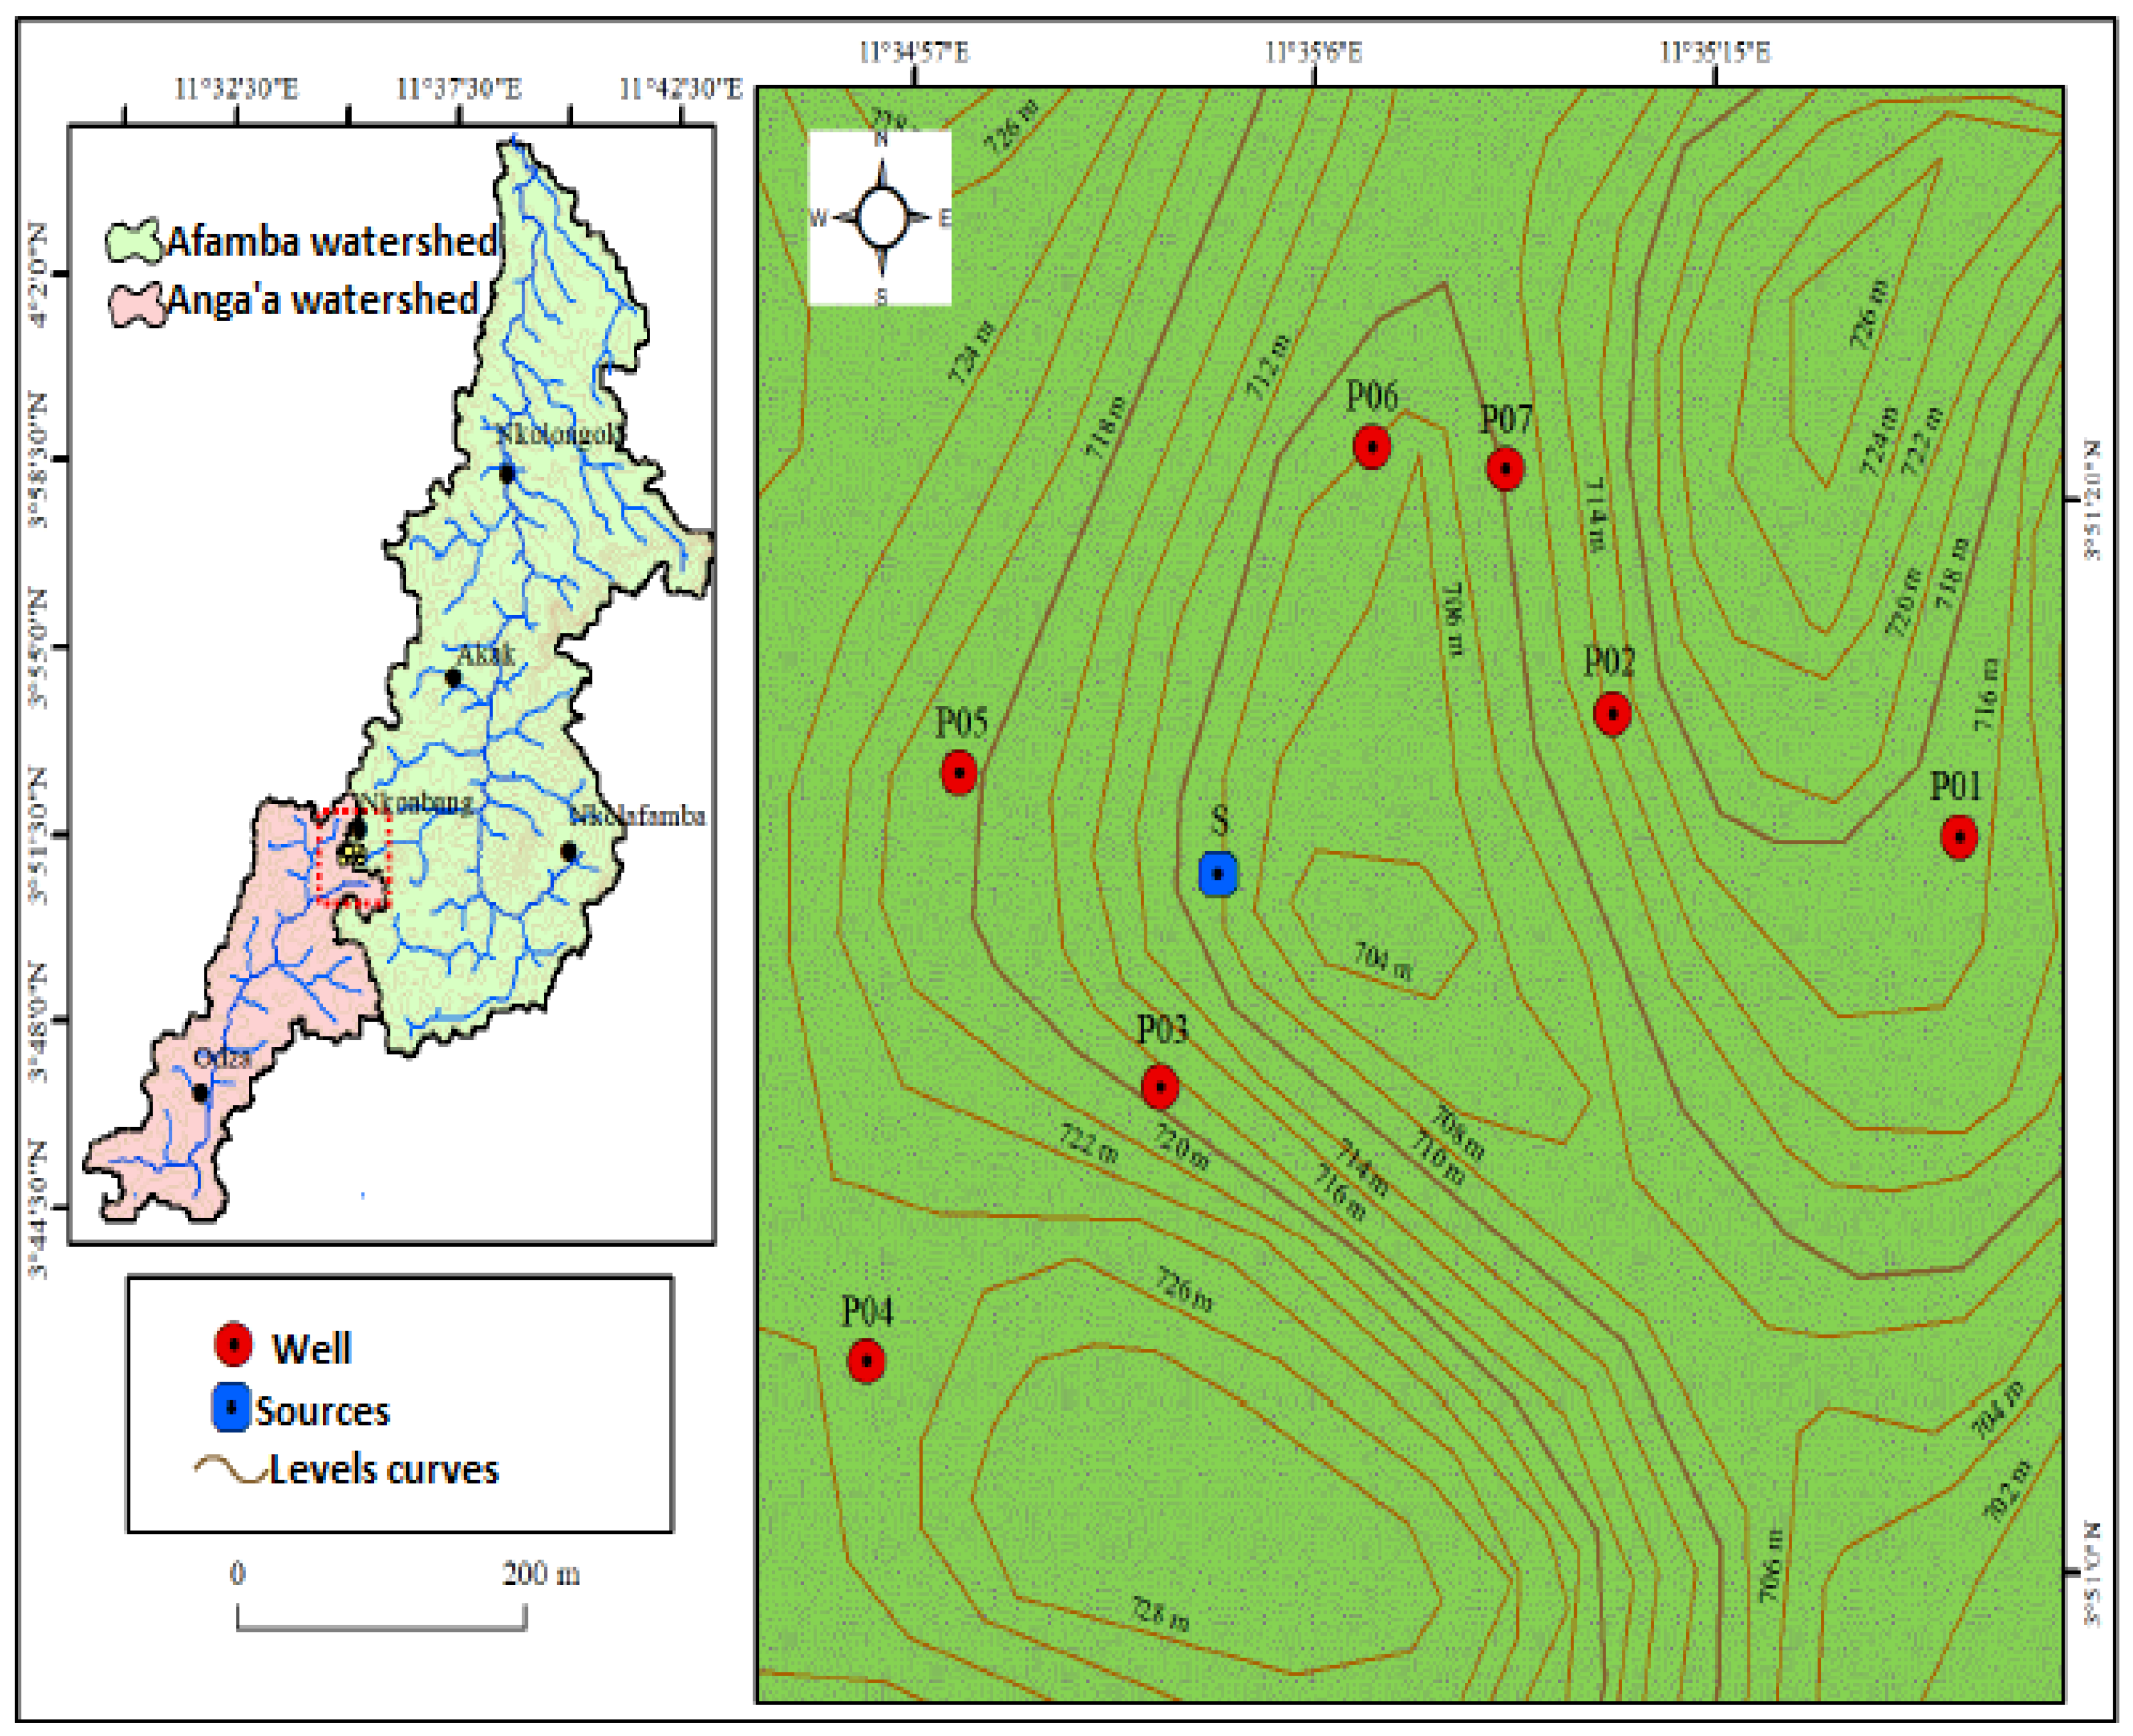
2.1. Geographical Space of the Study

The locality of Nkoabang is located at 3°40′ N to 3°52′ N latitude, and 11°34′ E and 11°53′ E longitude. This town is situated in the Centre Region of Cameroon, located at the department of Méfou et Afamba and in the district of Nkol-Afamba. Nkoabang is limited by the district of Abom in the north, the district of Lada in the south, the district of Nkolbisson in the east, and the district of Nkodengui in the west.

2.2. Climate

According to the climatological data of Yaoundé during the period from 1951 to 2017, interannual monthly precipitations ranged from 18.8 mm recorded in January to 284.2 mm recorded in October. The average interannual rainfall is near 1586.2 mm. The temperature of the ambient air of Yaoundé varies slowly during the year. The highest, 25.4 °C, is generally observed in February and the weakest, 22.8 °C, is observed in July. The relative humidity values of the ambient air of the studied space ranged from 71% (in February) to 82.5% (in July and August) for an average monthly interannual value of 78.4% [19].
The ombrothermic diagram produced from rainfall and temperature data from the Yaoundé meteorological station for the period of 1929–2017 indicates that the climate has four unevenly distributed seasons: two rainy seasons, one dry season, and one sub-dry season.
Using the De Martonne aridity index, four climatic periods can be distinguished in the studied space: one dry, two sub-dry and one wet. Thus, the De Martonne aridity index confirms the results given by the ombrothermic diagram applied at Yaoundé. Some old studies also confirm this result, such as the study by Sighomnou [32].
The city of Yaoundé is highly subject to human activities (urbanization). The original dense, equatorial forest has disappeared to give way to a few relics of forests and fruit trees. Fields of food crops are observed on both sides. We also note the presence of some seasonal cereals. Urbanization has led to the destruction of the dense forest in the locality of Nkoabang. The vegetation encountered is mainly made up of food-crop plantations such as those found in Yaoundé.

2.3. Geomorphology

Three great morphological types can be cited: the residual reliefs that look like hills culminate at 1295 m and are found to the north and west of the city (1); the tabular zones, stepped from 700 to 850 m,, constitute flattened steps corresponding to armored mounds. This landscape forms the Yaoundé plateau with an average altitude of 750 m (2), and lowlands are found in regions with altitudes below 700 m (3). The study area consists of landforms at altitudes between 580 and 880 m. The morphological units found there are therefore the stepped tabular zones and the lowlands.

2.4. Hydrography

The city of Yaoundé and its surroundings are drained to the north by the tributaries of the Sanaga River and to the south by those of the Nyong River. Most of the courses of the city of Yaoundé are the tributaries of the Mfoundi, whose hydrographic network is dense and dendritic. The Mfoundi has its source in the NNW of the city, more precisely at the top of Mount Fébé, at an altitude of about 950 m. It is the main tributary on the left bank of the Mefou.

2.5. Geology

Yaoundé is made up of metamorphic rocks divided into two entities: the para-derived gneisses and the ortho-derived gneisses. The para-derived gneisses are found to the north of the city, where they form the metasedimentary complex. The very foliated weft rock is a garnet and kyanite gneiss. These rocks are very aluminous and rich in garnet, kyanite, and muscovite. The fourth-derived gneisses form the metaplutonic ensemble. They consist of garnet and pyroxene gneisses. They are generally darker than para-derived gneisses due to their abundance of dark minerals. There are two types of soils much more represented in the city of Yaoundé and its surroundings; these are ferritic soils and hydromorphic soils. Red ferritic soils are more abundant and are located at the level of the interfluves. They are very thick (sometimes more than 20 m), clayey, and acidic (pH ≈ 5.5) and consist mainly of kaolinite, hematite, goethite, gibbsite, and quartz. Their profile shows from base to top an isalterite or saprolite level, an alloteritic level, a level of accumulation of iron oxyhydroxides and kaolinitic clay, and a thin level of topsoil [33]. The isalterite or saprolite level (2 m and more) presents a preserved bedrock structure and overlies the unfissured gneiss at the base; there are relics of quartz, rutile, and kyanite and the development of a fissured system parallel to the original bedding. The cracks are millimetric and filled with fillers composed of kaolinite and iron and aluminum oxyhydroxides [34]. The alloteritic level is mottled or vermiculated. There are ghosts of the original minerals. This level is thin (1 to 2 m) and has low porosity. It is made up of goethite and hematite. The level of accumulation of iron oxyhydroxides and kaolinitic clay consists of dominant, lithorelict ferruginous nodules of irregular platelet shape. Finally, we have the thin level of topsoil (humus film). This is located at the bottom of the slope and consists of clay minerals, iron oxides, and quartz. Its water redistribution is slower when compared to red soils [35]. It presents, from bottom to top, three levels [36]: the transition level, porous (40 to 50%) and made up of clays and iron oxides; the porous middle level, also made up of clays and iron oxyhydroxides; and the upper level, motley and very clayey, porous, rich in iron, and poor in quartz. Hydromorphic soils are found in marshy valleys and are characterized by the accumulation of slightly decomposed organic matter above the grey sandy and clayey complex; from the surface to the depth, the colour changes from light grey to yellow–brown.

2.6. Social and Economic Context of the Studied City

The city of Yaoundé has experienced a demographic boom. The urbanized space of the city of Yaoundé is approximately 310 km2, with an urbanization rate which increased at 5.5% between 1987 and 2005 [37]; the population was estimated at 313,706 inhabitants in 1976 and at 649,252 inhabitants in 1987. In 2016, the population of Yaoundé is estimated at around 3 million inhabitants with a growth rate. The satisfaction of drinking water needs is on average equal to 37.5% in Yaoundé [3]. This drinking water supply rate is higher in high-end or planned neighbourhoods such as Bastos, Cité Verte, SIC Mendong camp, and Biyen-Assi (70 to 80%). It is low in spontaneous central or peri-central neighbourhoods such as Messa Carrière, Mvog-Mbi, Nkol-Eton, and Mokolo, etc. [3]. In the neighbourhoods located on the outskirts of the city, the problems of drinking water supply are very marked due to the limited extension of the distribution network of the Cameroonian water company (CDE).

2.7. Methodology

Understanding the hydrodynamics of the waters of Nkoabang requires an appropriate methodology. This section describes the methods implemented for the acquisition and interpretation of piezometric, hydrometric, and hydrological data.
Several reasons motivated the choice of structures intended for piezometric monitoring, in particular:
The accessibility and representativeness of water points. The works are chosen according to the existence of a path, giving access to them, and the solicitation of the population for the needs of consumption;
The spatial distribution in relation to the topography of the top of the slope, mid-slope, and the bottom of the low slope and the border of the marshy zone;
The agreement of the owners. A structure can only be selected for piezometric measurements if the owners give a favourable opinion on the request.
The water points were plotted on a topographic map on a scale of 1:5000 using geographical coordinates (longitude and latitude), and the rating was obtained using a GPS (Global Positioning System).
The altitude, which is the elevation above sea level, was also recorded in order to determine the piezometric level at each of the points.
Piezometric monitoring was carried out using a manual sound probe. This monitoring was performed during a dry season (July) and a rainy season (October). The measurements taken in the field made it possible to calculate the piezometric level (H). The different values of the piezometric level obtained were used to establish the piezometric maps during periods of flood and low water. The analysis of these maps aims to highlight the dynamics of surface and underground flows. Seven wells and one spring were chosen in the study area (Figure 1).

2.8. Measurement of Static Levels

The static level (NS) is the depth of the water table at rest or equilibrium. It is the piezometric level not subject to pumping, injection, or recharge. It corresponds to the upper limit of the water table in the piezometer (wells, boreholes, etc.). The depth of water in the well is denoted as hp. This depth was measured using a sound probe. This probe consists of a graduated wire, at the end of which is an electrode, and a sound device that informs when the electrode touches the surface of the water. At this time, the reading of the depth value (hp) is performed by bringing the graduated wire to the edge of the well.
The piezometric level or altitude of the water table noted (H) is the difference between the altitude of the place given by the GPS (Z) and the depth of the water obtained by the sound probe (hp).
H = Z hp
where H indicates the piezometric level; Z indicates the altitude of the reference point of the structure; and hp represents the depth of the water body in the structure. The elevation of the marker (Z) or the elevation corresponds to the topographic elevation of the elevation point located at the edge of the good rim. The piezometric level (H) at a given place and date in the year is the level reached by the water at a given point and at a given time in a water table.

2.9. Hydrometry

Hydrometry is the measurement of flow rates. These flows were measured at a sourcing representative of the study area. The flows were measured by capacitive gauging. This technique consists of filling a container of a known volume in a known time. Time is measured using a stopwatch. The spring discharge is the quotient of the ratio of water volume to time. The analysis of flow variation over time can provide quantitative information on the characteristics of aquifers.

2.10. Laboratory Works

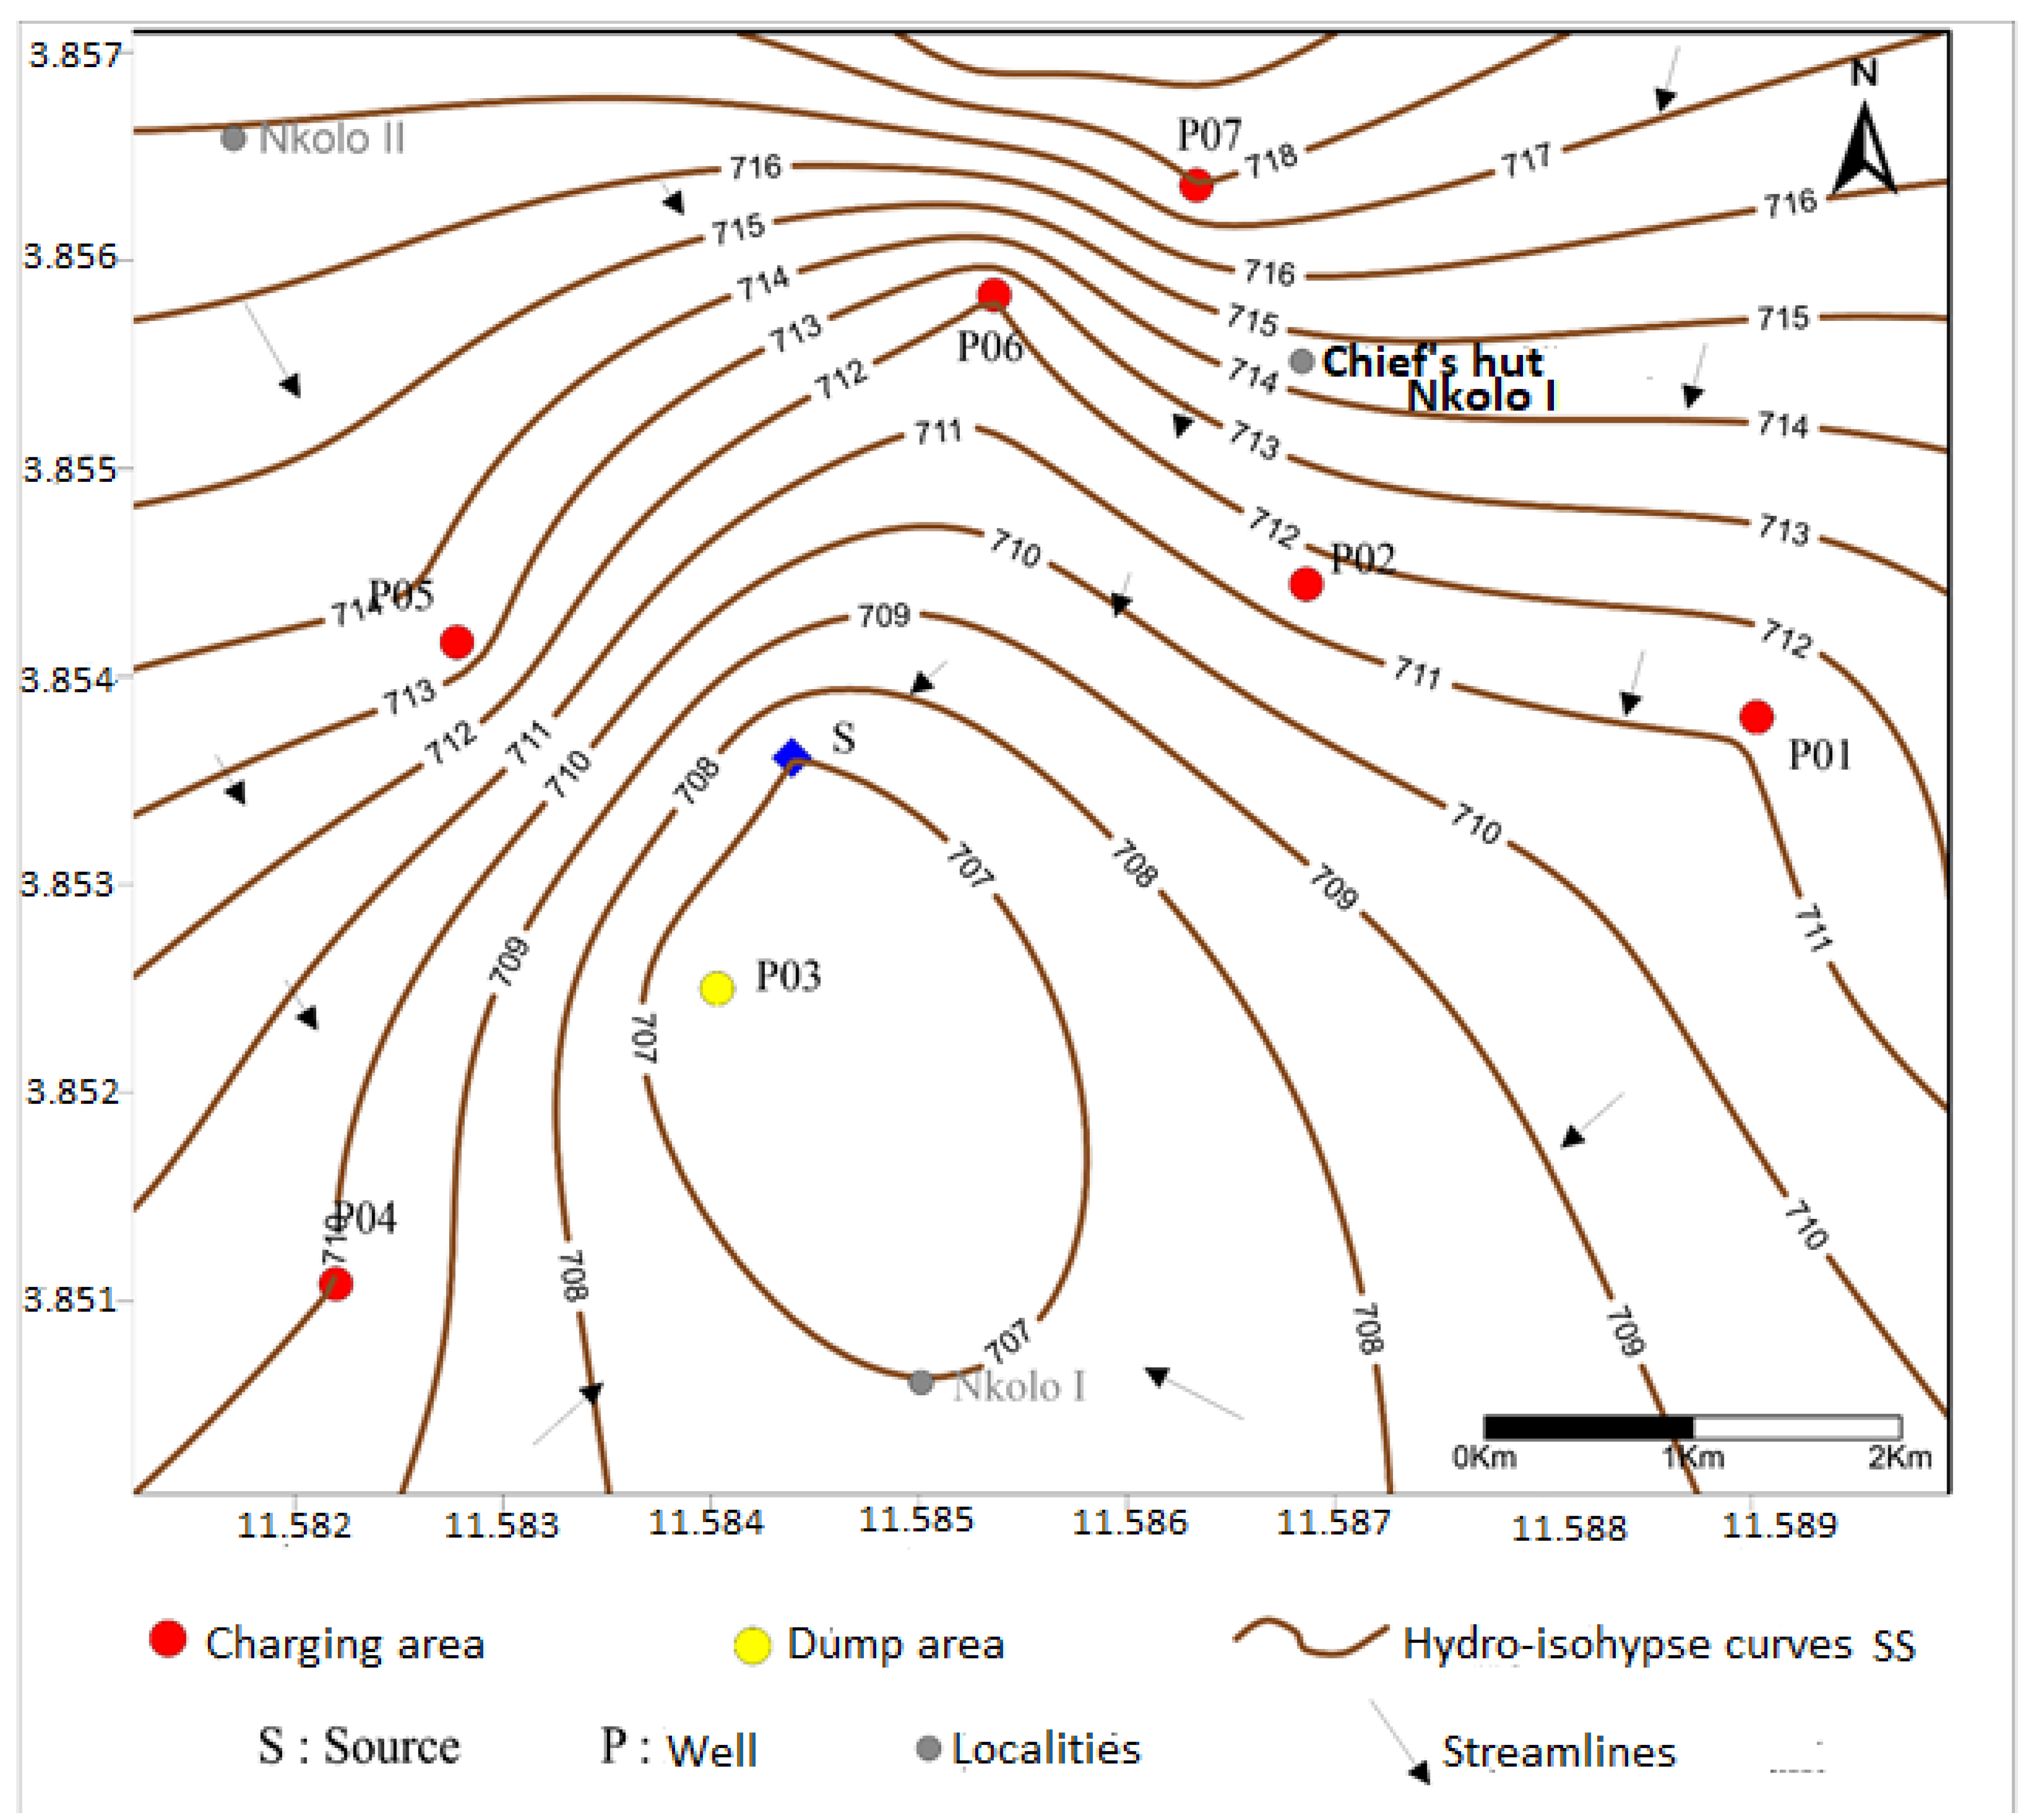
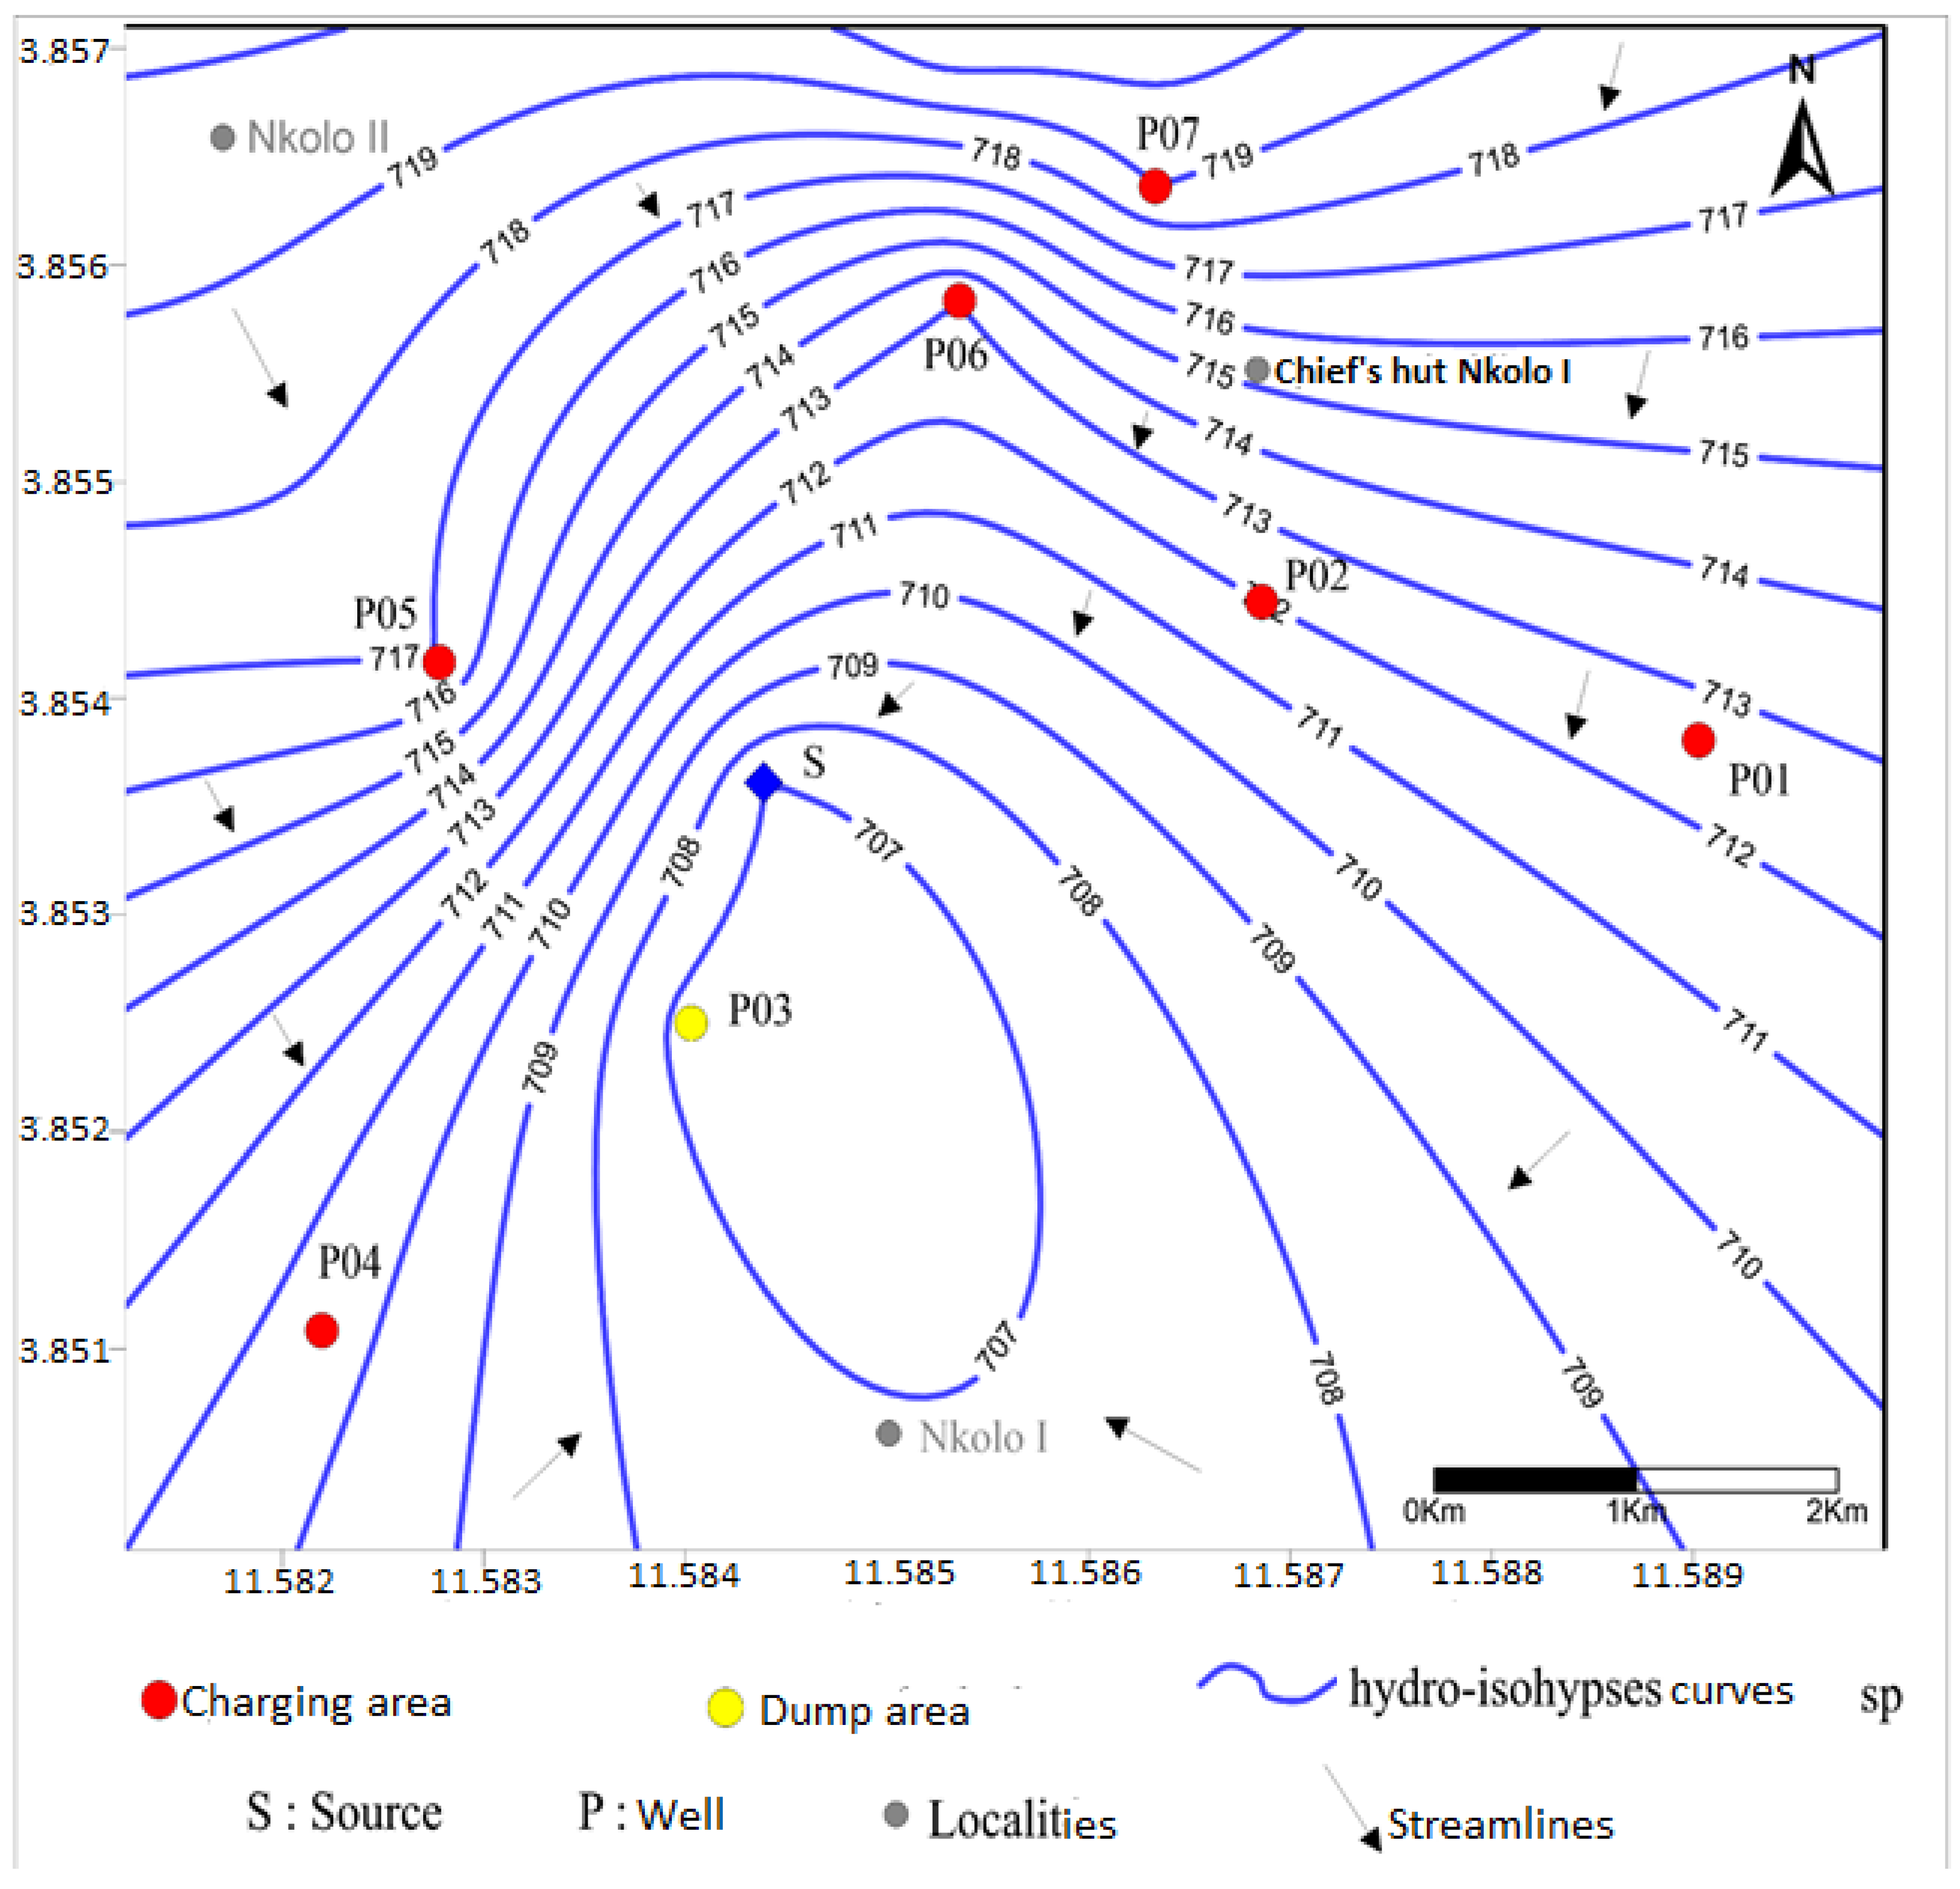
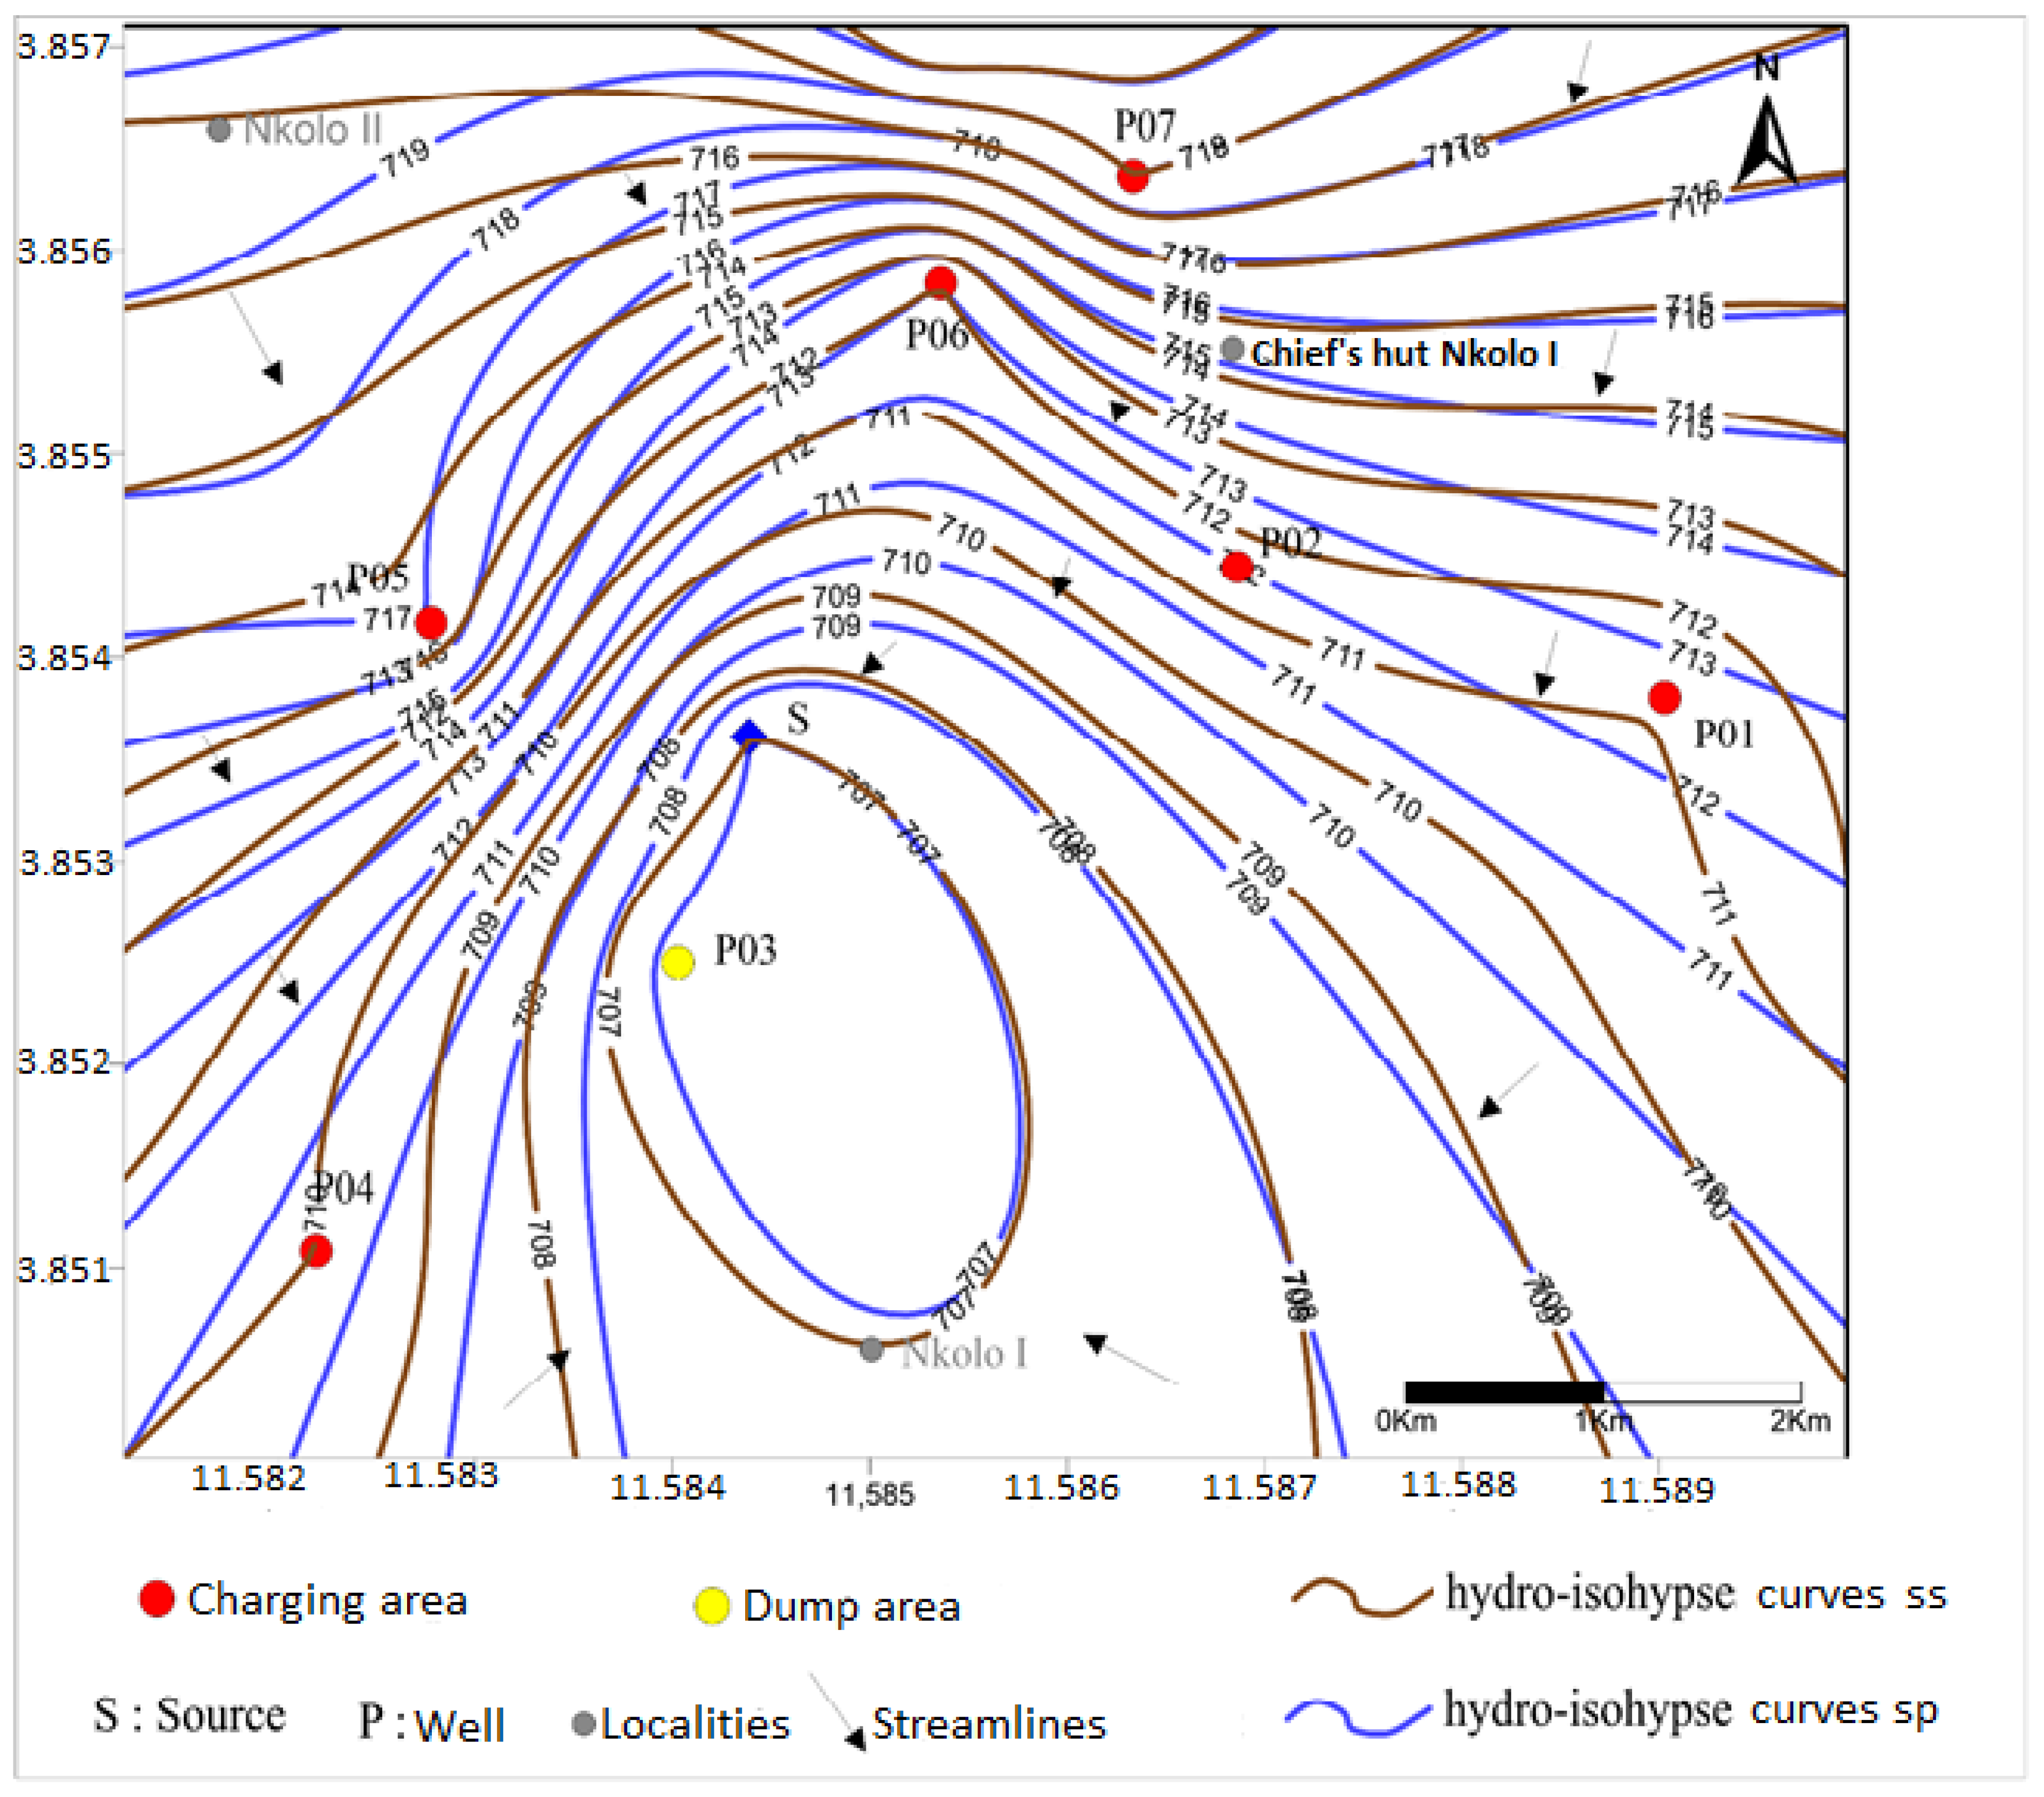
2.10.1. Preparation of the Piezometric Map

Tthe piezometric data interpolation method by computer programs was used in this study because it is fast and provides better interpolation. The computer software used were ArcGis 9.3 and Surfer 10.
The curves that connect all the points of the same altitudes on a piezometric map constitute the water level curves (or piezometric curves or hydroisohyetes curves). If a well is dug at any point belonging to one of these curves, the altitude of the water table obtained would be identical to that of the points of this curve. All of these curves form the water table map or piezometric map. The level of the water table is not the same at the different points of space, and the piezometric map indicates the height reached by the water if a well is dug at any point.

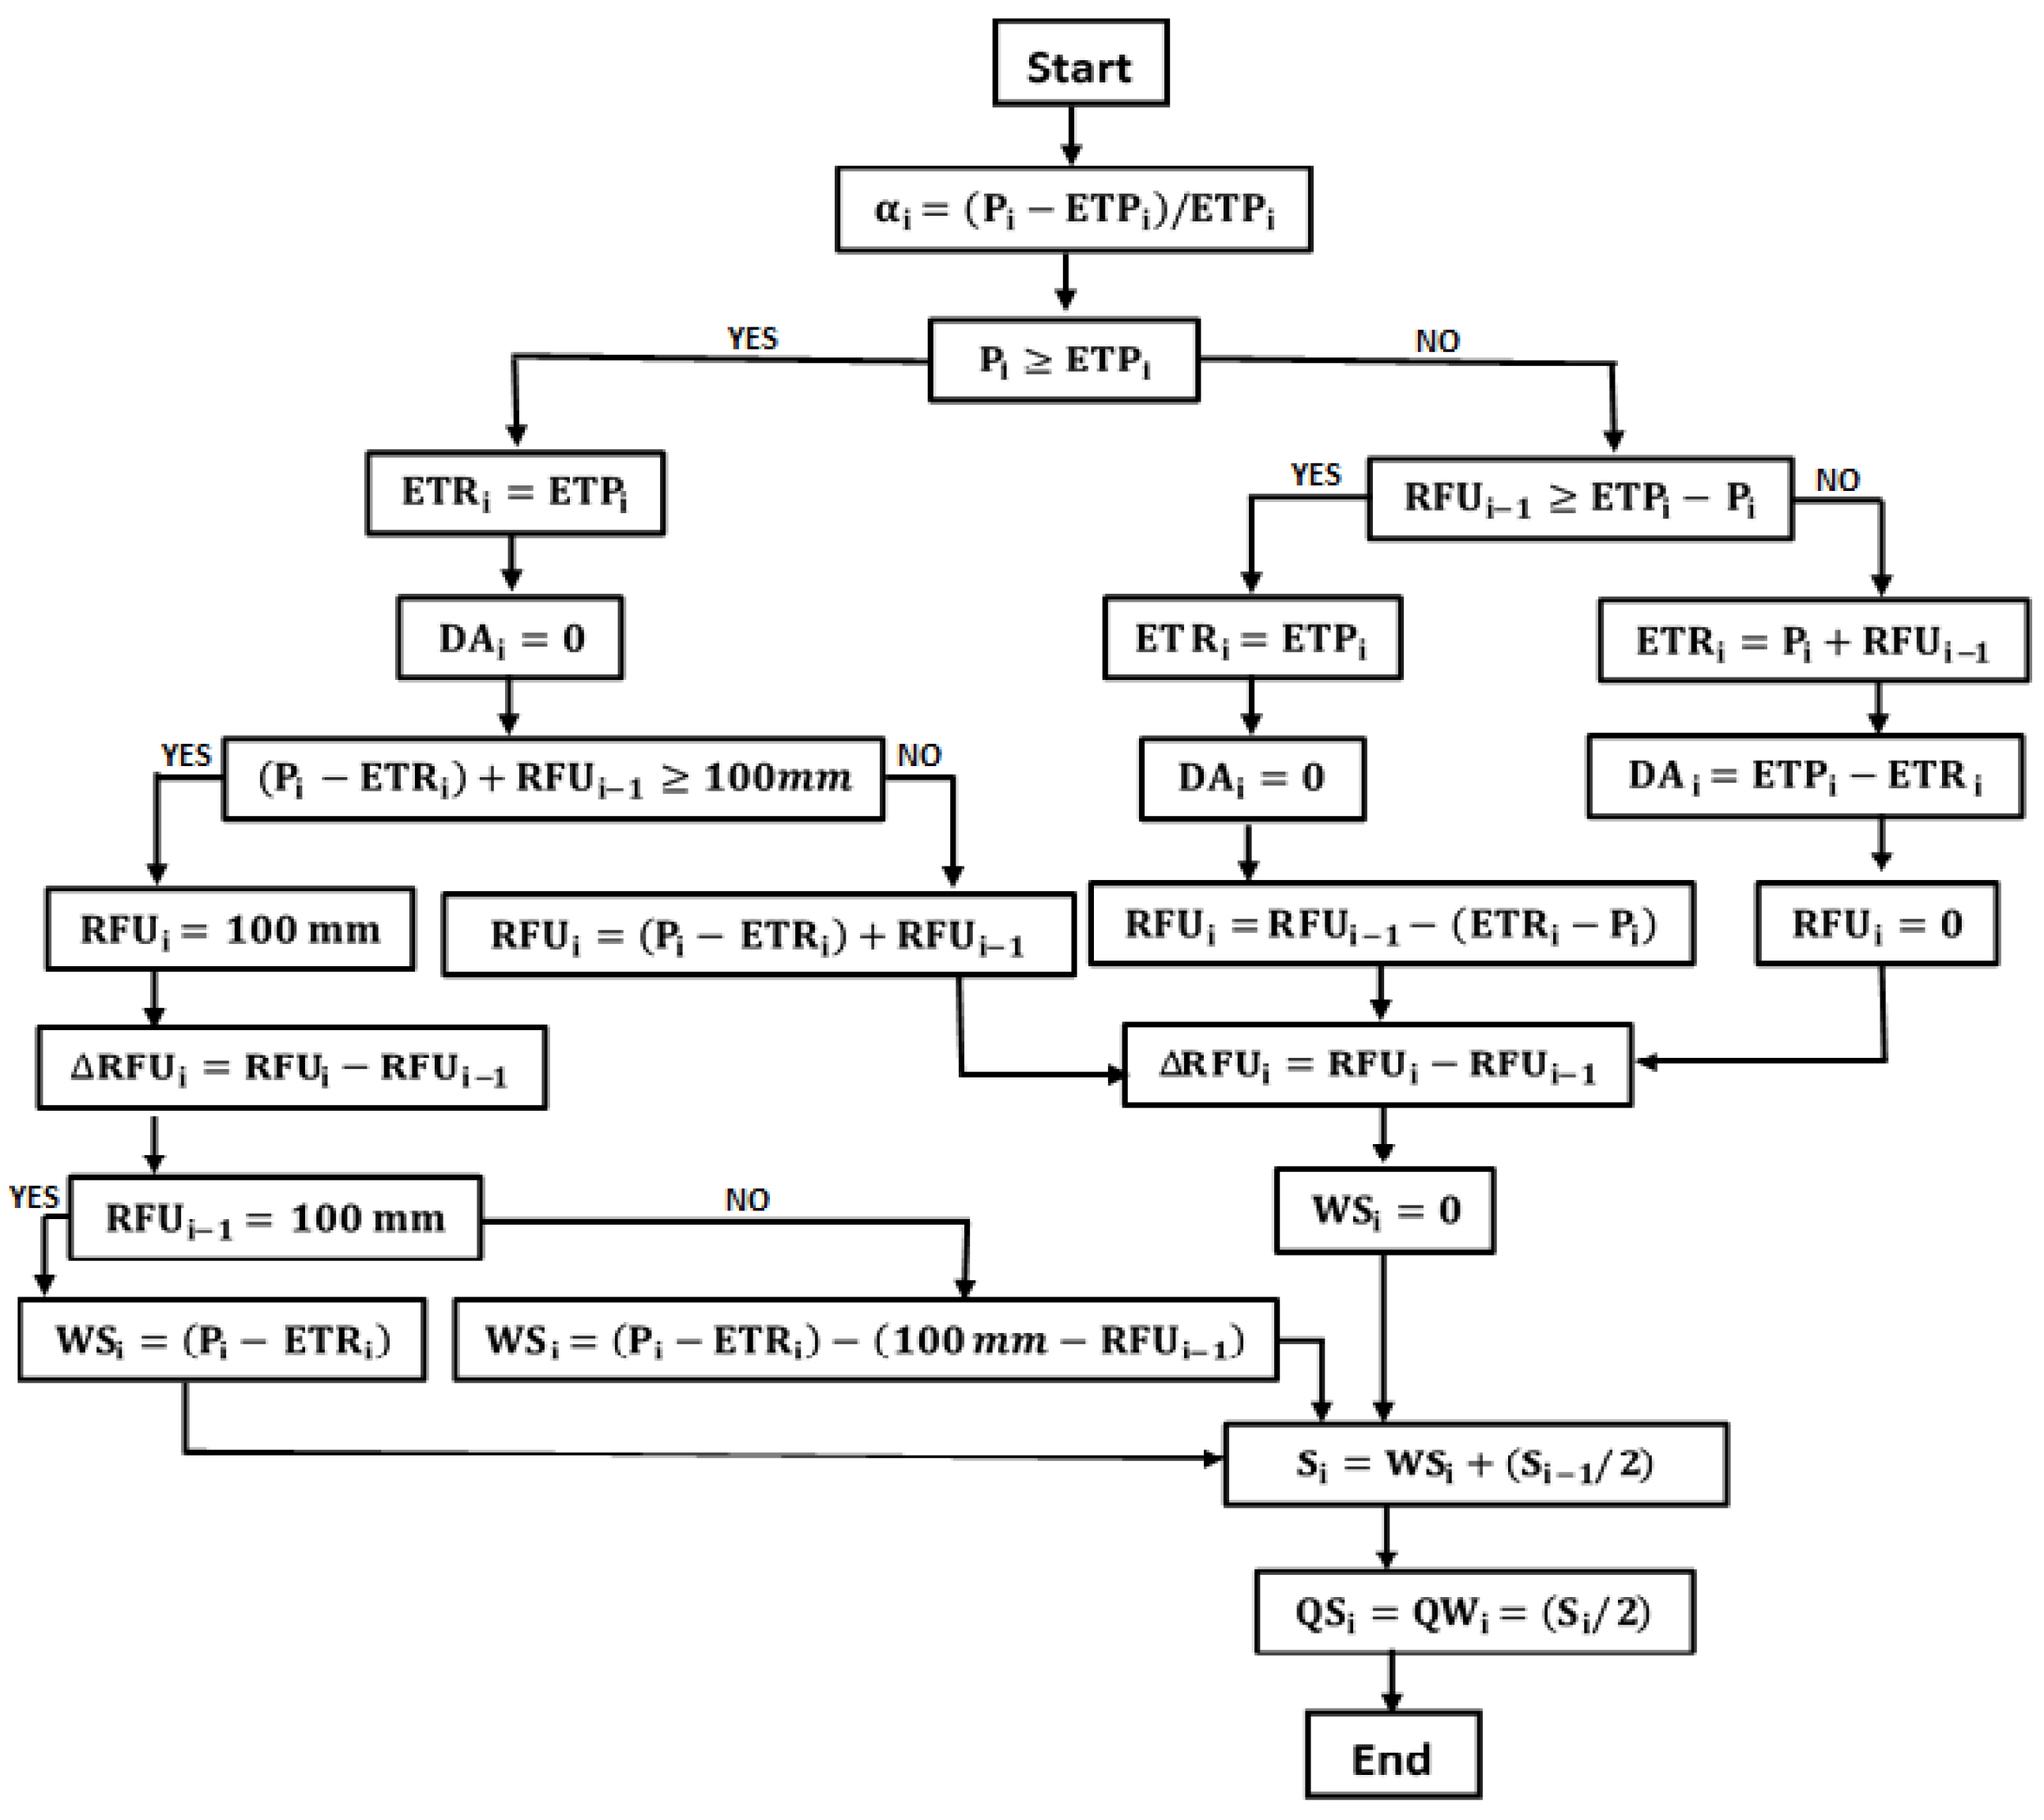
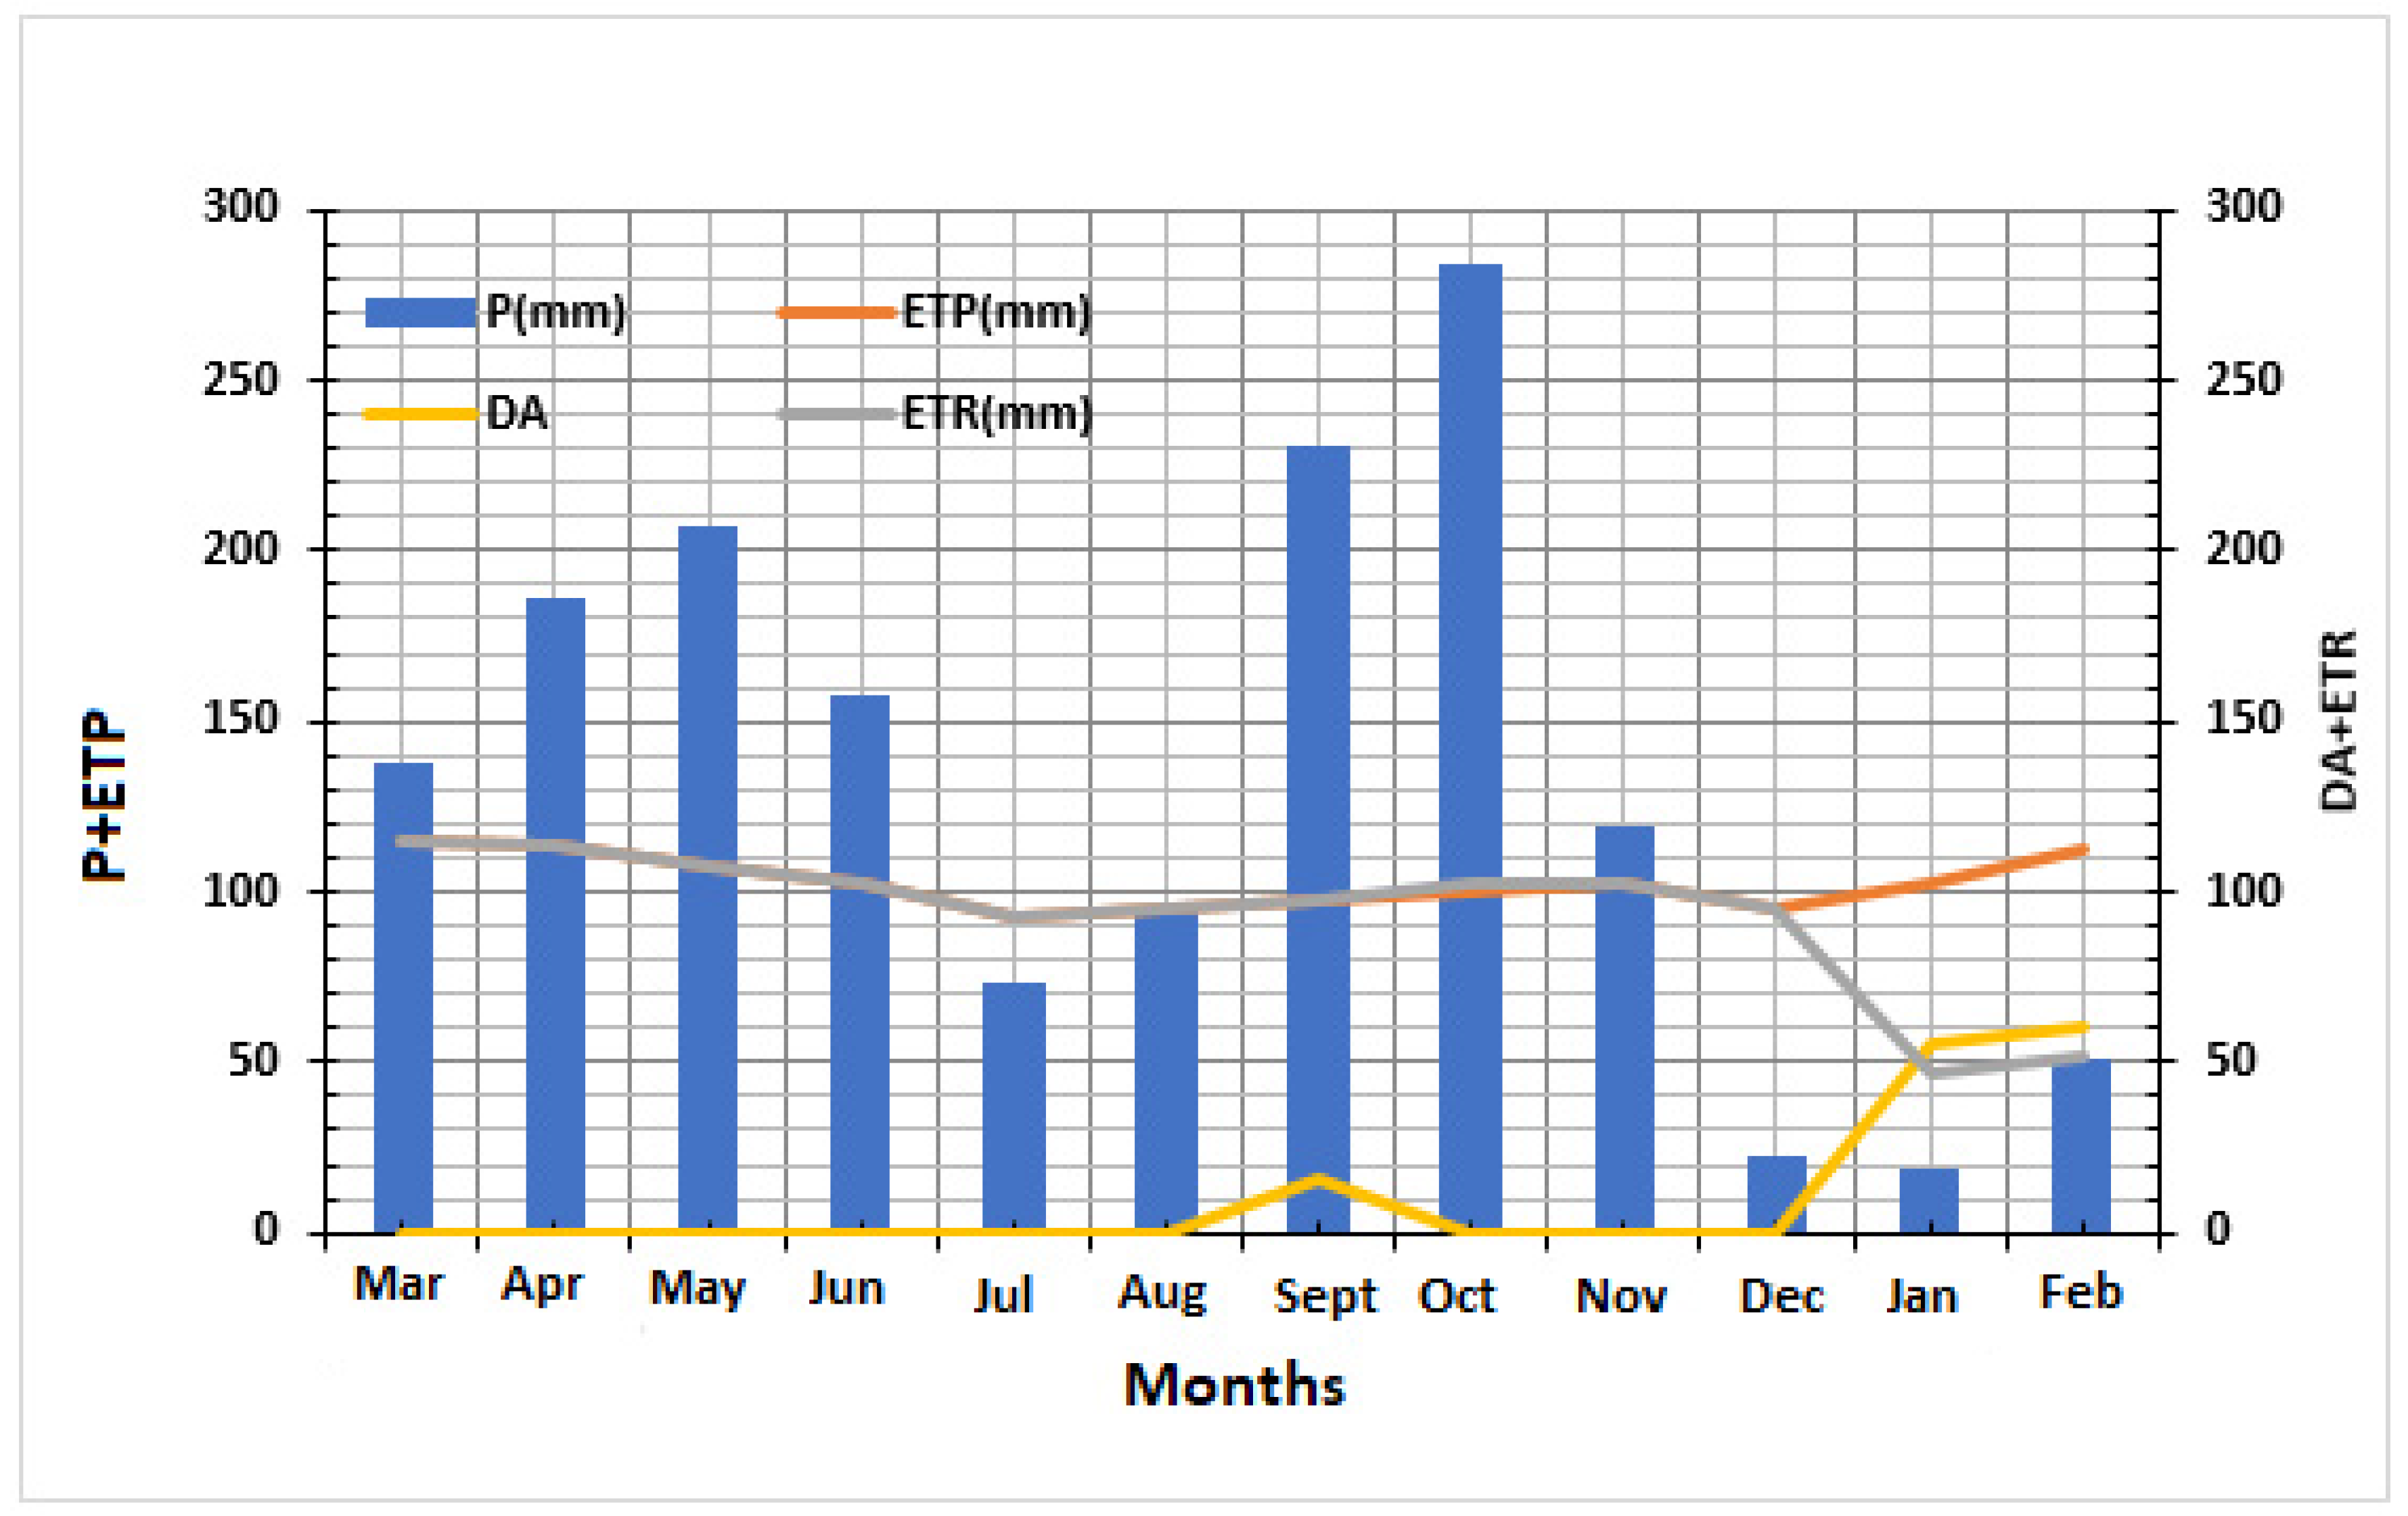
2.10.2. Water Balance according to Thornthwaite and Hydrological Balance

The Thornthwaite method is used with a great satisfaction in the literature to predict the real (or actual) evapotranspiration and the potential evapotranspiration [38,39,40,41,42,43]. Thornthwaite and Mather’s modified moisture index scheme and the method of Thornthwaite are widely used and accepted in the literature for modelling water balance [38,39,40,41,42,43,44]. Thornthwaite’s water balance [38] makes it possible to assess the monthly runoff deficit and takes into account the soil reserve from one month to the next [39]. Thornthwaite’s method first consists of calculating the potential evapotranspiration (ETP), which can be assimilated into the evaporating power of the atmosphere. This potential evapotranspiration is a function of the monthly average temperature using monthly thermal indices (i) calculated by the formula [38,39,40,41,42,43,44]:
i i = ( t i 5 ) 1.514
ETP i = 16 ( 10 t i I ) α ;   α = 2.64  
I = i = 1 12 i i = i = 1 12 ( t i 5 ) 1.514
where ti is the monthly mean temperature (in °C) and ii is the monthly thermal index. The following water balance parameters obtained are: actual evapotranspiration (ETR) is the amount of water evaporated by the soil and by plants when the soil is at a certain humidity. It varies at a given moment or a given period. The readily usable water reserve (RFU) is reserved by plants through their osmotic tension [39]. It is contained in the unsaturated zone of the soil. The potential evapotranspiration or the evaporation potential of soil is defined as the amount of evaporation that could occur given an adequate water supply [39]. Once the evapotranspiration has been evaluated by the Thornthwaite method, the infiltration will be calculated from the formula below:
I = P ( ETR + He )
with I representing the average annual infiltration (in mm); P representing the average monthly precipitation (in mm); ETR indicating the real average annual evapotranspiration (in mm); and He representing the average annual flow of water (in mm).
The average annual runoff was deduced from the relationship proposed by Olivry [45]. According to this author, the rivers of Cameroon are linked to the average annual precipitation by the following relationship:
He = 0.973 P 1047
where He is the average annual flow of water (in mm) and P is the average annual precipitation (in mm).
The different components of the water and hydrological balance are calculated using the formulas contained in Figure 2.
The fieldwork carried out in the Nkoabang area and its surroundings essentially consisted of the geographical location of sampling points, the inventory of hydraulic structures and water points, and the measurement of static levels. The work carried out in the laboratory made it possible to draw hydroisohypse curves thanks to the processing of piezometric data by the interpolation method. These figures were made using computer-processing programs and by using Excel software. These tools have made it possible to produce graphs and tables in order to better interpret them. The results of these treatments will be the subject of the next section.

3. Results

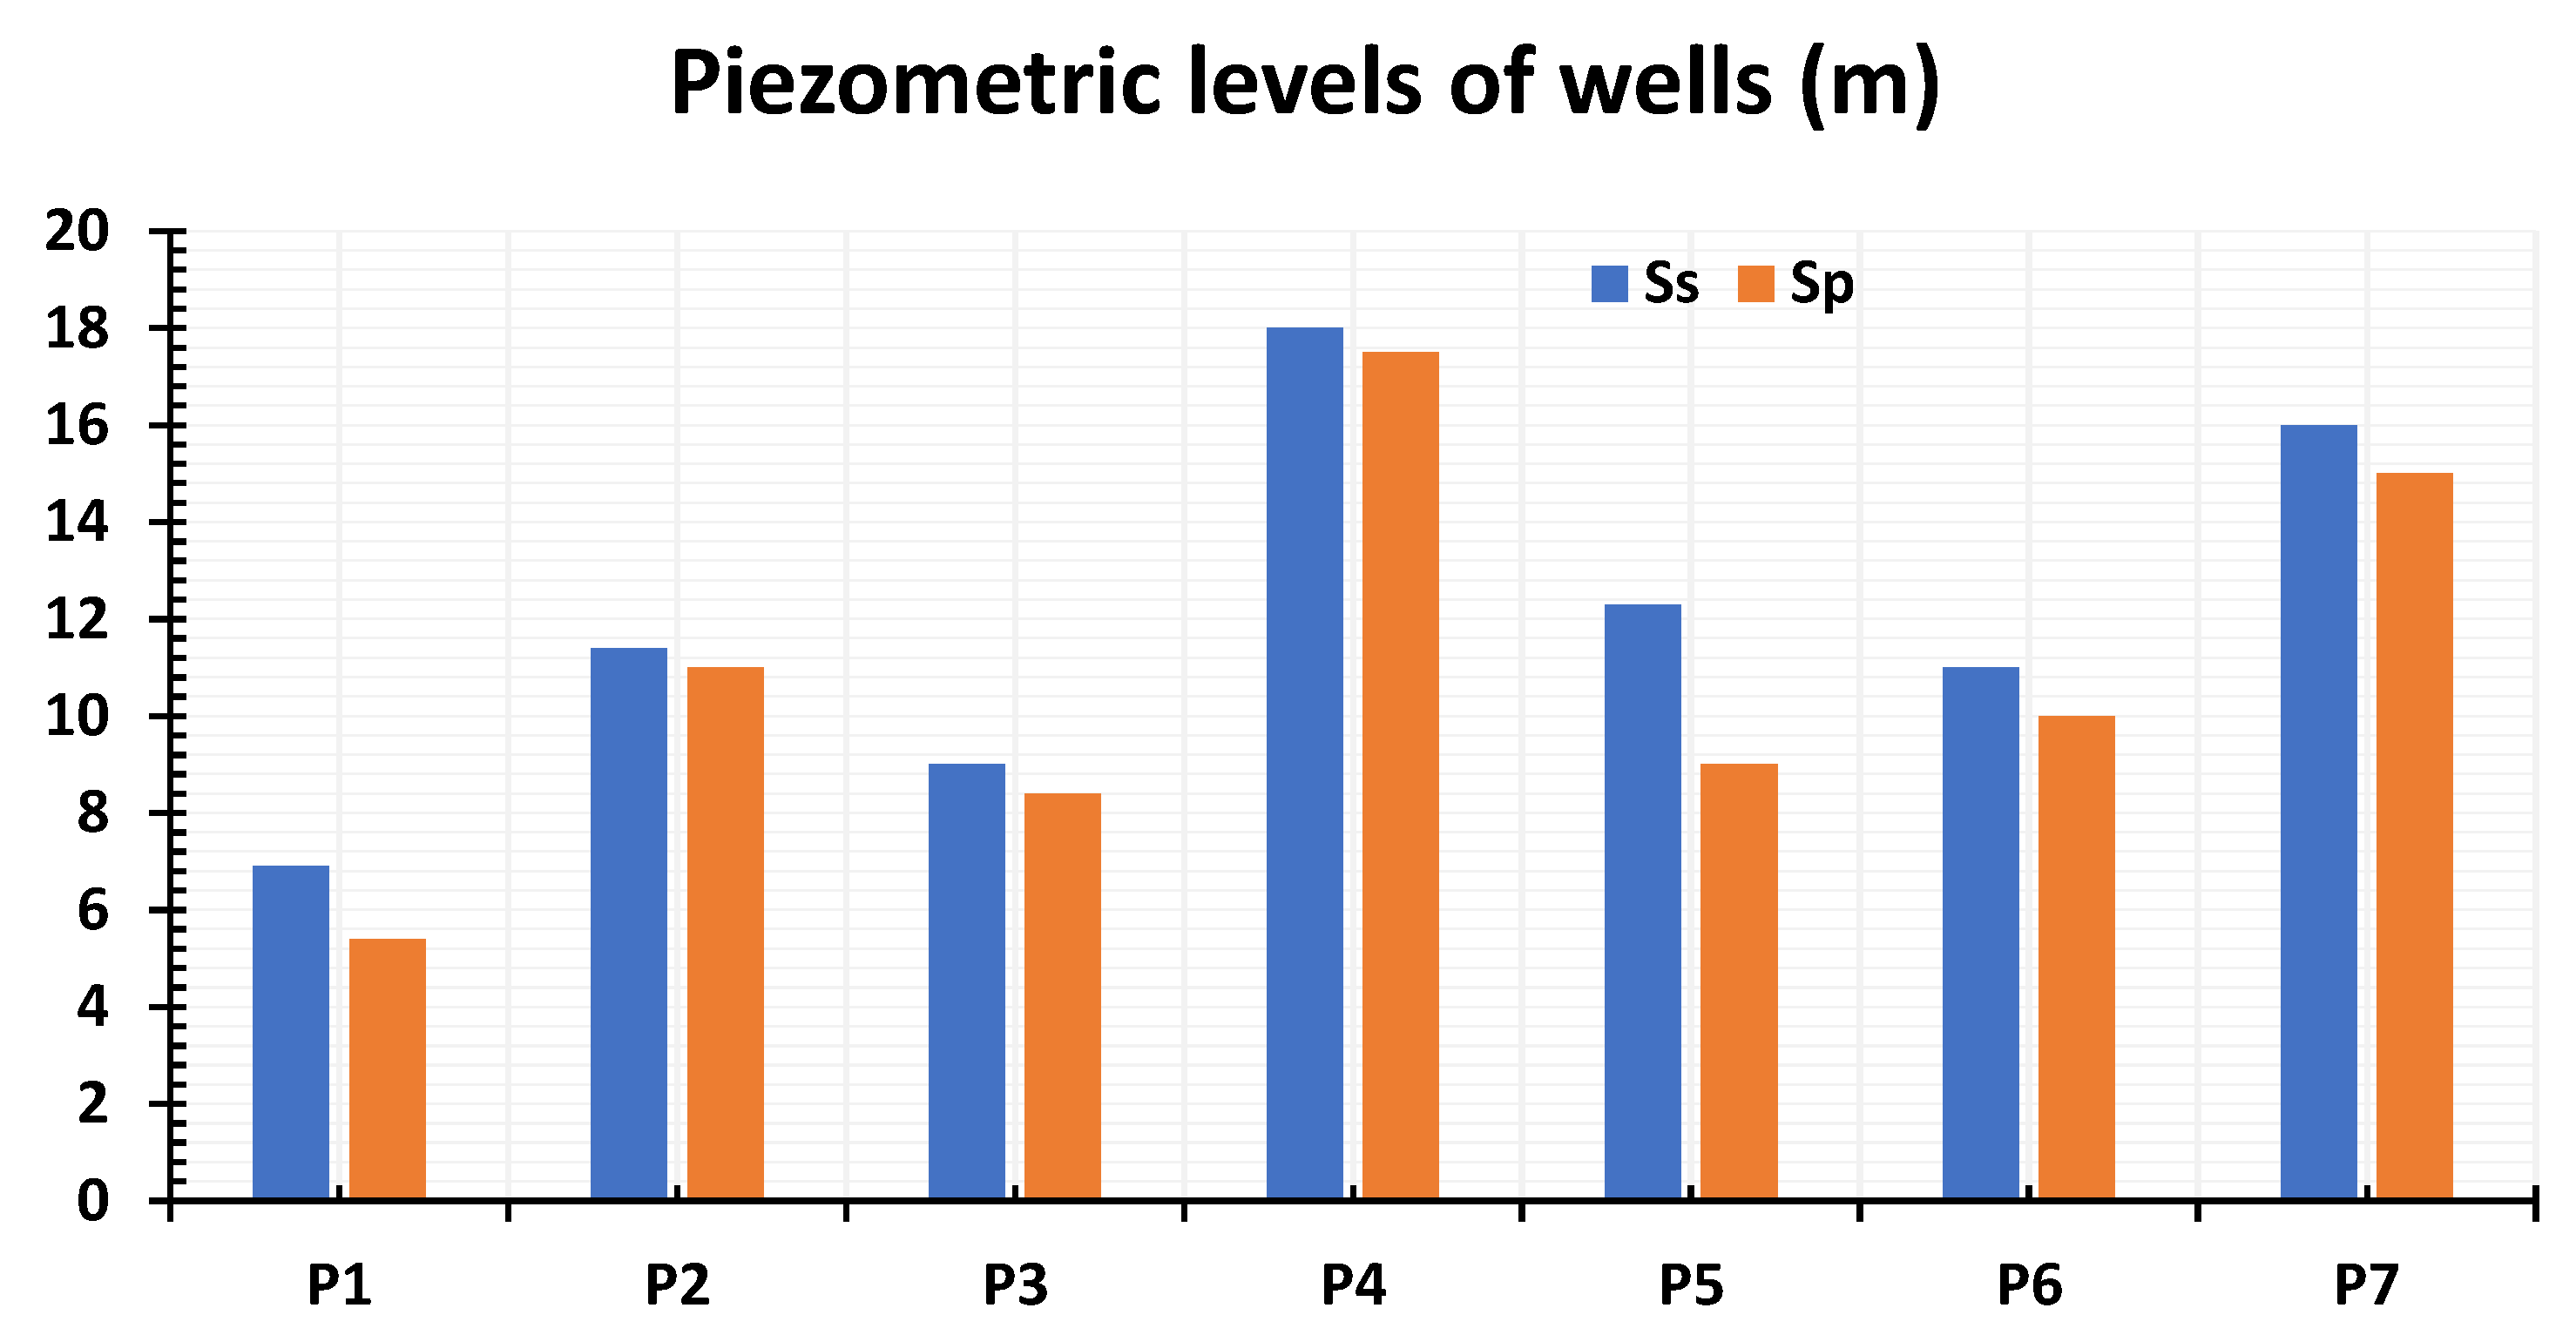
3.1. Piezometric Data

The piezometric data are recorded in Table 1. These different values show that the water depths in the wells (hp) vary between 6.9 (P1) and 18 m (P4) during the dry season with a standard deviation equal to ∓3.84 m and fluctuate between 5.4 (P1) and 17.5 m (P4) during the rainy season with a standard deviation of ∓4.11 m. Averages between 12.09 ± 3.9 and 10.9 ± 4.1 m were obtained during the dry and rainy seasons, respectively. The amplitude of the variation of the piezometric level in the study area is between 0.4 and 3.3 m for an average of 1.19 ± 1 m. These wells generally have small variations in amplitude except for wells one and five, which have variations in amplitude equal to 1.5 and 3.3 m, respectively. These structures are more influenced by rainfall variability, unlike wells 2, 4, and 3, in which the variations of the amplitudes are 0.4 m; 0.5 m, and 0.6 m, respectively. The different structures in the study area, therefore, do not have the same behaviour as rainfall fluctuations. Well 5 shows direct sensitivity to heavy rainfall when compared to wells 1, 6, and 7 (Figure 3 and Table 1 and Table 2). The P4 and P7 wells located at high altitudes (at the level of the summits) present the strongest averages of the static level. These P4 and P7 values are equal to 17.75 and 15.5 m, respectively. Wells 1 and 3, located at low altitudes (on the slopes), have the lowest average static level, equal to 6.15 and 8.2 m, respectively. The depths of the wells studied are therefore correlated by the topography.
The values of the piezometric levels are between 706 (P3) and 718 m (P6) during the dry season with a standard deviation of ∓3.63 m, and between 706.6 (P3) and 719 m (P6) during the rainy season with a standard deviation of ∓4.09 m. The averages of the piezometric level of the various wells obtained in the dry season and the rainy season are, respectively, 711.8 ± 4.2 and 712.9 ± 4.2 m. The average piezometric levels are estimated to be equal to 712.36 m ∓3.83 m, and they vary little over the two seasons depending on the meteorological water supply. The values of the piezometric levels allowed for the realization of the piezometric maps. These maps will help to understand the hydrodynamic behaviour of the aquifer.

3.2. Piezometric Maps of the Nkoabang Aquifer

The schematization of the hydrodynamic behaviour and the capacitive and conductive functions of the reservoir of the Nkoabang aquifer were made by the minimum piezometric map, the maximum piezometric map, and the fluctuation map of the piezometric surface. The piezometric surface of the Nkoabang aquifer is characterized by a uniform flow of groundwater (Figure 4 and Figure 5). Longitude in km is given in the x-axis and latitude in degrees is given in the y-axis. This is materialised on the map by the converging directions of the lines of currents. Regarding hydroisoypse curves; their analysis focused on the curvature of circular arcs and the spacing modulus. These Figures show an increase in the spacing modulus of the curves in the NE-SW direction. This increase suggests a decrease in slope (hydraulic gradient). These are the areas of drainage or groundwater recharge by infiltration of effective precipitation where the structures P1, P2, P4, P5, P6, and P7 are located. The downstream limits of the drainage zones are the most favourable to the installation of catchment works, which are always supplied, whatever the season (Figure 4 and Figure 5). These storage areas are located in the south of the map. They have a piezometric depression. They are also characterized on the maps by closed, circular, or elliptical isopiezes with converging streamlines, thus reflecting a piezometric depression. The P3 and S structures are located in a groundwater recharge zone. Figure 6 presents the seasonal piezometric fluctuations of the Nkoabang aquifer. It is clear that the dry season (SS) and rainy season (SP) curves are different, but nearby. At a given latitude and longitude, the piezometric level (in mm) of the rainy season is higher than that of the dry season.
The amplitude of variation of the piezometric level in the study area is between 0.4 and 3.3 m for an average of 1.19 ± 1 m. These results are comparable to those obtained by Feumba [4] (between 0.55 m and 1.65 m) in the watershed of Ekozoa, by Kalla Mpako [6] in the watershed of Ntem (between 0.1 m and 1.91 m), by Mfokapouré Chintouo [13] in the Odza watershed (between 0.15 m and 3.44 m), by Eyong Jean-Baptiste [46] in the Akée watershed (0.14 m and 0.97 m with an average value of 0.34 m), by Bon [47] in the Olezoa watershed, and by Sendjoun [48] in the Messamendongo area and its surroundings (0.05–4.56 m). This work indicates that piezometric fluctuations are linked to rainfall and topography.
The recharge areas of the aquifer by infiltration of rainwater are particularly located at the level of the summits. These areas are Nkolo I (P1), Nkolo II (next to the solidarity health centre (P2)), Nkolo II (next to the chiefdom (P5)), Nkolo I (near the standpipe (P6 and P7)) and the Etambè Catholic church (P4), located in the study area. The groundwater discharge areas are located at the Etambè primary school level (P3). These areas could be favourable for the installation of water catchment structures (Figure 6).

3.3. Results of Thornthwaite Hydrologic and Hydric Balances [38]

Using the flowchart given in Figure 2 and experimental data presented in Table 1 and Table 2, values presented in Table 3 have been obtained.

4. Discussion

Actual evapotranspiration is equal only to the amount of water that can be extracted from soil moisture during the months of February, July, and December, and it is equal to the potential of evapotranspiration during the other months. The evolution of the water balance parameters illustrated in Figure 7 shows that the period of excess rainfall is the longest, running from March to November, thus reflecting the recharge of the unconfined aquifer. It is an indication that the rainfall deficit begins in December and ends in February, thus corresponding to the period of emptying of the aquifer. The easily usable reserve (RFU) begins to recover in March as soon as the rains return, reaches its maximum in May, and remains almost constant until December (Figure 8). Water surplus is positive from May to November. Thus, the availability of water is in surplus from May to November and is at a deficit in the other months. The maximum surplus water (282 mm) is obtained in October due to the high rainfall during this month. Potential evapotranspiration is higher than the real evapotranspiration only during the months of January and February, and these values are equal during the other months. The low evapotranspiration rate (ETR) from December to February explains the water deficit observed during this period (Table 3). Spring flows drop considerably, and surface runoff is fed by water stored in the ground. The agricultural deficit is observed only during the long dry season in January. It increases and reaches its maximum in February, disappearing in March (Figure 7).
Regarding the water balance, the average height of precipitation for the period between 1951 and 2017 was 1577 ± 222 mm (Table 3 and Figure 7). The month of October records a maximum rainfall height of 284 mm, and the minimum height is recorded during the month of 18.8 mm. The average runoff is 487 mm, corresponding to 31% of the runoff water. The average annual infiltration is 137 mm.

5. Conclusions

This laboratory work and practical investigation carried out on the influence of runoff and infiltration on the groundwater of Nkoabang have shown that the various structures in the study area do not have the same behaviour as rainfall fluctuations. The depths of the wells studied are correlated with the topography and seasonal variations, as well as an increase in the hydraulic gradient in the NE-SW direction. The daily flows from the spring (S) vary between 0.15 m3/h (obtained in the dry season) and 0.19 m3/h (obtained during the rainy season). The evolution of the parameters of the water balance shows that the period of rainfall surplus runs from March to November, thus reflecting the recharge of the aquifer, while the rainfall deficit begins in December and ends in February, corresponding to the emptying period of the aquifer. The average runoff is 487 mm, corresponding to 31% of the runoff water. The average annual infiltration is 137 mm. The values of the piezometric levels of the various wells in the dry season and in the rainy season identify favourable areas of Nkoabang city for the establishment of water catchment works. The availability of water is in surplus from May to November and is at a deficit in the other months. The maximum surplus water (282 mm) is obtained in October due to the high rainfall experienced during this month. Good management is needed to use the excess water optimally from May to November. In future research, the Thornthwaite potential evapotranspiration in modified formulation given by Aschonitis et al. [49] will be tested to improve the results presented in this manuscript.

Author Contributions

Conceptualization, M.M.T., J.R.N.N. and E.N.E.-P.; methodology, M.M.T., J.R.N.N. and E.N.E.-P.; software, M.M.T., M.S.-T. and N.R.N.; validation, M.M.T., J.R.N.N. and E.N.E.-P.; formal analysis, M.M.T., J.R.N.N. and E.N.E.-P.; investigation, M.M.T., M.S.-T., A.T.T. and N.R.N.; resources, M.M.T., J.R.N.N., E.N.E.-P., M.S-.T., A.T.T. and N.R.N.; data curation, M.M.T., J.R.N.N., M.S.-T. and E.N.E.-P.; writing—original draft preparation, M.M.T., M.S.-T. and N.R.N.; writing—review and editing, M.M.T., M.S.-T., N.R.N., M.M. and R.K.; visualization, M.M.T., M.M., M.S.-T. and N.R.N.; supervision, M.M.T., M.S.-T., J.R.N.N. and E.N.E.-P.; project administration, M.M.T., J.R.N.N. and E.N.E.-P. All authors have read and agreed to the published version of the manuscript.

Funding

This research received no external funding.

Data Availability Statement

Not applicable.

Conflicts of Interest

The authors declare no conflict of interest.

Abbreviations

CDECameroonian water company
DEflow deficit (mm)
ETPpotential evapotranspiration (mm)
ETRreal evapotranspiration (mm)
GPSGlobal Positioning System
Pprecipitations (mm)
RFUeasily usable reserve (mm)
Hesheet of water elapsed (mm)
Swater layer available for total flow (mm)
SSdry season
SPrainy season
ΔRFUeasily usable reserve variation (mm)
WSwater surplus (mm)
DAagricultural deficit (mm)

References

  1. Juompan-Yakam, C. Eau Yaoundé à L’heure du Système D. Available online: https://www.jeuneafrique.com/29881/economie/eau-yaound-l-heure-du-syst-me-d/ (accessed on 22 October 2022).
  2. Mougoué, B.; Nya, E.L. Croissance de la ville de Yaoundé et résiliences aux pandémies. Rev. Espace Géographique Société Maroc, No 43-44. 2021. Available online: https://doi.org/10.34874/IMIST.PRSM/EGSM/24582 (accessed on 22 October 2022).
  3. Nkengfack, H.; Noubissi Domguia, E.; Kamajou, F. Analyse des Determinants de L’offre de L’eau Potable au Cameroun. 2017. Available online: https://hal.archives-ouvertes.fr/hal-01510111/document (accessed on 22 October 2022).
  4. Feumba, R. Hydrogéologie en Zone de Socle Cristallin: Cas du Bassin Versant de l’Ekozoa, Secteur Nord de la Ville de Yaoundé—Cameroun; University of Yaoundé I: Yaoundé, Cameroon, 2005; 94p. [Google Scholar]
  5. Ntep, F. Hydrodynamique et Qualité des Eaux des Nappes en Zone de Socle Cristallin Fissuré et Altéré: Cas du Bassin Versant de la Mingoa (Yaoundé—Cameroun); University of Yaoundé I: Yaoundé, Cameroon, 2005; 84p. [Google Scholar]
  6. Kalla Mpako, F. Caractérisation Physique et Hydrodynamique de L’aquifère à Nappe Libre du Bassin Versant de Ntem à Yaoundé—Cameroun; University of Yaoundé I: Yaoundé, Cameroon, 2007; 99p. [Google Scholar]
  7. Priso, B.F. Etude des Caractéristiques Physiques, Hydrodynamiques et de la Vulnérabilité de L’aquifère à Nappe Libre du Bassin Versant de l’Ebogo—Ewe à Yaoundé; University of Yaoundé I: Yaoundé, Cameroon, 2007; 86p. [Google Scholar]
  8. Bon, A.F. Hydrodynamique d’un Bassin Zone de Socle Cristallin Fracturé et Altéré: Cas du Bassin Versant de l’Olezoa, Yaoundé—Cameroun; University of Yaoundé I: Yaoundé, Cameroon, 2008; 78p. [Google Scholar]
  9. Kuate, D.T. Etude Hydrodynamique des Nappes en Zone De socle Cristallin du Bassin Versant de la Biyemé à Yaoundé Cameroun; University of Yaoundé I: Yaoundé, Cameroon, 2008; 69p. [Google Scholar]
  10. Kendzo, N.J. Etude Piézométrique, Hydrochimique et Bactériologique des Nappes en Zone de Socle Cristallin: Cas du Bassin Versant de Ntsomo (Yaoundé—Cameroun); University of Yaoundé I: Yaoundé, Cameroon, 2008; 72p. [Google Scholar]
  11. Fouépé, T.A.; Fantong, W.; Ndam Ngoupayou, J.R.; et Sigha Nkamdjou, L. Comparative Analysis for Estimating Hydraulic Conductivity Values to Improve the Estimation of Groundwater Recharge in Yaoundé-Cameroon. Br. J. Environ. Clim. Chang. 2011, 2, 391–409. [Google Scholar]
  12. Ngouh, A.N. Caractérisation Physique et Hydrodynamique de L’aquifère à Nappe Libre en Zone de Socle Cristallin Fracturé et Altère: Cas du Bassin Versant du Nkié Yaoundé (Cameroun); University of Yaoundé I: Yaoundé, Cameroon, 2012. [Google Scholar]
  13. Mfokapouré, C. Caractérisation Physique et Hydrodynamique de L’aquifère à Nappe Libre du Bassin Versant d’Odza (Yaoundé—Cameroun); University of Yaoundé I: Yaoundé, Cameroon, 2012; 74p. [Google Scholar]
  14. Ewodo, M.G.; Ombolo, A.A.; Fouepe, T.; Bon, A.; Ekodeck, G.E. Etude des Paramètres hydrauliques des aquifères de sub-surface du bassin versant de la Mingosso, région de Yaoundé. Rév. CAMES-Série A 2012, 13, 123–127. [Google Scholar]
  15. Djeuda, T.H.; Tanawa, E.; Siakeu, J.; Ngo Massana, B. Mode de circulation, mécanisme de recherche et temps relatif de séjour des eaux des nappes souterraines des altérites en milieu cristallin: Cas du bassin versant de l’Anga’a, Yaoundé-Cameroun. In Géosciences au Cameroun; Bilong, P., Vivat, J.P., Eds.; University of Yaoundé I: Yaoundé, Cameroon, 1999; pp. 117–126. [Google Scholar]
  16. Djeuda Tchapnga, H.B.; Tanawa, E.; Temgoua, E.; Ngnikam, E.; Siakeu, J.; et Ngo Massana, B. Caractéristiques Structurales et Propriétés Hydrodynamiques des Altérites de la Zone Périurbaine de Yaoundé IV—Cameroun; University of Yaoundé I: Yaoundé, Cameroon, 2000; 17p. [Google Scholar]
  17. Medza, E.J. Piézométrie, Hydrodynamique et Battement des Nappes Souterraines en Zone de Socle Cristallin: Cas du Bassin Versant de l’Anga’a Sud-Est de Yaoundé; University of Yaoundé I: Yaoundé, Cameroon, 2002; 86p. [Google Scholar]
  18. Fouépé, T.A.; Ndam, N.J.; Riotte, J.; Takem, G.E.; Mafany, G.; Marechal, J.C.; Ekodeck, G.E. Estimation of groundwater recharge of the shallow aquifer on the humid environment in Yaounde, Cameroon using hybrid water fluctuation and hydrochemistry methods. Environ. Earth Sci. 2010, 64, 107–118. [Google Scholar] [CrossRef]
  19. Ntsama, K.R. Caractérisation Physique et Piézométrique des Eaux de Puits de Nkoabang (Yaoundé Cameroun); University of Yaoundé I: Yaoundé, Cameroon, 2018; 62p. [Google Scholar]
  20. Loizeau, S.; Rossier, Y.; Gaudet, J.-P.; Refloch, A.; Besnard, K.; Angulo-Jaramillo, R.; Lassabatere, L. Water infiltration in an aquifer recharge basin affected by temperature and air entrapment. J. Hydrol. Hydromech. 2017, 65, 222–233. [Google Scholar] [CrossRef] [Green Version]
  21. Samanta, T. Seasonal Variation of Infiltration Rates Through Pond Bed in a Managed Aquifer Recharge System. Master’s Thesis, Texas A&M University, College Station, TX, USA, August 2018. [Google Scholar]
  22. Revueltas-Martínez, J.-E.; Mercado-Fernández, T.; Aguirre-Forero, S. Potential Infiltration Determination in Areas of Influence of the Zona Bananera Aquifer in Northern Colombia. Rev. Fac. Ing. 2020, 29, e11427. [Google Scholar] [CrossRef]
  23. Qi, T.; Shu, L.; Li, H.; Wang, X.; Men, Y.; Opoku, P.A. Water Distribution from Artificial Recharge via Infiltration Basin under Constant Head Conditions. Water 2021, 13, 1052. [Google Scholar] [CrossRef]
  24. Niyazi, B.; Masoud, M.; Elfeki, A.; Rajmohan, N.; Alqarawy, A.; Rashed, M. A Comparative Analysis of Infiltration Models for Groundwater Recharge from Ephemeral Stream Beds: A Case Study in Al Madinah Al Munawarah Province, Saudi Arabia. Water 2022, 14, 1686. [Google Scholar] [CrossRef]
  25. Thomas, B.F.; Behrangi, A.; Famiglietti, J.S. Precipitation intensity effects on groundwater recharge in the Southwestern United States. Water 2016, 8, 90. [Google Scholar] [CrossRef] [Green Version]
  26. Lawrence, A.R.; Morris, B.L.; Foster, S.S.D. Hazards induced by groundwater under rapid urbanization. In Geohazards in Engineering Geology; Maunds, J.G., Eddleston, M., Eds.; Geological Society, Engineering Geology Special Publications: London, UK, 1998; Volume 15, pp. 319–328. [Google Scholar]
  27. Jinno, K.; Tsutsumi, A.; Alkaeed, O.; Saita, S.; Berndtsson, R. Effects of land-use change on groundwater recharge model parameters. Hydrol. Sci. J. 2009, 54, 300–315. [Google Scholar] [CrossRef]
  28. Ganot, Y.; Holtzman, R.; Weisbrod, N.; Nitzan, I.; Katz, Y.; Kurtzman, D. Monitoring and modeling infiltration–recharge dynamics of managed aquifer recharge with desalinated seawater. Hydrol. Earth Syst. Sci. 2017, 21, 4479–4493. [Google Scholar] [CrossRef] [Green Version]
  29. Mohamed, I.; Ahmed, S.S. Assessment of the hydraulic performance of groundwater recharge techniques. Int. J. Water Resour. Arid. Environ. 2013, 2, 120–124. [Google Scholar]
  30. Liang, X.; Zhan, H.; Zhang, Y.-K. Aquifer recharge using a vadose zone infiltration well. Water Resour. Res. 2018, 54, 8847–8863. [Google Scholar] [CrossRef]
  31. Marks, R.J.; Lawrence, A.R.; Humpage, A.J.; Hargreaves, R. Recharge through Till: Developing a Methodology for Estimating Groundwater Recharge with Examples from Two Case Studies in East Anglia. Available online: https://nora.nerc.ac.uk/id/eprint/12635/ (accessed on 22 October 2022).
  32. Sighomnou, D. Analyse et Redéfinition des Regimes Climatiques et Hydrologiques du Cameroun: Perspectives D’évolution des Ressources en Eau. Ph.D. Thesis, University of Yaoundé I, Yaoundé, Cameroon, 2004; 268p. [Google Scholar]
  33. Ekodeck, G.E.; Kamgang, K.V. L’altérologie Normative et Ses Applications. Une Expression Particulière de la Pétrologie des Roches Aluminosilicatées du Point de Vue de Leur Evolution Supergène; University of Yaoundé I: Yaoundé, Cameroon, 2002; 231p. [Google Scholar]
  34. Kamgang, B.K.; Ekodeck, G.E. Altération et bilans géochimiques des biotites des gneiss de Nkolbisson (NW de Yaoundé, Cameroun). Géodynamique 1991, 6, 191–199. [Google Scholar]
  35. Onguene, M. Différenciations Pédologiques dans la Région de Yaoundé (Cameroun): Transformation d’un Sol Rouge Ferraliitique en Sol à Horizon Jaune et Relation avec L’évolution du Modelé. Ph.D. Thesis, Université de Paris VI, Paris, France, 1993. [Google Scholar]
  36. Bilong, P.; Eno, B.M.; Volkoff, B. Séquence d’évolution des paysages et des sols ferrallitiques en zone forestière tropicale d’Afrique centrale. Place des sols à horizon d’argile tachetée. C.R. Acad. Sci. Paris Sér. II 1992, 314, 109–115. [Google Scholar]
  37. BUCREP. Troisième Recensement Général de la Population et de L’habitat: Rapport de Présentation des Résultats Définitifs. République du Cameroun. 2010. Available online: www.burcrup.cm/index.php/fr/re (accessed on 22 October 2022).
  38. Thornthwaite, C. The Measurement of Potential Evapotranspiration; Mather, J.R., Ed.; Seabrook: Deerfield, NJ, USA, 1954; 225p. [Google Scholar]
  39. Remenieras, G. Hydrologie de L’ingénieur. Available online: https://www.persee.fr/doc/rga_0035-1121_1961_num_49_3_2001_t1_0593_0000_1 (accessed on 22 October 2022).
  40. Rusnam, R.; Yanti, N.R. Potential evapotranspiration uses Thornthwaite Method to the water balance in Padang City. IOP Conf. Ser. Earth Environ. Sci. 2021, 757, 012041. [Google Scholar] [CrossRef]
  41. Nugroho, A.R.; Tamagawa, I.; Riandraswari, A.; Febrianti, T. Thornthwaite-Mather water balance analysis in Tambakbayan watershed, Yogyakarta, Indonesia. MATEC Web Conf. 2019, 280, 05007. [Google Scholar] [CrossRef] [Green Version]
  42. Hendrayana, H.; Widyastuti, M.; Riyanto, I.A.; Nuha, A.; Widasmara, M.Y.; Ismayuni, N.; Rachmi, I.N. Thornthwaite and Mather water balance method in Indonesian tropical area. IOP Conf. Ser. Earth Environ. Sci. 2021, 851, 012011. [Google Scholar] [CrossRef]
  43. Moghaddam, T.E.; Mohammadkhan, S. An estimation of Thornthwaite monthly water-balance in Mighan sub-basin. Nat. Environ. Chang. 2017, 3, 71–80. [Google Scholar] [CrossRef]
  44. Yashvant, D. Water Balance and Climatic Classification of a Tropical City Delhi India. Am. J. Water Resour. 2015, 3, 124–146. [Google Scholar] [CrossRef]
  45. Olivry, J.C. Fleuves et Rivières du Cameroun; Monographies Hydrologiques; MESRES/ORSTOM: Paris, France, 1986. [Google Scholar]
  46. Jean-Baptiste, E. Etude de la Recharge des Nappes Phréatiques en Milieu Urbain: Cas du Bassin Versant de l’Akée (Yaoundé—Cameroun); University of Yaoundé I: Yaoundé, Cameroon, 2012; 72p. [Google Scholar]
  47. Bon, A.F. Modélisation de la Structure et du Fonctionnement des Aquifères du Socle Fracturé et Altéré dans le Bassin Versant de l’Olézoa, Yaoundé—Cameroun. Ph.D. Thesis, University of Yaoundé I, Yaoundé, Cameroon, 2016; 185p. [Google Scholar]
  48. Sendjoun, K.G. Caractérisation Physique et Piézométrique des Eaux Souterraines de la Zone de Messamendongo et ses Environs (Yaounde—Cameroun); University of Yaoundé I: Yaoundé, Cameroon, 2018; 68p. [Google Scholar]
  49. Aschonitis, V.; Touloumidis, D.; Veldhuis, M.-C.T.; Coenders-Gerrits, M. Correcting Thornthwaite potential evapotranspiration using a global grid of local coefficients to support temperature-based estimations of reference evapotranspiration and aridity indices. Earth Syst. Sci. Data 2022, 14, 163–177. [Google Scholar] [CrossRef]
Figure 1. Measurement point map.
Earth 04 00002 g001
Figure 2. Flow chart for calculating the water balance according to the method of Thornthwaite [38]. P—precipitations (mm); ETP—potential evapotranspiration(mm); ETR—real evapotranspiration (mm); RFU—easily usable reserve (mm); ΔRFU—easily usable reserve variation (mm); WS—water surplus (mm); S—water layer available for total flow (mm); DA—agricultural deficit (mm).
Earth 04 00002 g002
Figure 3. Seasonal variations in well depth (Ss is the dry season and Sp is the rainy season).
Earth 04 00002 g003
Figure 4. Minimum piezometric map (dry season) of the Nkoabang aquifer. (P1): Nkolo I; (P2): Nkolo II (near the solidarity health centre); (P3): at the Etambè primary school; (P4): Etambè Catholic church; (P5): Nkolo I (near to the chief’s hut); and (P6 and P7): Nkolo I (near the fountain).
Earth 04 00002 g004
Figure 5. Maximum piezometric map (rainy season) of the Nkoabang aquifer. (P1): Nkolo I; (P2): Nkolo II (near the solidarity health centre); (P3): at the Etambè primary school; (P4): Etambè Catholic church; (P5): Nkolo I (near to the chief’s hut); and (P6 and P7): Nkolo I (near the fountain).
Earth 04 00002 g005
Figure 6. Map of seasonal piezometric fluctuations of the Nkoabang aquifer.(P1): Nkolo I; (P2): Nkolo II (near the solidarity health centre); (P3): at the Etambè primary school; (P4): Etambè Catholic church; (P5): Nkolo I (near to the chief’s hut); (P6 et P7): Nkolo I (near the fountain).
Earth 04 00002 g006
Figure 7. Evolution of some parameters of the hydric balance established according to the Thornthwaite method (uncertainty: 1 mm ).
Earth 04 00002 g007
Figure 8. Recharge period and discharge period of the Nkoabang aquifer (uncertainty: 1 mm ).
Earth 04 00002 g008
Table 1. Results of the static levels.
Wells and Source.Z (m)Hp (m) Dry SeasonHp (m) Rainy SeasonAverage
Hp (m)
Deviation Amplitude (Uncertainty) (m)
S (source)707----
P1 (well)7186.95.46.15 1.5
P2 (well)72311.41111.2 0.4
P3 (well)71598.48.2 0.6
P4 (well)7281817.517.75 0.5
P5 (well)72612.3910.65 3.3
P6 (well)729111010.5 1
P7 (well)728161515.5 1
average-12.0910.911.49 1.19
Standard deviation(m)
(Uncertainty)
- 3.84 4.11 3.94-
Z—altitude of the benchmark on the structure; hp—depth of the water in the structure.
Table 2. Results of the piezometric levels (Uncertainty: 1 mm ).
PositionsH (m) Dry SeasonH (m) Rainy SeasonAverage H (m)
S (source)--
P1 (well)711.1712.6711.85
P2 (well)711.6712711.8
P3 (well)706706.6706.3
P4 (well)710710.5710.25
P5 (well)713.6717715.3
P6 (well)718719718.5
P7 (well)712713712.5
average711.76712.95712.36
Standard deviation (Uncertainty)3.634.093.83
H—piezometric level.
Table 3. Hydric balance parameters (uncertainty: 1 mm ), calculated using the Thornthwaite method [38].
MonthsJanFebMarAprMayJunJulAugSeptOctNovDec
Rain18.851.2138.4186.6207.7157.873.395230.6284.2118.8231586
Temp24.625.425.124.724.323.522.823.823.323.423.92424.1
ETP102.41121151141089492858891102951107
ETR46.851.21151141089492858891102951012
RFU0023.410010010081.384.310010010028817
ΔRFU−28023.476.600−19310000−6294
DA55.860.800000015.40020134
WS000099.749.816.25117282170587
S3012009010260701062089030798
P-ETP83.6−6123.472.699.763.8−18.710142.6193.216.8−72387
a−0.82−0.540.20.640.920.68−0.20.111.622.120.16−0.84.15
DE55.6−6100000000005.4
P—precipitations (mm); ETP—potential evapotranspiration (mm); ETR—real evapotranspiration (mm); RFU—easily usable reserve (mm); ΔRFU—easily usable reserve variation (mm); WS—water surplus (mm); S—water layer available for total flow (mm); and DA—agricultural deficit (mm).
Disclaimer/Publisher’s Note: The statements, opinions and data contained in all publications are solely those of the individual author(s) and contributor(s) and not of MDPI and/or the editor(s). MDPI and/or the editor(s) disclaim responsibility for any injury to people or property resulting from any ideas, methods, instructions or products referred to in the content.

