Article

Deduction of Strategic Planning Guidelines for Urban Medium Voltage Grids with Consideration of Electromobility and Heat Pumps

1
Institute of Power Systems Engineering, University of Wuppertal, 42119 Wuppertal, Germany
2
Siemens AG, 91058 Erlangen, Germany
*
Author to whom correspondence should be addressed.
Electricity 2022, 3(4), 505-541; https://doi.org/10.3390/electricity3040026
Submission received: 21 July 2022 / Revised: 9 September 2022 / Accepted: 12 September 2022 / Published: 9 October 2022

Abstract

:
With the evolution of electromobility and heat pumps in urban areas, distribution system operators find themselves facing new challenges in reinforcing their grids. With this evolution, the power demand is developing rapidly and grid reinforcement is urgently needed. The electromobility and heat pump loads are introduced by giving the assumed development scenarios in Germany and their corresponding nominal power assumptions. Furthermore, a method for load modeling in grid planning is explained. Subsequently, several grid planning approaches are presented while dividing them into conventional and innovative planning strategies. Among the investigated innovative planning strategies are three variants of load management that regulate different load types. By analyzing several urban medium voltage grids, this contribution deduces a solid basis for distribution system operators in the form of planning guidelines. The implemented grid planning method leading to the planning guidelines is presented in detail along the contribution.

1. Introduction

Climate change is currently the main challenge facing governments, industries, and individuals alike. Even though there is already progress made to curb the expected climate changes, there is still a long way to go to transform the emission-intensive sectors such as transportation and heating into low-emission sectors [1]. A solution for that is to transform the energy source for transportation heating from the combustion of fossil fuels to electricity. On one hand, the electrification of these sectors can greatly reduce emissions, but on the other hand, it proposes an additional load on the power grids [2,3].
This contribution focuses on the impact of the electrification of the transportation sector—using charging infrastructure for electromobility—and the electrification of the household heating sector—using heat pumps (HPs)—on the electric medium voltage (MV) grids in terms of electric load development and the corresponding required reinforcement measures.
The electrification of the above-mentioned two sectors represents an unprecedented challenge for distribution system operators (DSOs) as they find themselves dealing with new load types, for which no large-scale measurement or historical data are available. Without historical data, the determination of the expected load development due to the charging infrastructure and HPs becomes complex. Furthermore, the penetration of these new loads into the grids in terms of location and number of units is unknown. Based on the government plans for a country-wide adoption of electromobility and HPs, the DSOs face the complexity of identifying the actual expected number of electric vehicles (EVs) and HPs in the specific grids.
The current grids are historically not designed to take on the load of the charging infrastructure and HPs. Therefore, the DSOs will have to reinforce their grids to ensure a reliable grid operation. Even though the so far applied conventional planning measures have proven their reliability and effectiveness, newly developed innovative technologies such as load management (LM) systems can offer an economically efficient alternative planning measure.
Even with the availability of historical data for the charging infrastructure and the HPs, their corresponding penetration levels and further evaluation of LM, performing grid planning for a complete urban grid area is an elaborate time-consuming task. Instead of that, DSOs tend to rely on planning guidelines (PGs) in reinforcing and expanding their grids.
Hence, this contribution aims to serve as a complete reference for grid planning under the consideration of these new loads. It displays scientifically backed load assumptions to overcome the challenge of the lack of historical data for the new loads. Furthermore, this contribution proposes a novel methodology to regionalize the country-wide development scenarios on specific grid areas in the MV level. Moreover, innovative planning technologies are considered such as LM, reactive power management (RPM) and energy storage (ES). The considered planning strategies then result in different planning variants, that are then assessed using an economic model as well as an alternative model. The newly proposed alternative model considers four extra assessment criteria in addition to the costs. Finally, the contribution derives seven PGs that can be directly applied by DSOs in their specific grid areas.
Although these new loads are mainly going to be connected to the low voltage (LV) level, the MV level must be investigated to successfully accommodate the accumulated load increase in the LV grids. On the MV level, two factors work in opposition to one another. The first factor is the fact that a MV grid supplies several LV grids and hence needs to adopt an accumulated large number of new loads. The second opposing factor is the decreasing demand factors with an increasing number of loads (explained in Section 2.4). Taking these two factors into consideration constitutes an added challenge to MV grid planning.
Since the density of the transportation and the heating sector in urban areas is much higher than in rural areas, this contribution focuses on the development of urban grids. In the context of this contribution, MV grids from six major German cities are utilized. The variance between the six cities helps to deduce PGs that are valid for any German urban MV grid or any urban MV grid having a grid topology similar to the investigated MV grids.

1.1. Related Work and the State of the Art

Strategic grid planning is as old as electric grids are. It constitutes an ongoing activity at DSOs since the electric grids are in a constant state of development. There are several publications discussing grid planning to a great extent [4,5,6,7]. Since this contribution focuses on the MV grid, references such as [8] are considered to determine the MV grid topology. Even though these references discuss strategic grid planning in detail, the impact of the charging infrastructure and HPs on the grids still needs to be investigated.
The evolution of electromobility has been addressed in terms of state of the art technologies either for EVs or charging methods in [9,10,11] including an overview of the wireless charging technologies in [12]. Especially relevant for the grids are the scenarios, load development, load demand, and load profiles that are discussed in several publications including [13,14]. Other publications, such as [15,16,17] discuss the impact of electromobility on the grid parameters concerning equipment loading and voltage profile for a specific grid as well as for a complete country. In addition, the effect of these new load types on the electric grid was investigated in emerging pilot projects such as [17]. Although these studies demonstrate the expected grid violations, they do not elaborate on the planning measures needed to remedy them. Besides the charging infrastructure, the impact of HPs on grids must also be analyzed.
The published work investigates the impact of HPs on the grid in different methods. Refs. [18,19] model the impact by generating load profiles of HPs in Germany and Great Britain and overlaps these profiles with load and generation profiles. Thus, the collective impact on the grids is analyzed for the total power demand in Great Britain in [18] and for an urban grid and a suburban grid in [19]. The collective impact of electromobility and HPs has also been investigated in [20,21,22,23]. Furthermore, several control strategies are proposed in [24,25,26] to reduce the grid violations caused by the integration of HPs into the grids. Although the above references have addressed the issue of HPs and electromobility, the impact of their integration on the MV level has not yet been studied.
Moreover, technological solutions for electromobility in terms of LM are introduced in different ways and methods in the literature [27]. Hence, the potential of LM to reduce grid reinforcements required due to electromobility has been investigated. For individual exemplary grids in [28,29]. Contributions such as [30] focus on managing the portfolio of the charging infrastructure to reduce their impact on the electric grids. In [31,32,33], different control strategies are proposed to curb the impact of the charging infrastructure on the grids. These publications, however, do not discuss the required grid reinforcement measures to absorb the increase in the load demand after the application of LM. Moreover, they do not consider the simultaneous regulation of charging infrastructure and HPs. In addition, the potential of regulating private charging points compared to regulating public charging points is still not investigated.
As for ES, Ref. [34] provides an overview of the ES system and its ability in reducing the grid violations. Its economic potential in comparison to LM or the conventional planning measure is yet not investigated.
Despite the extensive published and performed work, they lack concrete PGs for DSOs that recommend solid measures to be performed in the grid reinforcement. Publications such as [35,36,37] provide PGs with the consideration of distributed generation on an abstract level. These, however, do not take into account electromobility and HPs neither they are targeted for urban MV grids.
To sum up, although numerous publications have investigated the individual topics discussed in this contribution either solely or combined, no single publication can yet be found that considers these topics combined to the extent presented here and with a focus on urban MV grids.
Unlike the published work, this study investigates grids accumulated from several DSOs not only one. This guarantees that the final results can be considered generally valid for all urban MV grids as long as the grid has similar characteristics such as the voltage level, the topology, and the load density. Furthermore, a unified planning method is performed to reach generally valid results independent of the specific characteristics of the individual grids. In addition, more than one variant for the planning is investigated, such as a combination of several charging powers, the consideration of two development scenarios for each load type, three HP systems and three LM variants with six LM layouts (the variants stand for the regulated load and the layout expresses the configuration of the system) in addition to two ES capacities. Finally, seven tangible PGs for the MV level and three PGs for across voltage planning are deduced to simplify the grid planning process for the DSOs.

1.2. Objective and Structure of the Work

This contribution aims to provide a coherent instrument for strategic planning of urban MV grids while integrating electromobility and HPs. The goal here is to summarize all necessary knowledge to perform MV grid planning, including a set of PGs that guides DSOs while planning their grids while completing the given state of the literature. This contribution provides the following new findings:
1-
Consideration of several charging powers for the charging infrastructure;
2-
Differentiation in the charging infrastructure between private and public charging points;
3-
Integration of charging hubs and charging points at customer substations;
4-
Application of demand factors for different charging powers up to 500 charging points;
5-
Analysis of three HP models different in the power rating;
6-
Modeling and application of innovative technologies:
  • LM system with three different regulation variants and six system layouts;
  • RPM systems;
  • ES with two independent storage capacities.
7-
Consideration of two separate load development scenarios for each load type;
8-
Application of grid planning to representative MV grid models from six major German cities;
9-
Deduction of generally valid PGs:
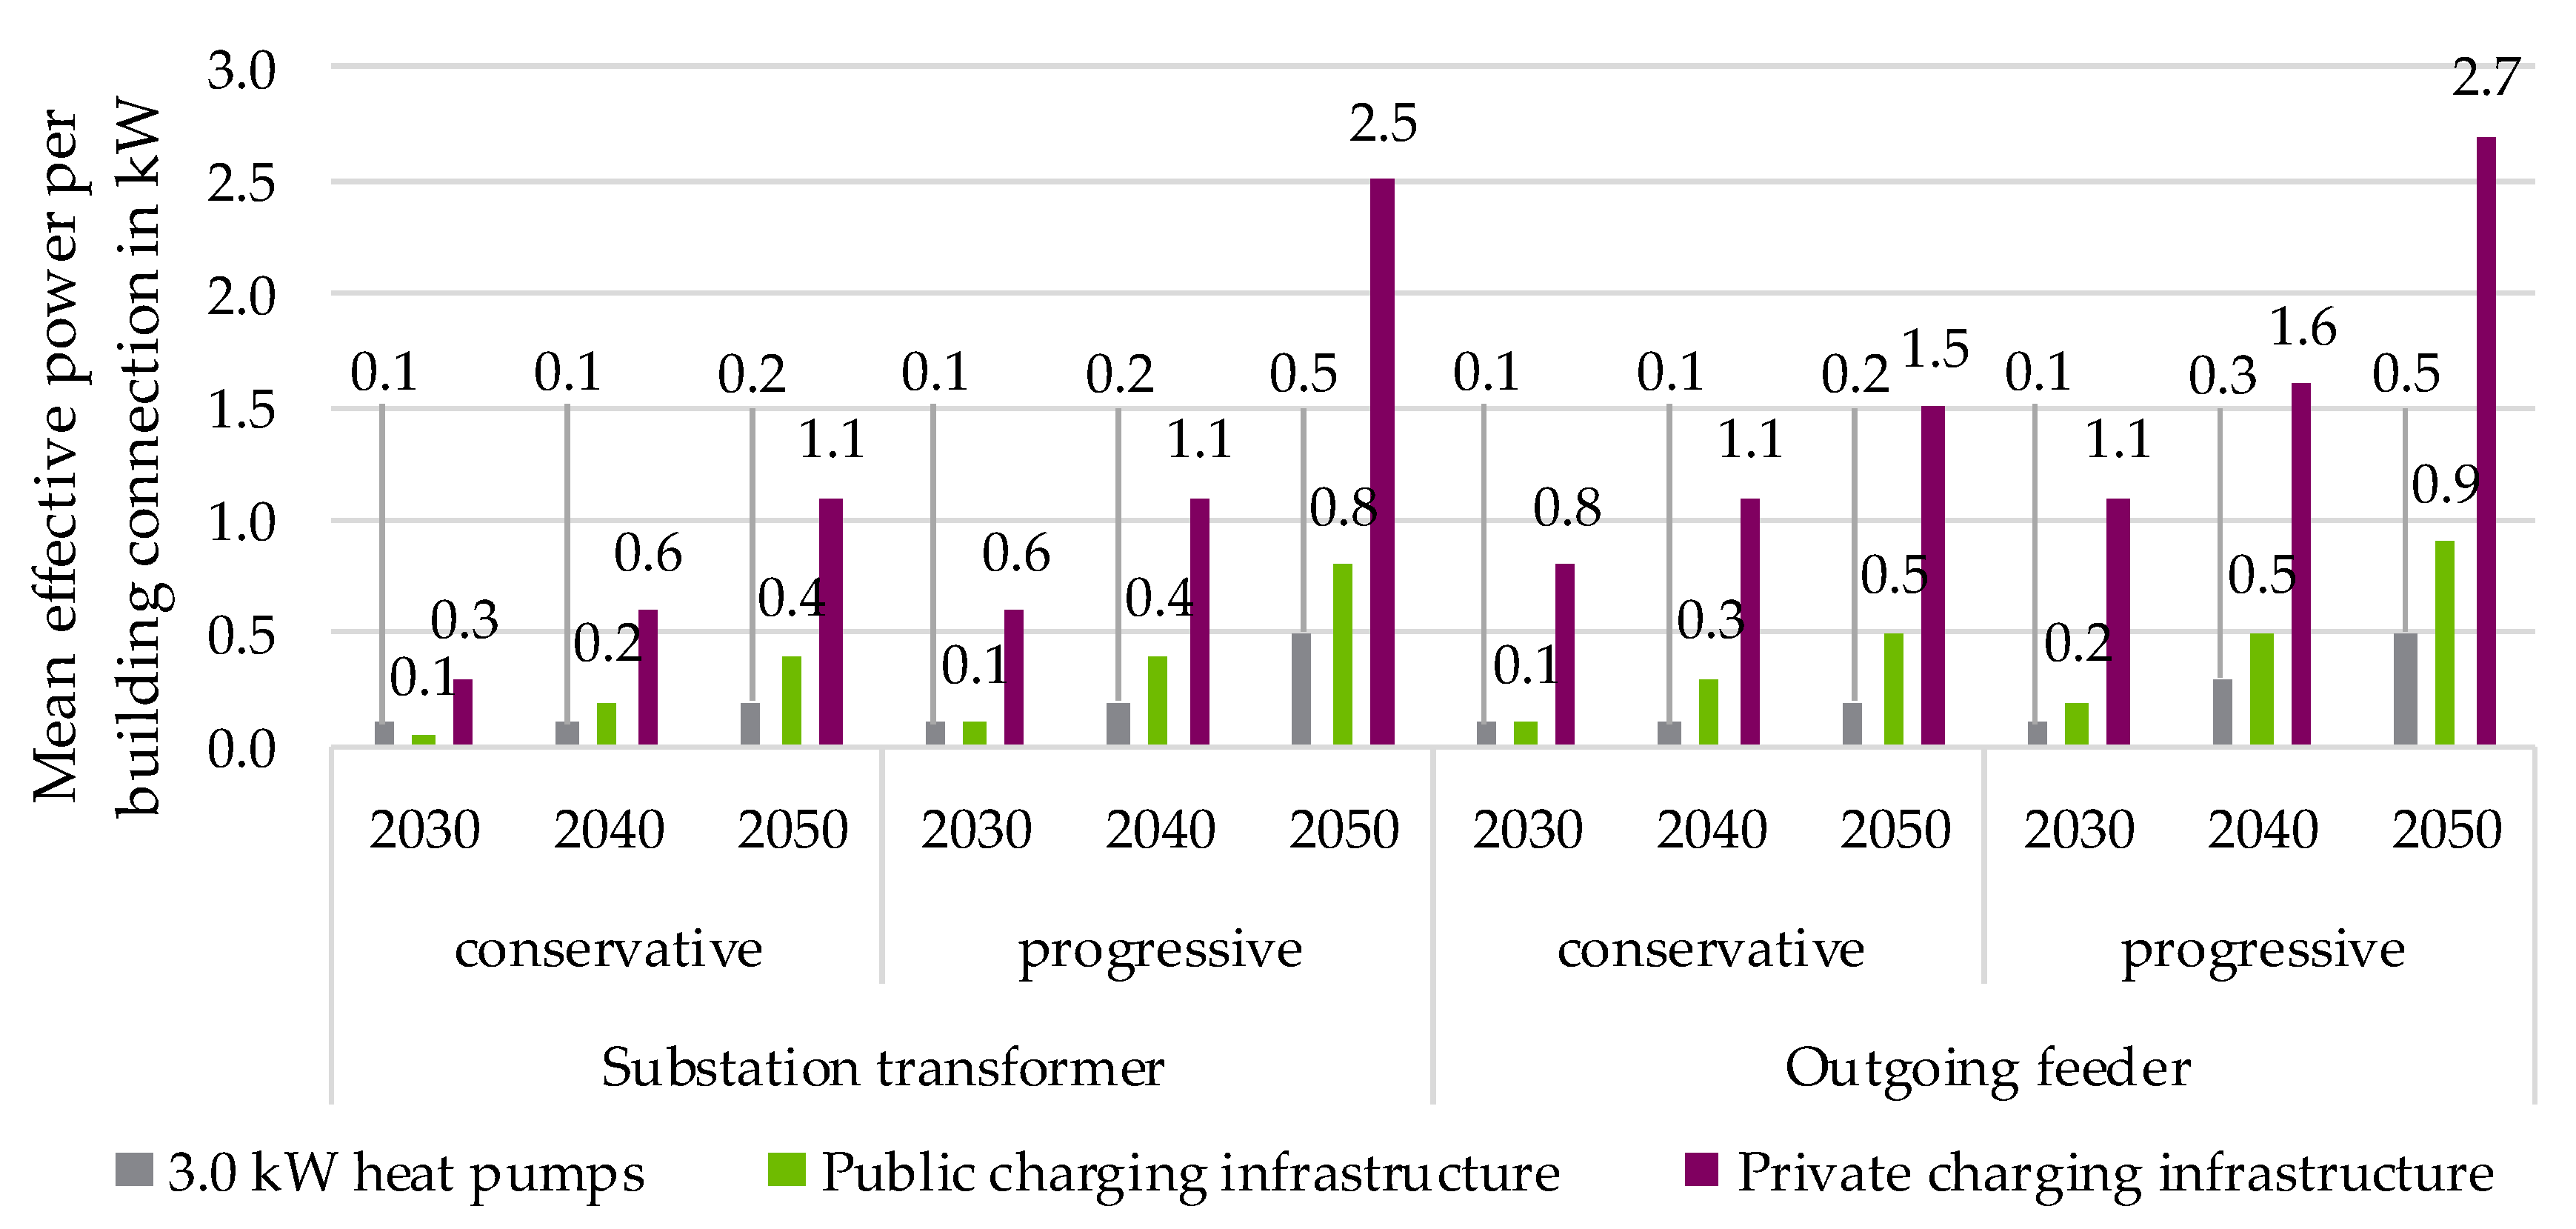
  • Introduction of concrete power values for the new load types for the two planning perspectives (feeder and substation);
  • Recommendation of standard equipment dimensions.
10-
Establishment of a decision path for urban MV strategic grid planning;
11-
Application of an alternative assessment model for the planning variants.
The contribution follows the steps performed during grid planning. It starts in Section 2 by explaining the technical preparation required in terms of the expected number of new loads, their localization in the grids and their assumed nominal power. Since there are no available large-scale measurement data for the new load types, the contribution proposes analytical methods to estimate the expected load development. It then continues in Section 3 with identifying the permissible limit to ensure a reliable operation of the grid. Section 3 also provides an overview of the so far applied planning measures labeled as the conventional planning strategy. As an extension to the conventional planning strategy, innovative planning technologies (LM, RPM and ES) are presented. After the technical preparation is complete, the contribution continues in Section 4 with a technical and economic assessment of the different planning variants. As a result of the assessment, seven PGs for the MV are derived and elaborately explained. Building on the MV PGs, a decision path for MV grid planning is presented. Furthermore, Section 4 introduces three across voltage PGs and ends with an alternative assessment analysis to concretize the recommended PGs for MV grids.

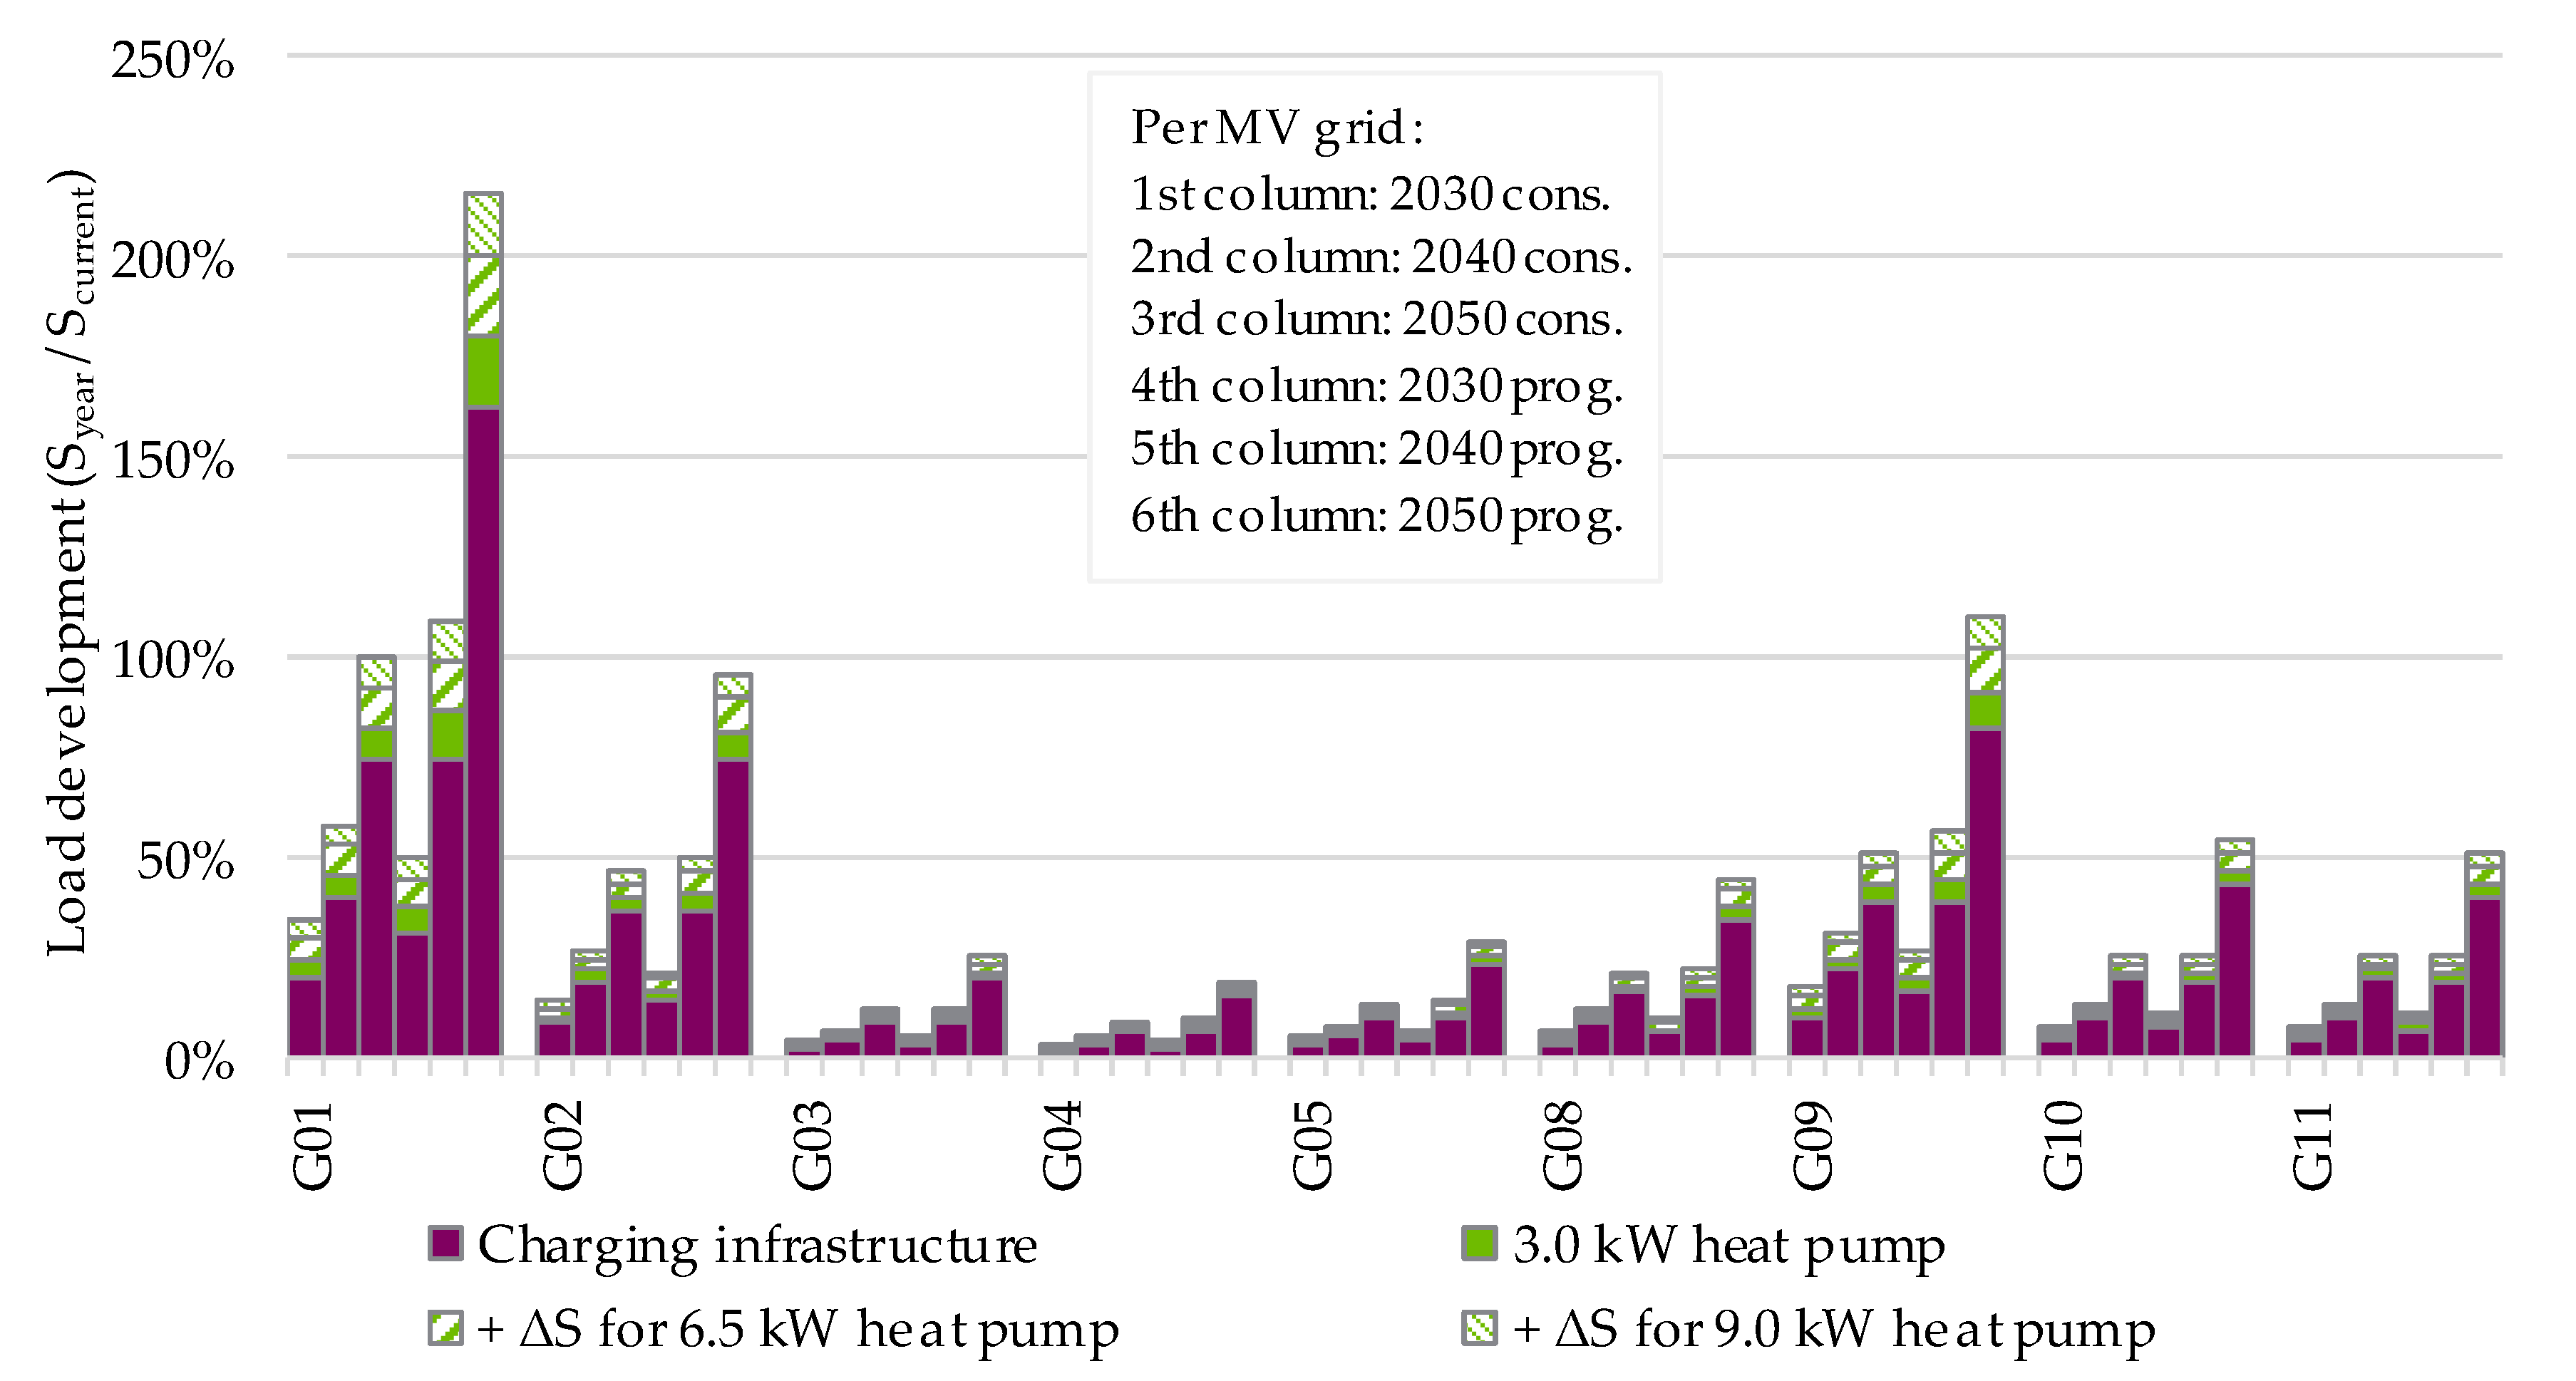
2. Integration of Electromobility and Heat Pumps

This section discusses the fundamental background required for analyzing the integration of electromobility and HPs. The main factors for precisely planning new loads are the determination of the number of loads, their localization in the grid and their expected power demand. In this context, the section starts with an overview of the assumed development scenarios for electromobility and HPs in Germany. Afterward, the methodology for the regionalization of country-wide scenarios down to street level is shortly explained to determine the number and the location of new loads in the MV grids. Furthermore, the load assumptions for electromobility and HPs are presented.
Electromobility represents an unpredicted new load type in the grids and is coupled with a big uncertainty regarding grid planning [9]. In the context of this contribution, electromobility will refer to the EVs used in private transportation apart from electrified public transport (such as electric buses). The aforementioned EVs are mainly charged at either private charging points (PrCPs) or public charging points (PuCPs). A charging point (CP) in the context of this contribution is defined as an outlet at which only one EV can be charged. PrCPs are meant to be privately owned and operated CPs that can only be accessed by a specific user (for example a CP in a private garage). Whereas, PuCPs are the unrestricted publicly accessed CPs typically found on the street side. The standards for charging infrastructure can be found in [10]. In addition, other charging concepts such as inductive charging [12] are not considered in this contribution because they do not change the power demand and therefore have no effect on grid planning.
As for HPs, the task of grid planning becomes much more complex. At a first glance, the development of HPs seems simple as they are solely integrated into households and—in a few cases—into commercial buildings (unlike CPs that can be found on the streetside). However, as the buildings differ in size, year of construction, thermal insulation, and correspondingly the heat demand, it becomes more and more difficult to precisely foresee the development of HPs. Therefore, this contribution focuses on individual HPs that are installed in standalone households, whereas high-power HPs used in industrial or commercial buildings are not investigated here, as they are considered to be individual planning cases.

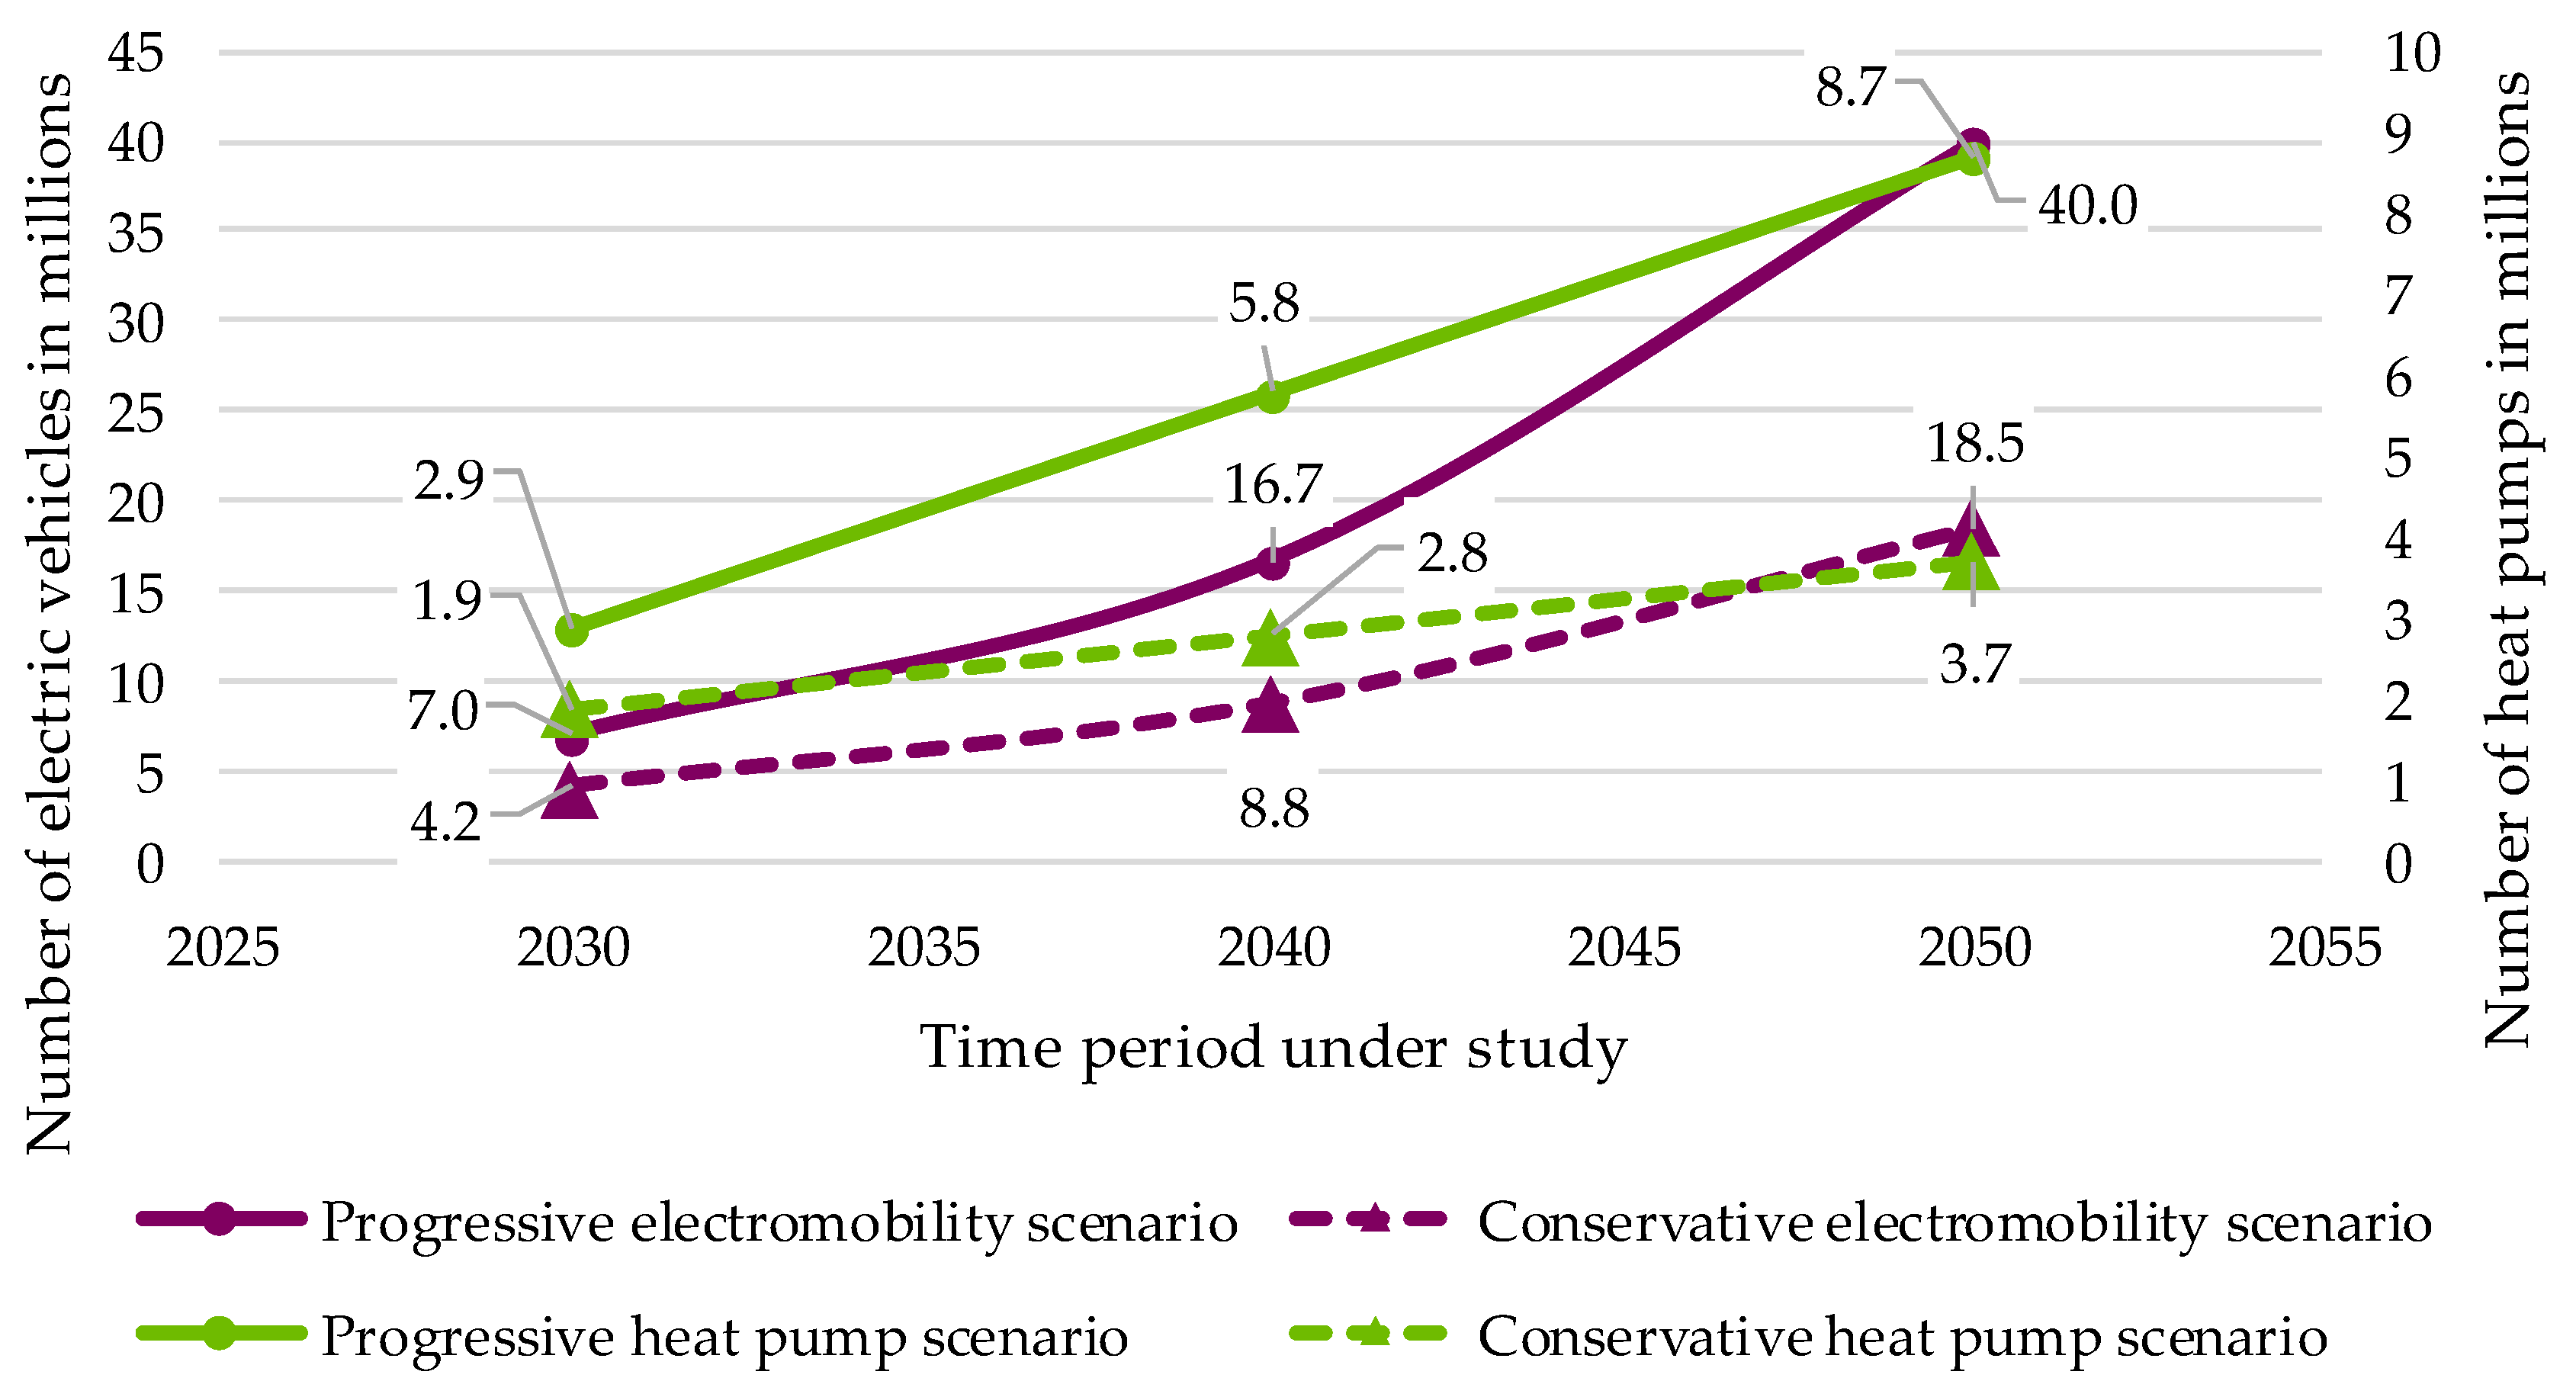
2.1. Development Scenarios

The scenarios for electromobility and HPs differ greatly regarding the expected development over the upcoming years. Each published study [38,39,40] assumes different boundary conditions such as the progression of climate change regulations, consumer acceptance, technological progress, etc. Accordingly, the anticipated course of development varies from one study to another. Hence, two development scenarios are chosen per load type. A “progressive” scenario (referred to later on as prog.) is adopted that assumes an accelerated spread penetration of electromobility and HPs. In addition, a “conservative” scenario (referred to later on as cons.) is taken on which assumes a rather moderate limited penetration of new loads [41]. Figure 1 shows the scenarios considered in this contribution, which are chosen based on thorough literature research and are selected to be moderate scenarios among others.

2.2. Regionalization

After determining the development scenarios, it becomes important to identify the number of new loads expected in an analyzed grid area. Therefore, a regionalization method is developed to calculate the number of new loads ending up in a grid area.
The regionalization methodology goes through five steps; starting at the country level, then down to the state level, after that to the city level, and afterward to the district level ending at the grid level. At each step, different regionalization factors are considered. For instance, for the step from the country level to the state level, the following regionalization factors are considered for electromobility for the respective state in comparison with other states in the country using a weighting term per regionalization factor: population, number of EVs, number of vehicles (combustion and electric), number of car owners (a single owner can own several cars), research budget for electromobility, and number of buildings. As for the same step for HPs, the number of existing HPs in the state is considered to be the regionalization factor [42].
By applying the regionalization methodology, the number of EVs and HPs are determined per MV grid. For validation, the regionalized numbers are cross-checked with the DSO-specific development plans. As further validation, these numbers are compared with the development of electromobility and HPs in specific grids. The expected number of EVs and HPs per grid are listed in Appendix A, Table A1.

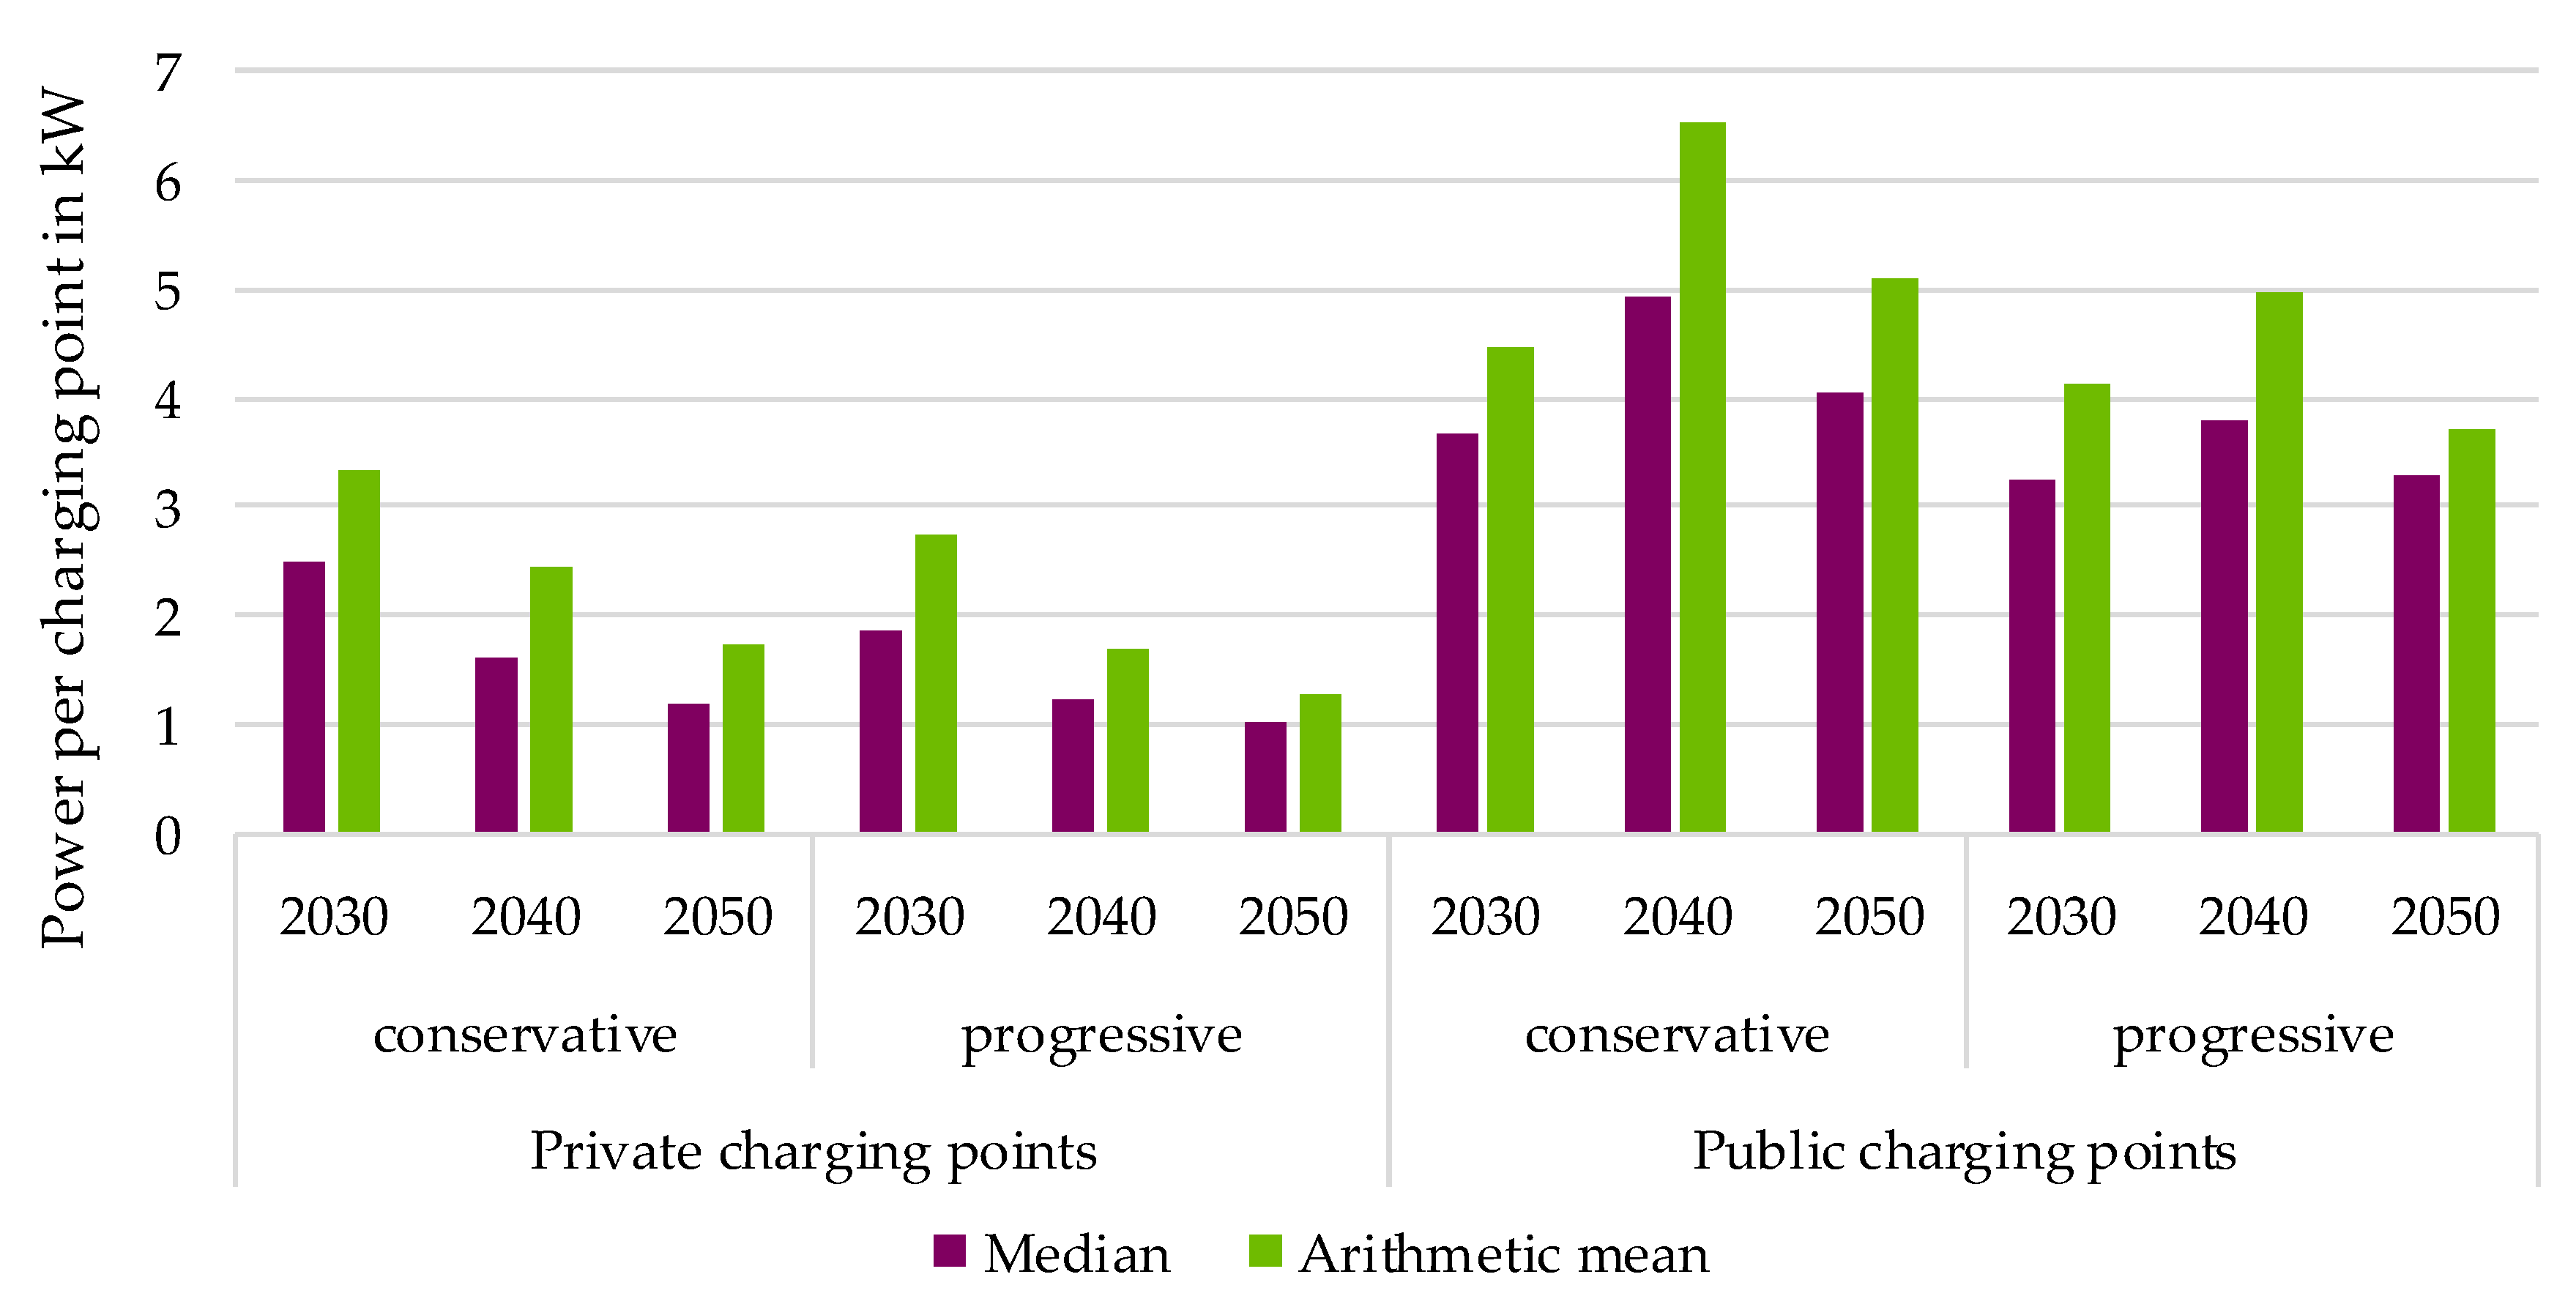
2.3. Nominal Power Assumptions

As for the charging infrastructure, the available CPs on the market differ greatly in terms of their nominal charging power, which makes it difficult to assume a certain charging power for the complete charging infrastructure. By analyzing the public charging infrastructure register from the German federal network agency [43] the development of charging powers over the past years is deduced. It becomes clear that the charging powers for PrCPs are within the range of 3.7 kW to 11 kW, whereas the charging powers for PuCPs go up to 150 kW or even up to 350 kW. Since an exact spread of the charging powers for the next 30 years is feasibly not possible, as a first approach to the distribution of charging powers, the following ratios in Table 1 are assumed. The assumed distribution of private and public charging powers has been agreed upon with the six major DSOs in Germany. A perfect power factor of one is assumed for the charging infrastructure.
As for the HPs, the approach to finding reasonable power assumptions is different, since, as mentioned previously, the heat demand varies greatly depending on each household and use case. The following steps are carried out to reach reasonable, generally valid power assumptions.
Firstly, the available HPs on the market are analyzed in terms of nominal power to find the widely spread power classes. Secondly, the average heat demand of standalone houses is analyzed to determine which power class can fulfill the required heat demand. This approach gives a first approximation of the required nominal power, which is 3 kW for the living space heating. Furthermore, an additional electric heating element for purposes such as warm water supply is analyzed, resulting in a big spectrum of nominal powers. Therefore, an average power assumption is adopted, giving an extra 6 kW for the electric heating element. This yields an HP with a total power of 9 kW (HP system + electric heating element) [44]. Since it is not clear whether all HPs are going to be installed with an extra heating element or not, the power assumptions are expanded to a hybrid system of 6.5 kW representing a distribution of the previous two HP systems. In summary, the three HP systems are as follows:
1-
3.0 kW (basic HP system);
2-
6.5 kW (hybrid distribution of HP systems 1 and 3);
3-
9.0 kW (basic HP system + electric heating element).

2.4. Load Modeling

The first step for representing the future grids is to convert the scenarios into power demand to be integrated into the grid model. The existing loads such as household, commercial or industrial loads are summarized here with the term “conventional loads” and are discussed at the beginning. Subsequently, the modeling for the new load types, namely the electromobility and HPs, follows.
To determine the development of the conventional household loads, a load demand model is developed [41]. The model performs a two steps process to determine the future load demand of household loads. Firstly, a statistical model is fed with the grid data (such as MV/LV distribution stations, energy consumption per building connection, standard load profiles, etc.) as well as socio-economic data [45] to estimate the future development of household loads. Subsequently, a deterministic model scales the corresponding standard load profile for the specified load type and year. As for the conventional industrial loads (customer stations in the MV level), the load development is not identified, due to the heterogeneity of the loads and their distinction from one MV grid to the other. Hence, the industrial loads are kept constant over the investigated period of time (the year 2022 until the year 2050).
In contrast to conventional loads, electromobility has little to no historical data that can be used for load modeling. Therefore, a statistical analytical method is implemented to model electromobility as a load in the grid.
For calculating the demand power of electromobility several approaches can be found in the literature. In [46], the coincidence factors for domestic CPs are calculated based on the driving and plug-in behaviors recorded. Depending on these recorded data sources, a model was developed to calculate the demand power for the domestic charging powers. Even though this model is well thought out, it does not tackle the public infrastructure that is not used by a single household. Therefore, in this contribution, the demand power is calculated depending on the tool developed in [47]. This tool simulates daily driving profiles by utilizing the collected driving data from [48]. These driving profiles are then converted to charging profiles for CPs. By simulating the seven days of the week, a weekly charging profile can be generated for a specific charging power. The weekly charging profile is then simulated for several weeks for different charging powers using an incrementally increasing number of CPs. Then, these profiles are accumulated to generate the peak power demand for a certain number of CPs for a certain charging power. Simultaneously, the demand factors for each number of CPs for the chosen dominant charging powers (3.7, 11, 22, 50 and 150 kW) are calculated. The demand factor is defined to be: “the ratio, expressed as a numerical value or as a percentage, of the maximum demand of an installation or a group of installations within a specified period, to the corresponding total installed load of the installation(s)” [49]. The integration of different shares of the charging powers can result in a mean effective charging power that varies from the simulated chosen charging powers. Therefore, a curve-fitting algorithm is applied to deduce the demand factor per kW increments between 3.7 kW and 150 kW [50]. Using these demand factors (shown in Figure 2) and the nominal power assumptions in Table 1, the demand power for electromobility is calculated according to the method in [42] and integrated into the grids. The demand factors per kW increments have been faded out to enhance the visibility of the figure.
As for HPs, grid planning is performed for each of the HP models resulting in an individual planning variant. Since a combination of the HP models in the same grid is not considered, the HP load modeling considers simply multiplies the nominal power with the demand factor for the corresponding number of HPs in the grid/feeder. The demand factor curve of the HPs is shown in Figure 3.

3. Methodology of Strategic Grid Planning

Grid planning depends on two main pillars. It starts with modeling the expected load and/or generation depending on the relevant operation point. Grid planning then continues with the implementation of strategic planning measure(s) in case limit violations are identified.

3.1. Identification of Grid Limits

In addition to the regionalization of new loads into the grids and their power assumptions, the identification of permissible grid limits constitutes a crucial step in strategic grid planning. Surpassing the grid limits leads to a hazardous operation of the equipment and may even lead to human losses. In the context of this contribution, the word equipment refers to current carrying operating equipment, i.e., lines—including overhead transmission lines and cables—and transformers. Apart from the DSO-specific grid limits, in the context of this contribution, the electric standards are taken as a reference to ensure universally applicable results.

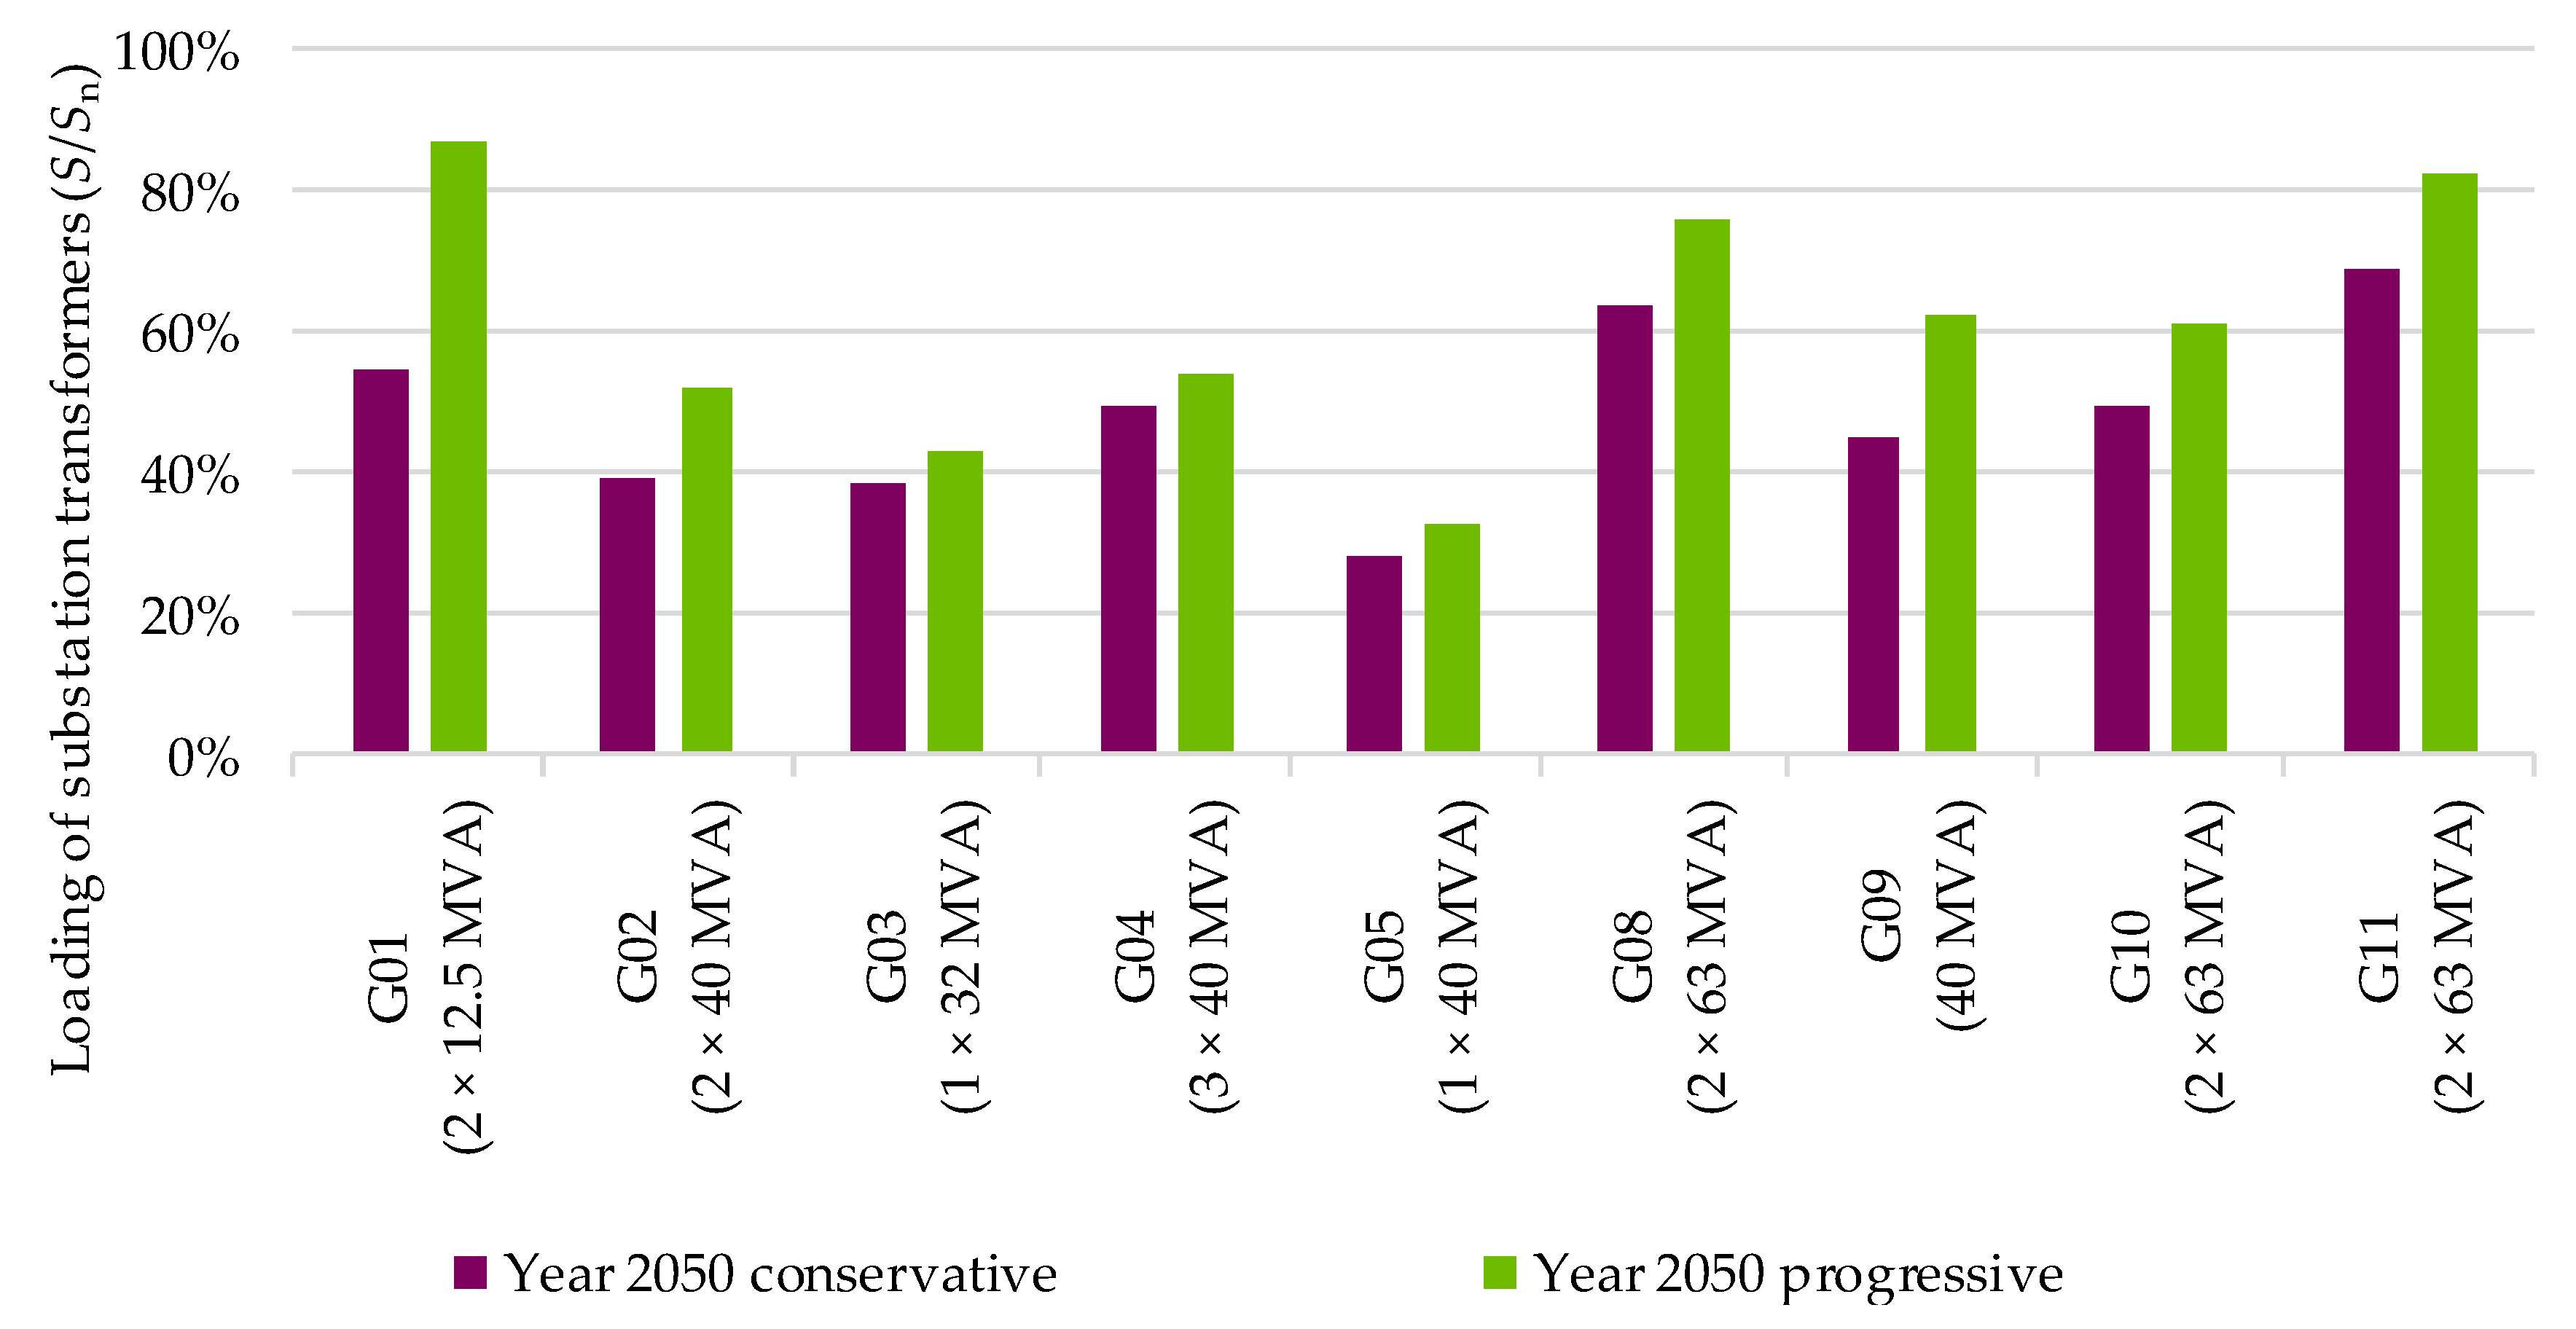
3.1.1. Equipment Loading Limits

The general rule of thumb regarding the loading of equipment is not to exceed the thermal admissible current (Ith). This gives the maximum loading of (I/Ith) ≤ 100% in normal operation (n-0) [52,53,54], where “n” corresponds to the total number of equipment in the grid. Since MV grids require an (n-1) level of reliability to ensure the supply of all connected loads in case equipment goes out of operation, the loading of equipment in (n-1) operation is the decisive factor for dimensioning MV equipment. The permissible loading limit used in the planning is I/Ith ≤ 120% during (n-1) operation of the grid. Hence, it is assumed that for parallel transformers of equal capacity, a loading of I/Ith ≤ 60% per transformer is allowed in (n-0) operation. Similarly, it is also assumed that for grids with an open ring structure, a maximum line loading of I/Ith ≤ 60% is allowed per main feeder.

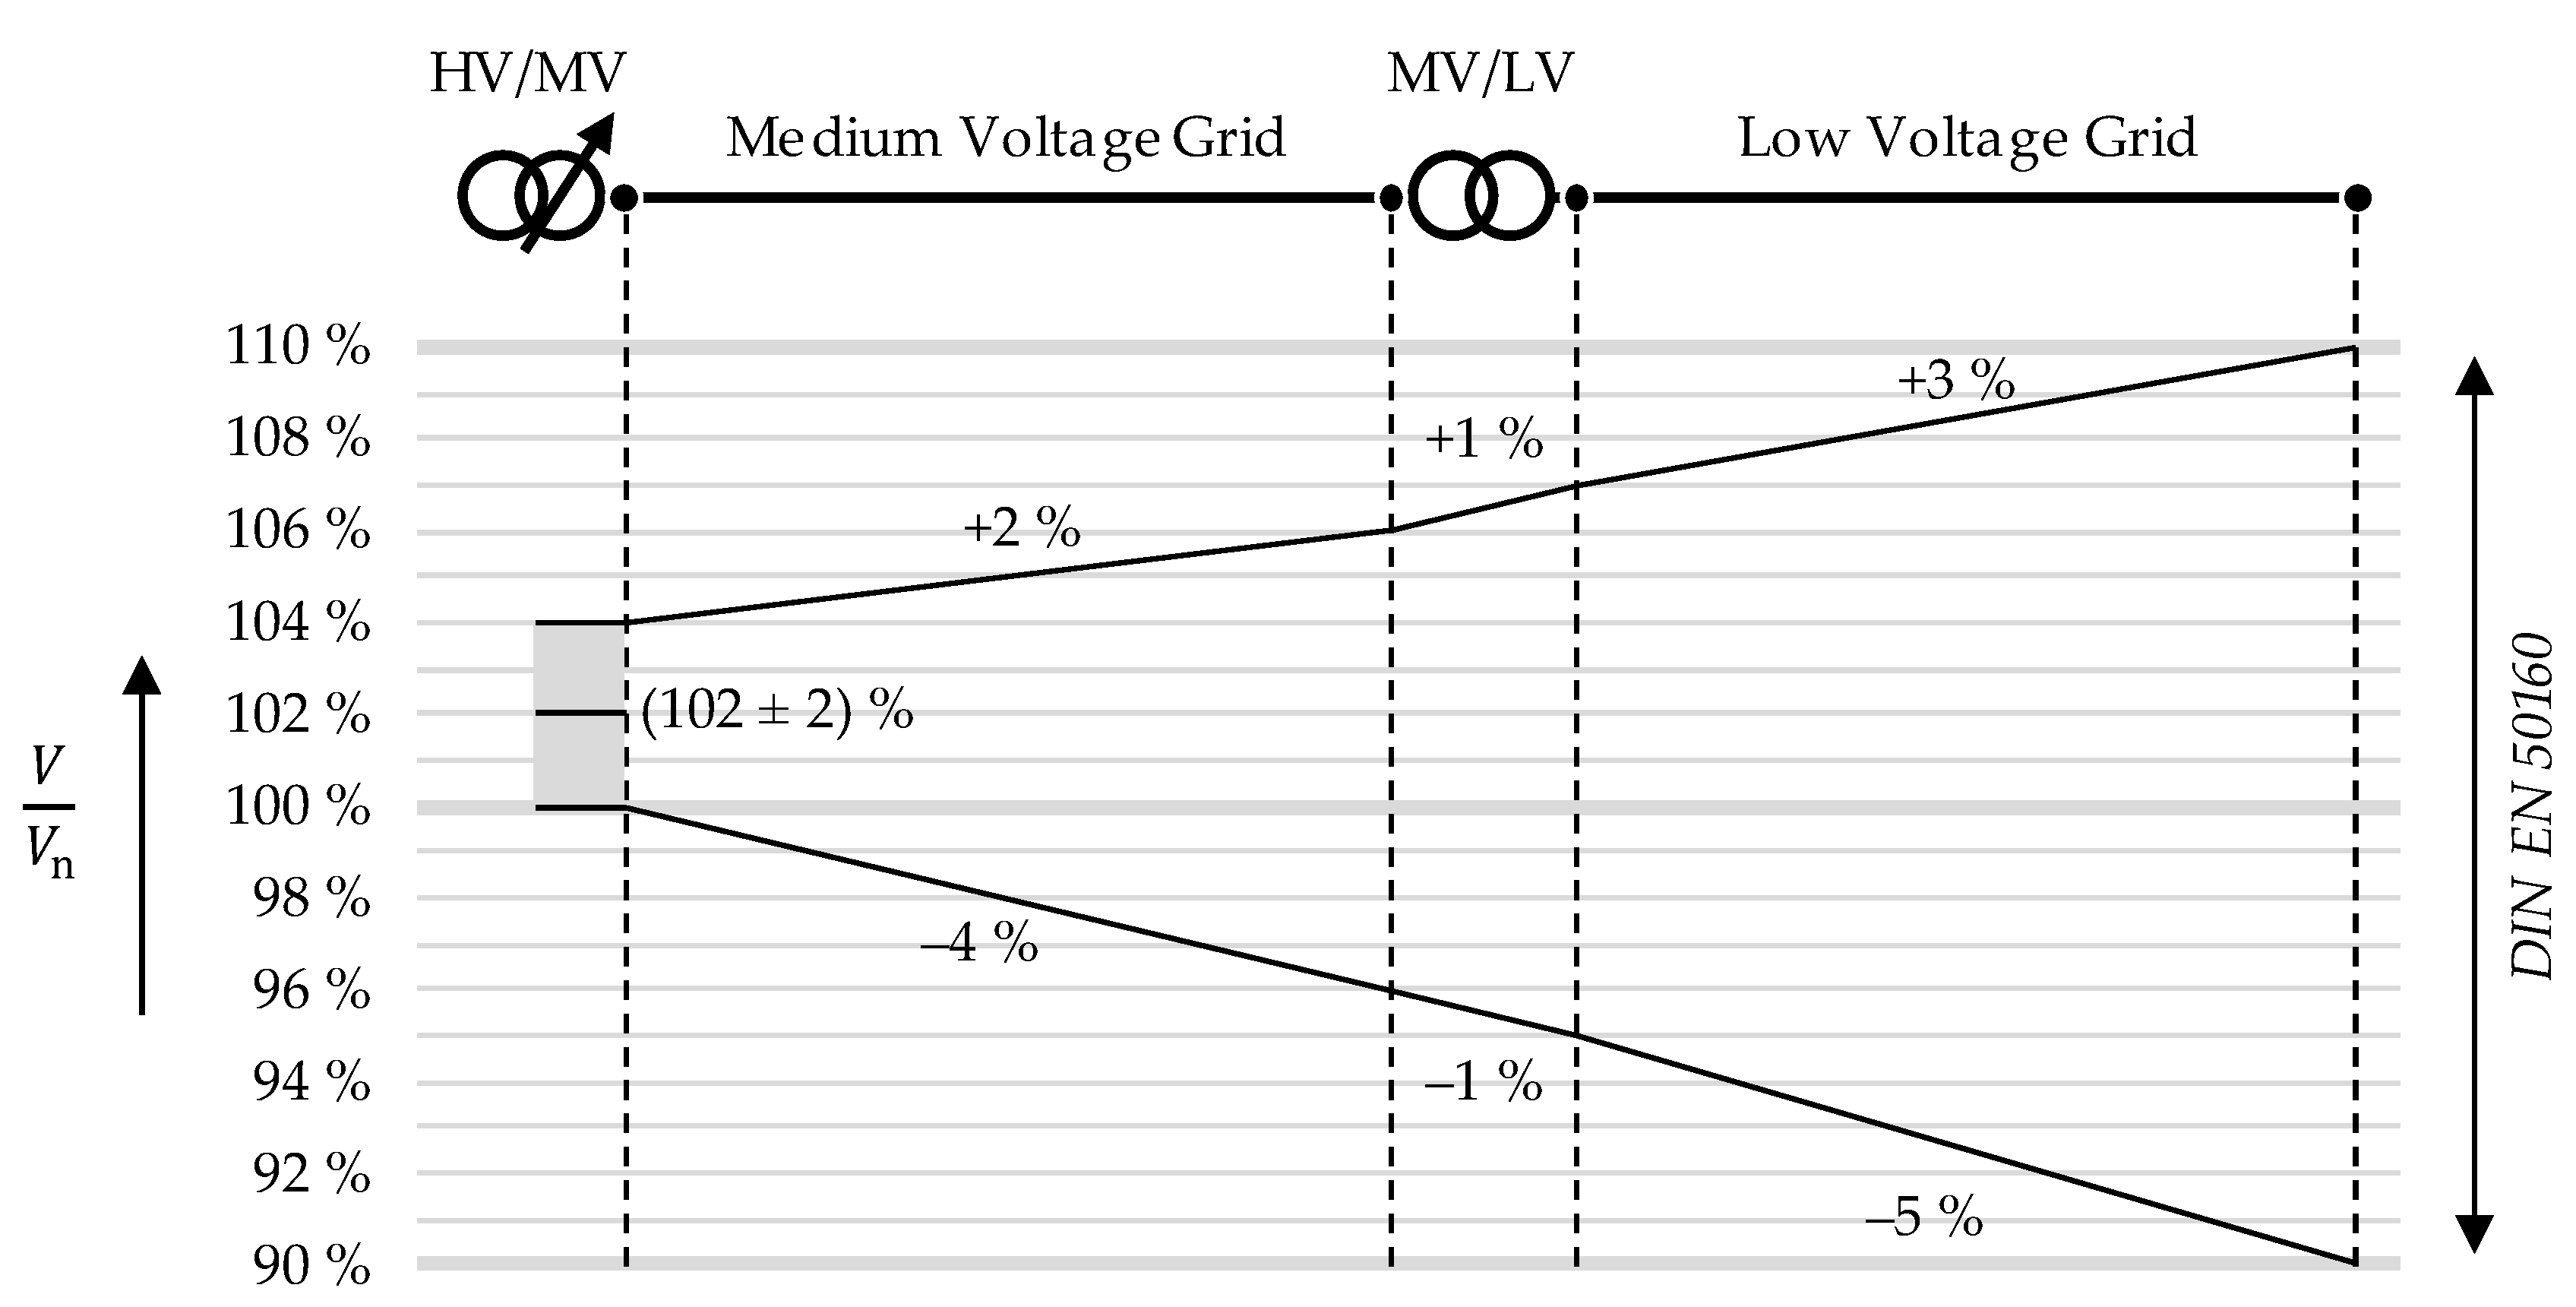
3.1.2. Permissible Voltage Range

Maintaining a constant node voltage V over a complete grid is extremely challenging. Therefore a voltage range is typically set per voltage level in order to ensure an admissible V at all grid nodes. According to [55], the admissible V ranges between ± 10% of the nominal voltage Vn over the entire grid. In this contribution, the voltage range is divided between the MV level and the downstream LV grids, resulting in a maximum admissible voltage drop ΔV = 4% Vn. in the MV level. The following Figure 4 shows the applied division of voltage range between MV and LV grids.

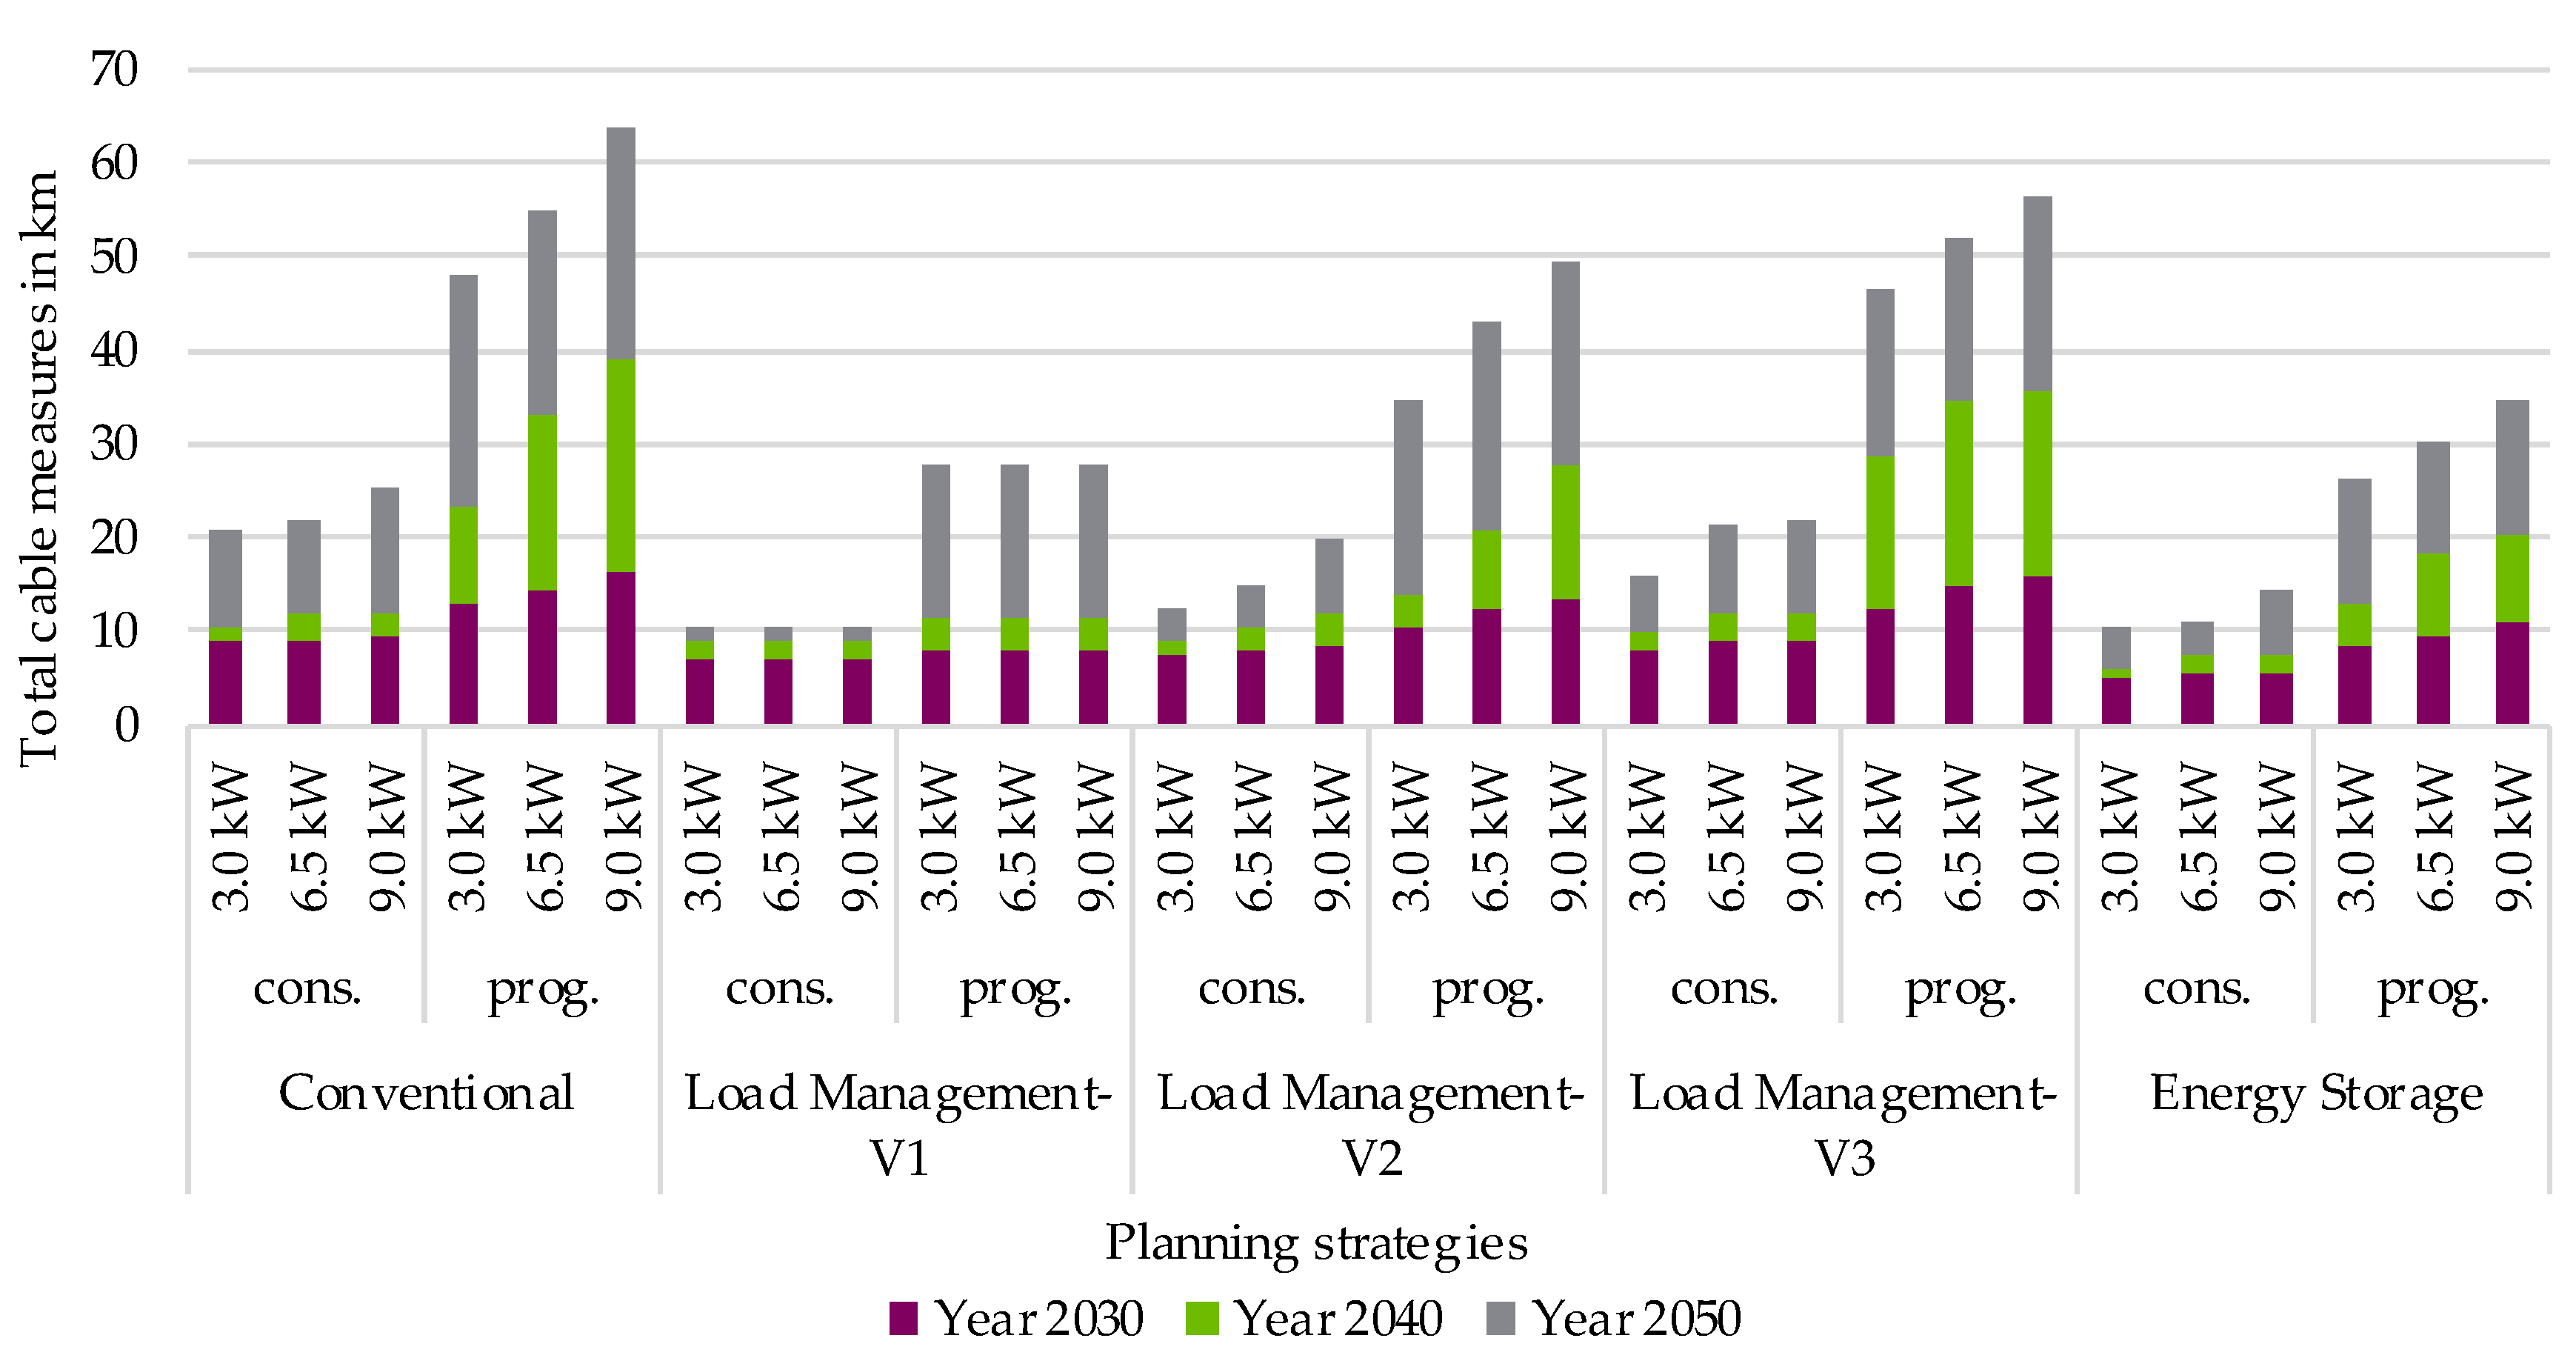
3.2. Planning Strategies

After identifying the grid limit violations, the DSOs need to perform planning measures to remedy the violations and restore the grid within the recommended limits of operation. Traditionally, the DSOs can perform one of the approaches that have been established in the grid planning for years already such as cable reinforcement or transformer replacement. The approach of applying traditional measures is referred to as a “conventional planning strategy”. However, with the emergence of new load types, innovative technologies have been developed to take advantage of the flexibility of these loads to reduce the required grid reinforcement(s). This approach is referred to later on as an “innovative planning strategy”.
Depending on the identified grid violation, various planning measures can be implemented. The following Table 2 shows an overview of the use cases of the planning measures, which are explained later on. Starting with the two measures implemented within the conventional planning strategy, the cable and substation transformer measures remedy the grid violation locally without affecting other identified grid limit violations. For instance, when the substation transformer is overloaded in addition to several cable sections, the application of substation transformer measures remedies the local loading violation without having a significant impact on the overloaded cable sections. On the other side, the measures within the innovative planning strategy can have a grid-wide impact on limit violations. The measures are explained in detail in the upcoming section.

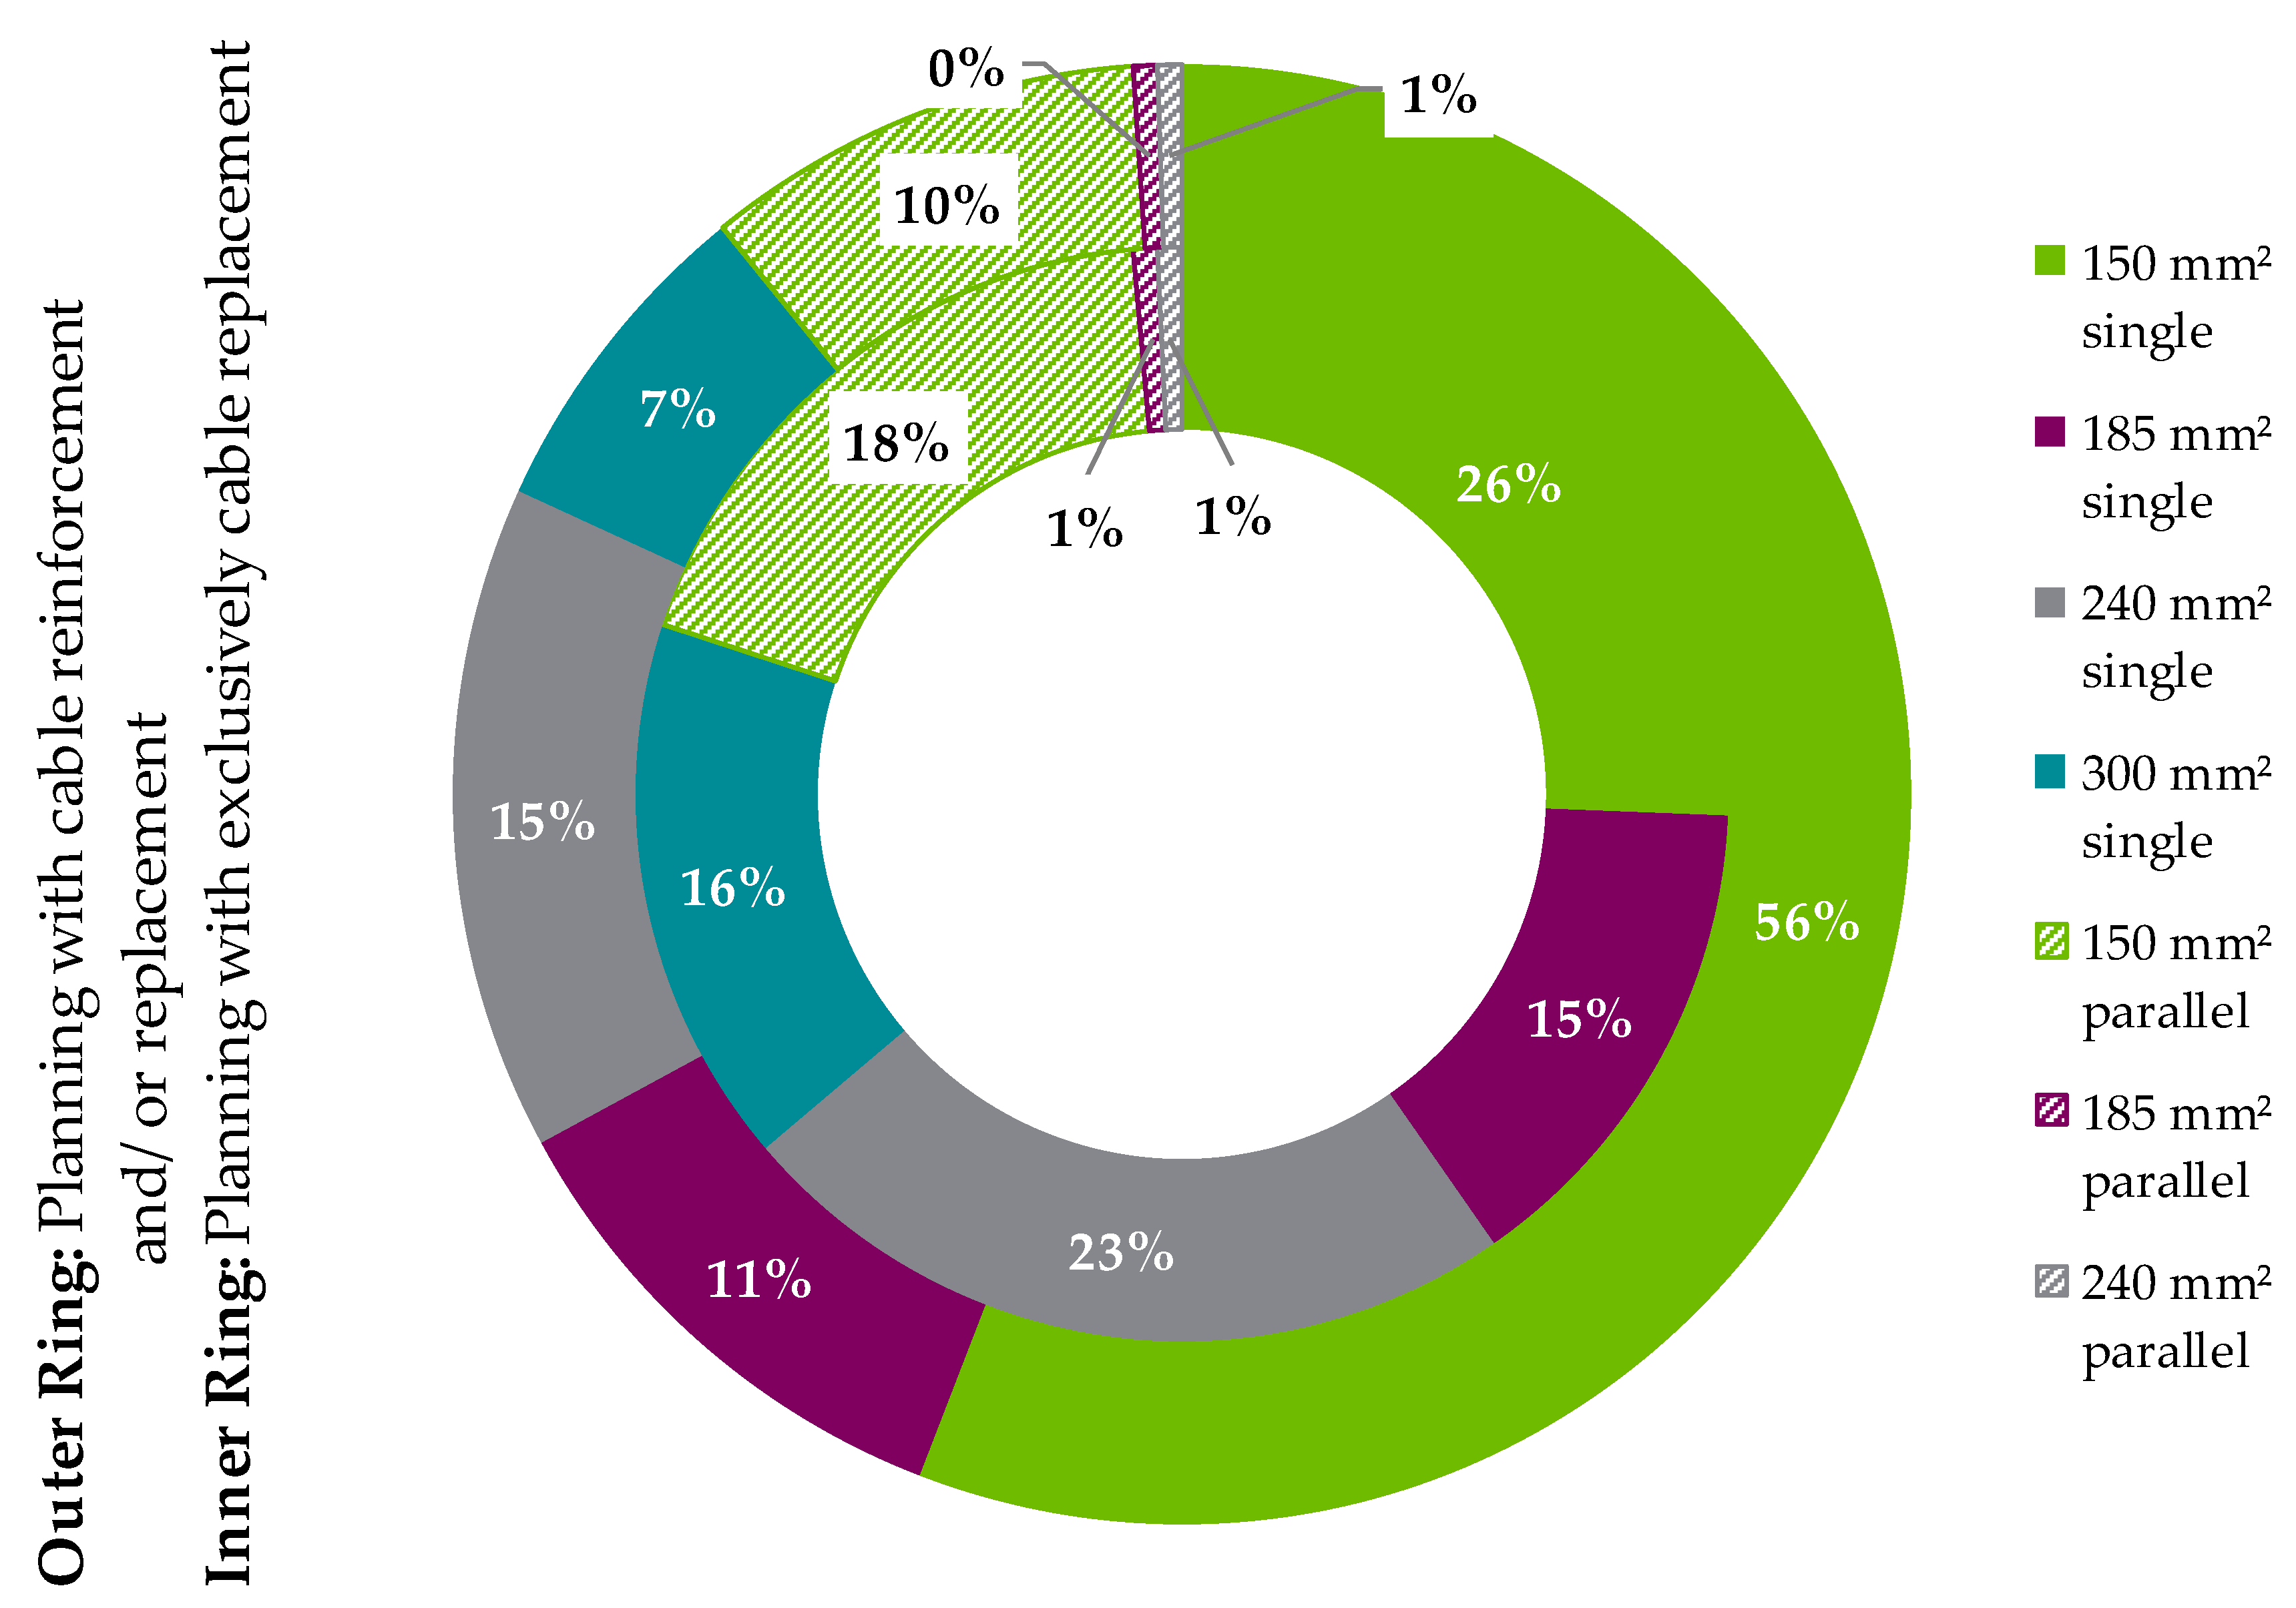
3.2.1. Conventional Planning Strategy

This approach represents the traditional planning measures performed by DSOs and that have been established as standard planning options. These include the installation of new equipment such as cable or transformer or the application of a grid operational measure. These options are discussed in the following sections.
  • Cable measures
Cable measures are considered to be one of the main tools of grid planning. These cannot only remedy overloads in the grid but can also remedy voltage violations at certain nodes in the grid. Cable measures can generally be classified into two main categories; grid reinforcement and grid expansion.
As for grid reinforcement, the grid topology is maintained and the cable measures are performed at the already existing cable routes. In case the overloaded cable is identified to have a cable cross-section area smaller than the DSO’s standard cable cross-section area or when the cable insulation type is considered to be old (e.g., NKBA), a cable replacement is performed. In this case, the new cable replaces the existing overloaded cable. However, if the overloaded cable has a cross-section area corresponding to the current standard cross-section area and has a relatively new insulation type (e.g., N2XS2Y), the cable is reinforced with a second new cable. In both cases, the newly constructed cable is laid in the same route as the overloaded cable.
As for grid expansion, the grid topology is changed by constructing a new cable route directly connecting the grid nodes. For instance, when the load significantly increases at a substation feeder, some of the load can be shifted to a newly constructed feeder. On one hand, this measure can drastically reduce the load on the existing feeder. However, on the other hand, the space for constructing new feeders may not be always available, especially at jammed substations in highly dense areas.
In the context of this contribution, only grid reinforcement measures are applied, since the investigated grids are collected from six different DSOs where the spatial boundaries of the individual substations differ remarkably. Furthermore, unified cable measures are performed for all grids, so that generally valid results can be deduced.
The applied cable type is NA2XS2Y with the cross-section areas (150 mm², 185 mm², 240 mm² and 300 mm²). The wide range of applied cross-section areas helps, later on, to identify the most suitable cable cross-section for future planning measures. To ensure minimum costs, the planning tries to remedy the grid violation using the smallest cable cross-section area. When the violation persists, the next bigger cable cross-section is employed. When the violation persists after applying the biggest cable cross-section area (300 mm²), two 150 mm² cables are laid. Furthermore, each cable measure is checked whether it will need to be re-planned in the following years up to the year 2050. If the same cable section becomes overloaded in one of the following supportive years, a bigger cable cross-section is laid in advance, so that the cable trench does not need to be dug frequently. Since the cables are not fully loaded and the modeled loading corresponds to the peak demand operating point, cable reduction factors are not considered.
2.
Substation transformer measures
In contrast to the grid-wide cable measures, substation transformer measures are central. These measures are strictly constrained since a certain redundancy is required for substation transformers. The most common substation construction is a double power transformer of the same nominal power. The double transformer constellation ensures the supply of loads, in case one of the transformers breaks down. If the substation transformer is overloaded, the following three options can be performed.
  • Transformer reinforcement
The main condition for this option is the space availability in the substation to construct a new transformer. The existing transformers can be reinforced with an extra transformer having the same nominal power as the existing transformers. As a result, several feeders can be shifted to the new transformer. Otherwise, the existing transformers can be loaded to higher levels while considering the newly added transformer as a reserve.
  • Transformer replacement
For this option, the existing transformers are replaced with two (or more) identical transformers of a higher nominal power.
  • Boosting the transformer loading
As the decisive criterion for loading the transformers is the temperature, their loading can be boosted by externally cooling them. The possible cooling concepts differ according to the power class of the transformer and its insulation type.
After the transformer measures are completed, the short-circuit currents in the substation must be calculated. Accordingly, the switchgear rating needs to be adjusted. Furthermore, all the transformers in the substation need to have the same nominal power and impedance to avoid rotating currents during parallel operation.
Since the existing transformer types and the space availability differ from one substation to another and from one DSO to another, “Transformer replacement” is the only considered transformer measure.

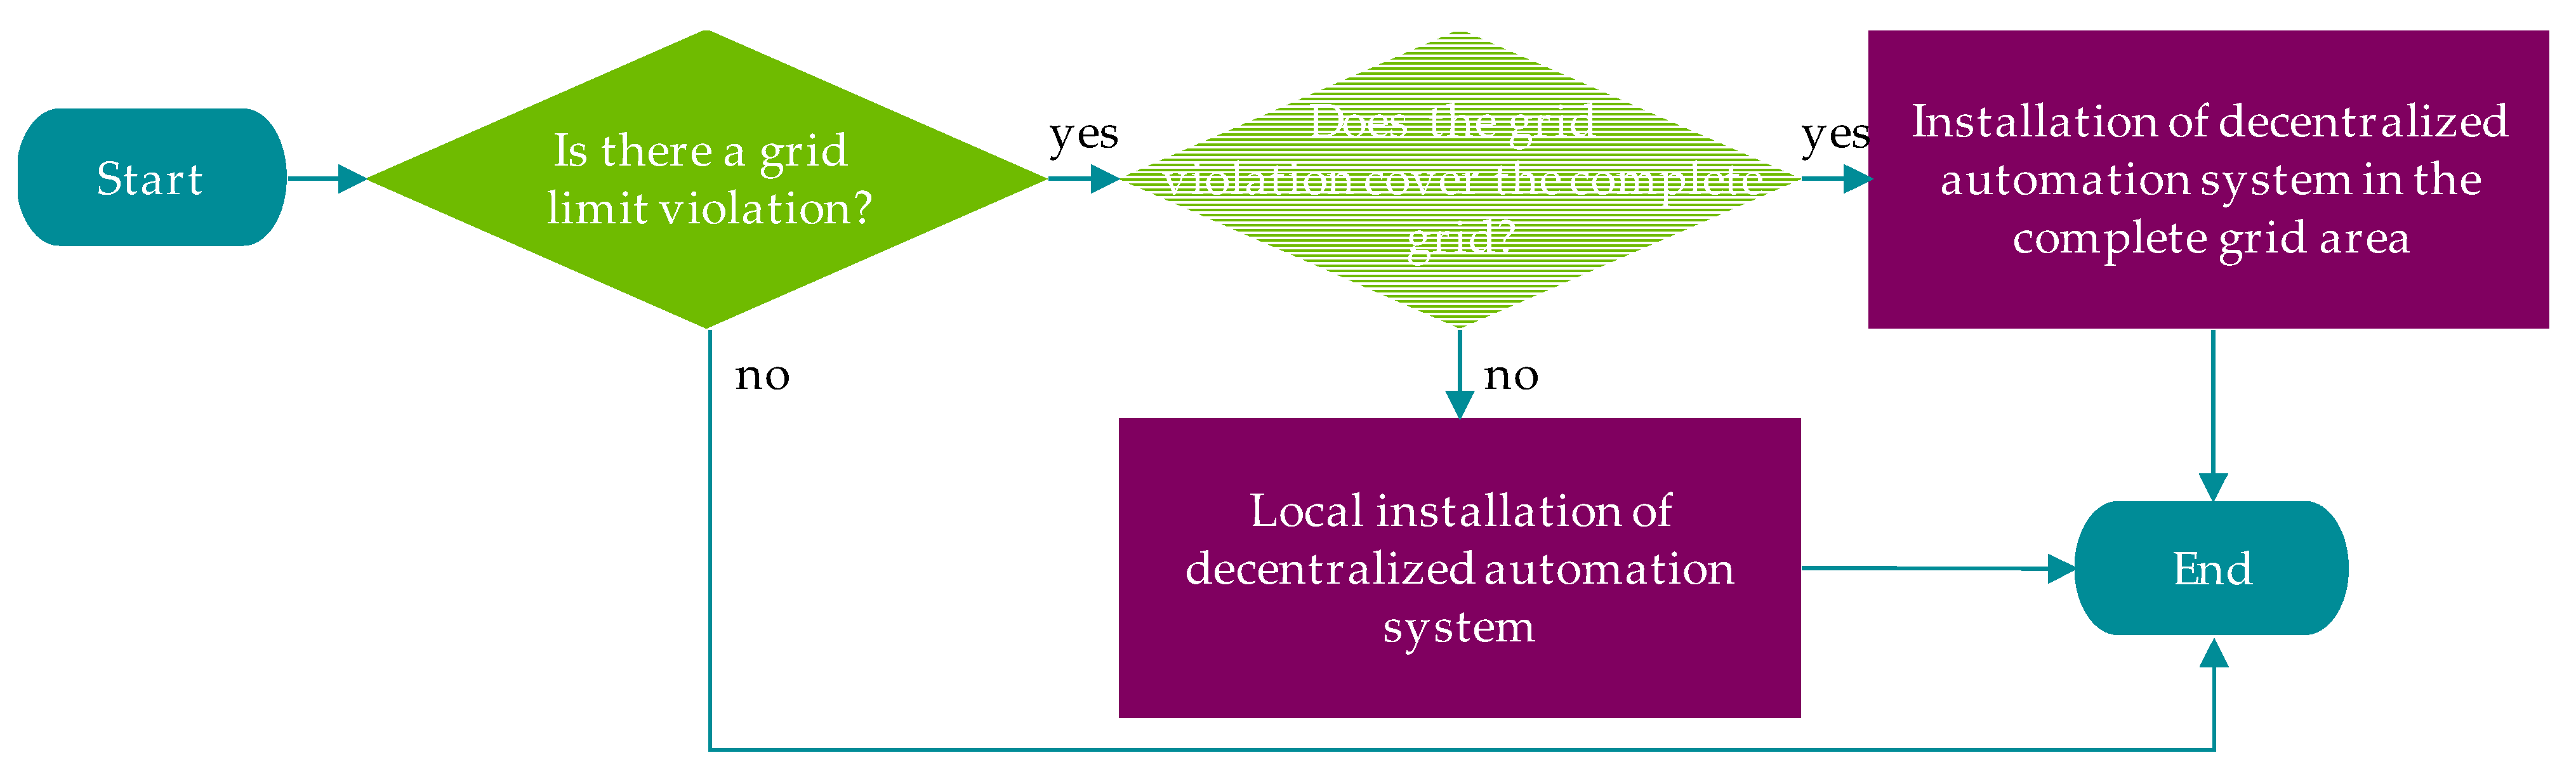
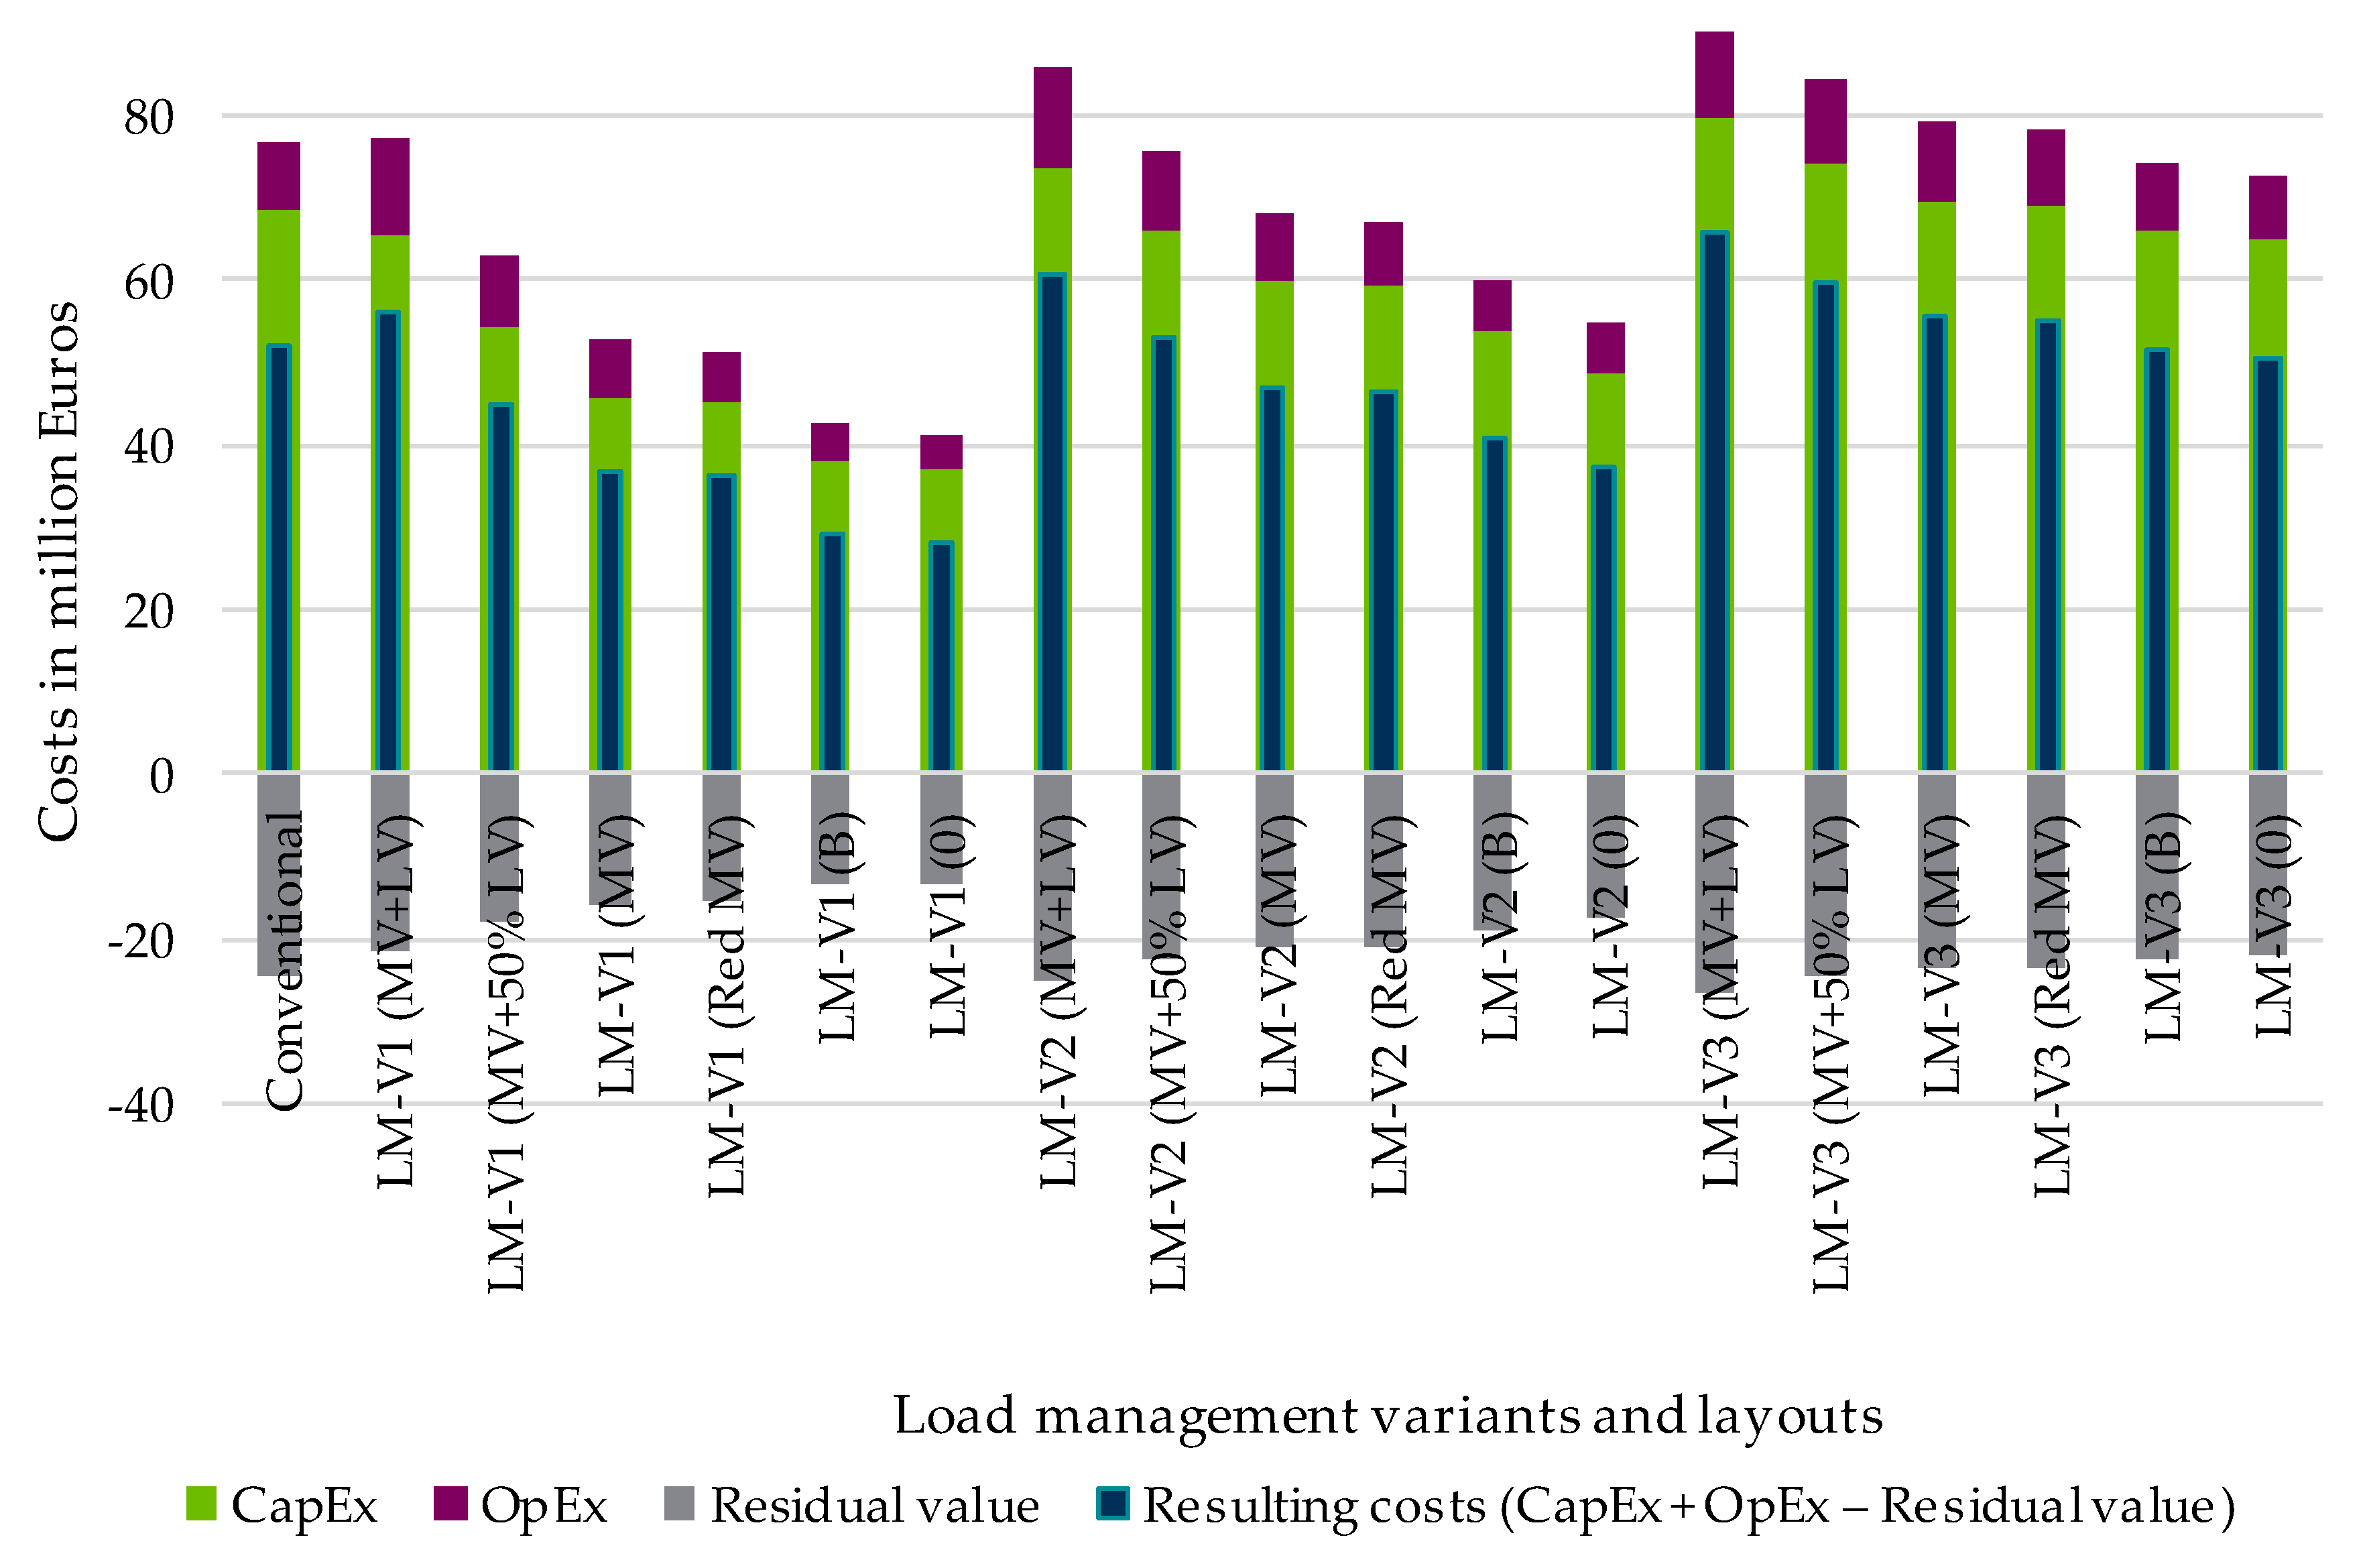
3.2.2. Innovative Planning Strategy

The innovative planning strategy aims to deploy new technologies that can reduce the required grid reinforcement measures or completely replace them. Since the new loads offer a degree of flexibility, the developed innovative technologies utilize this flexibility to either reduce or eliminate grid violations. In addition, the innovative technologies utilize the mentioned flexibility without compromising the comfort of the customers. Since this contribution focuses on increasing loads in the MV grids, several innovative technologies that are mentioned in the literature (e.g., active regulating transformer or feed-in management) are not mentioned here.
  • Decentralized automation systems
Decentralized automation systems (DASs) have been developed over the past few years to monitor and determine critical grid states as soon as they occur. In addition, a DAS can purposely regulate the grid state using regulators at the equipment to be controlled. According to the targeted application, DAS can serve as a prerequisite for the applied technology.
A DAS composes of a remote terminal unit, a communication link, sensors, and regulators. Regulators are assembled at the equipment to regulate their drawn active and reactive power. Sensors are installed at certain grid nodes to measure the current flowing at this node and the corresponding voltage. The communication link connects all DAS components to enable data transfer between them. The remote terminal unit process the measurements performed by the sensors and generates the command, by which the regulators control the equipment. The remote terminal unit generates the commands based on certain functionality. This functionality ranges from avoiding grid limit violations using load or generation management to optimizing the energy price by managing energy storage units [56].
In addition, this contribution assumes that the communication link occurs using the cellular phone network since the phone network is stable in urban grids that are solely analyzed here. The costs for SIM cards used for utilizing the cellular phone network are negligible and thus can be ignored. As for determining the gird state, sensors do not have to be mounted at each grid node. The determination of grid state using a few sensors mounted at specific grid nodes has already between discussed in the literature [57]. Using the developed techniques, the sensors are allocated in the grids. Finally, this contribution uses the presented DAS as a requirement for applying LM and reactive power management (RPM).
2.
Load management
LM is growing in importance with the increased integration of flexible loads into the grids. This contribution considers LM, which regulates the power of CPs and HPs according to the grid state in regards to the voltage level and the loading. The regulation aims to reduce the grid limit violations or completely eliminate them. An energy market-oriented regulation is not considered here.
A crucial aspect of applying LM is a discrimination-free application. The regulation of the specified loads occurs independently of the load location and the load power. On one hand, the power of the CPs is regulated to a minimum of 3.7 kW, since a complete shut-off is not recommended. On the other hand, the HPs are shut off completely for certain time slots. In contrast to CPs, HPs can store heat that can be used during shut-off times. Table 3 shows the three LM variants considered in this contribution. The consideration of different LM variants helps to identify the advantage of each load regulation in terms of grid planning measures [58].
If a grid limit violation emerges at a single feeder, LM regulates the loads (according to the LM variant) connected to the feeder until the violation is remedied or the minimum load power is reached. However, if a substation transformer is overloaded, the LM regulates all corresponding loads in the grid to reduce the transformer loading. This regulation benefits the feeder loading but requires considerably more load regulation and the corresponding DAS components. Figure 5 shows a flowchart explaining the installation of DAS components according to the grid violation. It starts with checking whether a grid limit violation occurs. In this case, a second check for the extent of the grid violation is performed. The goal here is to install the DAS components solely at the required positions to reduce the installation costs. If the grid limit violation is restricted to particular feeders and does not cover the complete MV grid (including the transformer), the DAS components are to be installed at the violated feeders. Otherwise, a grid-wide installation of DAS components is necessary.
Since LM basically regulates loads connected to the downstream LV grids, the DAS needs to be installed at both voltage levels. The DAS in the MV level analyzes the grid state and sends signals to the DAS in the LV level to regulate their loads accordingly. With the ongoing roll-out of DASs, six LM layouts (shown in Table 4) are developed to analyze the effect of the layout costs on grid planning. The layouts differ in terms of the required measuring, information and communication technology (MICT) to operate LM. These layouts start with the assumption that neither the LV grids nor the MV grids are equipped with MICT. In this case, the MV level takes over the costs for complete MICT roll-out in both voltage levels. The layouts then end with the assumption that LM is already installed in the grid and can be used for no further costs. Figure 6 illustrates the differences between the six LM layouts for a single feeder. The shown number of sensors is then projected for a complete MV grid in case the transformer(s) and/or more than one feeder are overloaded.
Several challenges arise in implementing LM in the MV grids [60]. Since MV grids can span for several kilometers, a communication delay between the components may occur, thus leading to prolonged grid limit violations [61]. Several other challenges such as data privacy, measurement uncertainty, and the defense against cyber-attacks should also be considered before implementation.
  • Reactive power management
Basically, there are two application concepts of RPM. The first concept enforces a static RPM, which regulates the reactive power of loads on a predefined set point. The second concept applies a dynamic reactive power regulation according to the grid state. Obviously, the second principle requires a DAS to identify the grid state and establish the necessary RPM accordingly. The loads regulated by RPM are CPs since they offer the necessary flexibility for RPM.
By changing the angle between the voltage and the current drawn by the load, the reactive power drawn by the load can be adjusted. Changing the current to lagging or leading alters the direction of the current flow and can either increase or decrease the voltage at the node. This flexibility helps maintain the voltage level in its allowed range in case of an increase in load. The following Figure 7 displays the effect of lagging and leading currents on the node voltage.
In this contribution, RPM has proven to be ineffective in terms of grid planning due to two main reasons. The first reason is that with the integration of new loads, MV grids rarely suffer from voltage limit violations. In fact, it is recommended that the voltage limit distribution between LV and MV grids be reinvestigated for the grid planning (see PG 7 in Section 4.3). The second reason is that since RPM works on improving the voltage level by increasing the reactive power drawn (increasing the loading) and since the integration of new loads increases the equipment loading in the first place, applying the RPM merely increases the loading further. Thus, the RPM contributes to further equipment overloads rather than easing them and therefore, this technology is not investigated further.
2.
Electrical Energy Storage
In this contribution, electrical ESs refer to an equipment that saves a certain amount of electrical energy to be used later on. An ES draws electric current from the grid, saves it using a chemical process and injects current afterward. Hence, the ES indicates in this context battery storage. Other ES devices such as flywheel energy storage or pumped hydro energy storage are not considered.
Technically, ESs can have two main purposes. On the one hand, it can be market-oriented. In this mode of operation, ES stores energy when the market signal indicates a low energy price. Afterward, the ES can inject current when the energy price increases. On the other hand, the ES can also be grid-oriented, in which it stores the current at off-peak times. Later on, the ES can inject the current at peak demand times to reduce the transformer and cable loading. In the context of this contribution, only the second purpose is considered.
Generally, ESs can be used to overcome overloads in the grid for various periods of time. Hence, the cost of ESs depends on the injected peak power in kilowatts and the period of injection in hours. The injected peak power is regulated by an inverter or a power conversion module, which is negligible in costs in comparison to the battery modules. Therefore, the cost of ESs significantly depends on the amount of energy saved or in other words the period of time in which an ES can inject its peak power. This contribution studies the costs for two ES; with one having a capacity to deliver peak power for 2 h and the other for 4 h.

4. Derivation of Strategic Planning Guidelines

After finishing the strategic planning for 11 MV grids, the results are consolidated in order to deduce generally valid PGs for all MV grids. A classification of the investigated MV grids is given in Appendix A, Table A2. The deduction of the PGs needs to find a balance between being specific enough to offer solid recommendations to the DSOs, but also broad enough to apply to the vast majority of MV grids. This chapter aims to find the exact balance between these two boundaries.
As a first step, the load development is calculated for the 11 analyzed MV grids in order to illustrate the expected load demand. Figure 8 shows the load development for 11 MV grids for the different load types. Base conventional loads (household and small commercial loads) are represented by distribution substations and the industrial loads are represented by customer stations. In contrast, the new loads are represented by charging infrastructure combining both private and public charging infrastructure and HPs with the different HP load assumptions. It can be seen that the conventional loads have a nearly constant load over the considered period of time. Since the penetration of charging infrastructure correlates strongly to the number of households in a grid (represented explicitly by the distribution substations), a high load development of charging infrastructure is noticed in the MV grids with a high load of distribution substations (e.g., G01 and G02). Furthermore, the same correlation is observed between the load development of HPs and the load of distribution substations (e.g., G08 and G11). On the contrary, a modest load development of charging infrastructure and HPs is expected in MV grids with a high industrial load taking G04 for instance. The corresponding grid parameters for the 11 MV grids are listed in the Appendix A, Table A1.
After modeling the load development for the analyzed MV grids, the grid value violations are identified. Accordingly, planning measures are performed and displayed in a consolidated form in Figure 9. The figure shows that the cable measures for the conventional planning are more than the cable measures for any of the LM variants. With a focus on the cable measures performed in the year 2030 (purple), it can be deduced that the cable measures remain constant irrespective of the applied planning strategy. This confirms that the short-term cable measures need to be performed regardless of the DSO’s chosen strategy. These stand for the small dimensioned cable sections in the MV grids. As for LM-V1, there is no difference in the cable measures between the three HP models since the HPs are turned off in this LM variant. Figure 9 shows that the LM variants, LM-V1, LM-V2, and LM-V3, can reduce the cable measures and/or postpone them but cannot completely replace them. The same applies also to planning with the ES.

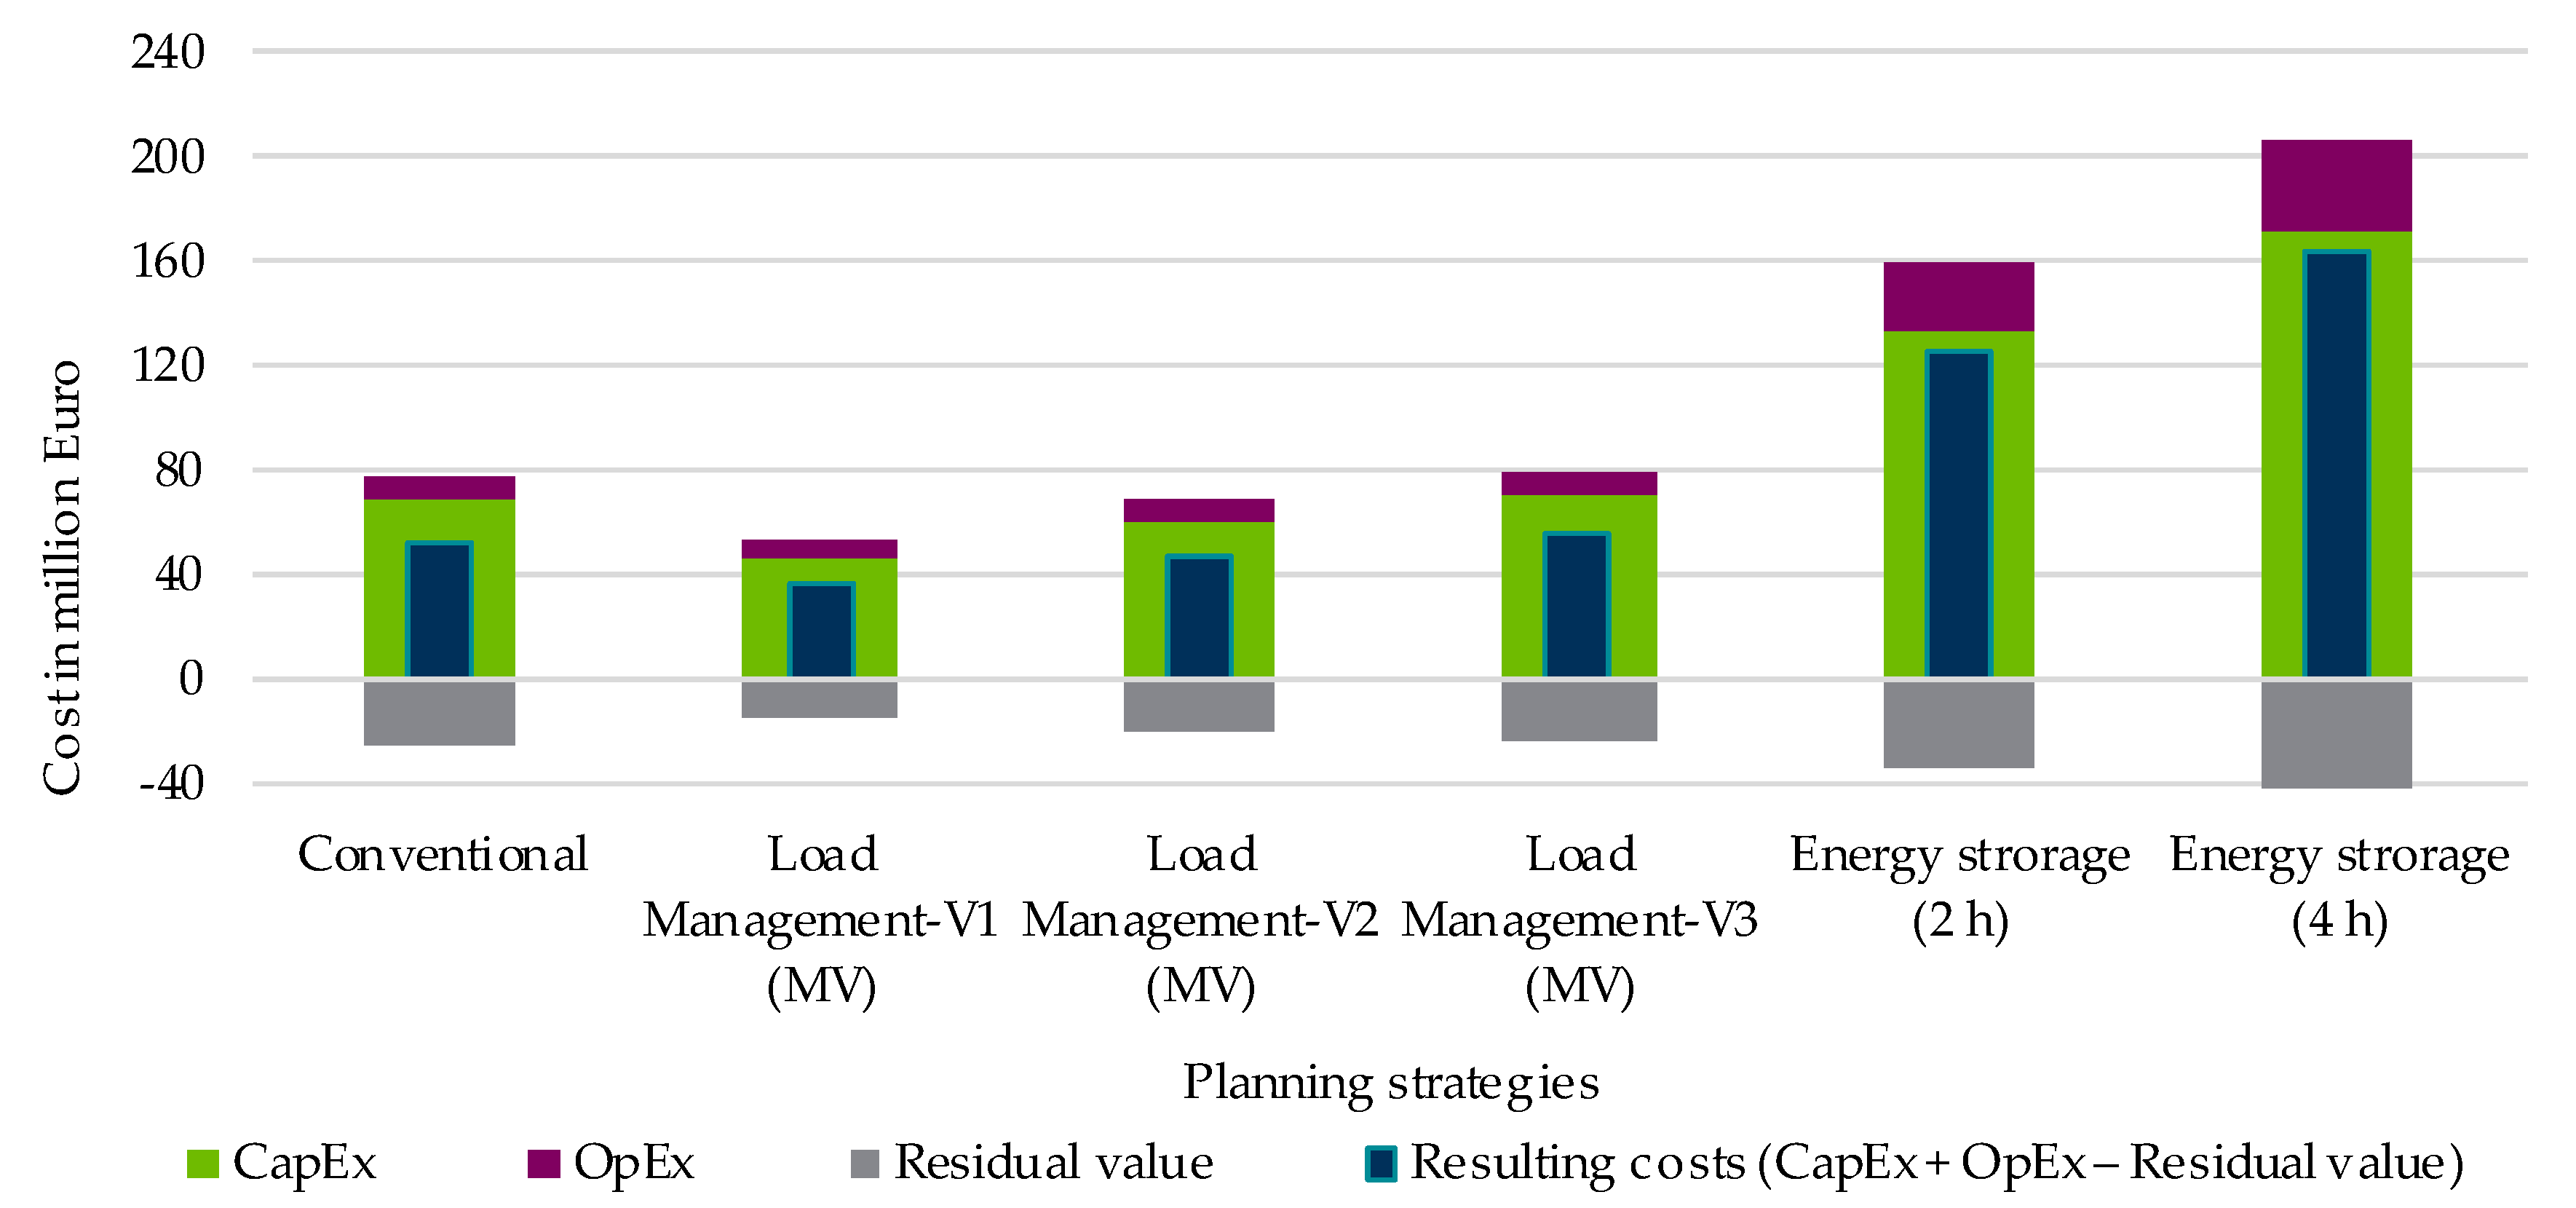
4.1. Technical and Economic Assessment

After planning, the costs for the planning measures are calculated to evaluate the different planning strategies. The net present value method is chosen for the cost calculation to contain all the investment and operating costs of the planning measures for the period under consideration. The advantage of this method is that it retraces the total spending back to the present, depending on the year in which the spending takes place. Hence, the comparability of the different planning strategies becomes easier. The presented costs are calculated according to the net present method using the assumed costs of the equipment presented in Appendix A, Table A3 [62].
The following Figure 10 shows the consolidated cable measures for the conventional planning, the three LM variants with the LM layout (MV) and the planning with two-hours and four-hour ESs. The costs constitute of capital expenditures (CapEx) and operational expenditures (OpEx). The residual value of the measures at the end of the considered timeframe is then deducted from the CapEx and the OpEx, thus giving the resulting costs of the planning. Figure 10 shows that the LM-V1 (MV) is cheaper than conventional planning. Whereas, LM-V2 (MV) costs nearly the same as conventional planning and the costs for LM-V3 (MV) slightly exceed the costs for conventional planning. The cost-efficiency of the different LM variants and layouts is discussed in detail in the fourth PG. The costs for the two ESs exceed the costs for conventional planning by far. Thus showing the previous unattractiveness of this technology.
With an overview of the total costs, the savings potential of the planning strategies in comparison to the conventional planning is analyzed per planning variant and shown in Figure 11. It becomes clear that none of the planning variants with ESs is cheaper than conventional planning. In addition, a difference in the saving potentials of the three LM variants is clear. For instance, the planning variant “LM-V1 (MV)” is in 97% of all analyzed planning variants more economical than the conventional planning. Detailed usability of the different LM versions and layouts is investigated in the fourth PG.

4.2. Medium Voltage Strategic Planning Guidelines

Based on the results obtained from the MV grid planning, seven PGs are derived. The PGs serve as the main principles for the planning of MV grids. They, however, cannot replace the DSO-specific PGs.
The PGs are arranged in the same steps that a grid planner executes to complete grid planning. The PGs start with the power assumptions for the different load types mentioned previously in Section 2.4. They continue with the standard dimensioning of the equipment used in the planning. Furthermore, different digitization levels of the grid in the context of LM are investigated. The PGs proceed with characteristics of the different grid structures, voltage levels, and locations. They end with a prospect for a new voltage distribution between MV and LV grids.

4.2.1. First Medium Voltage Planning Guideline

A mean effective charging power of PPrCP,SS = [0.3; 2.4] kW for private charging points, of PPuCP,SS = [0.05; 0.8] kW for public charging points, an electric power of PHP,SS = [0.1; 0.5] kW for 3.0 kW heat pumps and of Pconv,SS = 2 kW for conventional household loads are recommended per building connection for the dimensioning of substation transformer.
A mean effective charging power of PPrCP,F = [0.8; 2.7] kW for private charging points, of PPuCP,F = [0.1; 0.9] kW for public charging points, an electric power of PHP,F = [0.1; 0.5] kW for 3.0 kW heat pumps and of Pconv,F = 2.4 kW for conventional household loads are recommended per building connection for the dimensioning of substation outgoing feeders.
The first step in performing grid planning is to model the grid with the proper load prognoses. In this regard, the power value assumptions play an essential role in the grid reinforcement measurements and the final planning. Since the demand factors differ between the two planning perspectives for dimensioning the substation transformers and the outgoing feeders, the power value assumption should be determined for the two perspectives separately.
The following Figure 12 shows the mean effective power value per building connection for the 3.0 kW HPs and the PrCPs and PuCPs for the two scenarios over the years up to the year 2050. The values are given for the two planning perspectives, namely substation transformer and outgoing feeder.
Since the number of CPs increase drastically up to the year 2050, the demand factor for CPs falls to a saturation value that nearly stays constant for an increasing number of CPs. This leads that the power assumptions for the progressive scenario in the year 2050 are nearly constant for the two planning perspectives (2.5 kW and 2.7 kW, respectively). Whereas, the power values for the conservative scenario in the year 2030 nearly triple depending on the planning perspective (0.3 kW and 0.8 kW, respectively).
In addition, Figure 12 shows that the mean effective power for PrCPs is always higher than the corresponding value for PuCPs, even though the charging power distribution in Table 1 assumes higher charging powers for the PuCPs than the PrCPs. The reason here lies in the higher number of PrCPs compared to PuCPs, since the number of PrCPs is expected to strongly exceed the number of PuCPs in the respective grids. Therefore, the effective power per building connection for PrCPs exceeds the corresponding value for PuCPs.
It is established that HPs exhibit a nearly constant demand factor. Even though the number of HPs out of the perspective of the substation transformer is greater than the number of HPs per outgoing feeder, the power values do not differ much between the two dimensioning perspectives for the respective year and scenario. A similar effect can be seen for PrCPs in the year 2050 for the progressive scenario. For the planning with the 6.5 kW or the 9.0 kW HPs, a factor of 2.2 or 3.0 is to be applied, respectively.
Apart from the power value assumptions for a complete MV grid, the power values per CP are needed when the number of CPs in a certain MV grid is available. The following Figure 13 shows the median values, as well as the arithmetic mean power values per CP for PrCPs and PuCPs for the two development scenarios until the year 2050. The figure shows that the charging power per CP decreases over the years for PrCPs. Since a nearly constant distribution of the charging powers is assumed over the years but with an increasing number of PrCPs, the demand factor decreases, and subsequently the charging power per PrCP. As for the PuCPs, their number also increases, but the distribution of charging powers suddenly jumps to higher charging power classes in the year 2030 to 2040 (see Table 1). Hence, a sudden increase in the charging power per CP is seen for the PuCPs from the year 2030 to 2040, which, in turn, then decreases—as expected—from the year 2040 to 2050.
A summary of the power assumptions is summarized in Table 5 for the different load types. The given values represent the arithmetic mean for each given parameter over the considered time period and two scenarios. In addition to the aforementioned power values for PrCPs, PuCPs, and HPs, the power values for household loads are given. The power values for households do not differentiate between the different household buildings, such as one- or two-family houses and multi-family houses, since this level of granularity is no longer needed in the MV level. No power value assumptions for MV customer load stations are given since their power values differ greatly from one customer type to another. Hence, generally valid power assumptions cannot be deduced.

4.2.2. Second Medium Voltage Planning Guideline

For 10 kV grids, the present standard cable cross-sections of c = 150 mm² or c = 185 mm² (Al) can be maintained. An upgrade with a further standard cable cross-section of c = 300 mm² is recommended.
After modeling the loads with the given power assumptions, the second step in the grid planning is performing reinforcement measures wherever necessary according to the available standard resources.
In the context of this contribution, two planning strategies are applied for planning overloaded cables. In addition, four cable cross-section areas starting from 150 mm² up to 300 mm² of the type NA2XS2Y are considered for the cable measures. The goal is to apply as many possible combinations of cable planning strategies and cable cross-sections as possible to deduce the most suitable standard cable cross-section.
The two planning strategies and the share of each cable cross-section to the total applied cable measures are shown in Figure 14. The first planning strategy (the outer ring in Figure 14) performs a cable replacement when the existing cable insulation material is considered old (such as NAKBA or NKBA) or the cable cross-section area is smaller than 120 mm². This is under the assumption that these aforementioned cable section(s) has a low economic residual value and can be replaced. Otherwise, a cable reinforcement is performed, in which a second cable is laid in parallel to the existing overloaded cable in the same cable trench.
As for the second planning strategy (inner ring in Figure 14), the overloaded cable is directly replaced, disregarding the existing cable insulation type or cross-section area. This strategy simulates the grid planning not only in terms of grid reinforcement but also in terms of grid expansion and strengthening.
Figure 14 shows that the most used cable cross-section for the first planning technique is 150 mm². However, the so far applied standard cable cross-section of 150 mm² (or 185 mm²) is not sufficient for all the cable measures, and laying larger cable cross-sections is required. In addition, by applying the second cable technique, the share of the cable measures with the so far standard cable cross-sections (150 mm² and 185 mm²) decrease, and larger cable cross-sections become necessary.
Therefore, with the planning strategy of cable reinforcement for the existing cable, the current standard cable cross-sections (be it 150 mm² or 185 mm²) can still be applied. Furthermore, it is recommended to extend the standard cable cross-sections with a larger cross-section, namely 300 mm².

4.2.3. Third Medium Voltage Planning Guideline

The dimensioning of substation transformers is to follow the load assumptions from the first planning guideline, as a standard transformer size cannot be deduced due to the heterogeneous load development per substation grid area.
The next step for grid planning is to reinforce the substation transformer(s) if necessary. Firstly, the total load in the MV level is to be determined. The following Figure 15 shows the load development for nine MV grids. It must be pointed out that the two MV grids, G06 and G07, are excluded from this analysis, as both of them represent a single MV ring and not a complete grid area. Figure 15 demonstrates that the load development varies significantly from one grid to another depending on the specific grid parameters. For instance, the load development for G01 exceeds 200% at the progressive scenario for the year 2050 whereas the load development for G05 does not exceed 50% for the same year. This reflects the heterogeneous nature of MV grids since they can vary greatly in terms of connected loads and grid parameters.
Furthermore, Figure 16 displays the loading of the substation transformers for the considered nine MV grids for the year 2050. Firstly, it can be seen that the installed transformers have different sizes depending on the grid area. The substation installed capacity ranges from 2 × 12.5 MVA to 3 × 40 MVA, thus making it unfeasible to deduce a current standard transformer size.
Therefore, it is recommended to analyze each MV grid individually. Using the power value assumptions supplied in the first PG, the expected load development can be calculated. Afterward, the required transformer size can be determined.

4.2.4. Fourth Medium Voltage Planning Guideline

When the measurement, information, and communication technology in the medium voltage and the low voltage grids must be fully constructed, the conventional grid expansion is, in most cases, less expensive than a load management system and is recommended. If the measurement, information, and communication technology is available and can be used by the load management system, then the load management system becomes significantly cost-efficient and is recommended.
Since the electromobility and the HP loads are more flexible in terms of turn-on and shut-off times with a minimum impact on consumer comfort, LM has a big potential in the upcoming years to successfully integrate these new loads into the grids. As already shown in Figure 9, LM can either reduce or postpone the required cable measures over the years. However, contrary to the expectations, the usage of LM is not economical in all the investigated cases. As mentioned in Section 3.2.2, the application of LM requires a MICT to monitor the grid state and regulate the loads accordingly. Since MICT is still not integrated into most of the MV grids, the total cost of planning with MICT is strongly dependent on the costs required to implement MICT into the grids.
The costs for the six LM layouts are calculated for the three LM variants and demonstrated in Figure 17. The figure shows the costs for the conventional planning strategy along with the costs for the LM with the six layouts and the three LM variants. It can be seen that for LM-V1 (0) and LM-V2 (0), the total cost for planning is significantly lower than the costs for conventional planning. Whereas, when the costs for MICT need to be considered in the cases of LM-V1 (MV+LV), LM-V2 (MV+LV), and LM-V3 (MV+LV), the conventional planning becomes more economical than the LM.
For analyzing the results per planning variant, Figure 18 shows the saving potential of the three LM variants with the six LM layouts in comparison to the conventional planning represented by the 0% line. Since each of the LM layouts assumes a certain degree of spread of MICT, the figure demonstrates the effect of these various degrees in terms of savings potential. It shows that when the MICT already exists in the grids and that the LM can use this existing infrastructure with no additional costs (represented by the layout “(0)”), then the planning strategy with LM becomes cost-efficient in comparison to conventional planning. However, for the MICT layout (MV+LV), the potential savings drops rapidly so that, in most cases, it becomes economical to apply a conventional planning strategy.
Moreover, Figure 18 demonstrates the effectiveness of the different LM regulation principles. It becomes clear that the regulation of PrCPs is more beneficial than the regulation of PuCPs. In addition, the HPs should be regulated if it is possible, as this can significantly reduce the necessary grid planning measures.

4.2.5. Fifth Medium Voltage Planning Guideline

Using conventional planning measures for 10 kV grids, a cable reinforcement of around 20% in suburban grids, 10% in semi-dense urban grids, and less than 10% in downtown grids is expected in relation to the total cable length of the grid.
With the rapid development of electromobility and HPs, the DSOs face a growing fear that the complete grid area will need to be reinforced. As the reinforcement of the complete grid area is very costly and exhausting, it is important to determine the required grid measures in advance so that the available capital is properly allocated.
The following Figure 19 shows the required share of cable measures in relation to the total grid cable length for the two development scenarios and the three HP models. The figure shows that the share of cable measures in suburban regions is around 20% which is represented by the grids G01 and G02. This share decreases for semi-dense urban grids down to around 10%, represented by the grids G09, G10, and G11. As for downtown grids, the expected share of cable measures drops to less than 10%, as shown in the grids G03, G05, and G08. The decline of expected cable measures from the outskirts going toward the city center relies on the fact that the integration of electromobility and HPs occurs mainly in suburban areas. Furthermore, it is important to consider the current cable loading, as the share of cable measures depends strongly on it. It is to be noted that the grids G04, G06, and G07 are excluded from this PG. The grid G04 is a 20 kV grid, for which the above-mentioned share of cable measures does not apply. The two grids, G06 and G07, are MV rings that do not represent a complete grid area and therefore are also excluded from this PG.

4.2.6. Sixth Medium Voltage Planning Guideline

Grid reinforcements are hardly expected in 20 kV grids, as they are significantly steady for the integration of new loads in comparison to 10 kV grids.
As seen in the previous analysis and what is concretely shown in Figure 20, is that no cable overloads happen in the 20 kV grids, while there is a significant share of overloaded cables in the 10 kV grids.
This becomes especially clear in the grids G08, G10, and G11, as these grids have both voltage levels (10 kV and 20 kV) in the same grid area. The three winding transformers of these three grids transform the voltage from 110 kV to 20 kV and from 110 kV to 10 kV. Thus, two separate grids with these two voltage levels (20 kV and 10 kV) supply the same city area. As the spread of electromobility and HPs is strongly dependent on the socio-economical structure and the building structure of the city area, it can be determined that the development of CPs and HPs in these three grids is identical. Furthermore, the current cable loading for the two voltage levels in these grids is nearly equal. By integrating the CPs and HPs in these grids, it is seen that overloads occur in the 10 kV in contrast to the 20 kV, where no overloads occur.
Obviously, while supplying the same load, the current decreases with increasing the voltage level. Thus, 20 kV grids can easily take up new loads into the grid without risking an overload.

4.2.7. Seventh Medium Voltage Planning Guideline

The allowed voltage range in the medium voltage grids is not fully utilized in most cases. Therefore, it is recommended to check the voltage range division between medium and low voltage grids in the grid planning and to modify it, if necessary.
Considering the voltage range division in Section 3.1.2 and the recommendations for cross-voltage level planning, the actual required voltage level in the MV level is investigated. Figure 21 displays the actual required voltage in the analyzed MV grids for the two scenarios, the three HP models, and the three planning years. The figure shows the maximum voltage drop calculated as the difference between V at the slack node and the minimum node voltage in the grid. On the other hand, the maximum voltage saving is shown, which represents the voltage range that can be shifted for the LV grid planning.
Figure 21 shows that the complete voltage range (4% V/Vn) is not utilized in any of the cases. In the year 2030, approximately half of the voltage range is needed. In the years afterward, the required voltage in the MV level increases gradually. This proves that the initially set voltage range between MV and LV grids is actually not needed at the MV level. Depending on the planning criteria in the LV level, a new voltage division between the two voltage levels is beneficial to avoid over-dimensioning the equipment in expectation of a voltage level violation that does not occur.

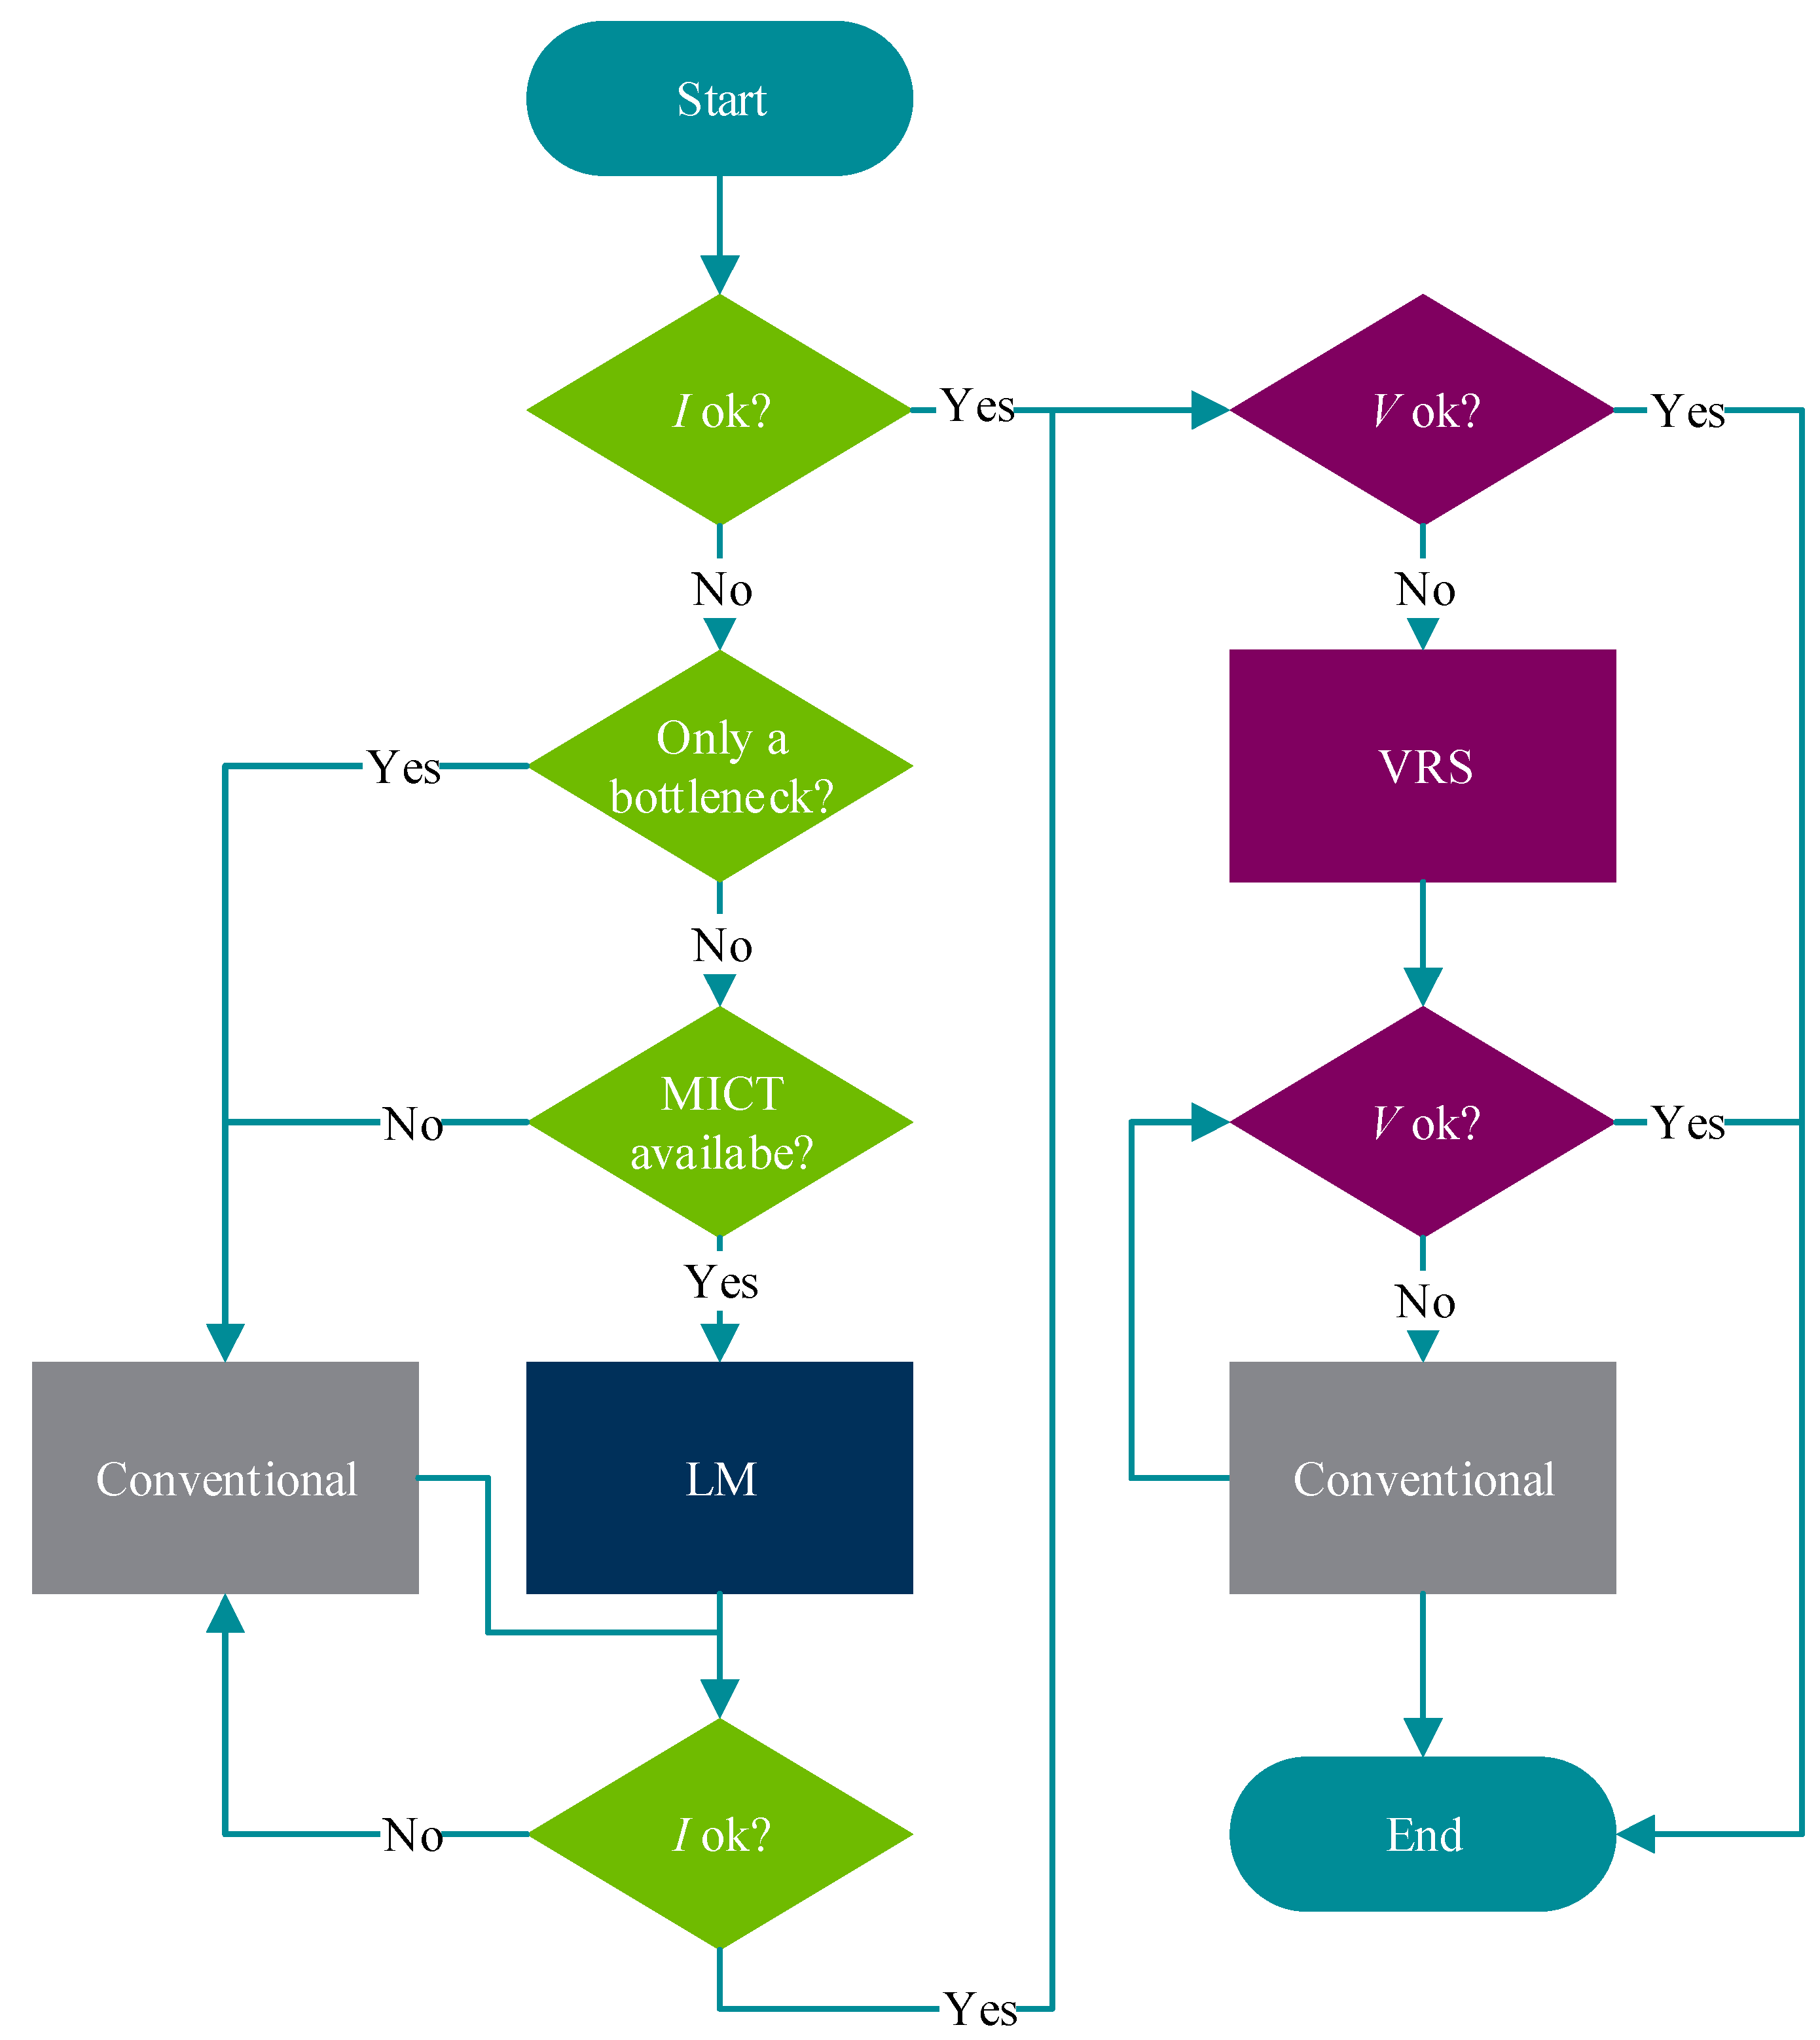
4.3. Decision Path for Medium Voltage Grid Planning

To summarize the aforementioned PGs, a flowchart for planning MV grids is shown in Figure 22. The process starts with checking the loading of the equipment before it checks the node voltages since voltage violations are not to be expected. If the overloaded element is simply a bottleneck meaning a short cable section and not grid-wide, conventional measures are recommended. However, if the overloaded cables are grid-wide or the substation transformer is overloaded, a further check for MICT should be performed. The fourth PG proves that in case the MICT is available, the LM is cheaper than conventional planning. However, if the MICT is not already available, conventional measures are directly recommended. When the overloads are remedied, the node voltages are checked. In case a voltage violation occurs, the nominal voltage value at the substation busbar is adjusted using voltage regulation at the substation transformer (abbreviated as VRS). If the voltage violation persists, conventional measures are recommended until the violation is remedied.

4.4. Across Voltage Level Planning Guidelines

In extension to the aforementioned MV PGs, across voltage PGs are deduced with the help of results for the LV and high voltage levels. The across voltage PGs take into consideration that synergy effects between the voltage levels reduce the collectively required grid reinforcements irrespective of the corresponding voltage level [59].

4.4.1. First across Voltage Planning Guideline

Across voltage planning of the high, medium, and low voltage levels should be performed.
As shown in the seventh MV PG in Section 4.2.7, the originally set voltage range for the MV level is not fully utilized and a re-investigation of the voltage range is recommended. Furthermore, since the penetration of new loads primarily takes place at the LV level, the proposed LM and RPM for the MV level operate by accessing these loads at the LV level. By implementing such innovative technologies to benefit the MV level, a beneficial secondary effect can be aimed for, which is the reduction in the required reinforcement measures not only at the LV level but also at the high voltage level. Additional synergy effects can be aimed for while performing across voltage planning.

4.4.2. Second across Voltage Planning Guideline

Contrary to the voltage limit violations, the equipment overload is the main reason for grid reinforcement measures.
The results shown in this contribution demonstrate that the integration of the new loads leads to more severe equipment overloads rather than voltage limit violations. This is displayed for the MV level in Figure 21 and for the LV level in [63]. Thus, it is recommended that DSOs work on increasing the ampacity of their existing equipment. The newly installed equipment should have a higher nominal power than the so far used equipment to accommodate the increasing load demand. Moreover, the investments in voltage regulation measures (such as voltage controllers) can be reduced.

4.4.3. Third across Voltage Planning Guideline

Innovative planning strategies represent an economical solution in specific grids. For the remaining grids, conventional planning strategies are recommended.
Referring to the fourth MV PG in Section 4.2.4 and the previous across voltage level PG, it becomes clear that the challenges facing the MV grids are load-oriented. The three proposed LM variants have proven to be effective in remedying the expected equipment overloads, however, they cannot remedy all equipment overloads so cable measures are still needed. In addition, the economic efficiency of these LM variants depends strongly on the extent of the needed MICT infrastructure. These two factors combined conclude that innovative technologies such as LM are effective both technically and economically under specific conditions and for certain MV grids. For the remaining collectivity of MV grids, the conventional planning strategy has proven to still be an efficient grid planning strategy.

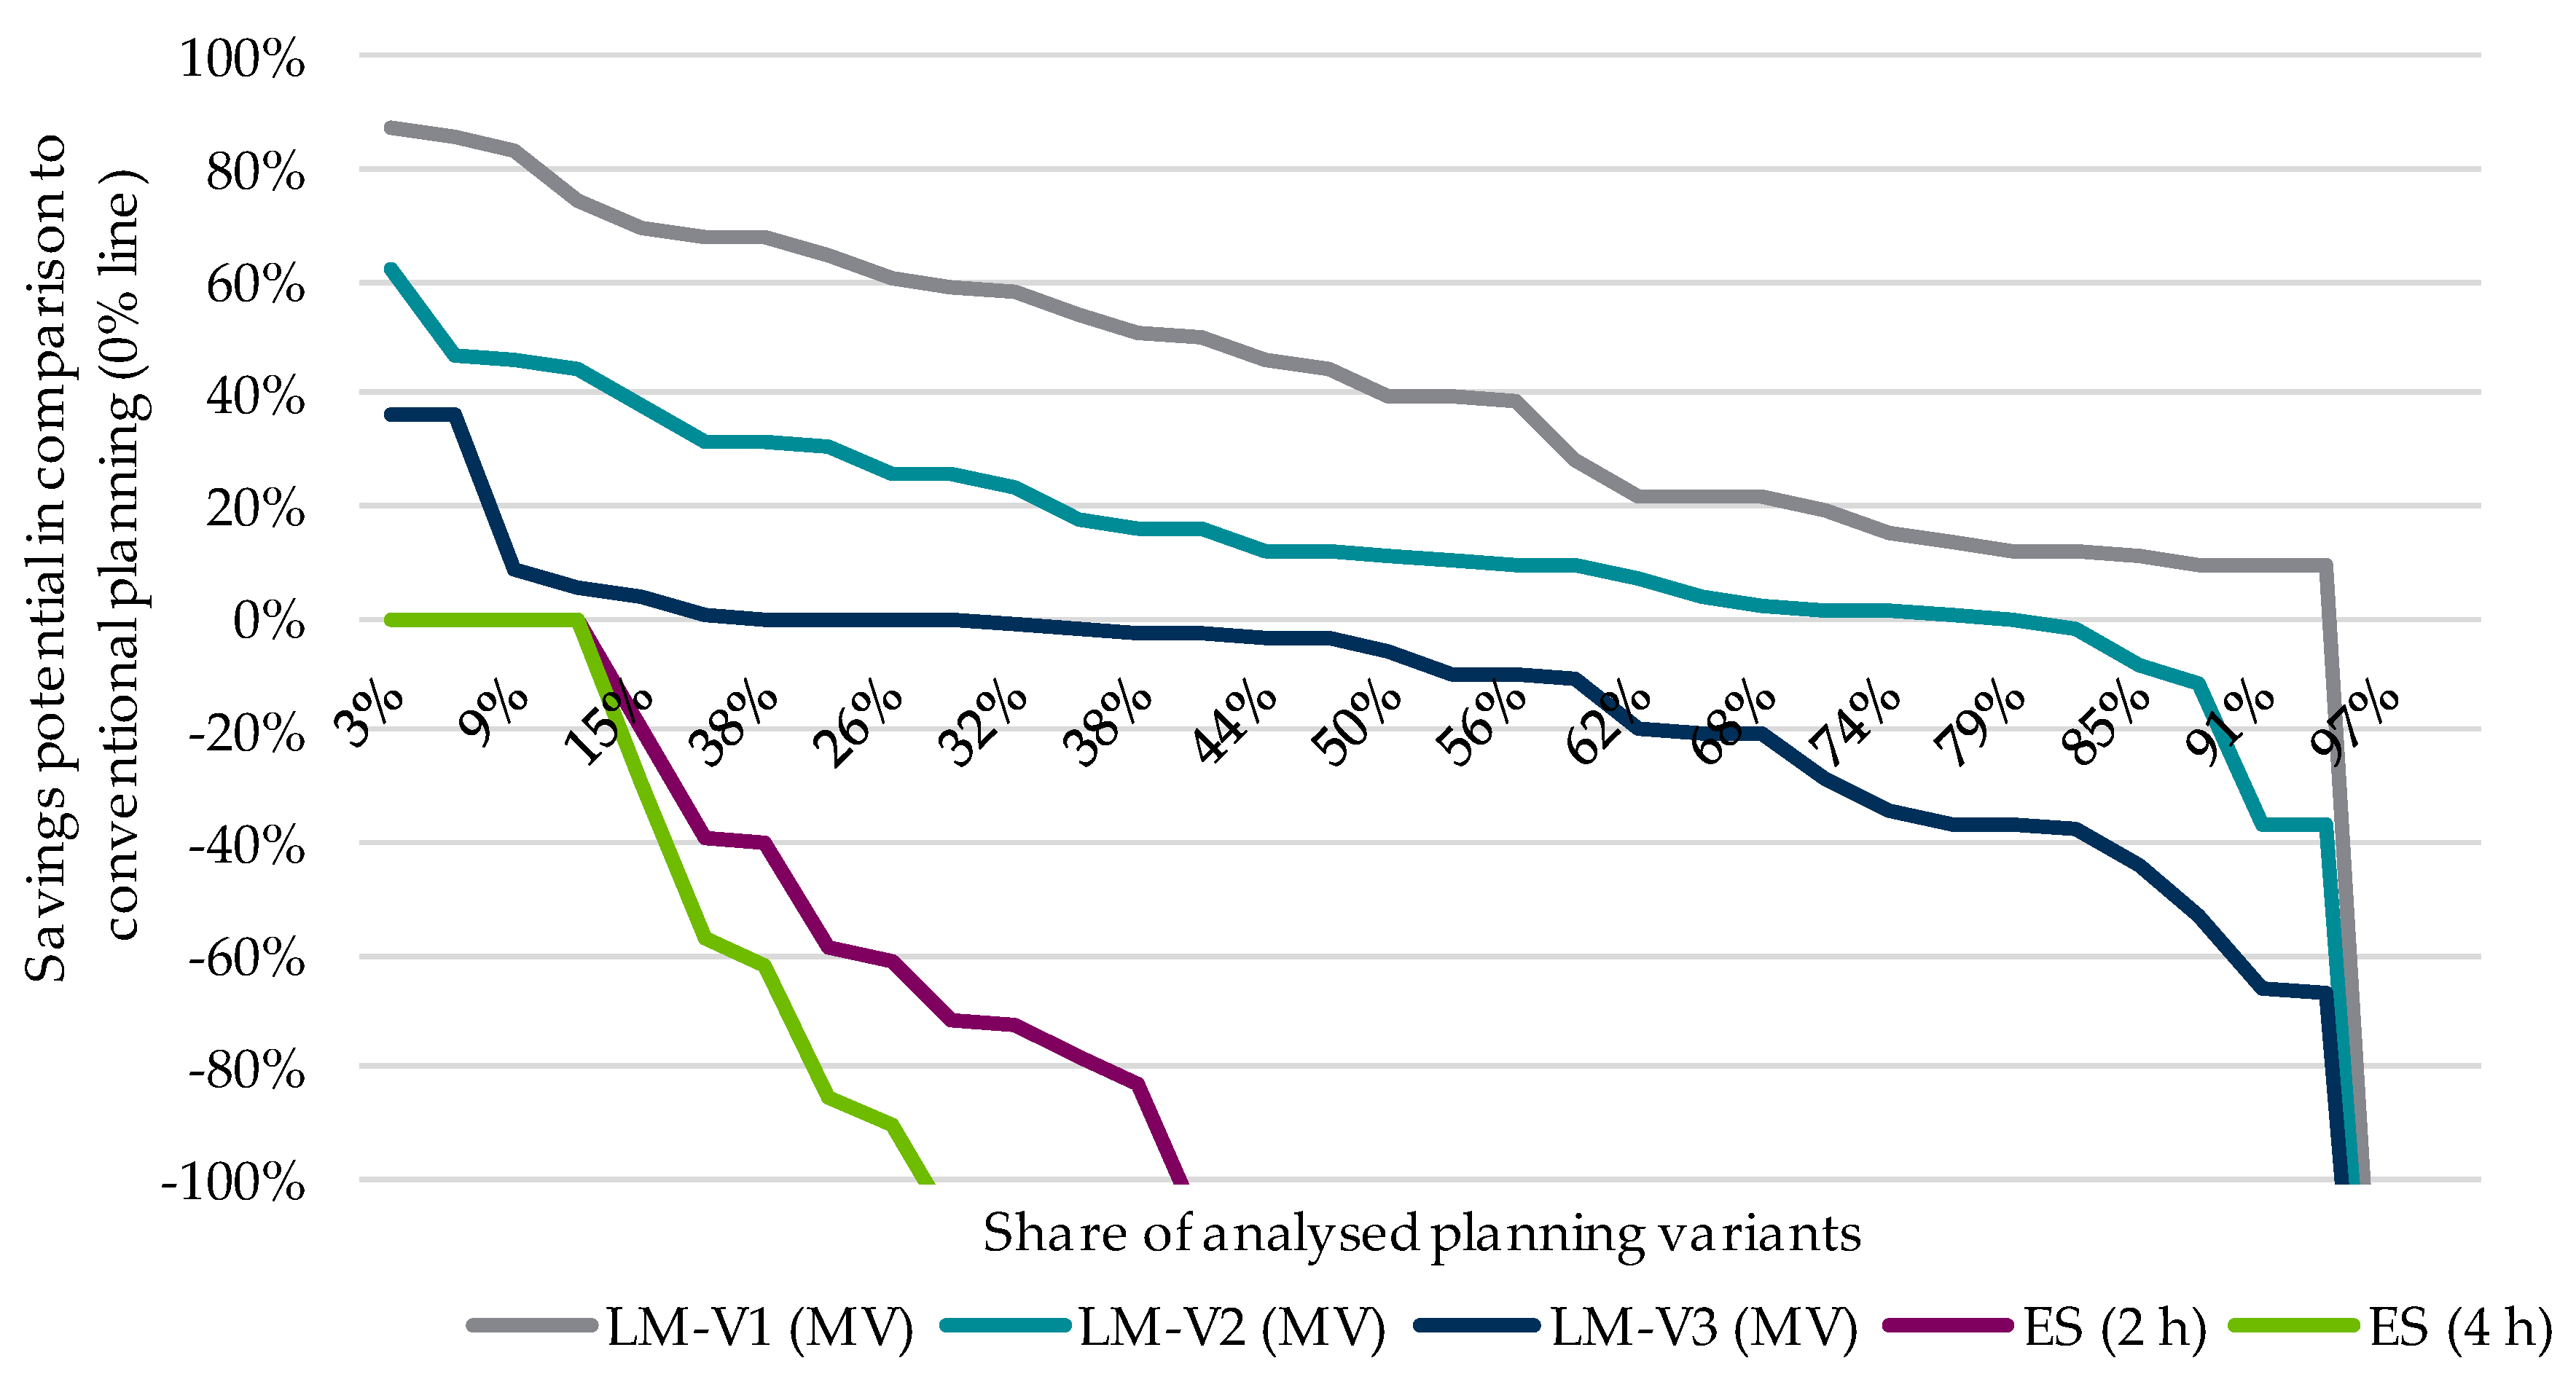
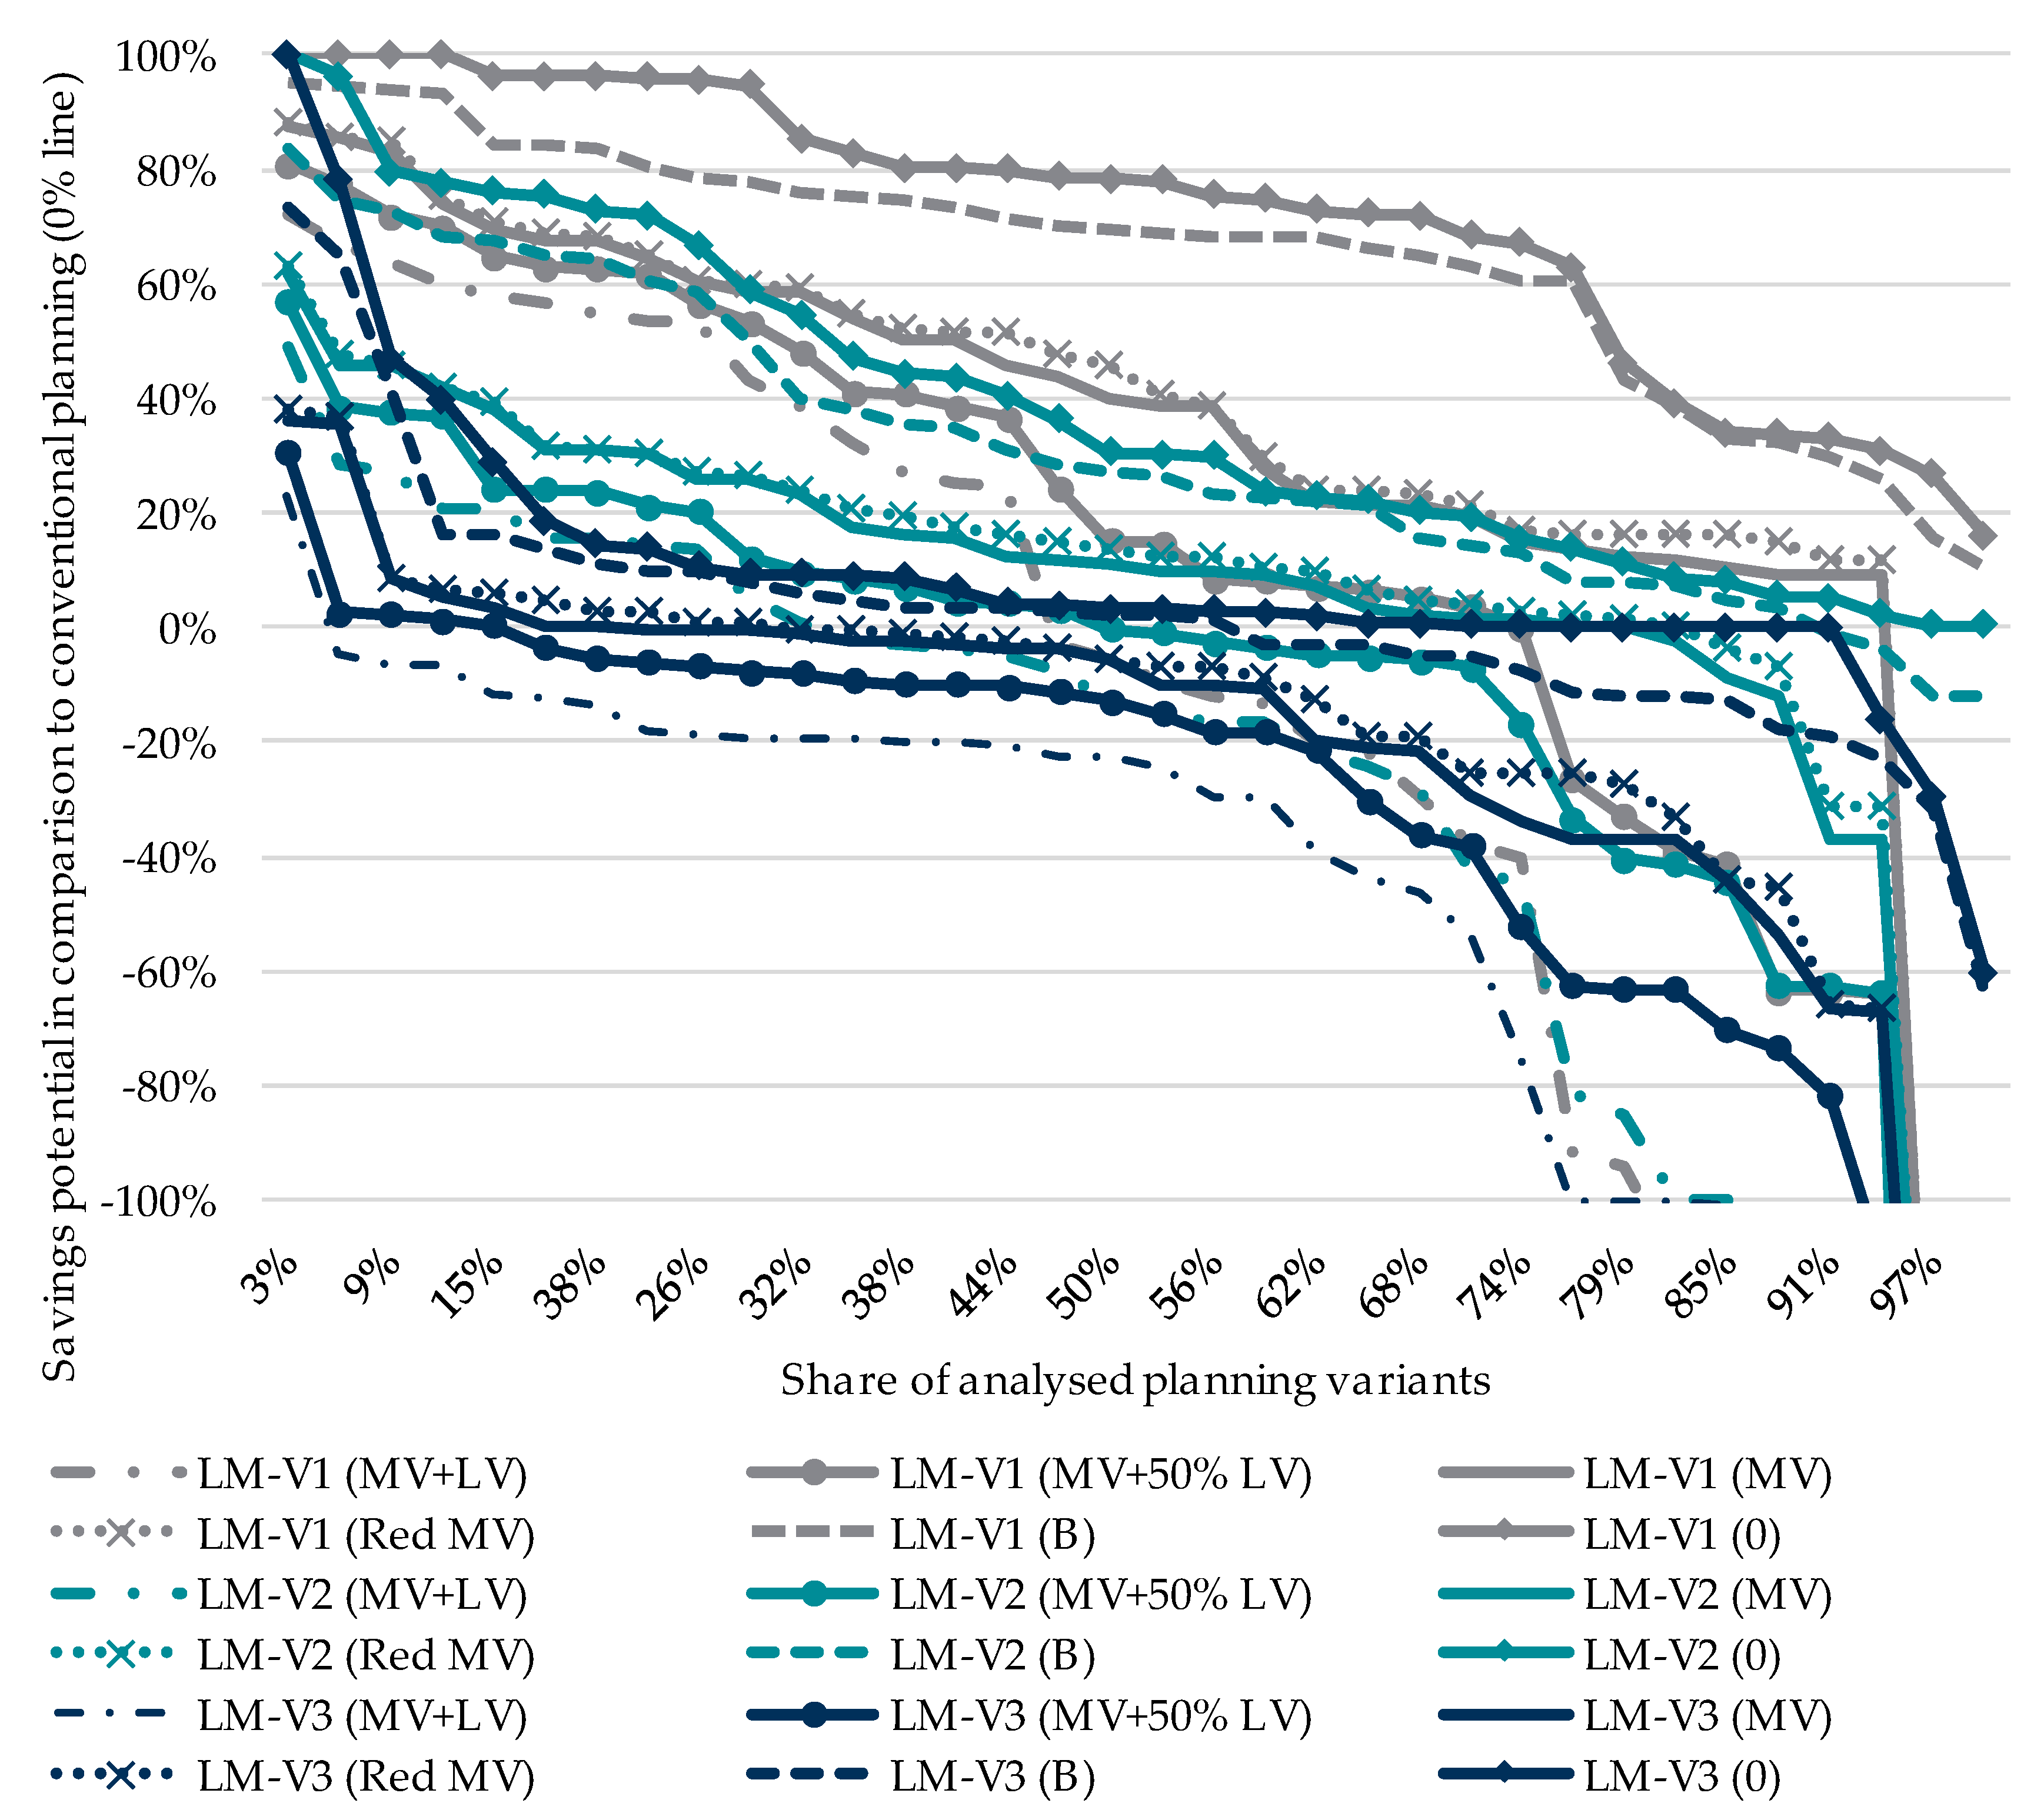
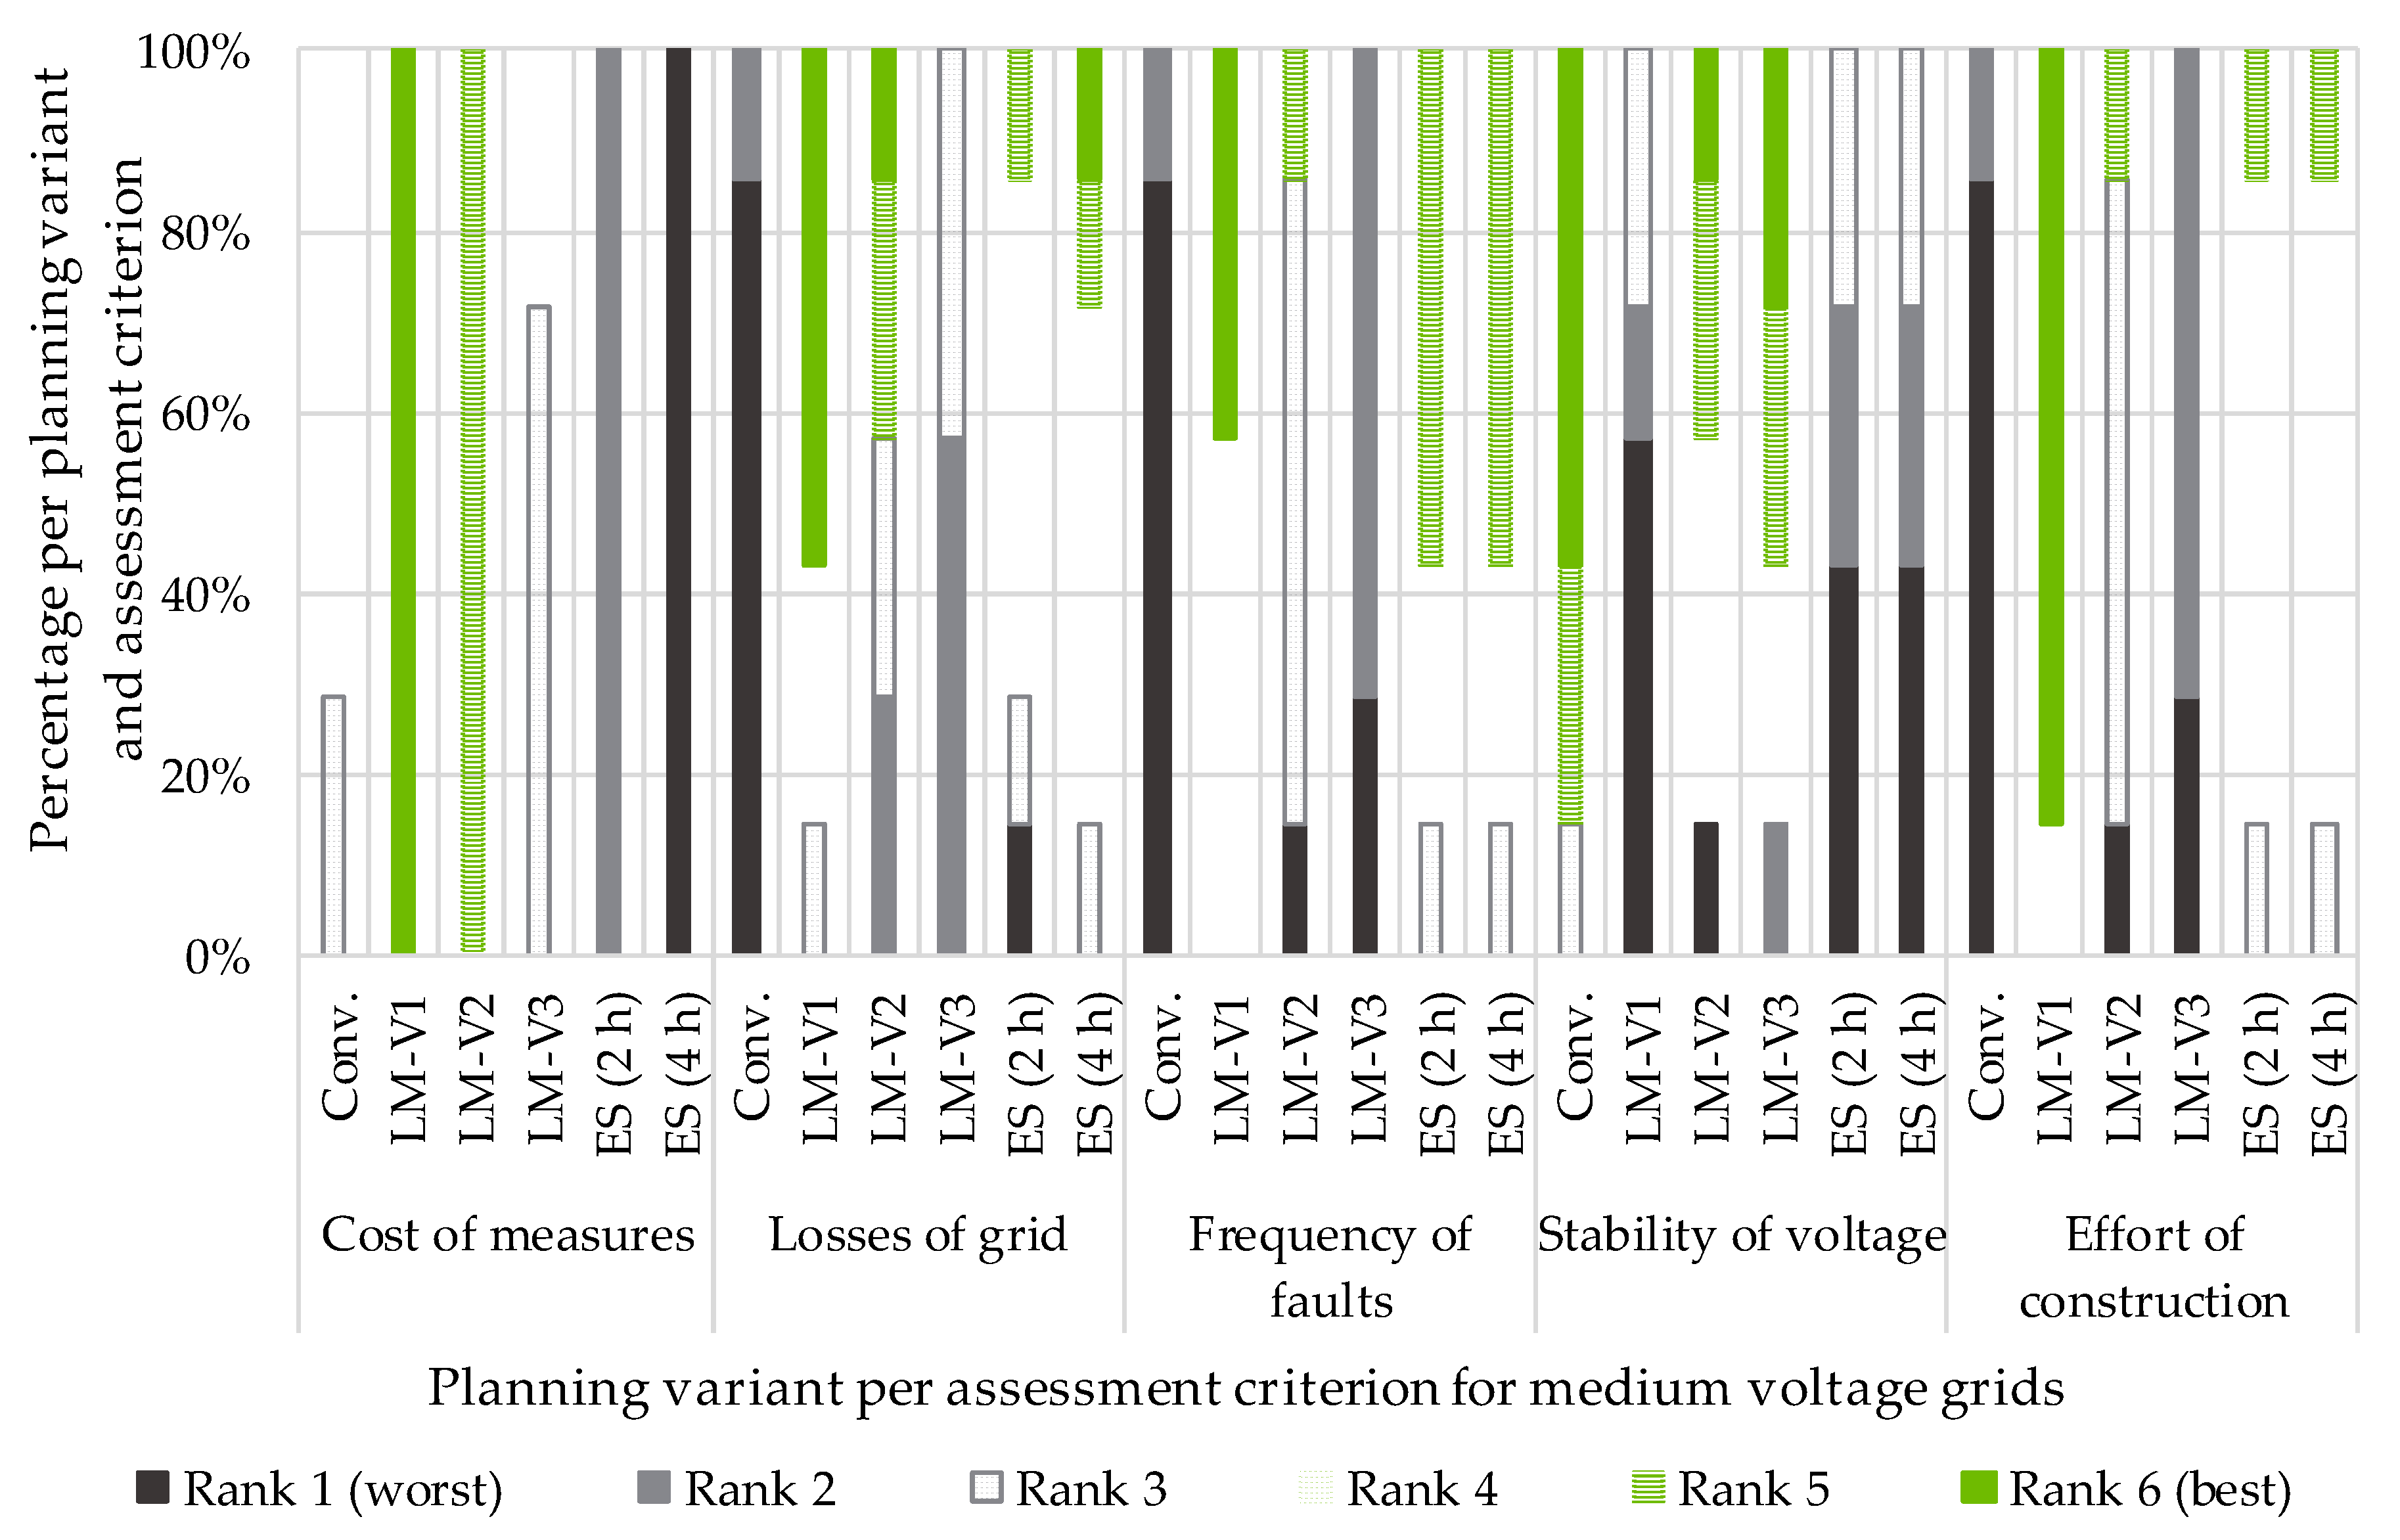
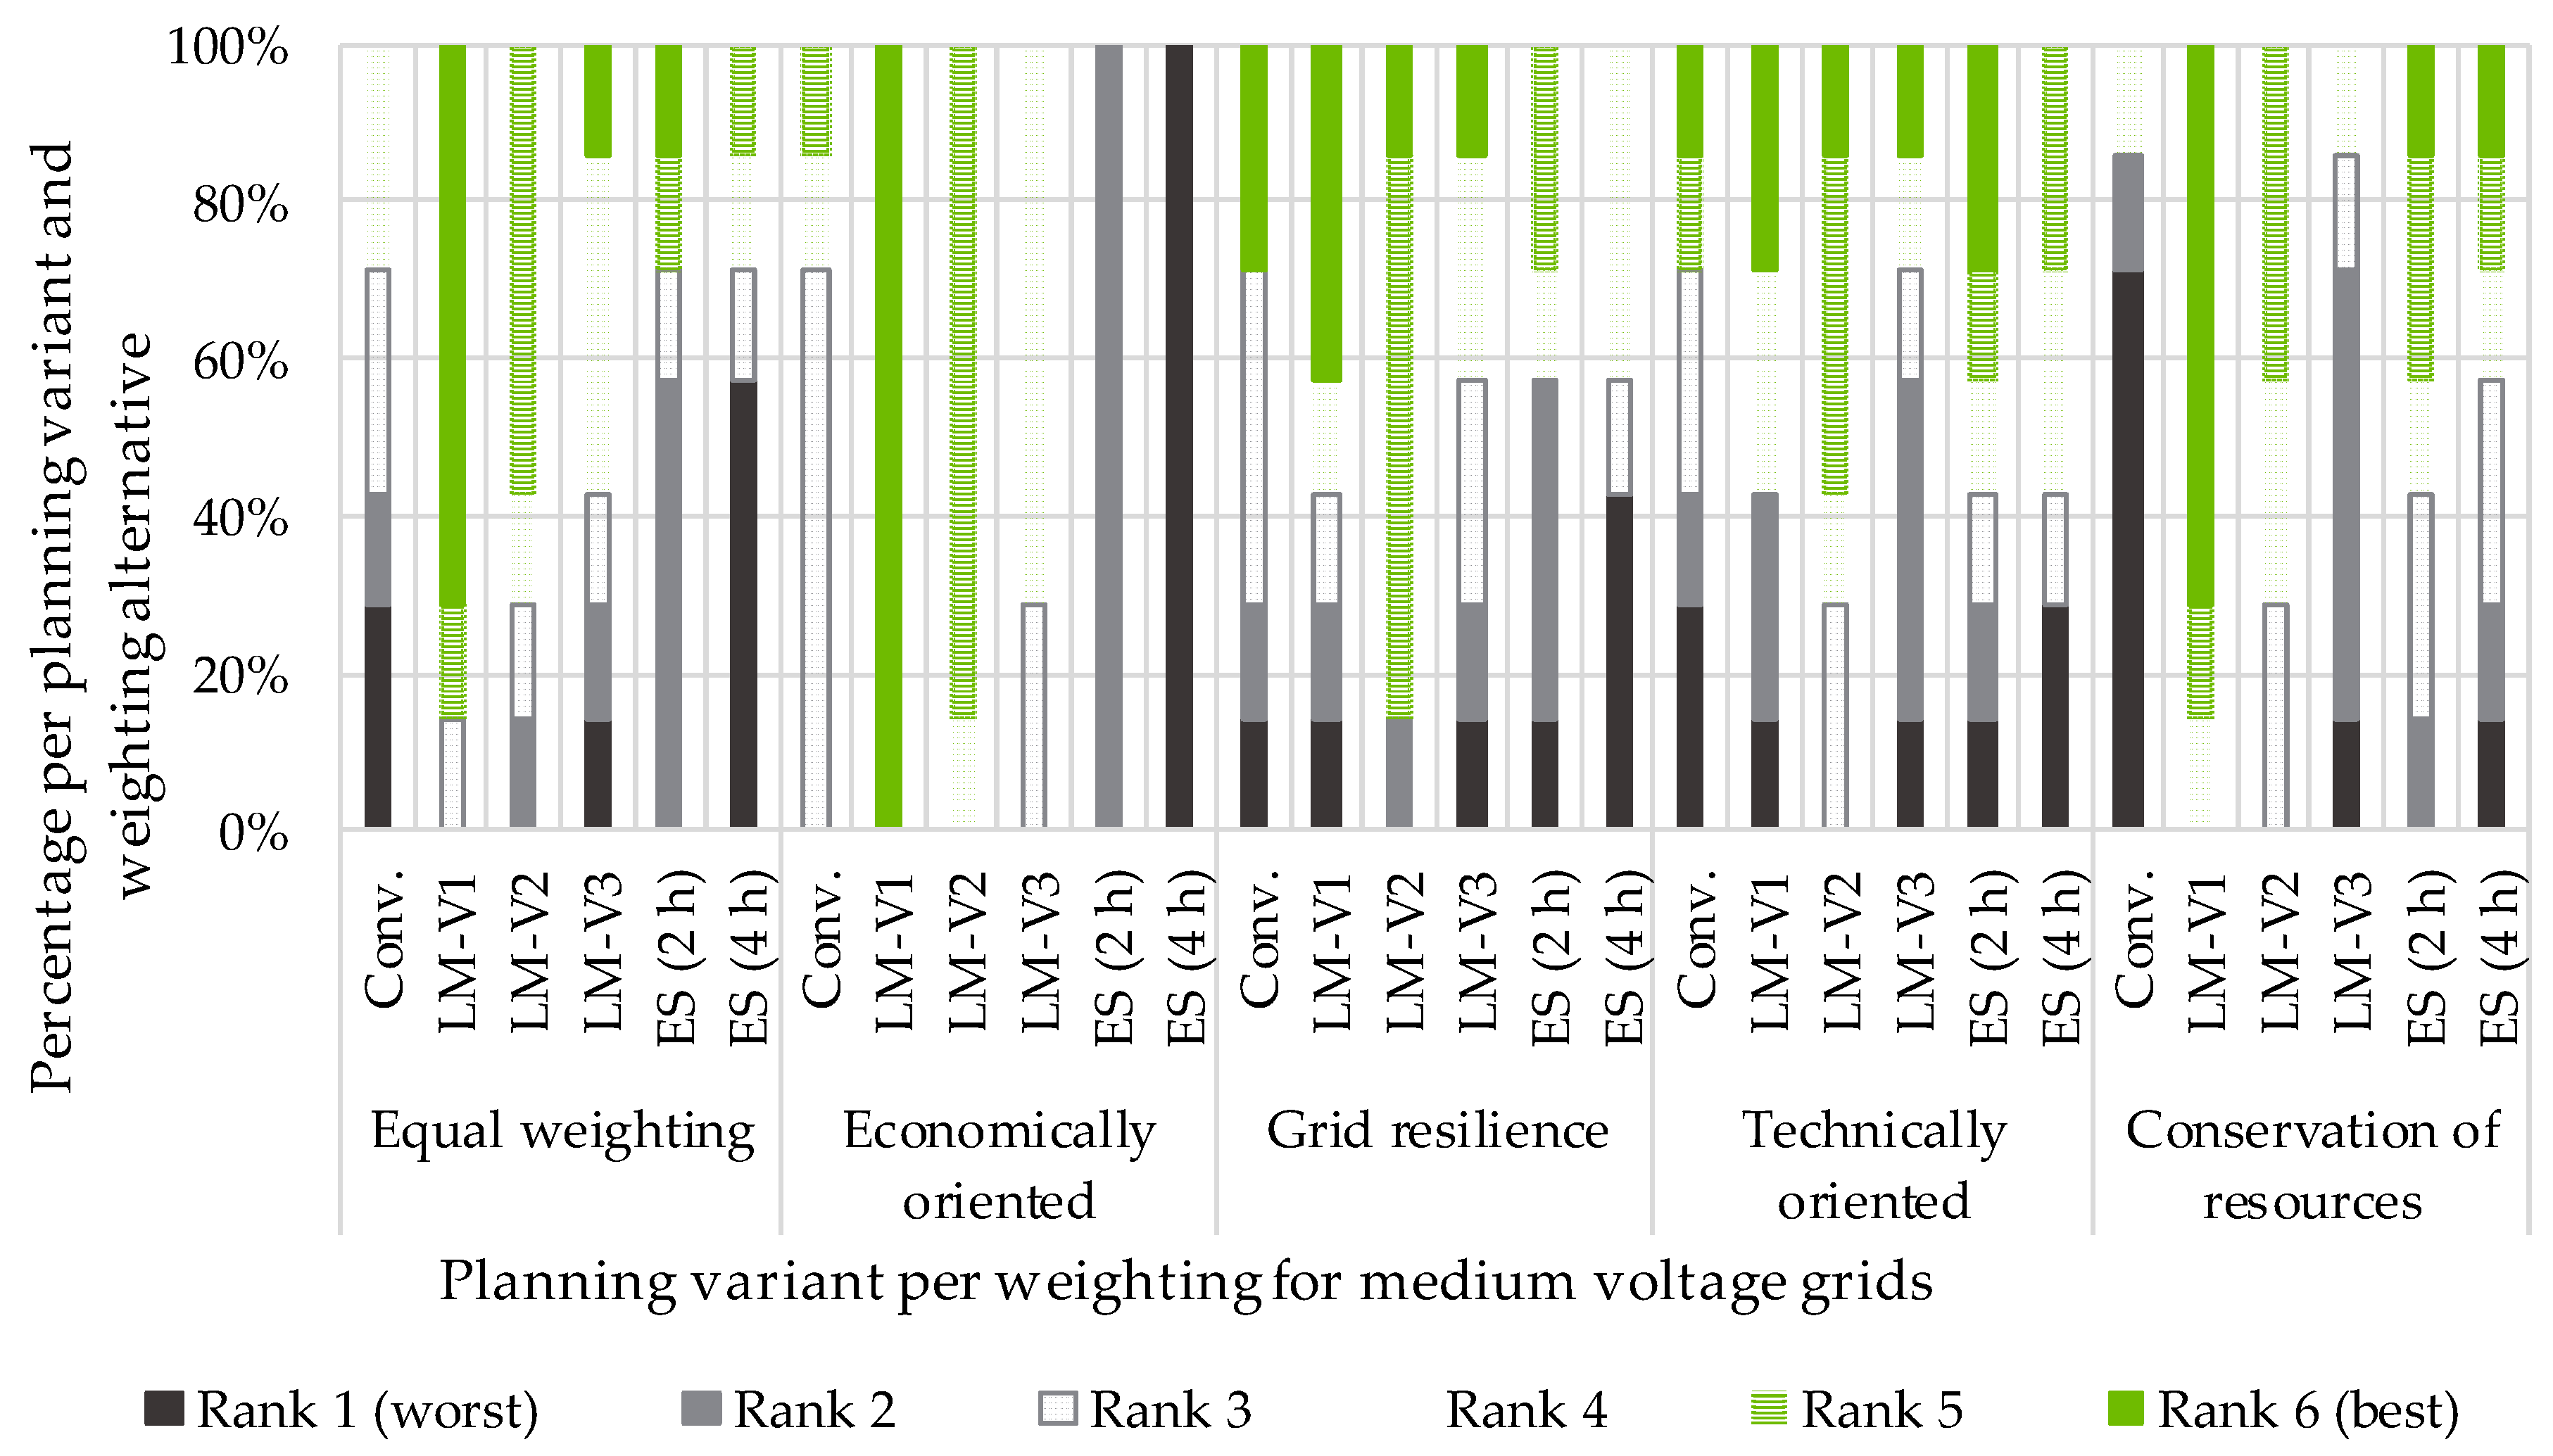
4.5. Results for the Application of an Alternative Assessment Model

In addition to the performed cost calculation to determine the attractiveness of the different planning variants, an alternative model is developed to assess the planning variants. The model considers not only the costs of the planning measures but also four further technical and non-technical criteria. The four further criteria and their method of calculation are as follows:
  • Losses of the power grid: This criterion calculates the yearly energy losses in the power grid, hence representing energy costs that are paid by the DSO;
  • Frequency of faults: This criterion calculates the frequency of equipment faults in the grid. Thus, it roughly depicts the amount of maintenance work that needs to be performed by the DSO;
  • Stability of voltage: This criterion calculates the difference between the slack node voltage and the minimum node voltage in the grid. It shows how much voltage drop occurs in the grid and in turn how stable is the voltage level against unexpected voltage drops;
  • Effort of construction: Since the performance of construction works constitutes an inconvenience for the residents and the users of the grid, this criterion is based on the required cable construction works per planning variant [62].
Figure 23 shows the consolidated ranking for the six planning variants over all investigated MV grids for each of the aforementioned assessment criteria. The LM results shown here are for the layout (MV). It becomes clear that by assessing different grid planning criteria, the planning variants can have different attractiveness. For instance, according to the “Cost of measures”, the planning variant ES (4) has the worst ranking followed by ES (2 h). However, when the “Losses of the power grid” or “Frequency of faults” are considered, these planning variants increase in ranking.
Moreover, five weighting alternatives are developed to investigate the combination of the five aforementioned assessment criteria. The proposed weighting alternatives are: equal weighting, economically oriented, grid resilience, technically oriented and conservation of resources. These represent the different planning goals that can be aimed for by the DSO so as not to focus on only one of the assessment criteria but to consider the five assessment criteria collectively. According to the importance of each of the assessment criteria, the DSO can give a criterion a different weighting in the total score. The assumed individual specific weights for the weighting alternatives are listed in Table 6 [62].
Figure 24 shows the results for the five weighting alternatives for the investigated MV grids. It is to be mentioned that in continuance with the previously shown results in Figure 23, the LM results here are for the layout (MV). The planning variants, here again, differ in attractiveness according to the applied weighting alternative. For instance, if a DSO is economically oriented in the context of the grid planning, then they would tend to the variant LM-V1. However, if the DSO considers the grid resilience as a decisive factor for grid planning, they may move toward applying LM-V2.

5. Conclusions

This contribution provides a detailed explanation for the consideration of electromobility and HPs in the planning of urban MV grids. It started with an overview of their expected development scenarios and their regionalization into the specific grids. Subsequently, the contribution discussed their expected nominal power and their calculated actual power demand. In addition, the methodology of the performed grid planning was briefly stated. The methodology presented the identified grid limits and the applied planning strategies. Based on the planning, a technical and economic assessment of the resulting planning variants was performed. As a result, seven PGs were deduced, which recommend measures to be performed by the DSO. The complete planning process was finally summarized in a presented decision path.
The PGs represent a handy toolbox for the DSOs while planning their grids. They start with the power assumptions for the different loads, continue with standard dimensions for the equipment and show the feasibility of LM. The last three PGs give general expectations in regard to planning urban MV grids.
The results show that there is no way around conventional grid reinforcement such as cable reinforcement. The application of innovative technologies cannot solely resolve all the anticipated grid limit violations. A further main factor in successfully integrating the new loads into the grid is the construction of MICT. In most cases in which MICT is available in the grids, the deployment of LM in combination with cable measures is economical more than solely laying cables.
By proposing additional assessment criteria to the cost of equipment, the planning variants vary strongly in the final assessment. As the different assessment criteria focus on different aspects of grid planning, it becomes difficult to deduce a single optimum planning strategy. The consideration of five varying weighting alternatives widens the range of decisions even more. The combination of the five assessment criteria with the five proposed weighting alternatives offers the DSO a wide range of options for grid planning.
A study of the integration of photovoltaics in urban grids is recommended. As the grid reinforcement can be driven not only by the increasing load but also by the increasing decentralized generation, the opposing effect of increasing generation needs to be investigated in further work.

Author Contributions

Conceptualization, S.A., P.W., J.M. and B.G.; methodology, S.A. and P.W.; validation, M.Z. and A.S.; formal analysis, J.M.; resources, M.Z.; data curation, P.W. and S.A.; writing—original draft preparation, S.A.; writing—review and editing, P.W. and J.M.; supervision, M.Z.; project administration, M.Z.; funding acquisition, M.Z. All authors have read and agreed to the published version of the manuscript.

Funding

This research is a result of the project “PuBStadt” which was funded by the German Federal Ministry for Economic Affairs and Climate Action following the decision of the “German Bundestag, grant number 0350038A”. Electricity 03 00026 i001

Institutional Review Board Statement

Not applicable.

Informed Consent Statement

Not applicable.

Data Availability Statement

Not applicable.

Acknowledgments

The used data were provided by the six German DSOs: Stromnetz Berlin GmbH, Stuttgart Netze GmbH, Rheinische NETZGesellschaft mbH, SachsenNetze GmbH, Enercity Netz GmbH and Erlangener Stadtwerke AG.

Conflicts of Interest

The authors declare no conflict of interest.

Abbreviations

CapExCapital Expenditures
cons Conservative
CP Charging point
DAS Decentralized automation system
DSO Distribution System Operator
ES Energy storage
HP Heat pump
LM Load management
LV Low voltage
MICT Measuring, information, and communication technology
MV Medium voltage
OpEx Operational Expenditures
PG Planning guideline
PrCP Private charging point
prog Progressive
PuCP Public charging point
RPM Reactive power management

Appendix A

Table A1. Grid structure parameters of the investigated grids (values of the charging points and heat pumps for each grid: the first row is the conservative scenario, the second row is the progressive scenario, where the first column is the year 2030, the second column is the year 2040 and the third column is the year 2050).
Grid
Voltage Level
Installed Transformer Power (MVA)Total Cable Length (km)No. of Distribution/
Customer Stations
No. of Building
Connections
No. of
Metering Points
No. of FeedersNo. of Charging PointsNo. of Heat Pumps
G01
10 kV
2 × 12.5 40.9 44/11 3095 8797 6 1194 2175 3834 144 178 253
1913 4072 8433 182 344 544
G02
10 kV
2 × 40 40.0 37/18 4041 15,982 14 1637 3343 6028 186 229 323
2726 6319 12,014 235 444 708
G03
10 kV
32 16.6 41/3 484 4139 13 195 399 773 20 24 40
324 758 1673 25 54 83
G04
20 kV
3 × 40 70.9 39/24 1815 6728 9 737 1512 2905 84 103 147
1226 2849 6280 107 201 320
G05
10 kV
40 16.9 22/16 504 4221 16 203 420 803 24 29 41
340 791 1745 29 55 87
G06
10 kV
- 4.6 7/- 182 2142 2 63 119 210 7 8 14
98 231 483 14 21 35
G07
10 kV
- 17.0 9/- 2034 2601 2 657 1287 2385 90 117 162
1125 2529 5409 117 225 360
G08
10/20 kV
2 × 63 183.4 170/62 5312 37,802 32 2156 4415 8517 240 298 425
3623 8341 17,557 305 588 935
G09
10 kV
40 44.9 59/3 2663 14,400 15 1076 2070 3500 122 147 212
1804 3707 7461 154 295 471
G10
10/20 kV
2 × 63 134.8 131/46 4619 48,424 26 1869 3854 7398 213 265 374
3135 7229 15,961 275 517 816
G11
10/20 kV
2 × 63 174.9 171/66 6546 54,478 23 2686 5522 10,646 297 368 526
4482 10,396 20,804 375 721 1151
Table A2. Classification of the investigated grids in terms of the building and urban structure (X = high share, O = low share, - = negligible or not present).
StructureG01G02G03G04G05G06G07G08G09G10G11
One/Two-
family houses
X X - X - - X - - - -
Multi-family
houses
O X X O X X - X X X X
Industrial - O O X O - - X O O O
Suburban X X X X
Semi-dense urban X X X X
Downtown X X X
Table A3. Assumed costs for the applied medium voltage equipment.
EquipmentParameterValueUnit
3-phase NA2XS2Y Cable
10/20 kV
Service life 45 [a]
Operational costs 2.5 [% CapEx/a]
Price increase 0.5 [%/a]
150 mm² single Cable cost + installation 225,000 [Euro/km]
150 mm² parallel Cable cost + installation +50,000 [Euro/km]
185 mm² single Cable cost + installation 237,500 [Euro/km]
185 mm² parallel Cable cost + installation +65,000 [Euro/km]
240 mm² single Cable cost + installation 250,000 [Euro/km]
240 mm² parallel Cable cost + installation +80,000 [Euro/km]
300 mm² single Cable cost + installation 275,000 [Euro/km]
300 mm² parallel Cable cost + installation +95,000 [Euro/km]
Energy storage Service life 16 [a]
Operational costs 2.5 [% CapEx/a]
Basic cost 46,000 [Euro/unit]
Power cost for 2 h capacity 550 [Euro/kW]
Decentralized automation Service life 15 [a]
Operational costs 2.5 [% CapEx/a]
Basic cost 15,000 [Euro/unit]
MV-sensor 8000 [Euro/unit]
LV-sensor 3500 [Euro/unit]
HV/MV substation
components
Service life 40 [a]
Operational costs 2.5 [% CapEx/a]
New construction 1,500,000 [Euro/unit]
GIS switchgear 70,000 [Euro/unit]
AIS switchgear 60,000 [Euro/unit]
Disconnector 4500 [Euro/unit]
Transformer
31.5 MVA Transformer cost + installation 450,000 [Euro/unit]
40.0 MVA Transformer cost + installation 500,000 [Euro/unit]
63.5 MVA Transformer cost + installation 650,000 [Euro/unit]

References

  1. Knobloch, F.; Hanssen, S.V.; Lam, A.; Pollitt, H.; Salas, P.; Chewpreecha, U.; Huijbregts, M.A.J.; Mercure, J.-F. Net emission reductions from electric cars and heat pumps in 59 world regions over time. Nat. Sustain. 2020, 3, 437–447. [Google Scholar] [CrossRef] [Green Version]
  2. Ruhnau, O.; Bannik, S.; Otten, S.; Praktiknjo, A.; Robinius, M. Direct or indirect electrification? A review of heat generation and road transport decarbonisation scenarios for Germany 2050. Energy 2018, 166, 989–999. [Google Scholar] [CrossRef] [Green Version]
  3. Nadel, S. Electrification in the Transportation, Buildings, and Industrial Sectors: A Review of Opportunities, Barriers, and Policies. Curr. Sustain. Energy Rep. 2019, 6, 158–168. [Google Scholar] [CrossRef]
  4. Khator, S.; Leung, L. Power distribution planning: A review of models and issues. IEEE Trans. Power Syst. 1997, 12, 1151–1159. [Google Scholar] [CrossRef]
  5. Seifi, H.; Sepasian, M.S. Electric Power System Planning; Springer: Berlin/Heidelberg, Germany, 2011. [Google Scholar] [CrossRef]
  6. Hadjsaïd, N.; Sabonnadière, J.-C. (Eds.) Electrical Distribution Networks; John Wiley & Sons, Inc.: Hoboken, NJ, USA, 2013. [Google Scholar] [CrossRef]
  7. Schlabbach, J.; Rofalski, K.-H. Power System Engineering: Planning, Design and Operation of Power Systems and Equipment, 2nd ed.; Wiley-VCH: Weinheim, Germany, 2014. [Google Scholar]
  8. Thurner, L.; Kassel University Press GmbH. Structural Optimizations in Strategic Medium Voltage Power System Planning; University of Kassel: Kassel, Germany, 2018. [Google Scholar] [CrossRef]
  9. Yong, J.Y.; Ramachandaramurthy, V.K.; Tan, K.M.; Mithulananthan, N. A review on the state-of-the-art technologies of electric vehicle, its impacts and prospects. Renew. Sustain. Energy Rev. 2015, 49, 365–385. [Google Scholar] [CrossRef]
  10. Foley, A.M.; Winning, I.J.; Gallachóir, B.P.Ó. State-of-the-art in electric vehicle charging infrastructure. In Proceedings of the 2010 IEEE Vehicle Power and Propulsion Conference, Lille, France, 1–3 September 2010; IEEE: Piscataway, NJ, USA, 2014; pp. 1–6. [Google Scholar] [CrossRef]
  11. Arif, S.; Lie, T.; Seet, B.; Ayyadi, S.; Jensen, K. Review of Electric Vehicle Technologies, Charging Methods, Standards and Optimization Techniques. Electronics 2021, 10, 1910. [Google Scholar] [CrossRef]
  12. Ahmad, A.; Alam, M.S.; Chabaan, R. A Comprehensive Review of Wireless Charging Technologies for Electric Vehicles. IEEE Trans. Transp. Electrification 2017, 4, 38–63. [Google Scholar] [CrossRef]
  13. Dulău, L.I.; Bică, D. Effects of Electric Vehicles on Power Networks. Procedia Manuf. 2020, 46, 370–377. [Google Scholar] [CrossRef]
  14. Putrus, G.A.; Suwanapingkarl, P.; Johnston, D.; Bentley, E.C.; Narayana, M. Impact of electric vehicles on power distribution networks. In Proceedings of the 2009 IEEE Vehicle Power and Propulsion Conference, Dearborn, MI, USA, 7–10 September 2009; pp. 827–831. [Google Scholar] [CrossRef]
  15. Konstantinidis, G.; Karapidakis, E.; Paspatis, A. Mitigating the Impact of an Official PEV Charger Deployment Plan on an Urban Grid. Energies 2022, 15, 1321. [Google Scholar] [CrossRef]
  16. Garcia-Valle, R.; Peças Lopes, J.A. (Eds.) Electric Vehicle Integration into Modern Power Networks; Springer: New York, NY, USA, 2013. [Google Scholar] [CrossRef] [Green Version]
  17. Kleiwegt, E.; Lukszo, Z. Grid Impact Analysis of Electric Mobility on a Local Electricity Grid. In Proceedings of the 2012 9th IEEE International Conference on Networking, Sensing and Control, Beijing, China, 11–14 April 2012; pp. 316–321. [Google Scholar] [CrossRef]
  18. Love, J.; Smith, A.Z.; Watson, S.; Oikonomou, E.; Summerfield, A.; Gleeson, C.; Biddulph, P.; Chiu, L.F.; Wingfield, J.; Martin, C.; et al. The addition of heat pump electricity load profiles to GB electricity demand: Evidence from a heat pump field trial. Appl. Energy 2017, 204, 332–342. [Google Scholar] [CrossRef]
  19. Arnold, M.P. Integration of Residential Distributed Generators and Heat Pumps into the Low Voltage Grid from a Voltage Level Perspective; Technischen Universitat Dortmund: Dortmund, Germany, 2016; Available online: https://core.ac.uk/download/pdf/46917314.pdf (accessed on 5 July 2022).
  20. De Vos, L.; Leemput, N.; Refa, N.; Bernards, R.; Fidder, H.; de Rijke, F. Optimal Integration of Electric Vehicles, PV, Heat Pumps in Existing Distribution Grids in the Netherlands. In Proceedings of the CIRED 2019 Conference, Madrid, Spain, 3–6 June 2019. [Google Scholar]
  21. Thormann, B.; Kienberger, T. Evaluation of Grid Capacities for Integrating Future E-Mobility and Heat Pumps into Low-Voltage Grids. Energies 2020, 13, 5083. [Google Scholar] [CrossRef]
  22. Oliyide, R.O.; Cipcigan, L.M. The impacts of electric vehicles and heat pumps load profiles on low voltage distribution networks in Great Britain by 2050. Int. Multidiscip. Res. J. 2021, 11, 30–45. [Google Scholar] [CrossRef]
  23. Blonsky, M.; Nagarajan, A.; Ghosh, S.; McKenna, K.; Veda, S.; Kroposki, B. Potential Impacts of Transportation and Building Electrification on the Grid: A Review of Electrification Projections and Their Effects on Grid Infrastructure, Operation, and Planning. Curr. Sustain. Energy Rep. 2019, 6, 169–176. [Google Scholar] [CrossRef]
  24. Fischer, D.; Madani, H. On heat pumps in smart grids: A review. Renew. Sustain. Energy Rev. 2017, 70, 342–357. [Google Scholar] [CrossRef] [Green Version]
  25. Nykamp, S.; Molderink, A.; Bakker, V.; Toersche, H.; Hurink, J.; Smit, G. Integration of heat pumps in distribution grids: Economic motivation for grid control. In Proceedings of the 2012 3rd IEEE PES Innovative Smart Grid Technologies Europe (ISGT Europe), Berlin, Germany, 14–17 October 2012; pp. 1–8. [Google Scholar] [CrossRef] [Green Version]
  26. Kreuder, L.; Spataru, C. Assessing demand response with heat pumps for efficient grid operation in smart grids. Sustain. Cities Soc. 2015, 19, 136–143. [Google Scholar] [CrossRef]
  27. Mahmood, A.; Javaid, N.; Khan, M.A.; Razzaq, S. An overview of load management techniques in smart grid. Int. J. Energy Res. 2015, 39, 1437–1450. [Google Scholar] [CrossRef]
  28. Probst, A.; Siegel, M.; Braun, M.; Tenbohlen, S. Impacts of electric mobility on distribution grids and possible solution through load management. In Proceedings of the CIRED 2011—21st International Conference on Electricity Distribution, Frankfurt, Germany, 6–9 June 2011; p. 126. [Google Scholar]
  29. Masoum, A.S.; Deilami, S.; Moses, P.S.; Masoum, M.A.S.; Abu-Siada, A. Smart load management of plug-in electric vehicles in distribution and residential networks with charging stations for peak shaving and loss minimisation considering voltage regulation. IET Gen. Transmiss. Distrib. 2011, 5, 877. [Google Scholar] [CrossRef]
  30. Almutairi, A.; Alrumayh, O. Optimal Charging Infrastructure Portfolio for Minimizing Grid Impact of Plug-In Electric Vehicles. IEEE Trans. Ind. Inf. 2022, 18, 5712–5721. [Google Scholar] [CrossRef]
  31. Khan, R.H.; Stüdli, S.; Khan, J.Y. A network controlled load management scheme for domestic charging of electric vehicles. In Proceedings of the 2013 Australasian Universities Power Engineering Conference (AUPEC), Hobart, TAS, Australia, 29 September–3 October 2013; pp. 1–6. [Google Scholar] [CrossRef]
  32. Sawant, M.; Moyalan, J.; Bhagyashree, U.; Sheikh, A.; Wagh, S.; Singh, N. Power Grid Load Management using Electric Vehicles: A Distributed Resource Allocation Approach. In Proceedings of the 2019 27th Mediterranean Conference on Control and Automation (MED), Akko, Israel, 1–4 July 2019; pp. 428–433. [Google Scholar] [CrossRef]
  33. Mahmud, K.; Hossain, M.J.; Ravishankar, J. Peak-Load Management in Commercial Systems with Electric Vehicles. IEEE Syst. J. 2018, 13, 1872–1882. [Google Scholar] [CrossRef]
  34. Arteaga, J.; Zareipour, H.; Thangadurai, V. Overview of Lithium-Ion Grid-Scale Energy Storage Systems. Curr. Sustain. Energy Rep. 2017, 4, 197–208. [Google Scholar] [CrossRef]
  35. Rackliffe, G. Guidelines for planning distributed generation systems. In Proceedings of the 2000 Power Engineering Society Summer Meeting (Cat. No.00CH37134), Seattle, WA, USA, 16–20 July 2000; Volume 3, pp. 1666–1667. [Google Scholar] [CrossRef]
  36. Zhang, R.; Du, Y.; Yuhong, L. New challenges to power system planning and operation of smart grid devel-opment in China. In Proceedings of the 2010 International Conference on Power System Technology, Hangzhou, China, 24–28 October 2010; pp. 1–8. [Google Scholar] [CrossRef]
  37. Harnisch, S.; Steffens, P.; Thies, H.H.; Cibis, K.; Zdrallek, M.; Lehde, B. New planning principles for low voltage networks with a high share of decentralized generation. In CIRED Workshop 2016; IET: Helsinki, Finland, 14–15 June 2016; pp. 1–4. [Google Scholar] [CrossRef] [Green Version]
  38. Mosquet, X.; Zablit, H.; Dinger, A.; Xu, G.; Andersen, M.; Tominaga, K. The Electric Car Tipping Point—The Future of Powertrains for Owned and Shared Mobility; The Boston Consulting Group: Boston, MA, USA, 2018; Available online: https://web-assets.bcg.com/ef/8b/007df7ab420dab1164e89d0a6584/bcg-the-electric-car-tipping-point-jan-2018.pdf (accessed on 1 July 2021).
  39. Kuhnert, F.; Stürmer, C. Autofacts; PricewaterhouseCoopers PwC: Toronto, ON, Canada, 2016. [Google Scholar]
  40. RBC Electric Vehicle Forecast Through 2050 & Primer’, RBC Capital Markets, May 2018. Available online: http://www.fullertreacymoney.com/system/data/files/PDFs/2018/May/14th/RBC%20Capital%20Markets_RBC%20Electric%20Vehicle%20Forecast%20Through%202050%20%20Primer_11May2018.pdf (accessed on 29 July 2021).
  41. Monscheidt, J.; Gemsjäger, B.; Slupinski, A.; Yan, X.; Ali, S.A.; Wintzek, P.; Zdrallek, M. Energy demand model for electric load forecast in urban distribution networks. CIRED Open Access Proc. J. 2020, 2020, 31–33. [Google Scholar] [CrossRef]
  42. Wintzek, P.; Ali, S.; Kotthaus, K.; Wruk, J.; Zdrallek, M.; Monscheidt, J.; Gemsjäger, B.; Slupinski, A. Application and Evaluation of Load Management Systems in Urban Low-Voltage Grid Planning. World Electr. Veh. J. 2021, 12, 91. [Google Scholar] [CrossRef]
  43. Liste der Ladesäulen (Stand 1. Juli 2021)’. Bundesnetzagentur, 1 July 2021. Available online: https://www.bundesnetzagentur.de/SharedDocs/Downloads/DE/Sachgebiete/Energie/Unternehmen_Institutionen/E_Mobilitaet/Ladesaeulenkarte_Datenbankauszug.xlsx;jsessionid=EF0F9B1F6B36E1FA218A42606D92A6FE?__blob=publicationFile&v=8 (accessed on 1 July 2021).
  44. Goebelsmann, F.; Wintzek, P.; Ali, S.; Zdrallek, M.; Monscheidt, J.; Gemsjaeger, B.; Slupinski, A. Potentials of a cost-optimized application of regulated distribution transformers in urban low-voltage grid planning with a high share of charging infrastructure, heat pumps and photovoltaic systems. In Proceedings of the PESS 2021—Power and Energy Student Summit, online, 25–26 November 2021; pp. 1–6. [Google Scholar]
  45. Population Structure Data’; GfK SE Growth from Knowledge: Nuremberg, Germany, 2018.
  46. Bollerslev, J.; Andersen, P.B.; Jensen, T.V.; Marinelli, M.; Thingvad, A.; Calearo, L.; Weckesser, T. Coincidence Factors for Domestic EV Charging from Driving and Plug-In Behavior. IEEE Trans. Transp. Electrification 2021, 8, 808–819. [Google Scholar] [CrossRef]
  47. Uhlig, R.; Stotzel, M.; Zdrallek, M.; Neusel-Lange, N. Dynamic grid support with EV charging management considering user requirements. In Proceedings of the CIRED Workshop 2016, Helsinki, Finland, 14–15 June 2016. [Google Scholar] [CrossRef] [Green Version]
  48. Follmer, R.; Gruschwitz, D.; Jesske, B.; Quandt, S.; Lenz, B.; Nobis, C.; Köhler, K.; Mehlin, M. Mobilität in Deutschland 2008; Ergebnisbericht: Struktur—Aufkommen—Emissionen—Trends; Federal Ministry for Digital and Transport: Bonn and Berlin, Germany, 2010; Available online: http://www.mobilitaet-in-deutschland.de/pdf/infas_MiD2008_Abschlussbericht_I.pdf (accessed on 24 February 2022).
  49. IEC 60050: 691-10-05. Available online: https://www.electropedia.org/ (accessed on 24 February 2022).
  50. Ali, S.; Wintzek, P.; Zdrallek, M.; Böse, C.; Monscheidt, J.; Gemsjäger, B.; Slupinski, A. Demand Factor Identification of Electric Vehicle Charging Points for Distribution System Planning. In Proceedings of the CIRED 2021—The 26th International Conference and Exhibition on Electricity Distribution, Online Conference, 20–23 September 2021; pp. 2574–2578. [Google Scholar] [CrossRef]
  51. Rehtanz, C.; Greve, M.; Häger, U.; Hagemann, Z.; Kippelt, S.; Kittl, C.; Klouber, M.; Pohl, O.; Rewald, F.; Wagner, C. Verteilnetzstudie für das Land Baden-Württemberg. Technische Universität Dortmund—ie3—Institut für Energiesysteme, Energieeffizienz und Energiewirtschaft, Stuttgart, Studie für das Ministerium für Umwelt, Klima und Energiewirtschaft Baden-Württemberg, April 2017. Available online: https://um.baden-wuerttemberg.de/fileadmin/redaktion/mum/intern/Dateien/Dokumente/5_Energie/Versorgungssicherheit/170413_Verteilnetzstudie_BW.pdf (accessed on 29 July 2021).
  52. DIN EN 60076-1:2012-03 VDE 0532-76-1:2012-03 Power Transformers—Part 1: General (IEC 60076-1:2011); German version EN 60076-1:2011’. VDE, March 2012. Available online: https://www.vde-verlag.de/standards/0532078/din-en-60076-1-vde-0532-76-1-2012-03.html (accessed on 20 July 2022).
  53. DIN VDE 0276-1000 VDE 0276-1000:1995-06 Power Cables; Current-Carrying Capacity, General; Conversion Factors’. VDE, June 1995. Available online: https://www.vde-verlag.de/standards/0276001/din-vde-0276-1000-vde-0276-1000-1995-06.html (accessed on 20 July 2022).
  54. DIN EN 50588-1:2019-12—Medium Power Transformers 50 Hz, with Highest Voltage for Equipment Not Exceeding 36 kV—Part 1: General Requirements, German version EN 50588-1:2017’; Beuth Verlag GmbH: Berlin, Germany, December 2019.
  55. DIN EN 50160:2020-11, Voltage Characteristics of Electricity Supplied by Public Electricity Networks; GERMAN Version EN 50160:2010 + Cor.:2010 + A1:2015 + A2:2019 + A3:2019; Beuth Verlag GmbH: Berlin, Germany, 2019. [CrossRef]
  56. Dorsemagen, F.; Korotkiewicz, K.; Oerter, C.; Zdrallek, M.; Birkner, P.; Friedrich, W.; Neusel-Lange, N.; Stiegler, M. Decentralized, Integrated Automation System for Medium- and Low Voltage Grids. In Proceedings of the International ETG Congress 2015, Bonn, Germany, 17 November 2015; pp. 20–26. [Google Scholar]
  57. Dorsemagen, F.; Oerter, C.; Zdrallek, M.; Antoni, J.; Birkner, P.; Stiegler, M. State Identification Methods for MV-Grid Automation with Special Regard to LV-Interconnections. In Proceedings of the 23rd International Conference on Electricity Distribution (CIRED), Lyon, France, 15–18 June 2015; paper 1126. [Google Scholar]
  58. Ali, S.A.; Wintzek, P.; Talmond, F.; Zdrallek, M.; Mayer, D.; Monscheidt, J.; Gemsjäger, B.; Slupinski, A. Methodology and application of a dynamic load management system on a medium-voltage distribution power system. In Proceedings of the ETG-Kongress, Online Conference, 18–19 May 2021; Volume 163, pp. 320–325. [Google Scholar]
  59. Wintzek, P.; Ali, S.A.; Monscheidt, J.; Gemsjäger, B.; Slupinski, A.; Zdrallek, M. Planungs- und Betriebsgrundsätze für städtische Verteilnetze—Leitfaden zur Ausrichtung der Netze an ihren zukünftigen Anforderungen. Wuppertal 2021, 35. Available online: https://d-nb.info/1252809050/34 (accessed on 20 July 2022).
  60. Koutsopoulos, I.; Tassiulas, L. Challenges in demand load control for the smart grid. IEEE Netw. 2011, 25, 16–21. [Google Scholar] [CrossRef]
  61. Fan, Z.; Kulkarni, P.; Gormus, S.; Efthymiou, C.; Kalogridis, G.; Sooriyabandara, M.; Zhu, Z.; Lambotharan, S.; Chin, W.H. Smart Grid Communications: Overview of Research Challenges, Solutions, and Standardization Activities. IEEE Commun. Surv. Tutorials 2012, 15, 21–38. [Google Scholar] [CrossRef] [Green Version]
  62. Ali, S.; Wintzek, P.; Zdrallek, M.; Gemsjäger, B.; Monscheidt, J.; Slupinski, A. An alternative assessment model for electric power system planning. In Proceedings of the CIRED Porto Workshop 2022: E-mobility and power distribution systems, Porto, Portugal, 2–3 June 2022; Volume 2022, pp. 67–71. [Google Scholar] [CrossRef]
  63. Wintzek, P.; Ali, S.A.; Zdrallek, M.; Monscheidt, J.; Gemsjäger, B.; Slupinski, A. Development of Planning and Operation Guidelines for Strategic Grid Planning of Urban Low-Voltage Grids with a New Supply Task. Electricity 2021, 2, 614–652. [Google Scholar] [CrossRef]
Figure 1. The applied progressive and conservative development scenarios for electromobility and heat pumps in Germany based on [41].
Electricity 03 00026 g001
Figure 2. Demand factors for five dominant charging powers for up to 500 charging points based on [50].
Electricity 03 00026 g002
Figure 3. Demand factors for up to 500 heat pumps based on [51].
Electricity 03 00026 g003
Figure 4. Assumed division of voltage range between medium voltage and low voltage grids.
Electricity 03 00026 g004
Figure 5. Flowchart for the installation of the components of the decentralized automation system for applying load management based on [59].
Electricity 03 00026 g005
Figure 6. Illustration of the six load management layouts for one medium voltage ring based on [59].
Electricity 03 00026 g006
Figure 7. The principal operation of reactive power management based on [59].
Electricity 03 00026 g007
Figure 8. Load development for eleven medium voltage grids for the two development scenarios over the years 2030, 2040 and 2050 based on [59].
Electricity 03 00026 g008
Figure 9. Consolidated cable measures for the medium voltage grids with different planning strategies over the investigated years for the two development scenarios and the three heat pump systems.
Electricity 03 00026 g009
Figure 10. Consolidated costs in millions of Euros for all analyzed medium voltage grids for different planning strategies.
Electricity 03 00026 g010
Figure 11. The savings potential for innovative planning strategies in comparison to conventional planning per planning variant.
Electricity 03 00026 g011
Figure 12. Mean effective power per building connection for dimensioning the substation transformer and outgoing feeders for private and public charging infrastructure and 3.0 kW heat pumps.
Electricity 03 00026 g012
Figure 13. Effective charging power per charging point for private and public charging points for dimensioning the outgoing feeders for the different years and the two scenarios.
Electricity 03 00026 g013
Figure 14. Share of cable measures for different cable cross-sections in relation to total cable measures for two planning techniques in the 10 kV grids.
Electricity 03 00026 g014
Figure 15. Load development for the two development scenarios and the years 2030, 2040, and 2050 in relation to the current load power based on [59].
Electricity 03 00026 g015
Figure 16. Loading of substation transformers for 9 medium voltage grids in the year 2050 for the two development scenarios.
Electricity 03 00026 g016
Figure 17. Consolidated costs over eleven medium voltage grids for conventional planning strategy and three load management variants with six layouts based on [59].
Electricity 03 00026 g017
Figure 18. The savings potential for the three load management variants with the six layouts in comparison to conventional planning over all analyzed variants based on [59].
Electricity 03 00026 g018
Figure 19. Share of the length of required cable measures in comparison to the total cable length in the grid for the two development scenarios over three years until 2050 based on [59].
Electricity 03 00026 g019
Figure 20. Share of the length of overloaded cable sections to the total cable length in the grid for the two development scenarios over three years until 2050 based on [59].
Electricity 03 00026 g020
Figure 21. Maximum voltage drop and maximum voltage saving consolidated over eleven MV grids for the two development scenarios over three years until 2050 based on [59].
Electricity 03 00026 g021
Figure 22. Flowchart for planning medium voltage grids.
Electricity 03 00026 g022
Figure 23. Ranking of the six planning variants for each assessment criterion.
Electricity 03 00026 g023
Figure 24. Ranking of the six planning variants according to the weighting alternatives.
Electricity 03 00026 g024
Table 1. The assumed distribution of charging powers for private and public charging infrastructure based on [41].
Charging PowerPrivate Charging InfrastructurePublic Charging Infrastructure
203020402050203020402050
3.7 kW10%0%0%0%0%0%
11 kW60%65%65%5%5%5%
22 kW30%35%35%75%20%20%
50 kW0%0%0%15%50%50%
150 kW0%0%0%5%25%25%
Table 2. Overview of the use cases for conventional and innovative planning strategies.
MeasureApplication in Voltage LevelUse Case of the Measure
I/Ith > 120% *V/Vn < 96%V/Vn > 106%
Conventional Planning Strategy
CableMV
Substation transformerMV--
Innovative Planning Strategy
Load managementLV-
Reactive power
management
LV
Energy storageMV
* loading in (n-1) operation. ✓: means the measure is having an influence on the grid violation.
Table 3. Overview of the regulated load for each of the three load management variants (“✓”: regulated, “-”: not regulated).
Regulated LoadLM Variant 1LM Variant 2LM Variant 3
Heat Pumps--
Private
Charging Points
-
Public
Charging Points
--
Table 4. Specification of the six load management layouts based on [59].
Load Management LayoutSpecifications
Total costs
(MV + LV)
MICT is needed in the MV grid as well as all the LV grids
Half the costs
(MV + 50% LV)
MICT is needed in the MV grid and half of the LV grids as the other half is already equipped
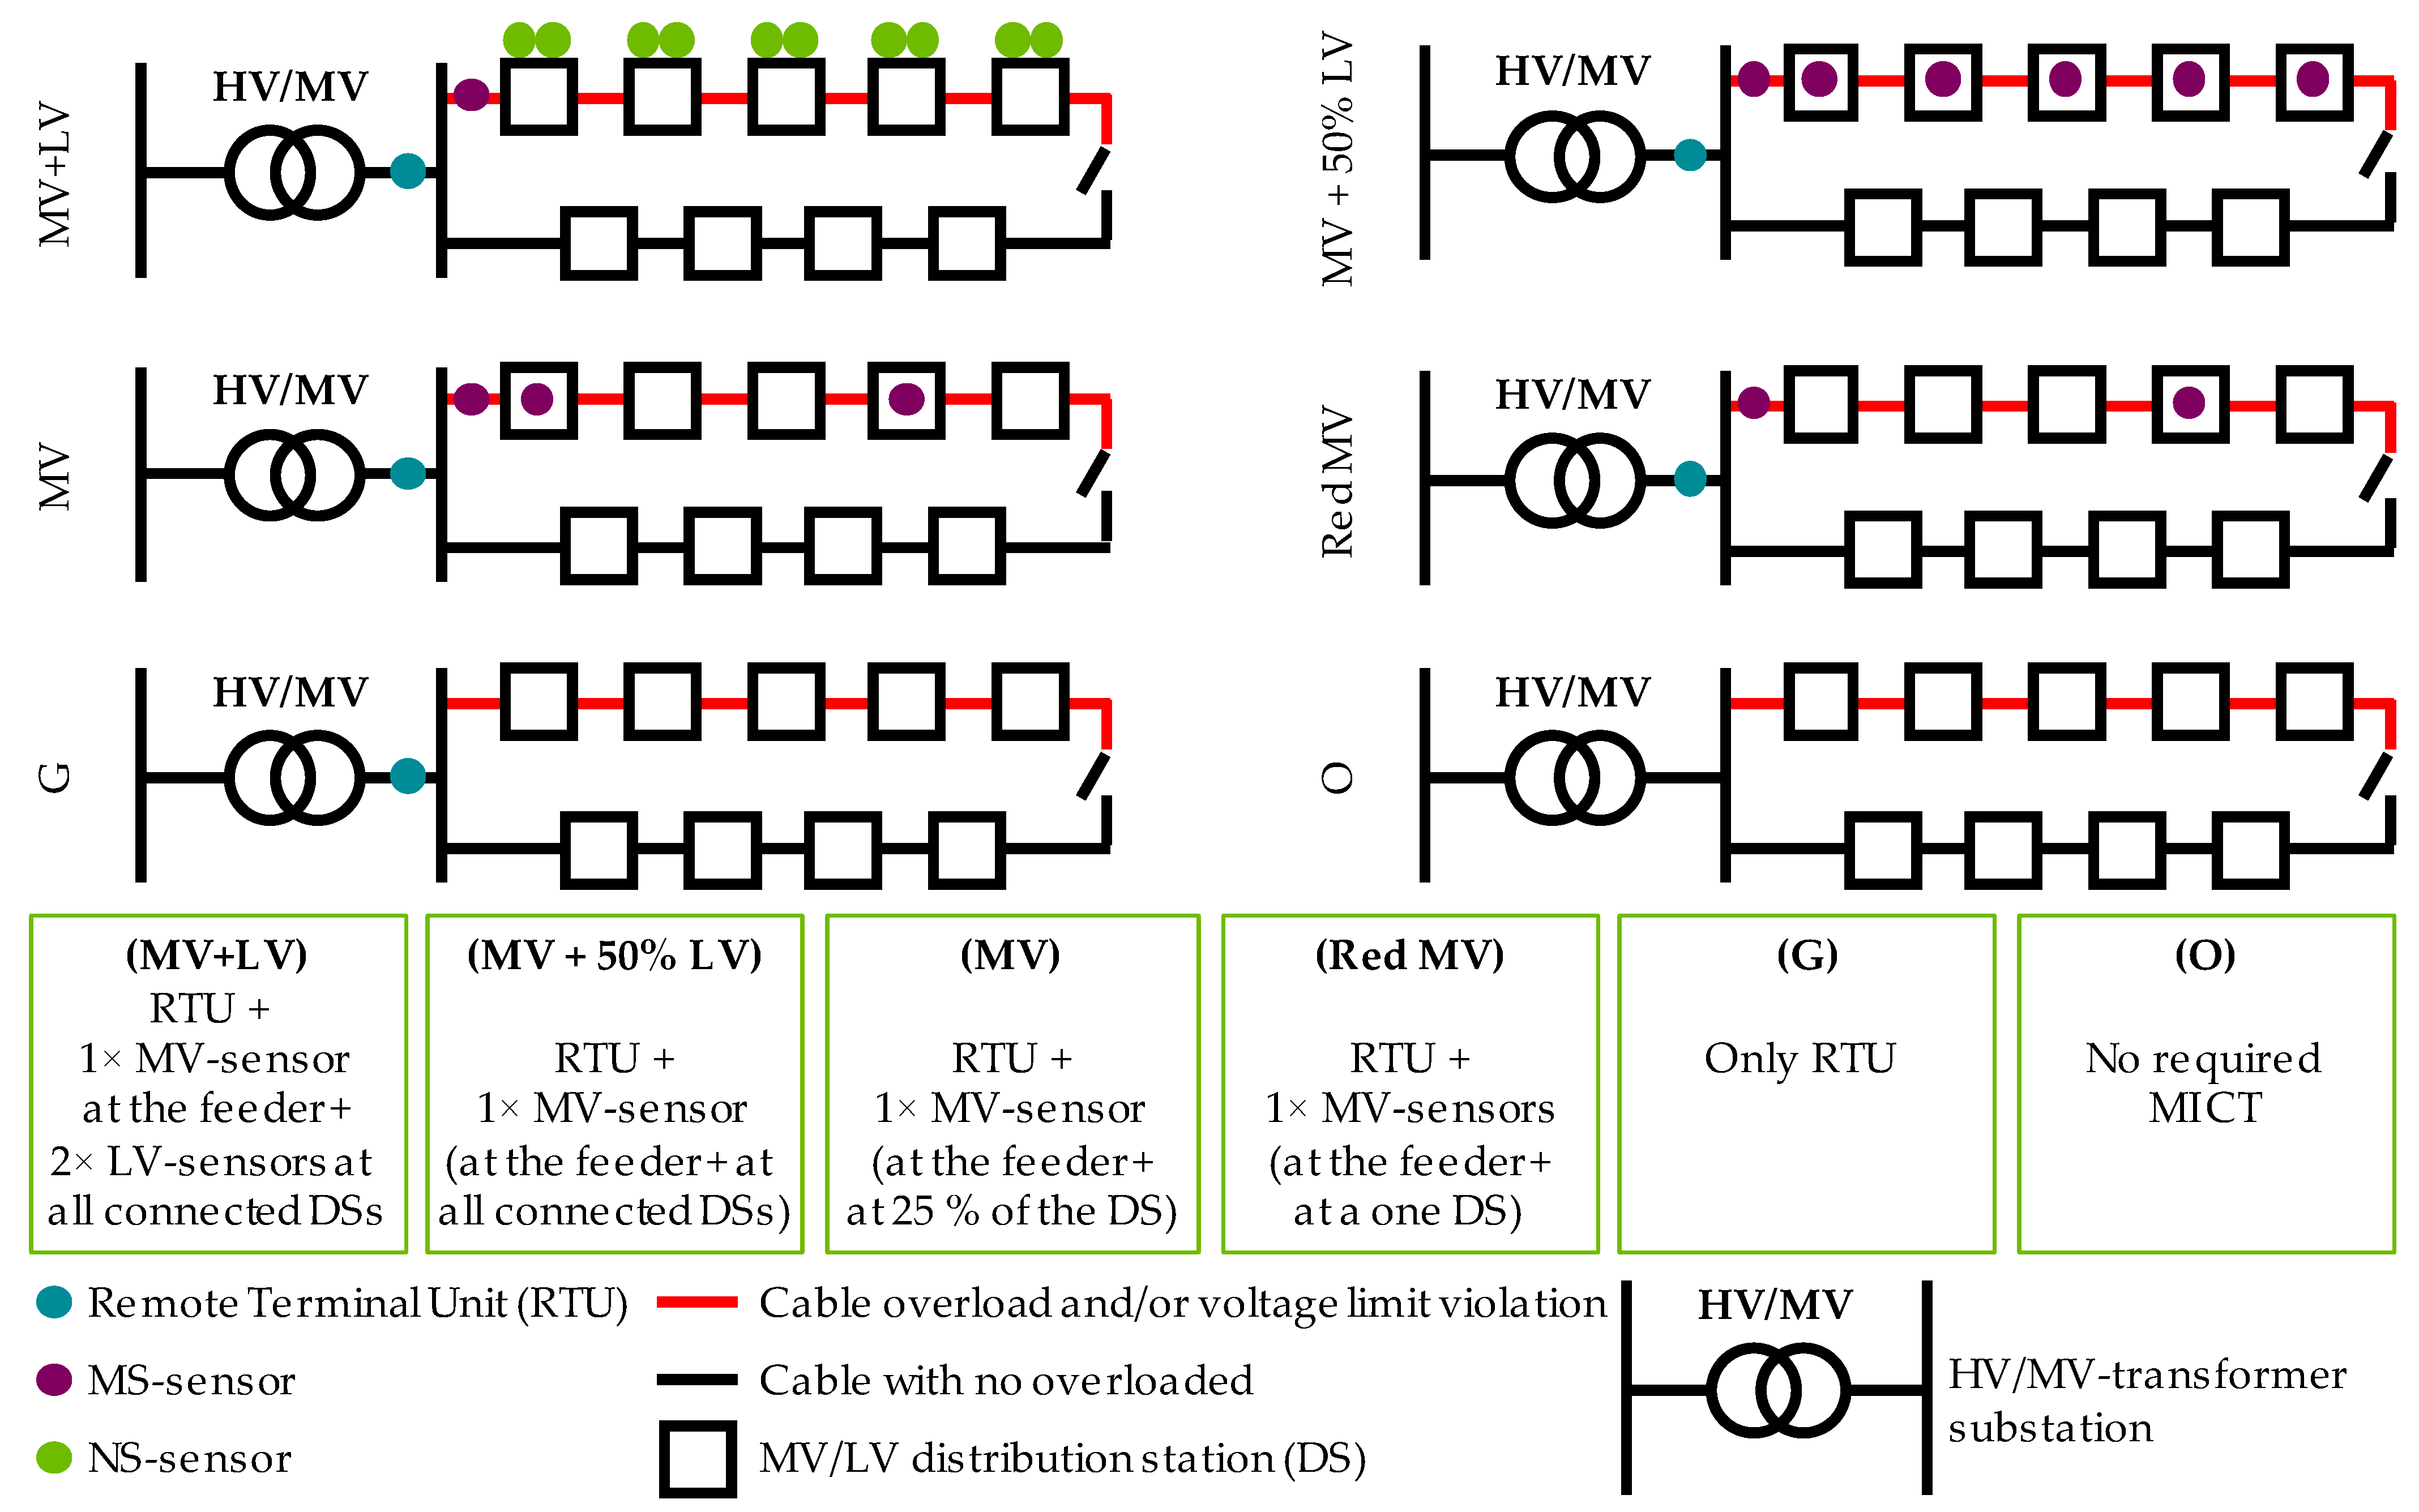
MV costs
(MV)
MICT is needed in the MV grid, whereas the LV grids are already equipped with MICT
Reduced MV costs
(Red. MV)
MICT is needed in a reduced coverage in the MV grid since it is already partially equipped with MICT
Base costs
(B)
A remote terminal unit is needed to operate LM since MICT is fully constructed in the MV grid
No costs
(0)
All the LM components are already constructed
Table 5. Summary of the power value assumptions for the different load types and dimensioning views based on [59].
Load TypeSubstation TransformerOutgoing Feeder
kW per
Building
Connection
kW per
Charging Point
kW per
Building
Connection
kW per
Charging Point
Private charging points[0.3 1; 2.4 2]1.0[0.8 1; 2.7 2][3.3 1; 1.3 2]
Public charging points[0.05 1; 0.8 2]0.3[0.1 1; 0.9 2][4.5 1; 3.7 2]
Households2.0-2.4-
3.0 kW heat pumps[0.1 1; 0.5 2]
6.5 and 9.0 kW heat pumpsFactor: 2.2 and 3, respectively
1 Conservative scenario for the year 2030. 2 Progressive scenario for the year 2050.
Table 6. An overview of the weighting alternatives and their specific weights based on [59].
Assessment
Criterion
Equal WeightingEconomically
Oriented
Grid ResilienceTechnically
Oriented
Conservation of Resources
Cost of measures20%60%10%5%10%
Losses of
the power grid
20%10%10%30%35%
Frequency of
breakdown
20%10%35%30%10%
Stability of
voltage
20%10%35%30%10%
Effort of
construction
20%10%10%5%35%
Publisher’s Note: MDPI stays neutral with regard to jurisdictional claims in published maps and institutional affiliations.

