Article

Achieving Optimal Reactive Power Compensation in Distribution Grids by Using Industrial Compensation Systems

Research Center on Energy Transmission and Storage (FENES), Faculty of Electrical and Information Technology, Ostbayerische Technische Hochschule (OTH) Regensburg, Seybothstraße 2, D-93053 Regensburg, Germany
*
Author to whom correspondence should be addressed.
Electricity 2023, 4(1), 78-95; https://doi.org/10.3390/electricity4010006
Submission received: 8 December 2022 / Revised: 3 February 2023 / Accepted: 27 February 2023 / Published: 2 March 2023

Abstract

:
This paper presents a method for integrating industrial consumers owning compensation systems as alternative reactive power sources into grid operating processes. In remuneration, they receive a market-based provision of reactive power. The aim is to analyze the potential of reactive power compensation systems of industrial companies connected to medium-voltage (10 kV–30 kV) AC grids in order to increase the reactive power ability of distribution grids. Measurement methods and reactive power potential results of six industrial companies are presented to characterize the amount and temporal availability of their reactive power potential. The presented approach for using the decentralized reactive power potential is a centralized reactive power control method and is based on optimal power flow (OPF) calculations. An optimization algorithm based on linear programming is used to coordinate a reactive power retrieval tuned to the actual demand. The influencing quantities are the current grid status (voltage and load flow capacity reserves at grid nodes and power lines) and the current reactive power potential of the reactive power sources. The compensation impact of six measured industrial companies on an exemplary medium-voltage grid is shown by an application example.

Graphical Abstract

1. Introduction

Due to the energy transition in Germany, the German Federal Government decided to increase the proportion of electricity generated from renewable energy sources as a percentage of gross electricity consumption to at least 65% by 2030 according to §1 EEG 2021 [1]. As a result of this law, the nuclear phaseout will be implemented in 2023 (§7 AtG [2]) and the withdrawal from coal energy will be initiated by 2038 [3]. The elimination of large-scale power plants leads to the absence of important reactive power sources in the transmission system, which must be replaced to keep up the voltage stability in the grids. In [4], the four transmission system operators (TSO) in Germany estimate a minimal reactive power deficit of 38.1 Gvar to 74.3 Gvar in 2035. In order to cover this prospective reactive power demand, new reactive power sources have to be installed or developed. With the directive on common rules for the internal market for electricity [5] and the regulation on the internal market for electricity [6] of the European Parliament and of the Council, the regulatory framework of the EU provides a transparent, non–discriminatory and market–based provision of non–frequency ancillary services. This aspect of [6] was transposed into national law with §12 h EnWG [7]. The provision of reactive power is an option for the ancillary service steady-state voltage control. Various technologies exist to provide reactive power, e.g., variable shunt reactors (VSR), mechanically switched capacitors (with damping network (MSC(DN)), flexible alternating current transmission systems (FACTS), synchronous condensers and inverters. In a non–discriminatory procedure, every technology which fulfils technical requirements shall be considered for meeting the anticipated reactive power demand. The technical requirements for Q-sources and specifications of the market-based procedure, must be defined by the national regulatory authority [7]. Therefore, industrial companies with compensation systems may also take part in a future reactive power market. Against this background, the reactive power potential of several industrial companies with industrial compensation systems (ICS) is analyzed, and potential developing strategies are evinced in this work. The decision for choosing an adequate Q-source for having sufficient Q-capacity available is a reactive power planning (RPP) optimization problem (see [8,9]) and is not the object of this paper. The authors of [10,11] present methods for optimal planning of new capacitor banks in distribution grids. Rather, this work presents an approach for optimizing the reactive power balance by using already-installed ICS as exemplary Q-sources to analyze their potential and impact on distribution grids.
Local reactive power management approaches with ICS or decentralized energy plants are already investigated, e.g., in [12,13,14,15,16,17]. Similar research aspects regarding reactive power management by OPF calculations are done in [18] without consideration of voltage or load flow limitations. The usage of industrial reactive power potential for compensational aspects to higher grid levels has not been taken into consideration so far. Therefore, the focus of this work is the integration of real measured potential of industrial compensation systems into grid operating processes for reactive power management. Thus, less reactive power compensation systems with higher voltage levels might be necessary. According to [19,20,21], a reactive power behavior with a minimum displacement power factor cosφinductive of 0.9 is required for local static voltage stabilization in distribution grids. Local distributions and temporal time availability of industrial reactive power potential need to be taken into consideration. Initial investigations in [22] indicated the inclusion of ICS in reactive power compensation strategies in order to use their cost-effective potential. Further investigation considering the amount and the availability are carried out in Section 2 of this work. Within a survey and a measurement campaign, the reactive power potential of six industrial companies are analyzed.
The reactive power control strategy described in Section 3 is based upon an optimal power flow (OPF) problem, which is, in general, a nonlinear problem, and was firstly introduced in [23,24]. Various formulations and solution techniques have evolved over the last decades, e.g., in [25,26,27,28,29]. Most of the reactive power dispatch problems aim at power loss reduction, see [30,31,32,33,34,35,36]. The problem of this work can be described as an optimization of the vertical exchange of reactive power, meaning the bidirectional reactive power flow across grid levels at the substation transformer. Usually, bilateral contracts between TSO and DSO regulate the compliance of the vertical power flow behavior at the grid connection points being the borders of ownership. Violations might lead to penalties. From a technical perspective, and beyond these contracts, targeted provision of reactive power from distribution grids can be useful for the voltage stabilization in higher grid levels. Therefore, the aim of the optimal reactive power compensation in this paper can be interpreted as a partial optimization from a DSO’s perspective.
The solution approach in this paper is carried out by linearization of the OPF problem with continuous control variables and by using voltage and branch sensitivity factors. A similar sensitivity-based approach without optimization and with the aim of voltage controlling is carried out in [37].
In Section 4, the reactive power control calculations in Section 3 are applied in an actual use case with a real medium-voltage grid by using the measured reactive power potential in Section 2.

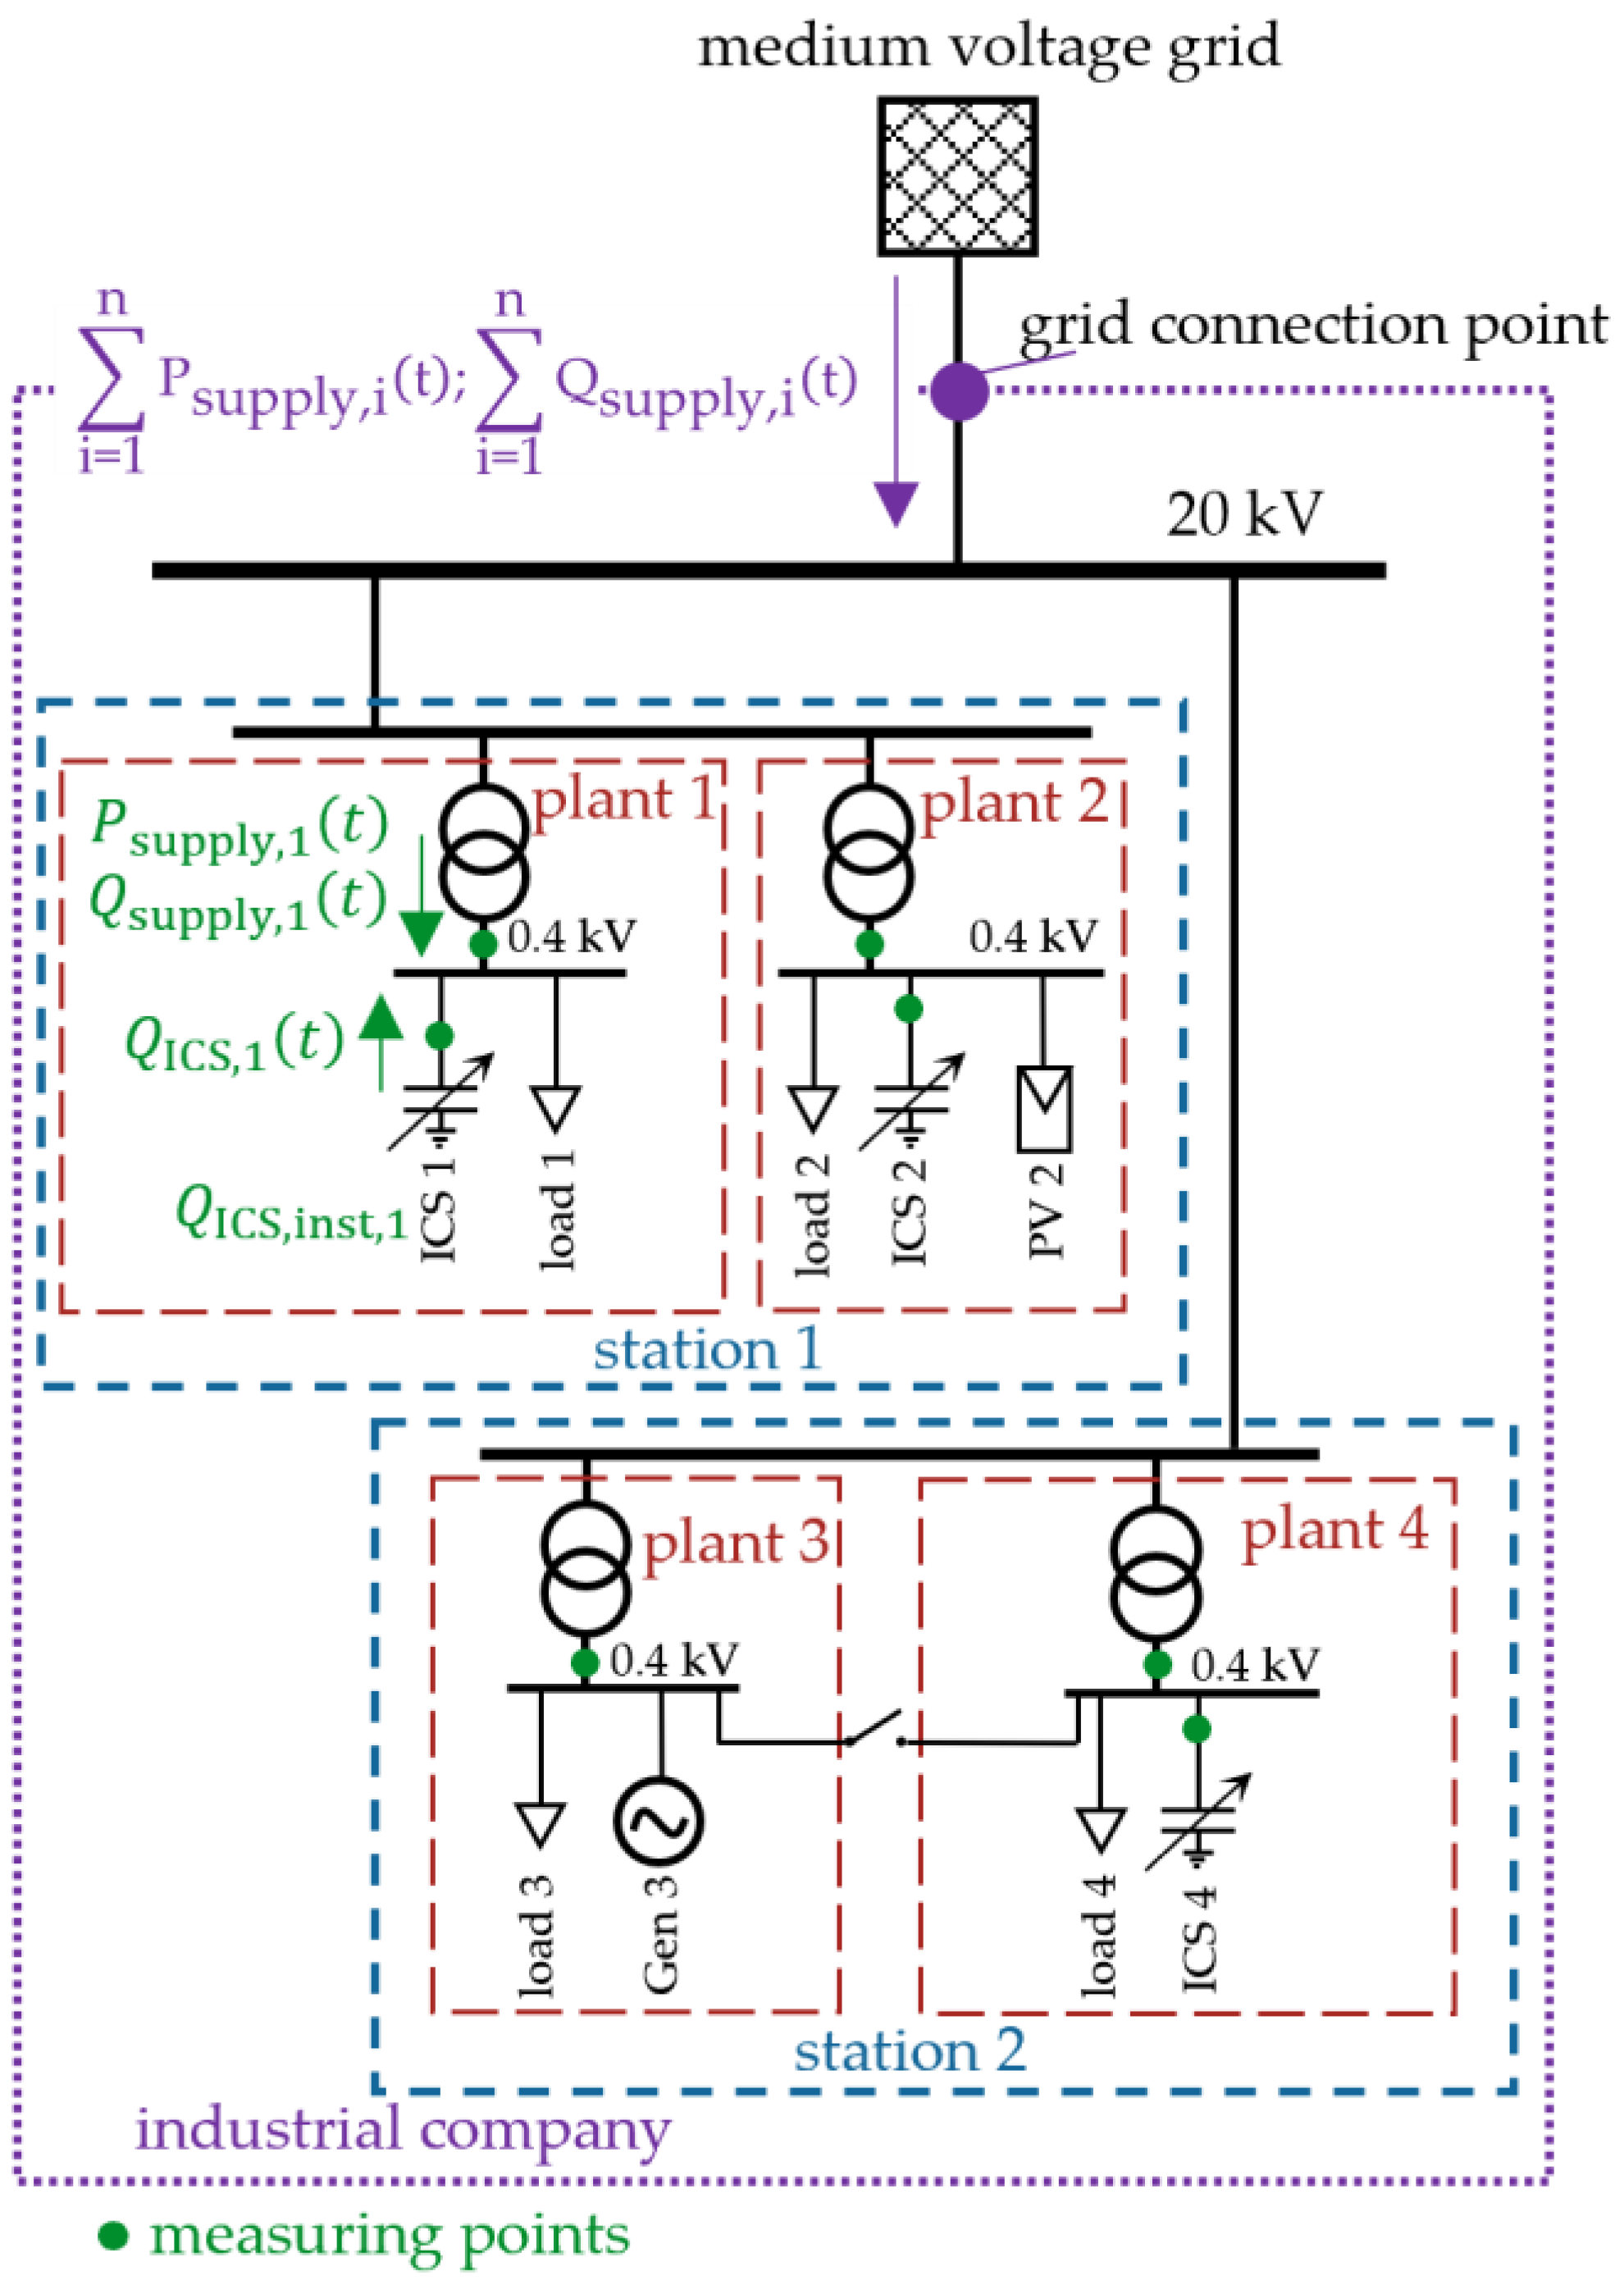
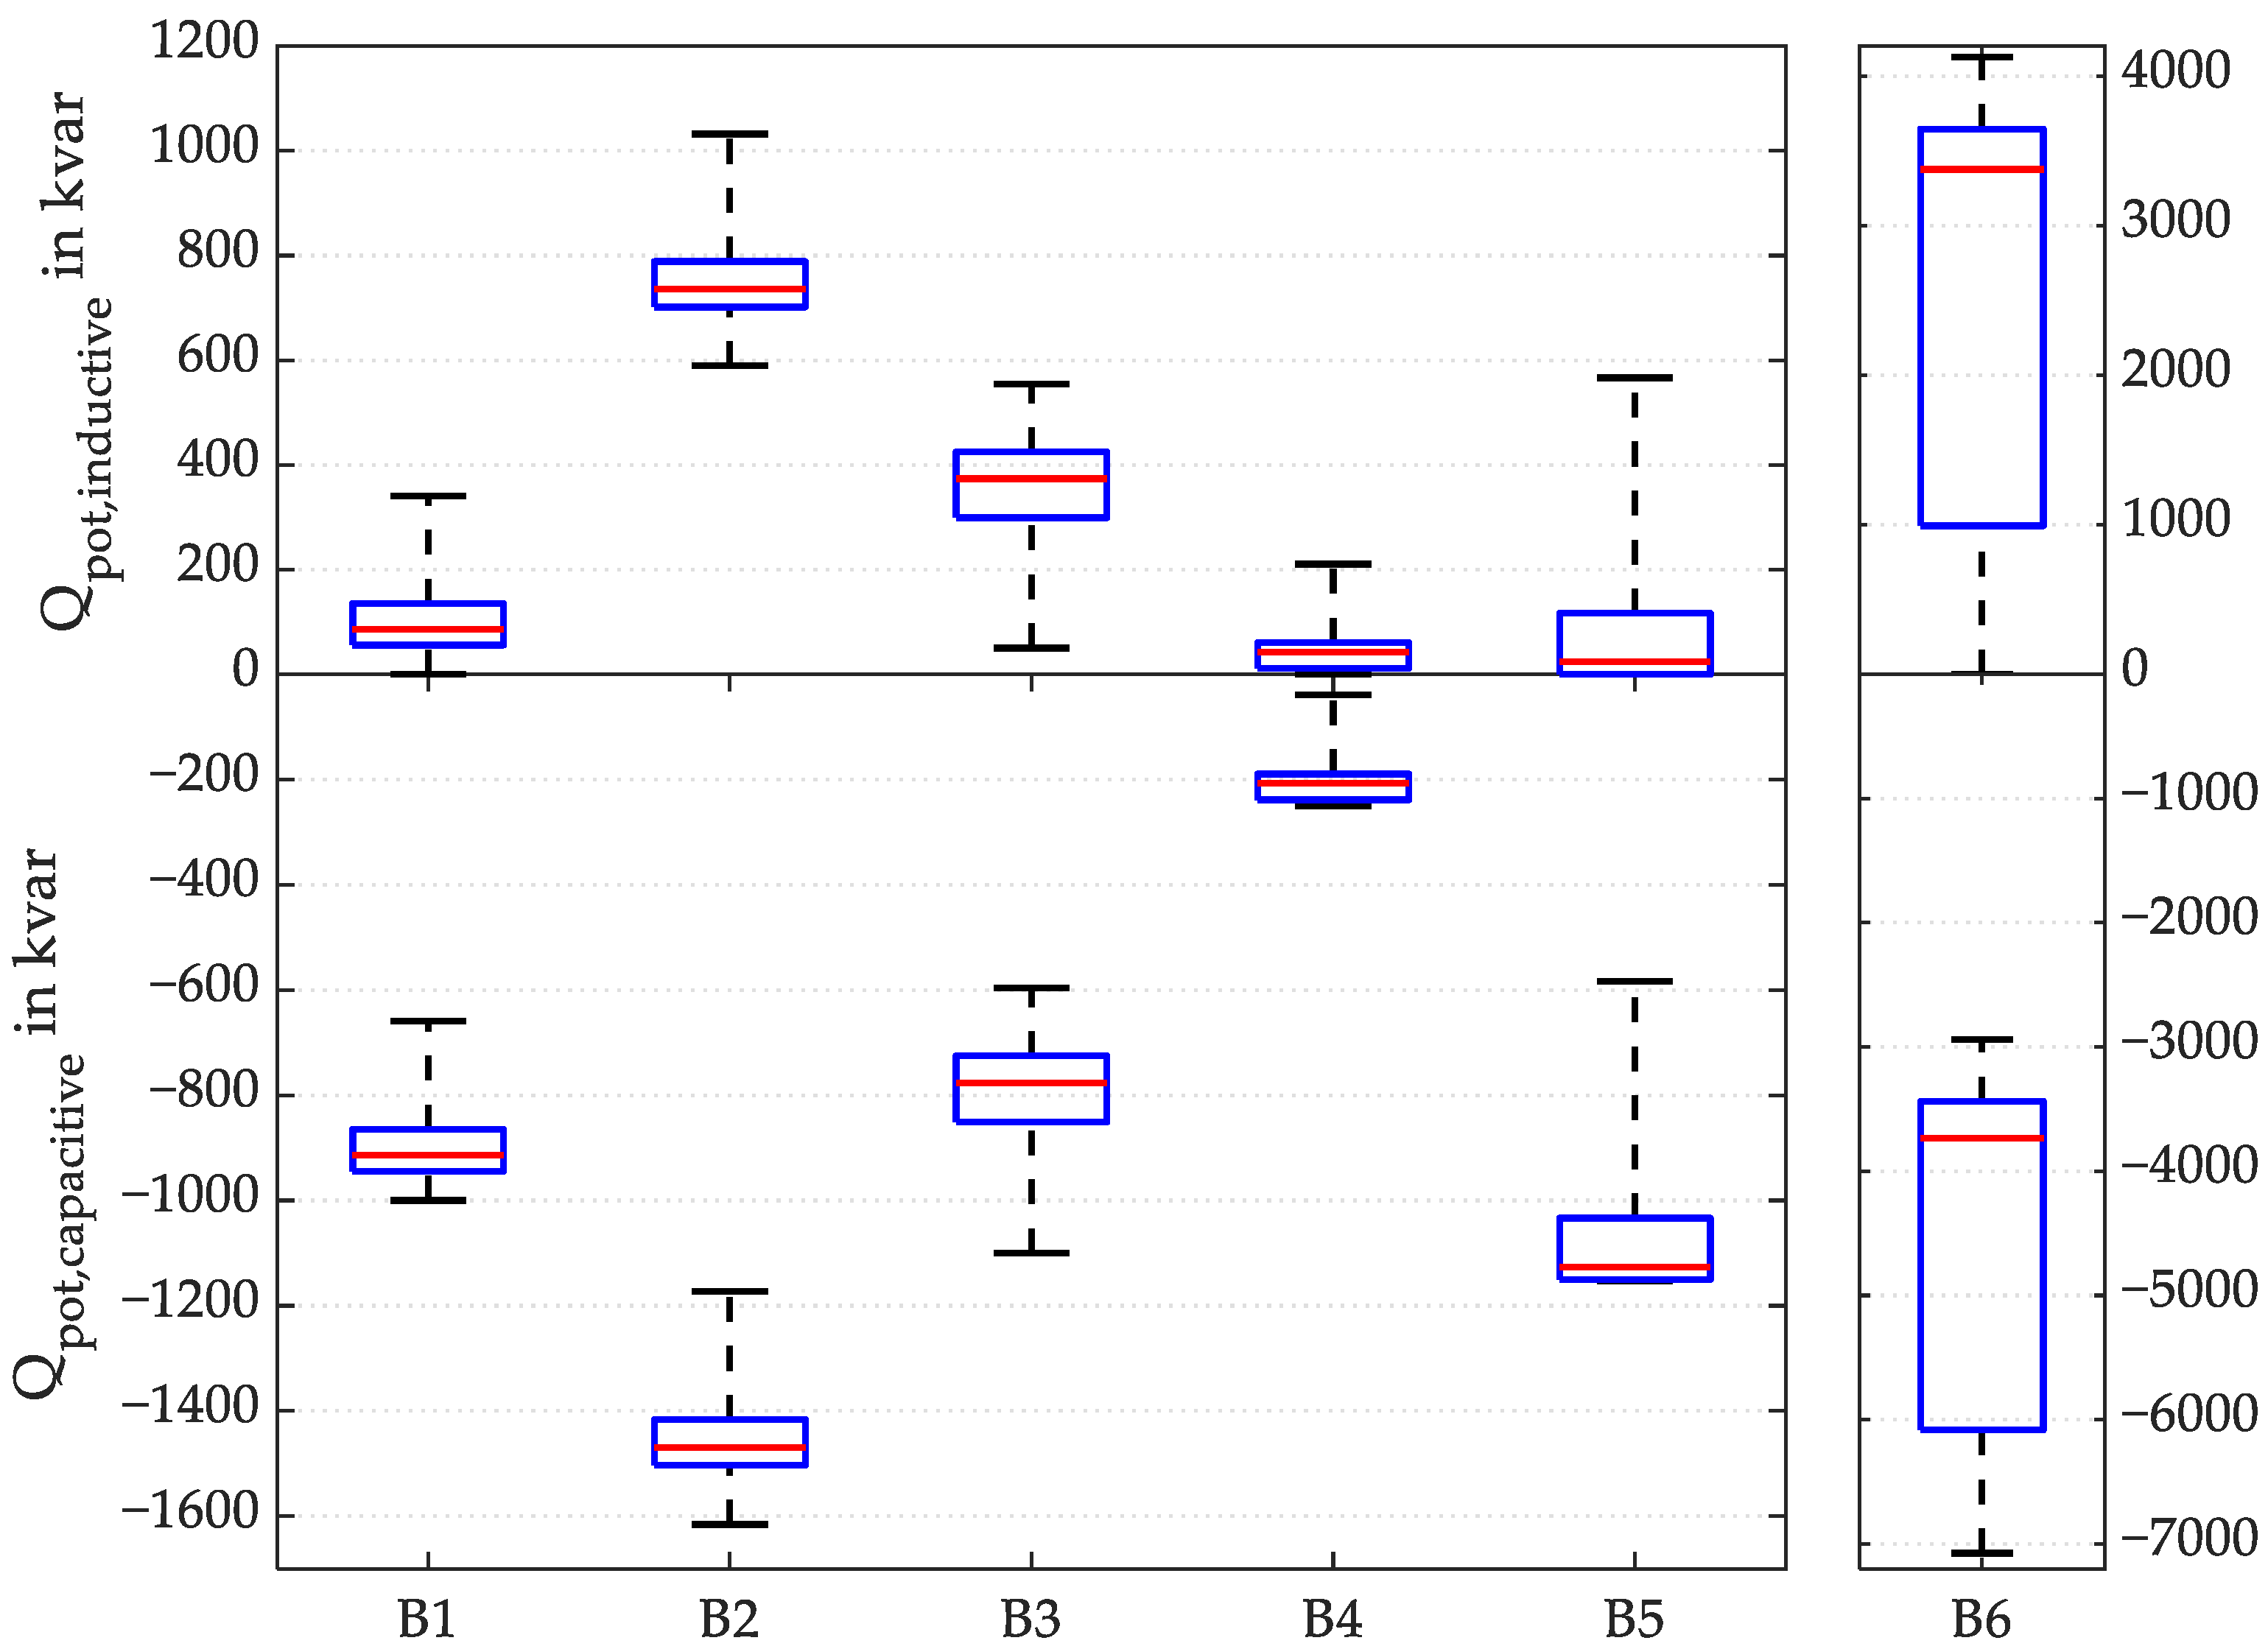
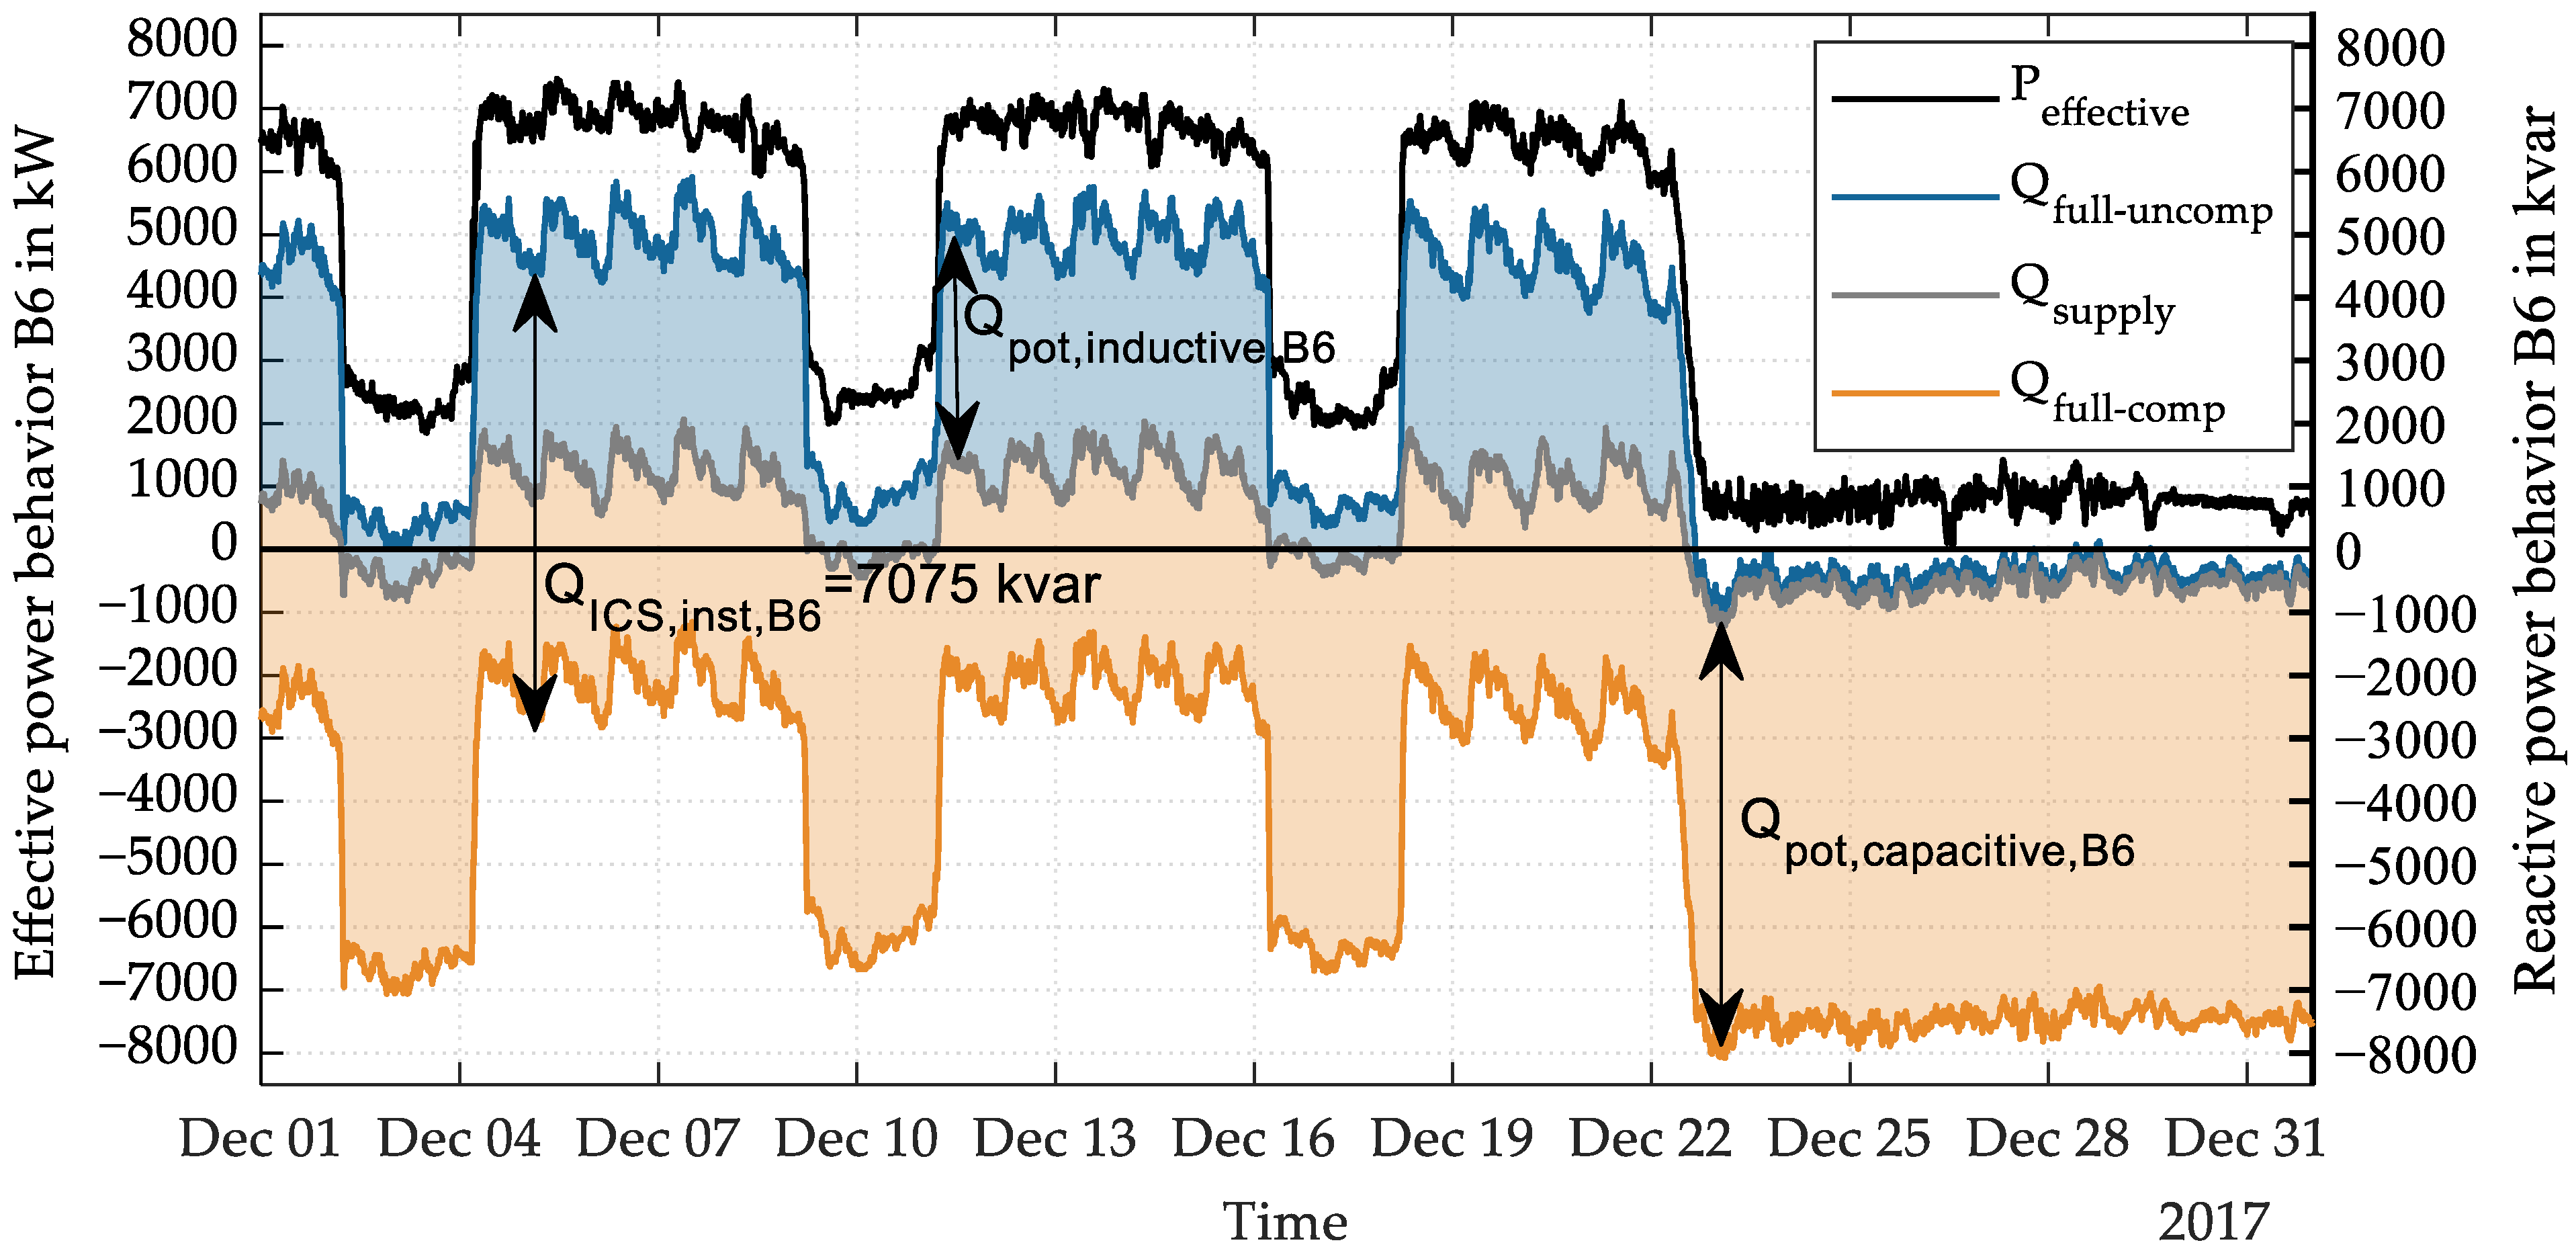
2. Investigation of the Reactive Power Potential of Industrial Compensation Systems

Figure 1 shows the composition and topology of an exemplary industrial-internal grid with two medium- to low-voltage substations, with two transformers each, which respectively supply one plant. A plant can contain several consumers, generation plants (e.g., photovoltaic power plants or cogeneration units) and ICSs. The green points mark the allocation of measuring points for the determination of the reactive power potential of an industrial company.
The presented measuring concept has a plant-by-plant precision. Therefore, further industrial grid internal investigations considering asset capacity, voltage sensitivity and restriction analyses, can be achieved. For each plant with ICS i, three input parameters are needed to calculate its reactive power potential. They are listed in Table 1 and the exemplar is labeled at plant one Figure 1.
In order to get the total reactive power potential, it is necessary to summarize the input parameters listed in Table 1 for all plants (see (1)–(4)). In this paper, only the reactive power potential of the ICS is regarded. Additional reactive power potential of generation units is not considered in this paper.
The conventional aim of each ICS is to provide the need of reactive power of a plant and to compensate the inductive reactive power appearing locally [22]. For this purpose, the ICS adjusts Q supply , i ( t ) depending on the actual active power consumption for a certain displacement power factor cosφ. The reactive power potential of a company with n plants can be calculated by its full-uncompensated or full-compensated reactive power behavior:
Q full uncomp ( t ) = i = 1 n Q supply , i ( t ) i = 1 n Q ICS , i ( t )   ,
Q full comp ( t ) = Q full uncomp ( t ) + i = 1 n Q ICS , inst , i .  
The reactive power potential of an industrial company can be defined by the ability to change the reactive power behavior at the grid connection point, referred to as i = 1 n Q supply , i ( t ) , which is adjusted by the ICS to meet the requirements of [20] for voltage stabilization:
Q pot , inductive ( t ) = Q full uncomp ( t ) i = 1 n Q supply , i ( t ) = i = 1 n Q ICS , i ( t )   ,
Q pot , capacitive ( t ) = Q full comp ( t ) i = 1 n Q supply , i ( t ) = i = 1 n Q ICS , inst , i i = 1 n Q ICS , i ( t ) .
The tagout of compensation steps of the ICS leads to a more uncompensated, and thus, a higher inductive reactive power behavior of the industrial company. By switching off all compensation steps of the ICS, the full inductive power potential Q pot , inductive of the industrial company is applied and Q pot , full uncomp can be measured at the grid connection point. Switching in compensation steps results in an overcompensated behavior, and thus, in a higher capacitive reactive power behavior of the industrial company. By using all compensation steps, the installed reactive power of the ICS i = 1 n Q ICS , inst , i provides the full capacitive potential Q pot , capacitive . In this case, Q full comp appears at the grid connection point. Due to the coupling of P and Q, i = 1 n P supply , i ( t ) might change slightly. The active setting and change of the active power consumption at the regarded industrial companies is not the subject of this investigation. Furthermore, grid and asset capacity restrictions, grid losses and dynamic influencing factors (e.g., activation and decay time of the ICS), which diminish the reactive power potential technically, are not considered in (1)–(4).
In a survey, 73 industrial companies which are connected to the medium-voltage grid of two Bavarian DSOs were asked for their compensation strategies. The feedback of 35 companies exposed 16 companies (45.7%) with installed ICSs with a total capacitive reactive power potential of Q ICS , inst , total = 20 . 68   Mvar . To analyze the reactive power potential in relation to time and to active power consumption, six of these industrial companies with ICSs were measured over a period of several weeks (between 20 days and 242 days). Therefore, power and energy loggers were used to measure voltage, current and phase shift. Consequently, active and reactive power for each phase at measuring points according to Figure 1. Table 2 provides an overview of the six measured industrial companies. The maximum measured effective power consumption gives an impression about the size of the company. i = 1 n Q ICS , inst , i represents the total installed reactive power of all ICSs at the company. Based on the measurement data, the inductive and capacitive reactive power potential of these companies are calculated with (3) and (4) and are displayed by boxplots in Figure 2.
Every single regarded industrial company demonstrates a minimum capacitive reactive power potential of:
min ( Q pot , capacitive , Bi ( t ) )   0   , i = { 1 , 2 , 3 , 4 , 5 , 6 }
but no minimum inducive reactive power potential:
min ( Q pot , inductive , Bi ( t ) ) = 0 , i = { 1 , 4 , 5 , 6 }
at any time during the measurement period.
Minimal reactive power potentials (unequal to zero, as in (5)) can be securely provided (availability of 100%) for reactive power management processes in electrical grids (see Section 3) at any time, and are significant values regarding reactive power planning processes of grid operators. For a comprehensive evaluation of minimal reactive power potentials regarding seasonal and business interruption effects, a much larger (measurement) period, e.g., a whole year, has to be considered. For industrial companies with year-to-year effects on their reactive power consumption, e.g., as a result of volatile product demands, multiple years should be examined to achieve a representative measuring sample.
Figure 2 and Equation (6) show that B2 and B3 reveal a minimal inductive power potential unequal to zero which could be retrieved at any time. This effect is a result of the combination of two characteristics, namely:
  • base load consumers within their industrial grid, which obtain inductive reactive power and
  • continually switched-in compensation steps of the ICS.
An industrial company which operates inductive base load consumers can create an all-time available inductive reactive power potential by operating the ICS partially. This case does not necessarily mean that the reactive power behavior—or respectively, the full-uncompensated behavior of the company—is under-excited. (5) leads to the perception that the degree of utilization of the ICS is lower than 100% at all industrial companies at any time, which indicates the installed ICS reactive power may be somewhat larger than required.
B6 has the highest installed ICS reactive power of all measured companies by far. This leads to a much higher inductive and capacitive reactive power potential, which is presented separately in Figure 2. For this reason, B6 is analyzed in detail.
Figure 3 shows the time characteristics of the effective power consumption (black line) with scalation of the left Y-axis, as well as the full-uncompensated reactive power behavior (blue line) and the full-compensated reactive power behavior (orange line) of B6 for the month of December 2017 with scalation of the right Y-axis. The inductive reactive power potential Q pot , inductive , B 6 ( t ) and the capacitive reactive power potential Q pot , capactive , B 6 ( t ) , calculated by (3) and (4), are indicated by the arrows and correspond to the blue and orange areas. The correlation between Q supply , B 6 ( t ) of the industrial company and its effective power consumption and P effective , B 6 ( t ) is clearly observable. As a consequence of this and according to (3), the inductive reactive power potential correlates to the effective power consumption. Regarding (2), the capacitive reactive power potential also correlates to the effective power potential. Due to the negative sign of the capacitive reactive power potential, the relation to the effective power consumption can be interpreted as an anti-correlation. The Pearson Correlation Coefficient measuring the linear dependence between the reactive power potentials and the effective power consumption is 0.96.
As a result of the business interruption caused by Christmas holidays starting on 23 December 2017, the effective power consumption of B6 and, thus, its inductive power potential, drop to their minimum at the regarded period of time. The industrial company is not able to push its reactive power into the under-excited area. The amount of the capacitive potential rises to its maximum in this time. Figure 4 displays the relative frequency of the capacitive (left) and inductive (right) reactive power potential.
Three overlaid frequency distributions can be seen for each potential. They can be matched to three different types of days: holidays, weekends and working days. Due to business interruptions, machines and engines, which mainly cause the inductive reactive power behavior of B6, are turned right down or even stopped during holidays. Therefore, it is necessary to regard these points of time in order to determine the minimum inductive reactive power potential and the maximum capacitive reactive power potential. For establishing the minimum capacitive reactive power potential and the maximum inductive reactive power potential, working days should be investigated at companies whose production utilization is dependent on time.
For utilizing and developing the industrial reactive power potential, modalities for the cost compensation of reactive power generation must be clarified. In the context of a market-based provision of reactive power (Section 1) miscellaneous designs (e.g., auctions, tendering or bilateral agreements) are possible.

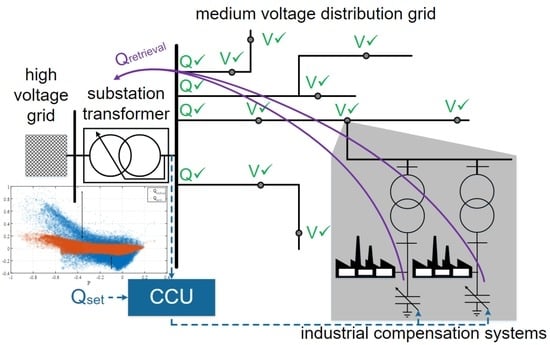
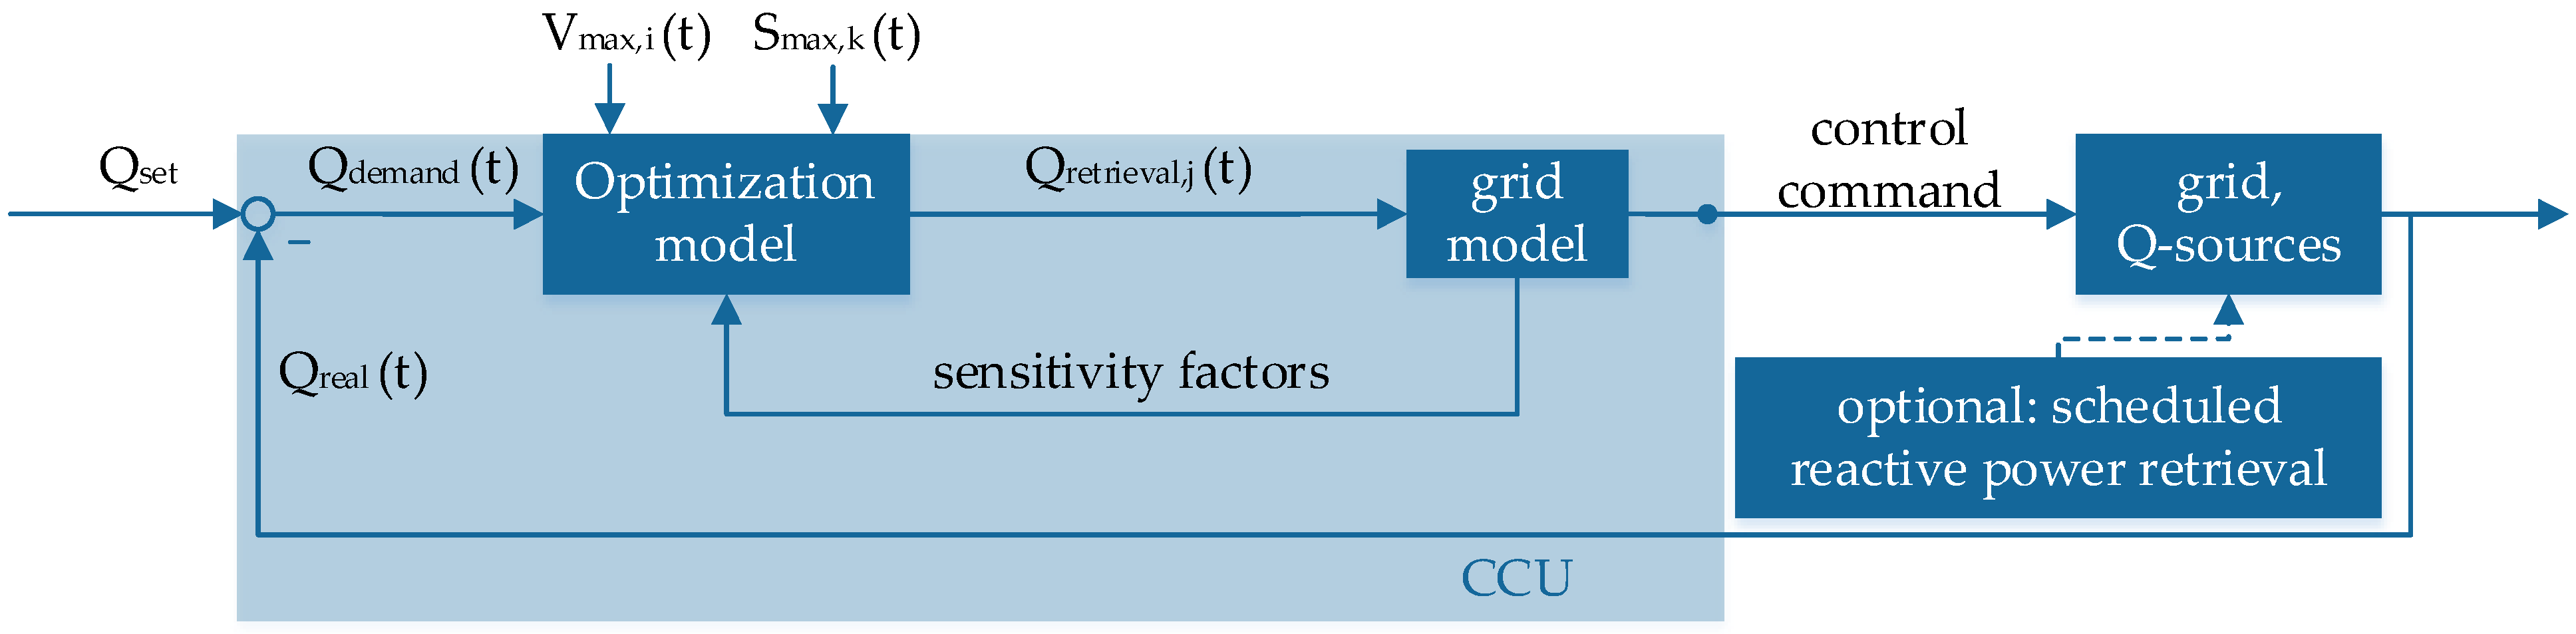
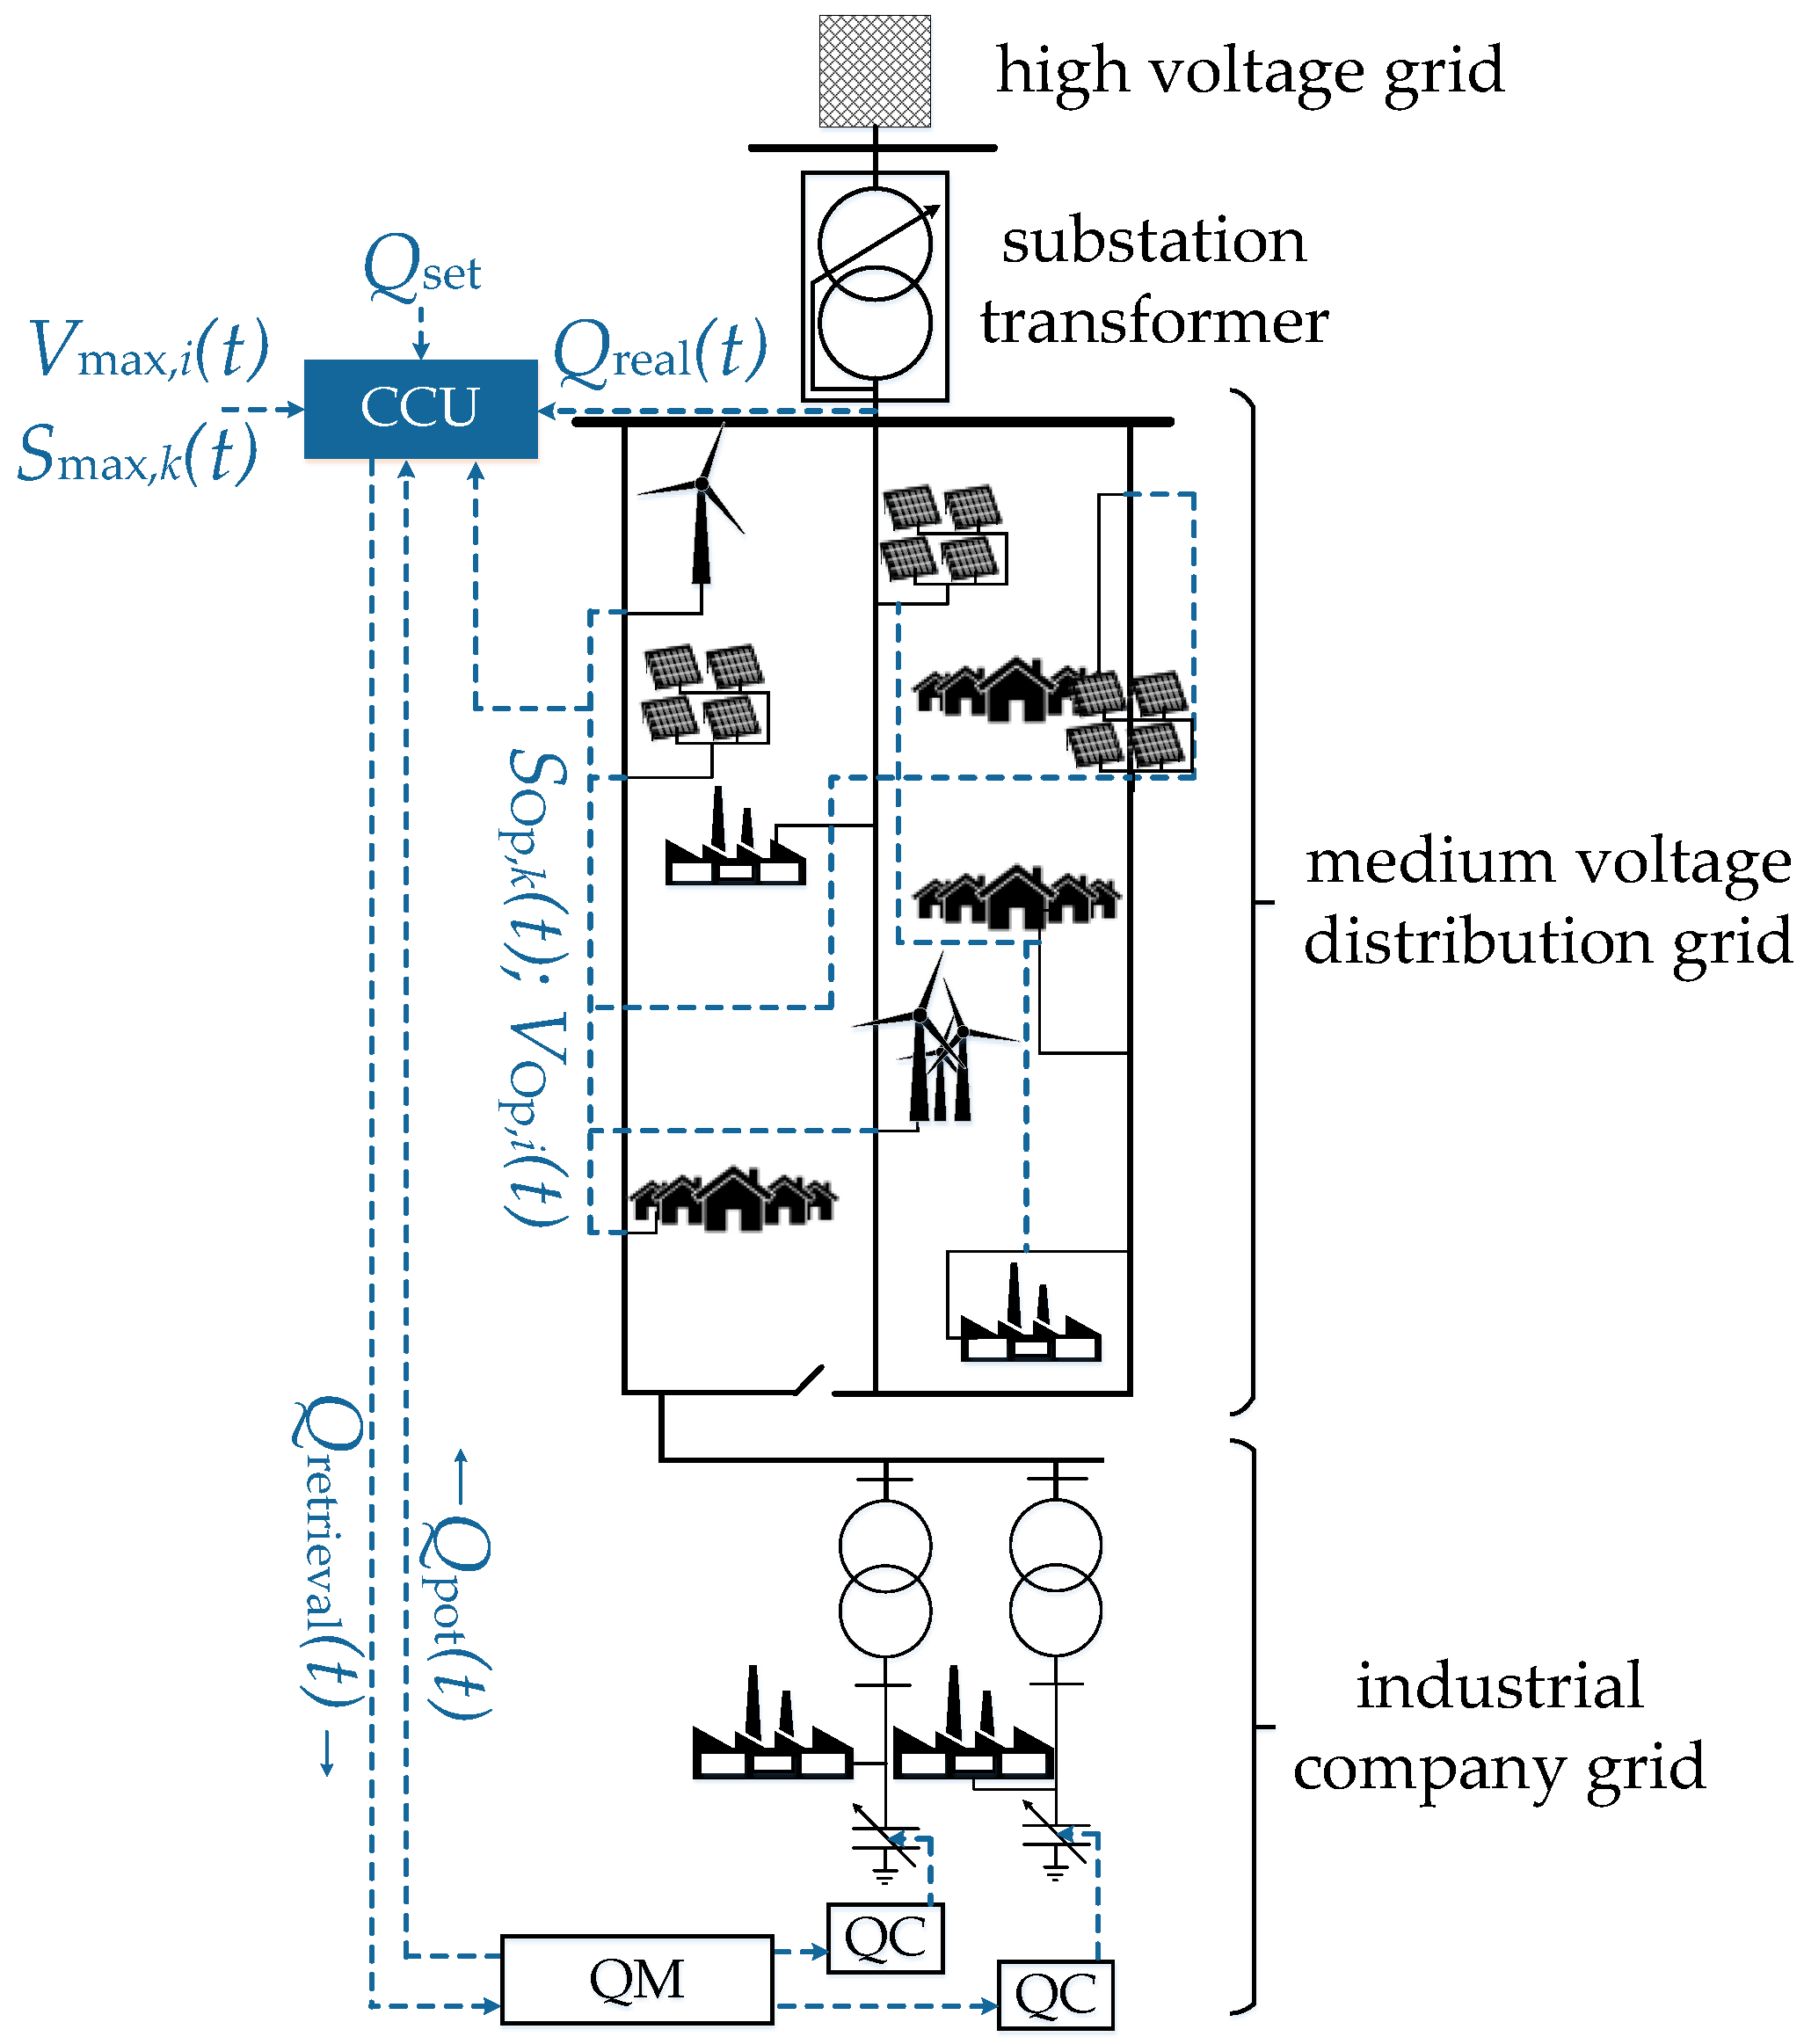
3. A Central Optimal Reactive Power Control Strategy

The central reactive power control strategy uses a central computing unit (CCU), including an optimization model, in order to control the reactive power retrieval from reactive power sources. Examples are industrial companies with ICS. Figure 5 the closed-loop control process. For continuous and grid state-dependent optimization (OPF strategy), an information and communication technology (ICT) between relevant grid nodes i, operating assets to be monitored k (e.g., transformer and power lines) and the CCU, is required in order to get the actual and local operating point voltages V OP , i ( t ) and apparent power flows   S OP , k ( t ) . The major input quantity for optimization calculations is the overall reactive power demand of the whole grid   Q demand ( t ) . This reactive power demand is the result of the difference between a predefined target value Q set and the current reactive power behavior of the regarded grid   Q real ( t ) :
Q demand ( t ) = Q set Q real ( t )   .
Q set can be a fixed value, dependent on time, voltage, active power of the grid, or further quantities. Q set = 0 entails the pursuit of full compensation of the medium-voltage grid [38].
By means of a grid model included in the CCU; load flow calculations are done in order to get sensitivity factors with regard to a reactive power injection   δ Q j :
( δ V i δ Q j ) : Voltage change on node i induced by a reactive power injection on node j;
( δ Q k δ Q j ) : Reactive power flow change at asset k induced by a reactive power injection on node j;
( δ P k δ Q j ) : Effective power flow change at asset k induced by a reactive power injection on node j (neglected in this work for simplification and linearity in the optimization model).
The CCU calculates the reactive power demand Q retrieval , j ( t ) of each reactive power source j, based on voltage limitations at each grid node V max , i ;   V min , i and load flow limitations at each asset S max , k ( t ) by linear programming (LP). At this point, the dependence of the sensitivity factors on the operating point in the load flow calculations must be considered. The load flow calculation can be formulated as a nonlinear problem [39]. The sensitivity factors can be calculated with the Jacobian Matrix, which is formulated by the Newton Raphson power flow equations [40]. With a change of the operating point, the sensitivity factors change in a nonlinear way [41]. For this reason, the calculated Q retrieval , j ( t ) will be set in the embedded grid model, which leads to a change of the operating point. The new sensitivity factors are looped back as input data in the optimization model for another iteration (see Figure 5). Thus, more accurate calculations are executed in order to avoid an overestimation of sensitivity factors, and to avoid exceeding voltage or load flow limitations. Following the calculations, the CCU sends control commands to the reactive power manager at the Q-sources (QM) in the grid, which report back their reactive power potential to the CCU as input data for the optimization (see Figure 5 and Figure 6). The ICT to the Q-sources should be very reliable. In case of failure of the ICT, a central control strategy will not work. A backup control strategy must be implemented in the plant controllers that works locally with decentralized scheduled or prediction methods (see [42,43]). In general, DSO must plan for temporary (unexpected) unavailabilities of the Q-sources. It is necessary that they provide enough reactive power capacities locally, which are able to compensate missing reactive power in case of failure of the Q-sources. The transfer speed of the ICT must be within the required retrieval control speed. The calculation time of the CCU and the response time of the Q-sources must also be considered here. The arising Q real ( t ) after the reactive power retrieval is looped back into the control process for a target/actual comparison according to (7).
Figure 6 illustrates the presented control system on an exemplary medium-voltage grid with an industrial company, including two plants with one ICS each as a reactive power source. Q retrieval , j ( t ) is calculated for each Q-source j and transmitted to their QM, which splits the reactive power demand for each plant and sends an appropriate signal to the ICS reactive power controller (QC).
The linear optimization model is based on an optimal power flow strategy. Its aim is to adapt the reactive power retrieval from the reactive power sources to the reactive power demand of the regarded grid. This results in the optimization of the reactive power flow to higher grid levels (optimization for DSO). According to [38], the aim can be formulated with the objective function (8), which maximizes the reactive power retrieval together with an overcompensation restriction (10):
maxf ( x j ( t ) ) = ( | Q retrieval ( t ) | = j = 1 n | Q pot , j ( t ) | · x j ( t )   ) .
The decision variables are x j ( t ) , which can be interpreted as activation coefficients of the n reactive power sources:
x j ( t ) = Q retrieval , j ( t ) Q pot , j ( t ) ,   0     x j ( t )     1 ; j = 1 ,   2 , , n   .
Using the maximum of the reactive power potential of the ICS is the objective in (8), with consideration of the reactive power compensation demand of the hosted medium-voltage grid. Therefore, the overcompensation restriction for limitation of the reactive power retrieval in adaption to the actual demand of the medium-voltage grid is introduced:
j = 1 n | Q pot , j ( t ) | · x j ( t ) = | Q retrieval ( t ) |     | Q demand ( t ) |
Using the absolute values, the case of an inductive reactive power retrieval is covered. The inequality constraints can be formulated with the canonic form:
A ( t )   ·   x j ( t )     b ( t )   ;   A R m × n ;   b   ϵ   R m
with:
A ( t ) : matrix of coefficients;
b ( t ) : vector of coefficients containing maximum values.
In order to adhere the upper and lower voltage limitations at the grid nodes, (12) and (13) are defined as inequality constraints of the optimization model:
j = 1 n ( δ V i δ Q j ) ( t ) · ( Q pot , j ( t ) ) · x j ( t )     V max , i V OP , i ( t ) , i = 1 ,   2 , , p ,
j = 1 n ( ( δ V i δ Q j ) ( t ) · ( Q pot , j ( t ) ) · x j ( t ) )     + ( t ) , i = 1 ,   2 , , p .
For adherence of the load flow limitations (14) is introduced:
j = 1 n ( δ Q k δ Q j ) ( t ) · | Q pot , j ( t ) | · x j ( t )     Q max , k Q OP , k ( t )
with:
Q max , k = ( S max , k · SB k ) 2 P OP , k ( t ) 2   , k = 1 ,   2 , , q .
The impact of the reactive power injection on the effective power flows is usually very low compared to the change on reactive power flows [44]. For linearity, effective power sensitivities are neglected in (14). With SB k , a planning safety buffer can be applied to the thermal apparent power capacity of assets S max , k . In case of negative values in b ( t ) , the dual simplex algorithm is applied to solve the presented optimization problem. For further details concerning the formulation of the optimization model, the simulation process and first application examples, see [38,43,44].
In addition to central reactive power control systems, decentralized control systems exist as well, which work with locally available quantities as command variables. Q demand ( t ) is predicted by methods from [42]. An ICT is not necessary in this approach. For details, see [43].
The proposed model describes a technical optimization for reactive power compensation in distribution grids. Regarding reactive power generation costs, some of the following strategies may be used in future works:
  • transforming the model to an economic optimization by changing the objective function to a minimization of the costs of Q retrieval ( t ) and setting the compliance of the reactive power exchange as a restriction;
  • setting cost limits by modelling additional restrictions;
  • using multi-objective techniques; or
  • performing economical optimization afterwards.

4. An Application Example

In this Section, the measured reactive power potential (Section 2) and the development strategy (Section 3) are merged. The main objects of this simulation-based investigation are:
  • Analysis of the functionality at steady-state conditions and achieving the reactive power objectives and
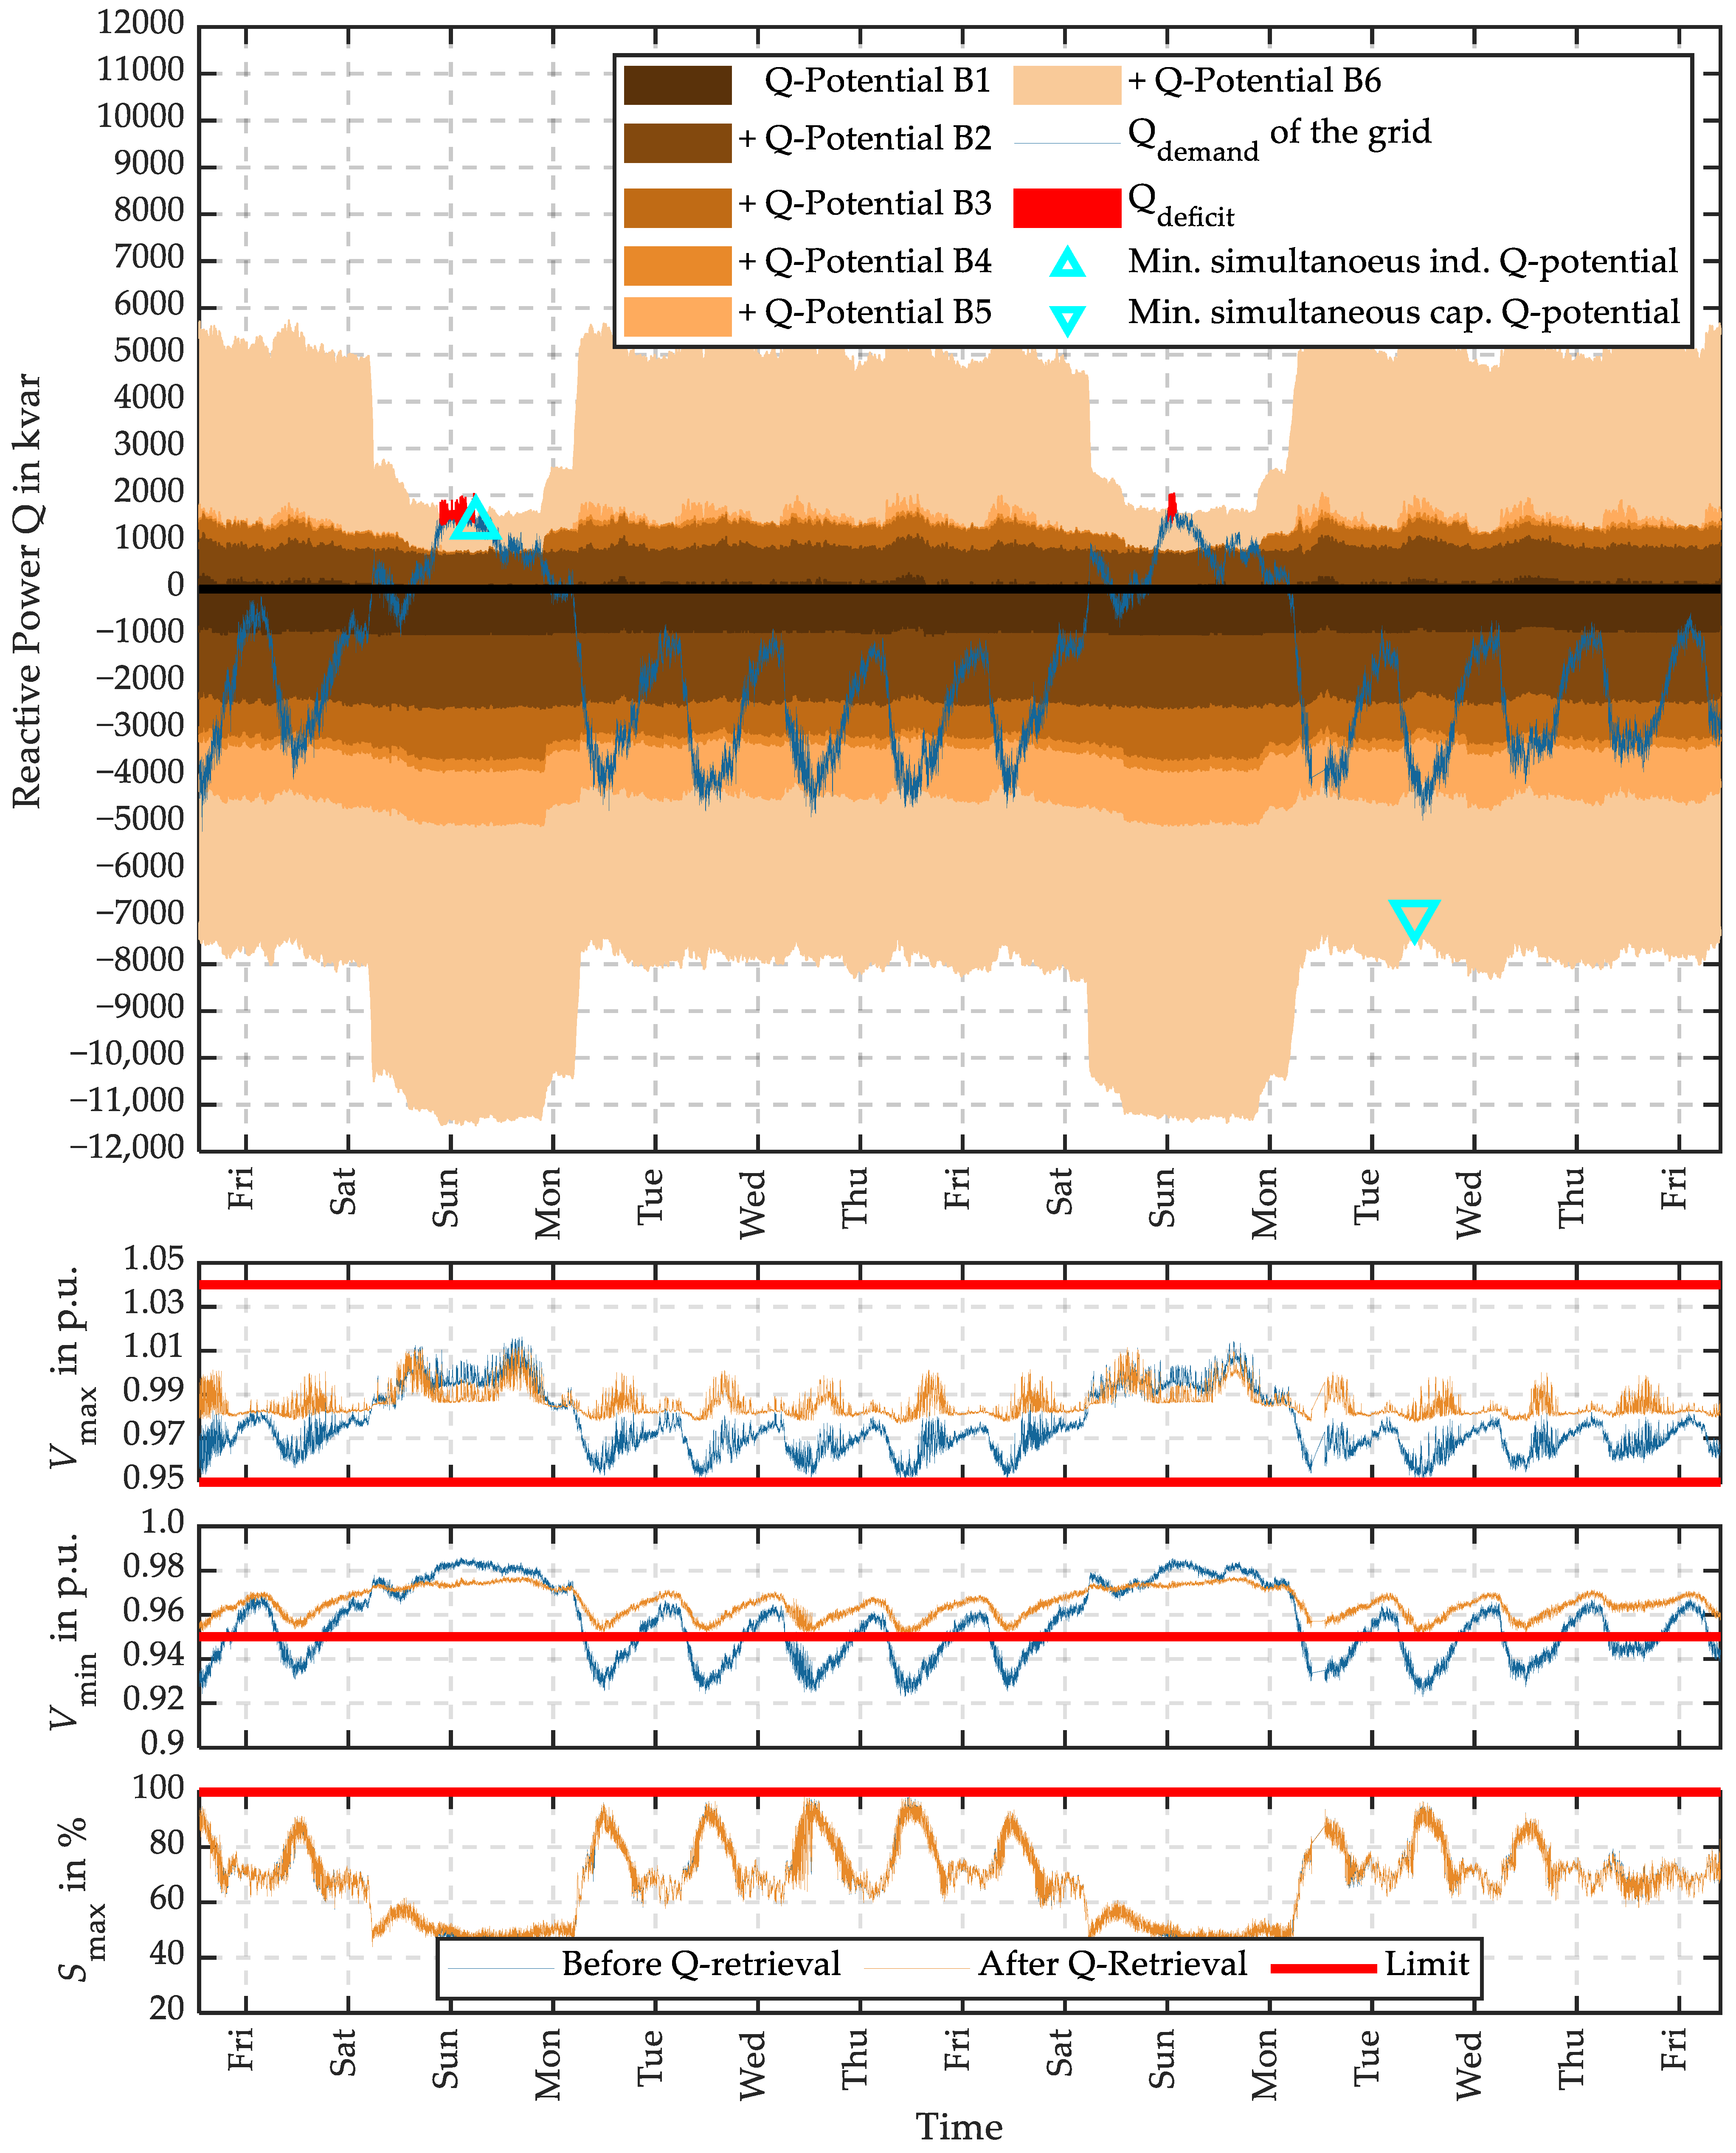
  • Impact on and compliance of the voltage limitations and load flow capacities.

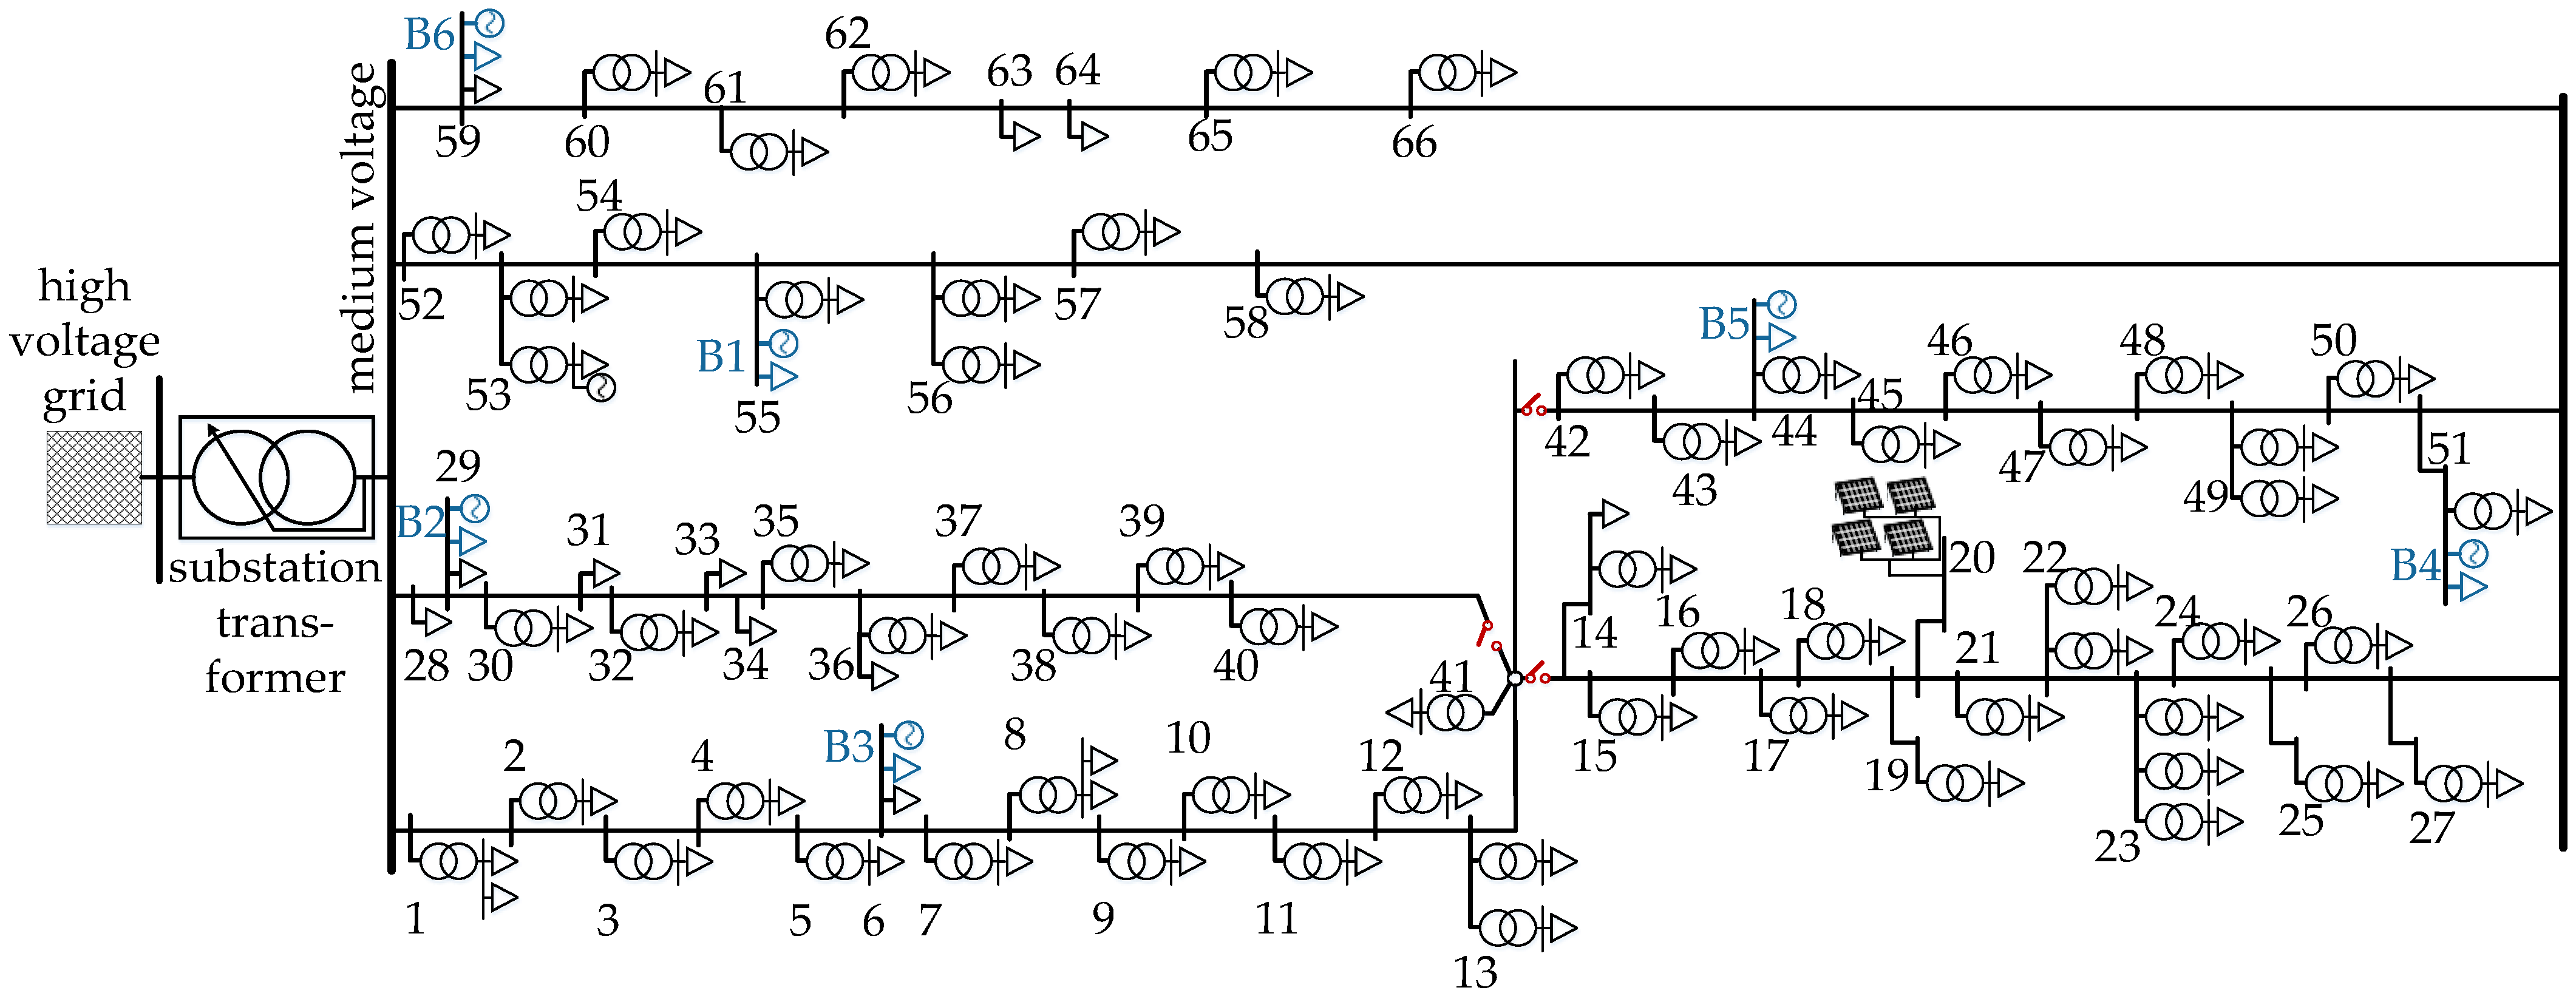
4.1. Description of the Simulation Parameters

The centralized optimal reactive power control strategy is applied in a genuine existing 66-busbar medium-voltage system. There are multiple reasons for selection of this test system:
  • existence of real measured P- and Q-data with a 10-second resolution for each low-voltage load and generation unit, which are implemented in the grid model.
  • The grid topology is a typical medium-voltage ring structure and
  • the territory of supply is a rural industry area with high load penetration and a typical environment of the six measured industrial companies
The medium-voltage test system supplies a territory of 46.6 km2. The grade of cabling amounts 66.9% at a total power line length of 68.1 km. The nominal apparent power of the substation transformer is 25 MVA. The six measured industrial companies with their presented reactive power potential (Figure 2) are implemented randomly into the grid model. The grid topology and the location of the six industrial Q-sources are illustrated in Figure 7.
It is assumed that all six industrial companies with ICSs can perform the reactive power retrieval within this time. To confirm this thesis, dynamic simulations within small time scales and different operating conditions are necessary to analyze the transient behavior of the reactive power compensation in future works.
For standardization, the measured reactive power potential of the six industrial companies (Table 2) are adapted to the 10-second resolution by arithmetic averaging or linear interpolation. The regarded simulation period of time includes two exemplary weeks (14 consecutive days) in July, 2017. The simulation is carried out by steady state load flow calculations, which means that at every point of time, a load flow calculation with optimization according to the method in Section 3 is calculated. The slack node is defined at the high-voltage side of the transformer; all other busses are load busses with PQ data. Figure 8 provides maxima (or minima) P and Q values at the load buses regarding the simulation period of time (slave pointer values).
The main objective of this application is the pursuit of full compensation of the whole medium-voltage grid, tolerating a control deviation e of exemplary 100 kvar (under- and over-excited):
Q set = 0   kvar   with   e = ± 100   kvar .
The voltage limitations of each medium voltage node with a down-streaming low-voltage grid are set to:
V max , LVgrids = 1.04 · V nom ;   V min , LVgrids = 0.95 · V nom
regarding the nominal voltage V nom , which is 20 kV in the examined grid, to ensure the voltage boundaries in the low-voltage grid [45]. For medium-voltage nodes, which are connection points to grid consumers directly, e.g., industrial companies, the whole-voltage bandwidth according to [45] is applied:
V max , LVgrids = 1.1 · V nom ;   V min , LVgrids = 0.9 · V nom
With SB k = 1 , according to (15), the load flow capacity of all medium-voltage power lines in the grid can be used entirely.

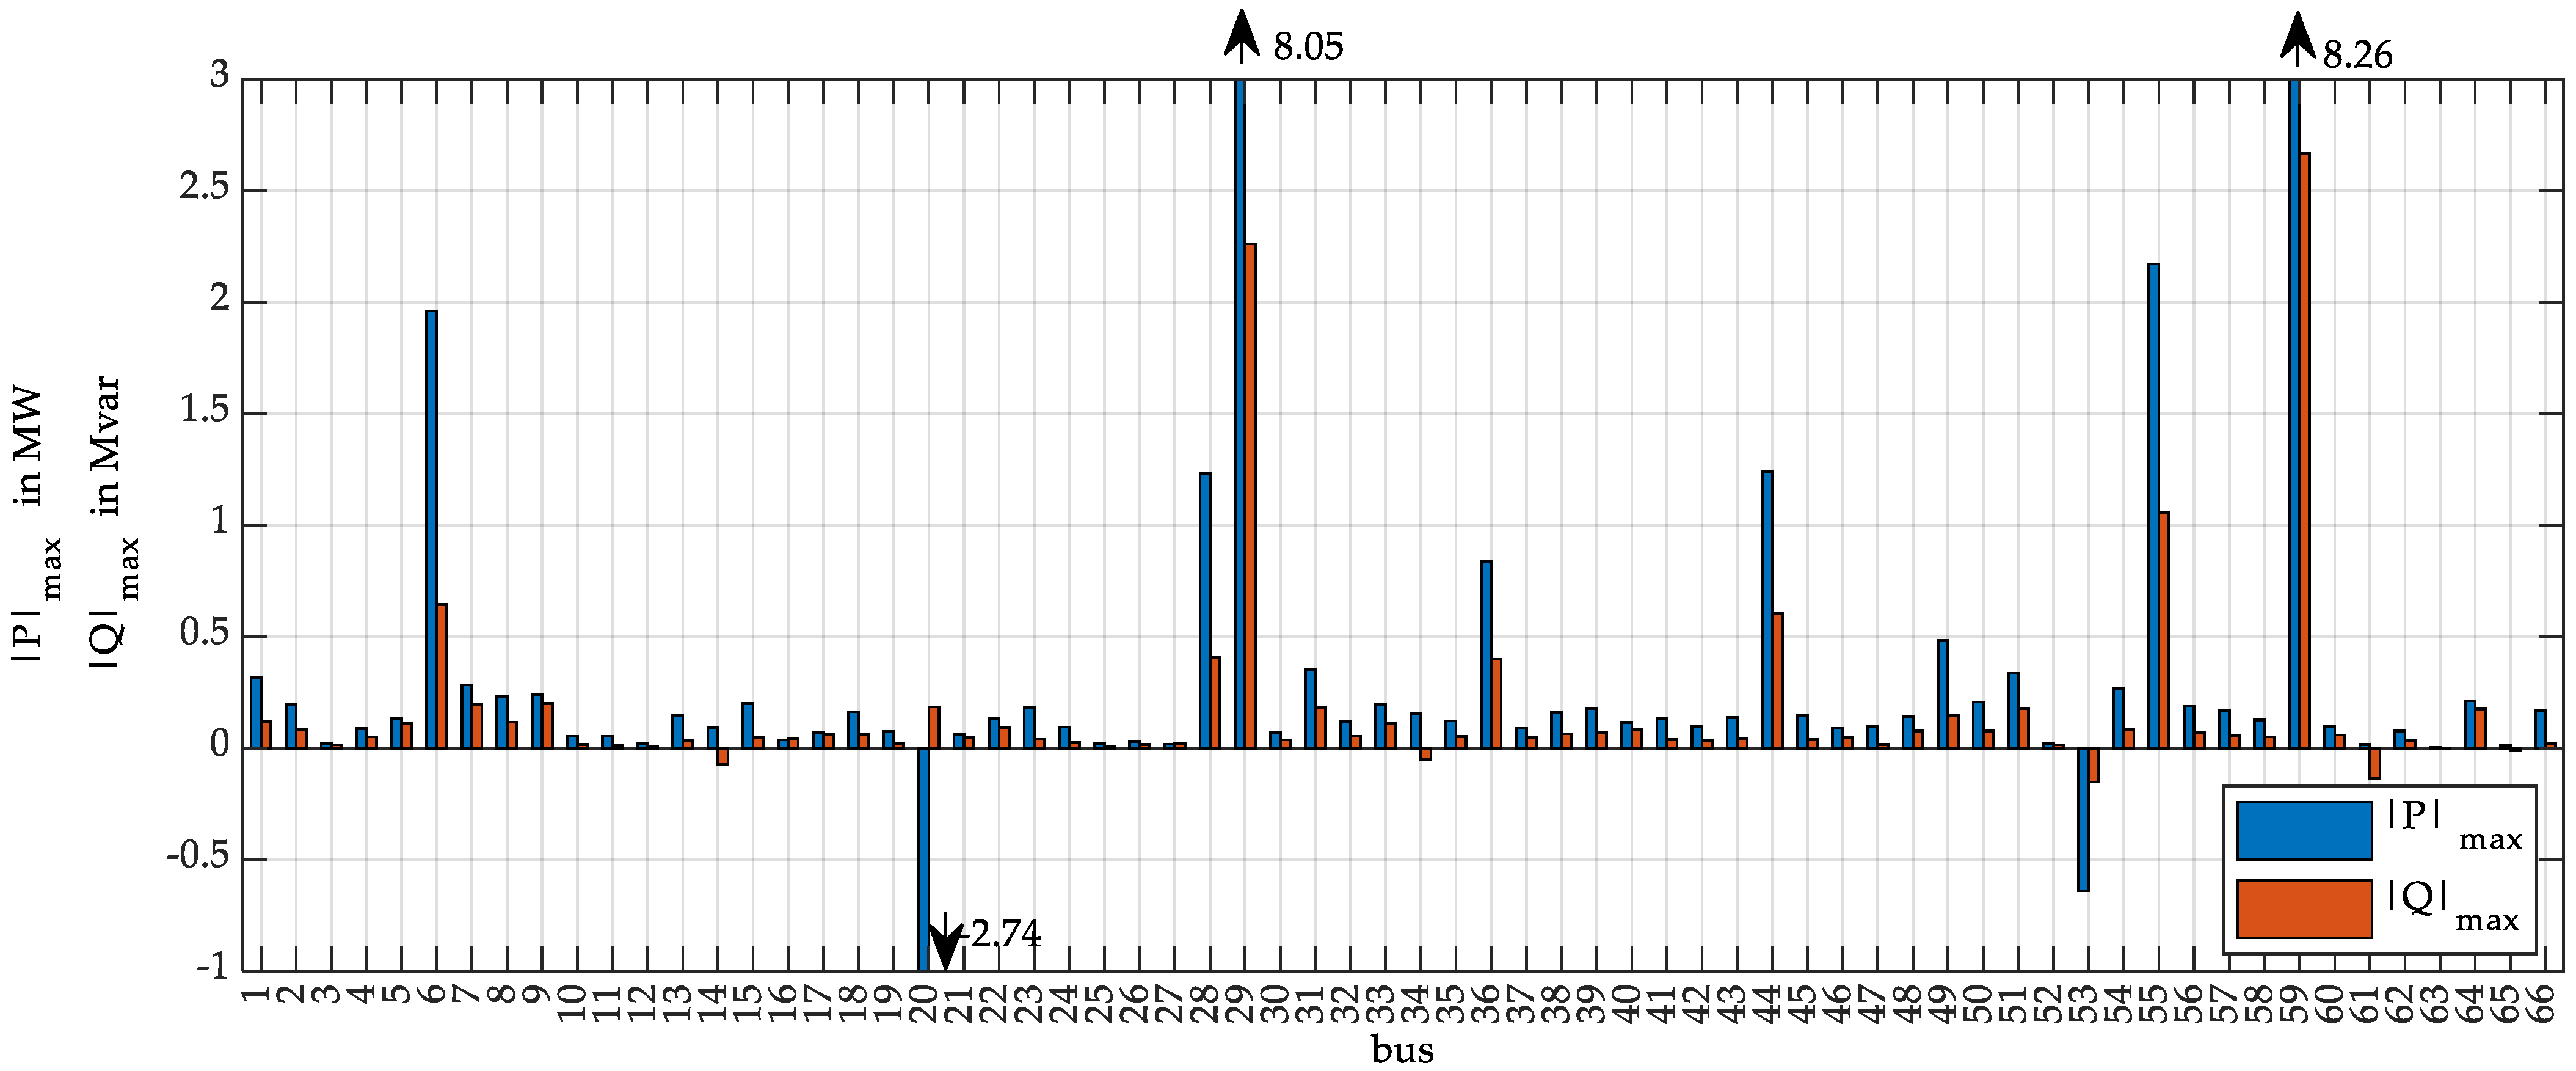
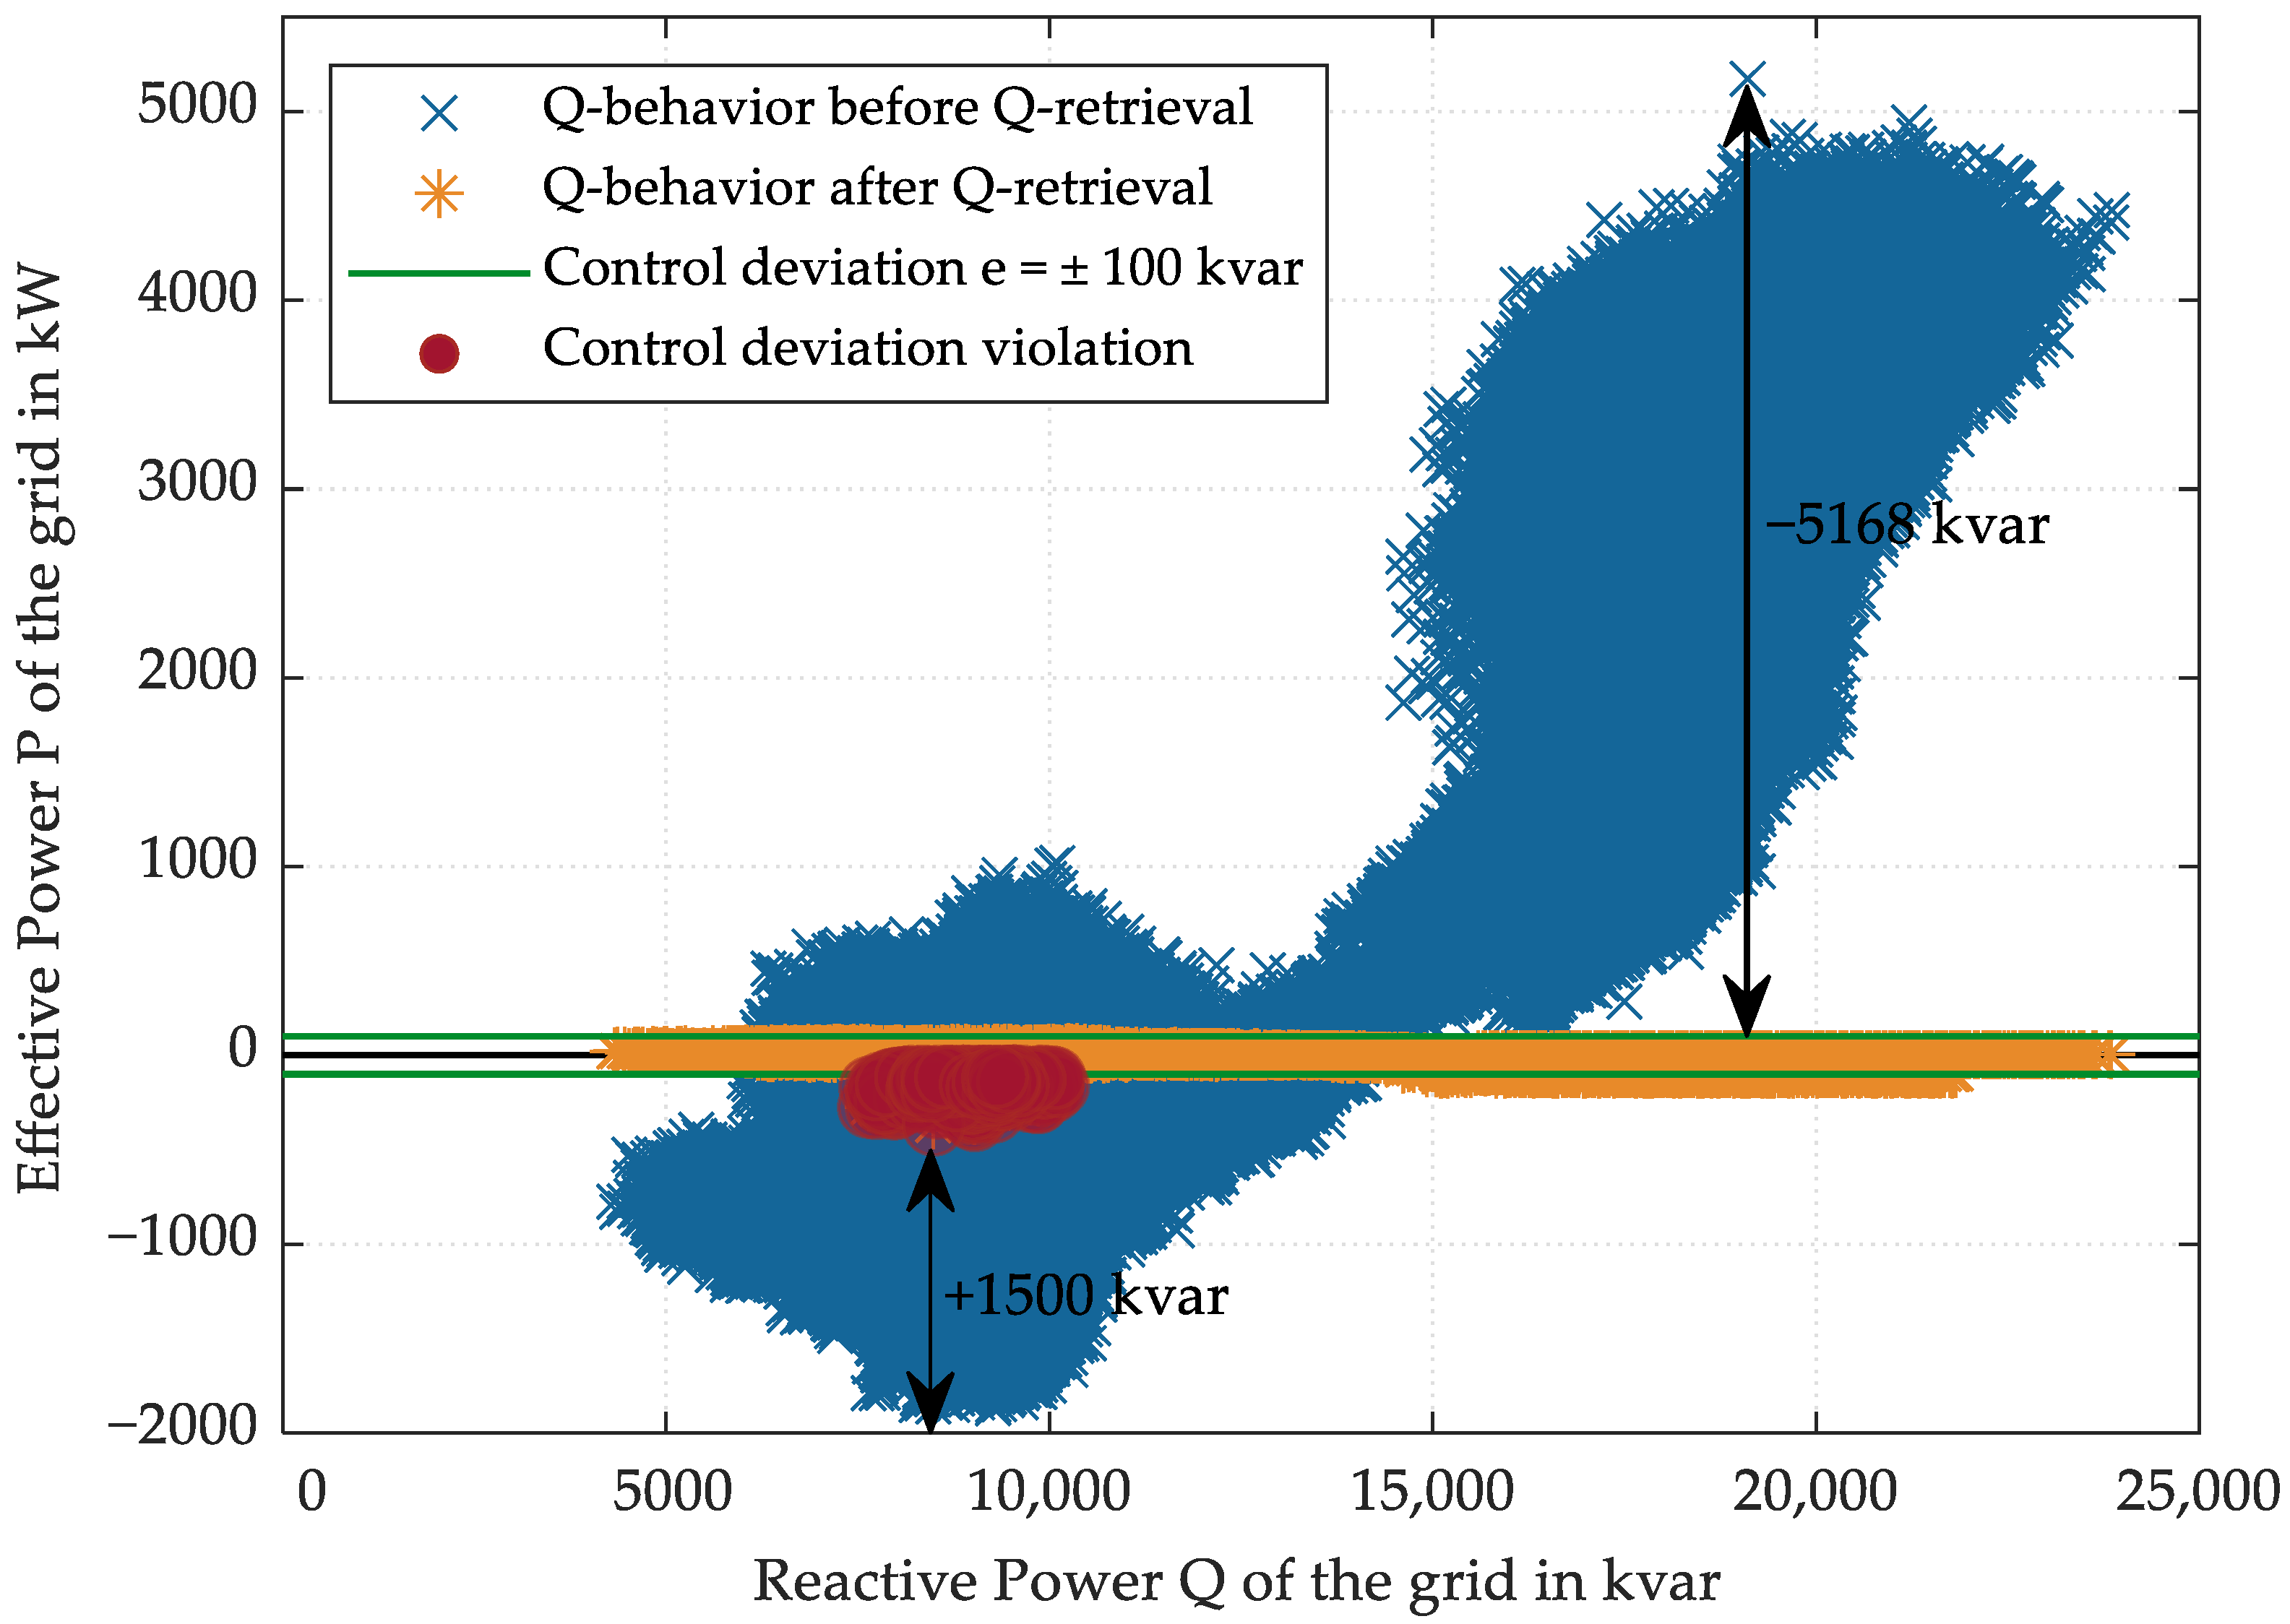
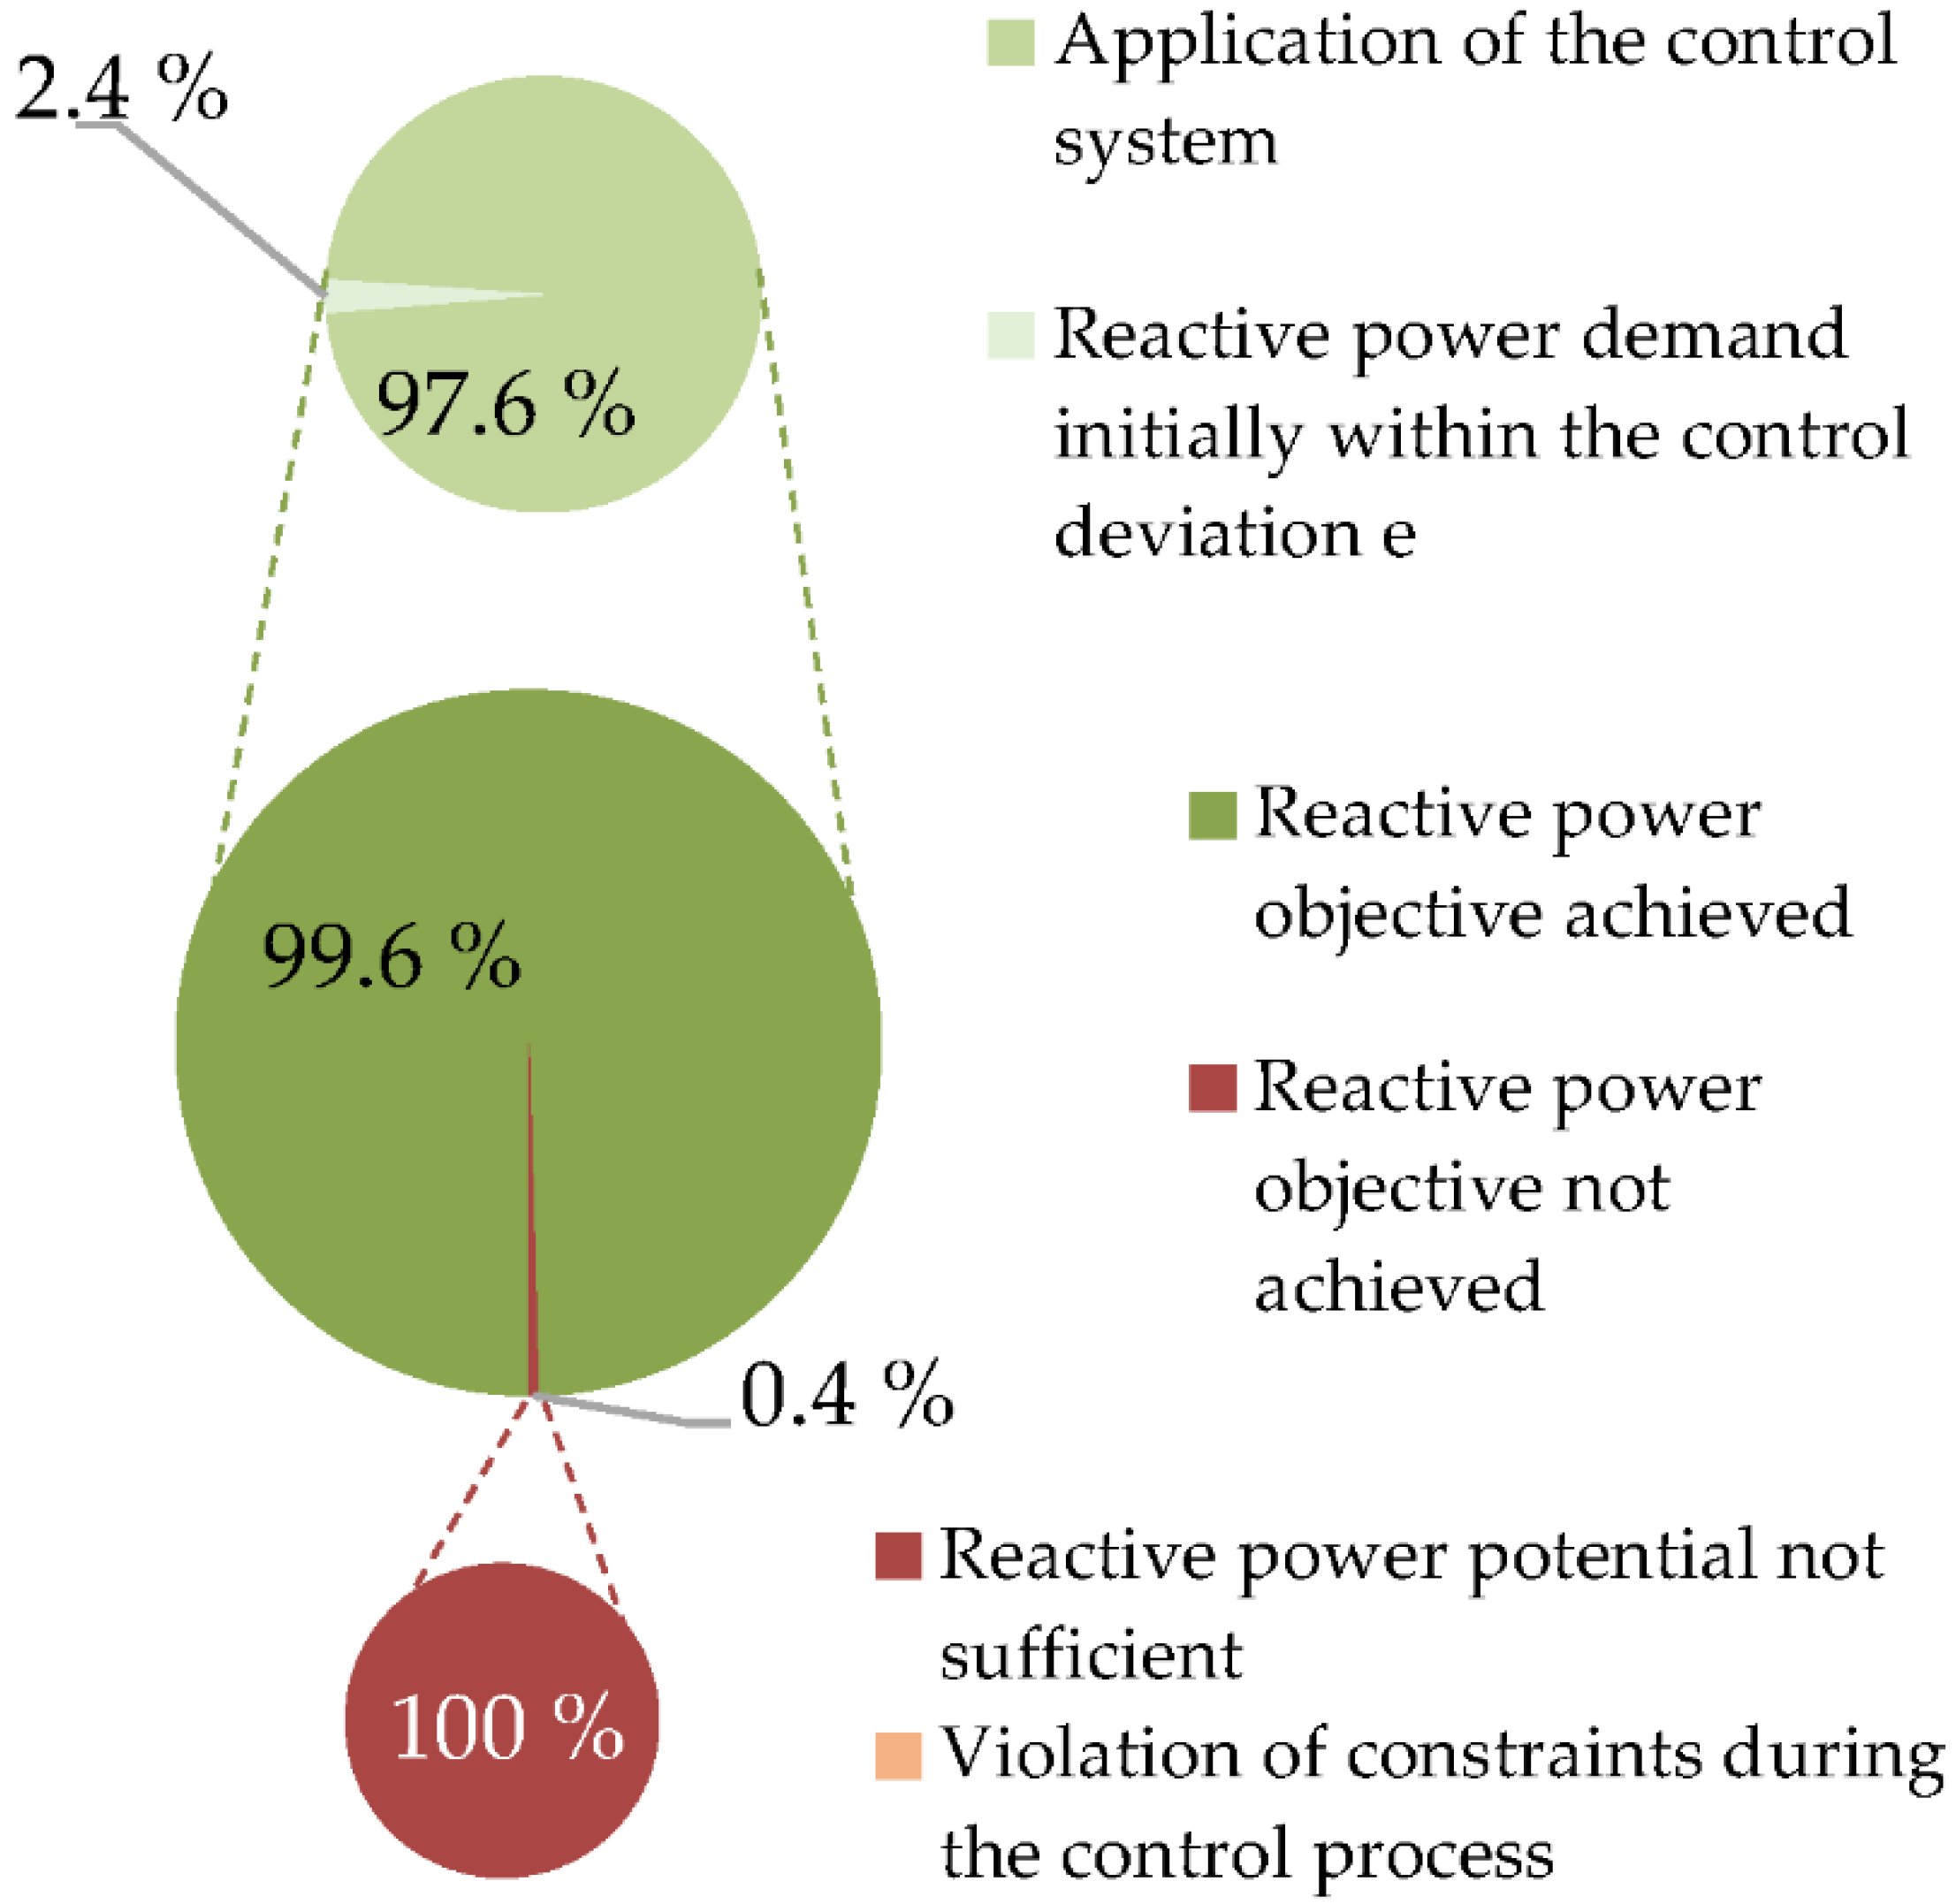
4.2. Presentation of the Achievements

Figure 9 shows the P–Q behavior of the regarded grid before (x, blue), and after (*, orange) application of the reactive power control system. It can evidently be stated, that the operating points are located in quadrant I and IV, which characterizes the grid as load-intensive with less generation power. There is no feedback to the upstreaming high-voltage grid at any time.
The figure shows the impact on the reactive power behavior. The under-excited behavior can be reduced by 5168 kvar, the over-excited behavior can be diminished by 1500 kvar. The reasons for control deviation violations and missing the objective of full-compensation are presented in Figure 10. By comparison of the amount of the minimal non-simultaneous reactive power potential of all six industrial companies (see Figure 2) and the minimal simultaneous reactive power potential (Table 3; Figure 11: blue marked triangles), an increase of the inductive potential by 118.2% and an increase of the capacitive potential by 16.1% caused by stochastic superposition is recognizable. In this application, a slightly higher inductive minimal compensation effect of 135.8% compared to the non-simultaneous potential is noticeable. The reasons for this are interactions of the reactive power retrieval with the grid assets, where under-excited reactive power behavior becomes increased. The additional reactive current load leads to higher inductive reactive power flows. For the capacitive compensational effect, only 74.3% of the minimal simultaneous potential (−6955 kvar) is necessary for full compensation.
For the capacitive Q-retrieval, the control deviation can be adhered for every single operating point. However, deficits can be observed for the inductive Q-retrieval (see Figure 9: red-circled data points; Figure 11: red area).
In 99.6% of all grid operating points, a full-compensation in consideration of e can be achieved. In few cases (2.4%), the reactive power behavior of the grid is already within e. The reason for non-achievement in 0.4% of all grid operating points is a non-sufficient potential by the industrial companies (see Figure 11: red areas). A violation of voltage or load flow constraints caused by the control process is not recognizable, which is shown in Figure 11.

4.3. Review of the Constraints

Figure 11 gives an overview of the reactive power potential in comparison to the reactive power demand of the grid and shows the compliance of the voltage and load flow limitations by presenting the maximum and minimum voltage, plus the maximum occurring apparent power capacity in the grid.
Due to the central reactive power-control process, the voltage situation is improved by reducing the voltage during weekends and increasing the voltage during working days. The last effect even leads to the compliance of V min , LVgrids in (17). There is nearly no effect on the maximum occurring apparent power capacity of power lines. The robustness of the process with respect to the compliance of various and stricter limitations is not the object of this report, but can be retraced at [43,44].

5. Conclusions

Industrial companies with compensation systems such as capacitor banks evince useful reactive power potentials, which might be integrated in grid operating and planning processes for voltage-stabilization aspects in distribution grids. This paper presents measurement concepts, calculation methods and developing strategies for industrial reactive power potentials. The availability and amount of the reactive power potential of six exemplary and genuine measured medium-voltage industrial companies with industrial compensation systems is quantified. All companies exhibit a certain capacitive reactive power potential, which can be securely provided at any time. At a singular industrial company, an inductive reactive power potential of up to 4 Mvar and a capacitive reactive power potential of up to 7 Mvar may be evidenced. Further, this paper shows that due to stochastic superposition, the minimal simultaneous reactive power potential and compensation effect can be increased significantly (in the application example up to 35.8%). The decentralized reactive power potential of industrial companies, but also energy plants or other reactive power sources, may be developed by the presented sensitivity-based optimal reactive power flow control system. The control strategy exploits the existing potential by meeting the reactive power demand of the whole medium-voltage grid. The compliance of voltage and load flow limitations is monitored. For this purpose, an information and communication technology to the reactive power sources (including backup strategies in case of failure), critical grid nodes and assets is necessary.
For procuring industrial reactive power potential, the costs for provision should be compensated. Therefore, market-based mechanisms must be developed by the responsible national regulatory authority. The presented reactive power potential control strategy includes a mathematical optimization from a technical grid-compliant perspective. Involving reactive power generation costs of industrial companies, adaptions or enhancements of the optimization model must be carried out in further studies to guarantee an economical reactive power dispatch.
For evaluation, the reactive power control strategy is applied in a genuine existing 66-busbar medium-voltage system, which represents a typical topology and load/generation penetration of a rural industrial grid supply area. The results show that a major part of the reactive power demand of an entire medium-voltage distribution grid can be fully compensated in 99.6% of the grid use cases at steady-state conditions. The results are based on steady-state load flow simulations with a 10-second resolution. Dynamic simulations in smaller time scale analysis should be carried out in future works to investigate the transient behavior of the reactive power compensation under different operating conditions before utilization in a real environment. Compensational deficits result from the non-sufficient inductive reactive power potential of the regarded industrial companies during weekends. The voltage extremes can be improved during the control process. Thus, the integration capacity of the grid can be increased. The assurance of compliance of voltage and load-flow limitations is demonstrated.

Author Contributions

Conceptualization, J.R. and O.B.; methodology, J.R.; software, J.R.; validation, J.R.; formal analysis, J.R.; investigation, J.R.; resources, O.B.; data curation, J.R.; writing—original draft preparation, J.R.; writing—review and editing, J.R. and O.B.; visualization, J.R.; supervision, O.B.; project administration, O.B.; funding acquisition, J.R. and O.B. All authors have read and agreed to the published version of the manuscript.

Funding

This research was funded by the Federal Ministry for Economic Affairs and Climate Action within the research project SyNErgie [43], grant number 03ET7537E, on the basis of a decision by the German Bundestag and by the Ostbayerische Technische Hochschule (OTH) Regensburg. Electricity 04 00006 i001

Data Availability Statement

Not applicable.

Conflicts of Interest

The authors declare no conflict of interest. The funders had no role in the design of the study; in the collection, analyses, or interpretation of data; in the writing of the manuscript; or in the decision to publish the results.

References

  1. The German Bundestag. Renewable Energy Sources Act (EEG 2021); Federal Ministry of Justice: Berlin, Germany, 2022.
  2. The German Bundestag. Atomic Energy Act on the Peaceful Utilization of Atomic Energy and the Protection against Its Hazards (AtG); Federal Ministry of Justice: Berlin, Germany, 2021.
  3. The German Bundestag. Coal–Fired Power Generation Termination Act (KVBG); Federal Ministry of Justice: Berlin, Germany, 2021.
  4. 50Hertz Transmission GmbH; Amprion GmbH; Tennet TSO GmbH; TransnetBW GmbH. Bewertung der Systemstabilität, Begleitdokument zum Netzentwicklungsplan Strom 2030, Version 2019, zweiter Entwurf; 50Hertz Transmission GmbH: Berlin, Germany; Amprion GmbH: Dortmund, Germany; Tennet TSO GmbH: Bayreuth, Germany; TransnetBW GmbH: Stuttgart, Germany, 2019. (In German) [Google Scholar]
  5. The European Parliament and the Council of the European Union. Directive (EU) 2019/944 of the European Parliament and of the Council of 5 June 2019 on Common Rules for the Internal Market for Electricity and Amending Directive 2012/27/EU; Official Journal of the European Union: Brussel, Belgium, 2019.
  6. The European Parliament and the Council of the European Union. Regulation (EU) 2019/943 of the European Parliament and of the Council of 5 June 2019 on the Internal Market for Electricity; Official Journal of the European Union: Brussel, Belgium, 2019.
  7. The German Bundestag. German Energy Industry Act (EnWG); Federal Ministry of Justice: Berlin, Germany, 2022.
  8. Zhang, W.; Tolbert, L.M. Survey of reactive power planning methods, Institute of Electrical and Electronics Engineers. IEEE Power Eng. Soc. Gen. Meet. 2005, 2, 1430–1440. [Google Scholar]
  9. Zhang, W.; Li, F.; Tolbert, L.M. Review of Reactive Power Planning: Objectives, Constraints, and Algorithms. IEEE Trans. Power Electron. 2007, 22, 2177–2186. [Google Scholar] [CrossRef] [Green Version]
  10. Soma, G.G. Optimal Sizing and Placement of Capacitor Banks in Distribution Networks Using a Genetic Algorithm. Electricity 2021, 2, 187–204. [Google Scholar] [CrossRef]
  11. Yuvaraj, T.; Devabalaji, K.R.; Prabaharan, N.; Haes Alhelou, H.; Manju, A.; Pal, P.; Siano, P. Optimal Integration of Capacitor and Distributed Generation in Distribution System Considering Load Variation Using Bat Optimization Algorithm. Energies 2021, 14, 3548. [Google Scholar] [CrossRef]
  12. Kingston, R.; Baghzouz, Y. Power factor and harmonic compensation in industrial power systems with nonlinear loads. In Proceedings of the Industrial and Commercial Power Systems Conference, Irvine, CA, USA, 1–5 May 1994. [Google Scholar]
  13. Ekel, P.; Ansuj, S.; Schinzinger, R.; Prakhovnik, A.; Razumovsky, O. Automation of reactive power compensation in industrial power systems. In Proceedings of the IEEE International Conference on Control and Applications, Glasgow, UK, 24–26 August 1994. [Google Scholar]
  14. Putman, R.E.; Huff, F.C.; Pal, J.K. Optimal reactive power control for industrial power networks. IEEE Trans. Ind. Appl. 1999, 35, 506–514. [Google Scholar] [CrossRef]
  15. Glöckler, C.; Harms, Y.; Hau, M.; Jost, D.; Löwer, L.; Stock, D.; Wecker, M.; Wessel, A. IMOWEN-Integration großer Mengen On- und Offshore erzeugter Windenergie in das elektrische Netz durch intelligente Netzanalyse und Clusterbetriebsführung: Schlussbericht; Fraunhofer-Institut für Energiewirtschaft und Energiesystemtechnik IEE: Kassel, Germany, 2018. (In German) [Google Scholar]
  16. Małaczek, M.; Wasiak, I. Control of low voltage microgrid in autonomous operation mode. In Proceedings of the 2016 Electric Power Networks (EPNet), Szklarska Poreba, Poland, 19–21 September 2016. [Google Scholar]
  17. Andrychowicz, M.; Olek, B. Energy storing vs. generation curtailment—The measures for controlling renewable generation. In Proceedings of the 2017 14th International Conference on the European Energy Market (EEM), Dresden, Germany, 6–9 June 2017. [Google Scholar]
  18. Grab, R.; Köppe, H.; Schuster, M. PV-Wind-Symbiose-Ausnutzung der sich ergänzenden Eigenschaften von PV- und Wind-Kraftwerken hinsichtlich Spannungsqualität und der Bereitstellung von Wirk- und Blindleistung: Schlussbericht zum Verbundvorhaben; Fraunhofer ISE: Freiburg im Breisgau, Germany, 2019. (In German) [Google Scholar]
  19. VDE-AR-N 4105:2018-11; Generators Connected to the Low-Voltage Distribution Network-Technical Requirements for the Connection to and Parallel Operation with Low-Voltage Distribution Networks. FNN: Berlin, Germany, 2018.
  20. VDE-AR-N 4110:2018-11; Technical Requirements for the Connection and Operation of Customer Installations to the Medium Voltage Network (TAR Medium Voltage). FNN: Berlin, Germany, 2018.
  21. VDE-AR-N 4120:2018-11; Technical Requirements for the Connection and Operation of Customer Installations to the High Voltage Network (TAR High Voltage). FNN: Berlin, Germany, 2018.
  22. Brückl, O.; Haslbeck, M. Beitrag industrieller Blindleistungs-Kompensationsanlagen und -Verbraucher für ein innovatives Blindleistungs-Management in der Stromversorgung Deutschlands; ZVEI-Zentralverband Elektrotechnik- und Elektronikindustrie e. V., Fachverband Starkstromkondensatoren: Frankfurt, Germany, 2013. (In German) [Google Scholar]
  23. Carpentier, J. Contribution á l’étude du dispatching économique. Bull. Société Fr. Électriciens 1962, 3, 431–447. (In French) [Google Scholar]
  24. Dommel, H.; Tinney, W. Optimal Power Flow Solutions. IEEE Trans. Power Appar. Syst. 1968, 87, 1866–1876. [Google Scholar] [CrossRef]
  25. Stephen, F.; Steponavičė, I.; Rebennack, S. Optimal Power Flow: A bibliographic survey I. Energy Syst. 2012, 3, 221–258. [Google Scholar]
  26. Stephen, F.; Steponavičė, I.; Rebennack, S. Optimal Power Flow: A bibliographic survey II. Energy Syst. 2012, 3, 259–289. [Google Scholar]
  27. Buksh, W.; Grothey, A.; McKinnon, K.I.M.; Trodden, P.A. Local Solutions of the Optimal Power Flow Problem. IEEE Trans. Power Syst. 2013, 28, 4780–4788. [Google Scholar] [CrossRef] [Green Version]
  28. Qiu, Z.; Deconinck, G.; Belmans, R. A literature survey of Optimal Power Flow problems in the electricity market context. In Proceedings of the 2009 IEEE/PES Power Systems Conference and Exposition, Seattle, WA, USA, 15–18 March 2009. [Google Scholar]
  29. Molzahn, D.K.; Dörfler, F.; Sandberg, H.; Low, S.H.; Chakrabarti, S.; Baldick, R.; Lavaei, J. A Survey of Distributed Optimization and Control Algorithms for Electric Power Systems. IEEE Trans Smart Grid 2017, 8, 2941–2962. [Google Scholar] [CrossRef]
  30. Granville, S. Optimal reactive dispatch through interior point methods. IEEE Trans. Power Syst. 1994, 9, 136–146. [Google Scholar] [CrossRef]
  31. Wu, Q.H.; Ma, J.T. Power system optimal reactive power dispatch using evolutionary programming. IEEE Trans. Power Syst. 1995, 10, 1243–1249. [Google Scholar] [CrossRef] [PubMed]
  32. Dai, C.; Chen, W.; Zhu, Y.; Zhang, X. Seeker Optimization Algorithm for Optimal Reactive Power Dispatch. IEEE Trans. Power Syst. 2009, 24, 1218–1231. [Google Scholar]
  33. Syah, R.; Faghri, S.; Nasution, M.K.; Davarpanah, A.; Jaszczur, M. Modeling and Optimization of Wind Turbines in Wind Farms for Solving Multi-Objective Reactive Power Dispatch Using a New Hybrid Scheme. Energies 2021, 14, 5919. [Google Scholar] [CrossRef]
  34. Nagarajan, K.; Parvathy, A.K.; Rajagopalan, A. Multi-objective optimal reactive power dispatch using levy interior search algorithm. Int. J. Electr. Eng. Inform. 2020, 12, 547–570. [Google Scholar] [CrossRef]
  35. Das, D.B.; Patvardhan, C. Reactive power dispatch with a hybrid stochastic search technique. Int. J. Electr. Power Energy Syst. 2002, 24, 731–736. [Google Scholar]
  36. Tudose, A.M.; Picioroaga, I.I.; Sidea, D.O.; Bulac, C. Solving Single- and Multi-Objective Optimal Reactive Power Dispatch Problems Using an Improved Salp Swarm Algorithm. Energies 2021, 14, 1222. [Google Scholar] [CrossRef]
  37. Tao, Q.; Wang, D.; Yang, B.; Liu, H.; Yan, S. Voltage control of distribution network with distributed generation based on Voltage Sensitivity Matrix. In Proceedings of the 2018 IEEE International Conference on Energy Internet (ICEI), Bejing, China, 21–25 May 2018. [Google Scholar]
  38. Rauch, J.; Brückl, O. Entwicklung eines Regelverfahrens für einen optimierten und zentralen Blindleistungsabruf zur Beeinflussung des Blindleistungshaushalts von Mittelspannungsverteilnetzen unter Einhaltung von Netzrestriktionen. In Proceedings of the Konferenz Zukünftige Stromnetze, Berlin, Germany, 30–31 January 2019. (In German). [Google Scholar]
  39. Zhu, J. Optimization of Power System Operation; John Wiley & Sons: New Jersey, NJ, USA, 2009. [Google Scholar]
  40. Molver, I.; Chowdhury, S. Investigation of the Impact of Grid-integrated Distributed Generation on MV Network Voltage using Load Flow Sensitivities. In Proceedings of the 2019 IEEE PES/IAS PowerAfrica, Abuja, Nigeria, 20–23 August 2019. [Google Scholar]
  41. Haslbeck, M. Planerische Bestimmung von Randbedingungen zur Steuerung von Blindleistungsquellen an Knoten von Mittelspannungsnetzen. Ph.D. Thesis, Clausthal University of Technology, Clausthal-Zellerfeld, Germany, 2020. (In German). [Google Scholar]
  42. Rauch, J.; Klitsman, M.; Haslbeck, M.; Brückl, O. Entwicklung von Methoden zur Prognose der Blindleistungsbilanz von Mittelspannungsnetzen zur Steuerung eines dezentralen Blindleistungsabrufs. In Proceedings of the Zukünftige Stromnetze, Berlin, Germany, 30–31 January 2018. (In German). [Google Scholar]
  43. Haslbeck, M.; Kreuzer, R.; Rauch, J.; Brückl, O.; Günther, A.; Bäsmann, R.; Rietsche, H.; Tempelmeier, A. SyNErgie-Systemoptimierendes Netz- und Energiemanagement für die Verteilungsnetze der Zukunft: SyNErgie-Stromnetze Forschungsinitiative der Bundesregierung: Schlussbericht; Ostbayerische Technische Hochschule Regensburg FENES: Regensburg, Germany, 2018. (In German) [Google Scholar]
  44. Rauch, J. Entwicklung eines Regelverfahrens für einen optimierten und zentralen Blindleistungsabruf zur Beeinflussung des Blindleistungshaushalts von Mittelspannungsnetzen unter Einhaltung von Netzrestriktionen. Master’s Thesis, Ostbayerische Technische Hochschule Regensburg, Regensburg, Germany, 2018. (In German). [Google Scholar]
  45. DIN EN 50160:2011-02; Voltage Characteristics of Electricity Supplied by Public Electricity Networks. DIN e.V.-Beuth Verlag: Berlin, Germany, 2011.
Figure 1. Composition and measuring points of an exemplary industrial-internal grid with two stations with two transformers each (four plants).
Electricity 04 00006 g001
Figure 2. Inductive and capacitive reactive power potential of six measured industrial companies displayed by boxplots (red lines show the medium, blue boxes show the upper and lower quartiles and whiskers show the maximum or minimum of the reactive power potentials). Due to its comparatively high values, B6 is presented separately.
Electricity 04 00006 g002
Figure 3. Effective power consumption (black line, left axis), full-uncompensated reactive power behavior (blue line, right axis), full-compensated reactive power behavior (orange line, right axis), inductive reactive power potential (blue area, right axis) and capacitive reactive power potential (orange area, right axis) with regard to the original reactive power behavior of B6 (grey line, right axis) for the month of December 2017 in minute-resolution.
Electricity 04 00006 g003
Figure 4. Relative frequency of the capacitive and inductive reactive power potential of B6.
Electricity 04 00006 g004
Figure 5. Control process of the central optimal reactive power control strategy.
Electricity 04 00006 g005
Figure 6. Schematic illustration of the central reactive power control strategy in an exemplary medium-voltage grid with an industrial company with two ICS as reactive power sources.
Electricity 04 00006 g006
Figure 7. Schematic illustration of the radial topology of the regarded 66-busbar medium-voltage grid with separation points in open position (red) the six implemented industrial companies (blue, B1 to B6) and their reactive power potential (generation units).
Electricity 04 00006 g007
Figure 8. Maxima (absolute) active (blue) and reactive power behavior (orange) at load buses of the medium-voltage test system (non-simultaneous).
Electricity 04 00006 g008
Figure 9. P–Q behavior of the regarded medium-voltage grid (logged at the low-voltage site of the substation transformer) before (blue) and after (orange) the reactive power retrieval by the central reactive power control strategy with red circled data points, which exceed the control deviation (green).
Electricity 04 00006 g009
Figure 10. Root cause analysis for achieving or missing the objective of full compensation (with tolerable control deviation e).
Electricity 04 00006 g010
Figure 11. Temporal evolvement of the aggregated reactive power potential of the six industrial companies (brown to orange), the reactive power demand of the grid (blue), the deficient reactive power (red), points in time with the minimal simultaneous inductive and capacitive reactive power potential (cyan triangles) and the presentation of extremes of voltage and load flow progressions before (blue) and after (orange) the application of the control process, with labelling the limitations (red); note: lines in apparent power plots are nearly congruent.
Electricity 04 00006 g011
Table 1. Measurement input parameter for reactive power potential calculation.
NotationDescriptionUnit
Q supply , i ( t ) Time-dependent reactive power behavior of plant i at the substation transformervar
Q ICS , i ( t ) Time-dependent reactive power provision of all installed ICSs at plantvar
Q ICS , inst , i Installed reactive power of all ICSs at plant ivar
Table 2. Characteristic data of six measured industrial companies.
IDSector/TypeMax. Measured Effective Power Consumption in kW i = 1 n Q ICS , inst , i  
in Kvar
Measurement
Period in Days
Measurement Resolution
B1printing company21931000201-second
B2university58722205221-minute
B3automotive supplier13591150211-second
B4manufacturing263325221-second
B5machine building11921150461-second
B6manufacturing762370752421-minute
Table 3. Comparison between minimal simultaneous and non-simultaneous reactive power potential.
Minimal Non-Simultaneous
Reactive Power Potential
Minimal Simultaneous
Reactive Power Potential
Minimal Compensational
Effect in Application
Total in KvarTotal in KvarChange in %Total in KvarChange in %
Inductive6361388118.21500135.8
Capacitive−5993−695516.1−5168−13.7
Disclaimer/Publisher’s Note: The statements, opinions and data contained in all publications are solely those of the individual author(s) and contributor(s) and not of MDPI and/or the editor(s). MDPI and/or the editor(s) disclaim responsibility for any injury to people or property resulting from any ideas, methods, instructions or products referred to in the content.

