

The Burden of Air Pollution: A Perspective on Global Health Inequalities

Faculty of Economic Sciences, Koszalin University of Technology, 75-343 Koszalin, Poland
Pollutants 2023, 3(3), 419-436; https://doi.org/10.3390/pollutants3030029
Submission received: 6 May 2023
/
Revised: 22 June 2023
/
Accepted: 10 July 2023
/
Published: 5 September 2023
(This article belongs to the Topic Environmental Exposure, Biomonitoring and Exposure Assessment)
Abstract
:The aim of the research presented here is to assess the magnitude of the burden of health limitations due to air pollution on the world’s economies. This burden was determined by the estimated number of premature years of life lost (YLLs) or years of health lost (YLDs) due to air-pollution-related diseases in the working-age population. Attention was drawn to the problem of existing inequalities in the global burden between economies with different income levels. The hypothesis of persistently high levels of inequality was tested by analysing the convergence process in a group of 204 countries over the period 1990–2019. The results indicate a high degree of variation in the level of health problems caused by air pollution. The analysis of the catching-up process of the most disadvantaged countries (with the highest level of health impacts from air pollution) did not show a positive convergence effect in the study group.
1. Introduction
Air pollution is no longer just an environmental issue. It must also be considered in economic terms, as it causes a large global burden of disease. Although the consequences of poor air quality are particularly evident in the elderly (as a result of long-term exposure), the measurable effects of the burden of this risk factor can also be estimated for the working-age population. In terms of economic (social) costs, years of health and life lost prematurely due to illness or death significantly reduce the human resource potential of an economy [1,2,3] and are a source of lost productivity [4,5,6,7]. There is epidemiological evidence that particulate matter less than 2.5 μm in diameter (PM2.5) is an extremely hazardous factor for human health [8], indicating the need to study the impact of air pollution on morbidity and mortality, including the so-called indirect costs of disease. Reduced physical and mental fitness are now recognised as major causes of inactivity among people of working age [9,10], and the mechanisms by which health affects economic productivity are the subjects of numerous studies [11,12,13,14]. Although air pollution is commonly associated with areas of high production intensity, data on morbidity and mortality from this risk factor indicate that the burden of disease from air pollution is greatest in low- and middle-income countries [15]. It is in the lowest-producing countries that air pollution is now one of the major (or main) risk factors for the burden of disability or premature death.
The aim of the research presented here is to assess the magnitude of the burden of health limitations resulting from air pollution on the world’s economies. This burden was determined by the estimated number of years of life lost prematurely (YLLs) or health lost (YLDs) due to air-pollution-related diseases in the working-age population. The analysis used Institute for Health Metrics and Evaluation (IHME) data from the Global Burden of Disease Study 2019 (GBD 2019) [16]. Attention was drawn to the problem of existing inequalities in the level of global burden on national economies determined by their income levels. The hypothesis of persistently high levels of inequality was tested by analysing the convergence process in a group of 204 countries over the period 1990–2019.
2. Literature Review
Evidence of the global burden of disease from environmental risk factors shows that the death rate from air pollution tends to increase as countries industrialise and move from low to middle income status [17]. Once a country reaches a higher level of development, these rates return to lower levels as both air quality and access to health care improve. Many studies confirm that the phenomenon of rapid increases in air pollution with increasing industrialisation in middle-income countries results in the highest mortality from this risk factor in this group of countries. The concept of the unequal burden of air pollution is based on the relationship between income inequality and economic development, which was put forward by Simon Kuznets in 1955 [18]. This is the so-called Environmental Kuznets Curve (EKC), which is often used to describe the relationship between economic growth and environmental quality. It refers to the hypothesis that there is an inverted U-shaped relationship between the value of output per capita and certain measures of environmental quality. The EKC thus describes a hypothetical relationship between various indicators of environmental degradation and the level of per capita income. In the early stages of a country’s economic growth, emissions increase and environmental quality deteriorates, but above a certain level of per capita income (different for different environmental indicators) this trend reverses, leading to environmental improvement at high income levels [19]. It is therefore reasonable to assume that the level of environmental pressure can be expressed as an inverted U-shaped function of income per capita. According to the EKC concept, the precondition for environmental improvement is therefore an increase in income, which can then be translated into effective environmental policies. In the literature, the model has been the subject of numerous proposals for modifications to the relationship between environmental parameters and economic growth, highlighting potential mechanisms for adapting emission reduction practices that may differ significantly from the theoretical assumptions of the EKC model [20,21,22].
Ambient and household air pollution is currently a major global health problem, contributing to approximately 7 million (potentially preventable) deaths per year, reduced life expectancy and significant direct and indirect social costs [23,24]. Currently, air pollution is a major environmental risk factor for premature death and is responsible for significant morbidity with short and long-term health consequences [25]. Analyses of the association between air pollution and cerebrovascular [25,26,27,28], neurological [29,30,31], and psychiatric [32,33,34] disorders are well documented in the literature. Exposure to various forms of air pollutants, especially particulate matter, which is readily absorbed by the body, may potentially contribute to stroke, dementia, Parkinson’s disease, cognitive impairment, and neurodevelopmental disorders [35,36]. There is also evidence of a positive association between high ambient levels of PM2.5 and the incidence of depression [37]. Inflammation and oxidative stress are thought to be key pathophysiological mechanisms by which air pollution causes brain damage [38]. It also creates conditions for thrombus formation by increasing coagulation factors and platelet activation [39]. At the same time, studies confirm a strong association between air pollution and cardiovascular morbidity and mortality [40,41].
As a result of its multiple effects on the human body, air pollution is now a major contributor to the global burden of disease. In 2019, 6.67 million deaths were attributed to this risk factor, accounting for 11.8% of all deaths. Of these, 4.1 million deaths (more than 61%) were specifically attributed to outdoor air pollution. According to data from the Institute for Health Metrics and Evaluation (IHME) published in the Global Burden of Disease Study 2019 [16], air pollution (outdoor and indoor) is the fourth-most-common risk factor in terms of intensity of exposure resulting in death, after high blood pressure, smoking, and poor diet. It is also a major cause of the burden of non-communicable diseases (NCDs), mainly ischaemic heart disease, stroke, lower respiratory infections, and chronic obstructive pulmonary disease. Air pollution is the fourth-leading risk factor (after malnutrition, hypertension and smoking) contributing to the global burden of disease, measured in healthy life years lost to death or disability. The IMHE estimates that air pollution will contribute to 213.3 million healthy life years lost to premature death or disability in 2019. This represents 17.5% of the global burden of disease from all risk factors combined.
As an environmental risk factor, air pollution is also a major contributor to the health and life expectancy of people of working age, with a measurable impact on national economies in terms of lost productivity of labour resources. According to the IMHE estimates cited above, in 2019, air pollution contributed to 43.0 million healthy life years lost due to premature death or disability among people in the 20–54 age group, representing 12.7% of the global burden of disease in this age group due to all risk factors combined.
Between 1990 and 2019, the global average total air pollution mortality rate for the population aged 20–54 years fell from 29.6 to 22.2 deaths per 100,000 people, mainly due to improvements in indoor air quality (the indoor air pollution mortality rate fell from 19.2 to 7.9 deaths per 100,000 people). Over the same period, the mortality rate from outdoor air pollution increased from 10.2 to 14.1 deaths per 100,000 population and now accounts for more than 63% of the total burden of premature death from air pollution [16]. The same data show a persistent burden attributed to airborne ozone pollution over the study period. The estimated burden of premature mortality due to exposure to this risk factor in the 20–54 age group decreased from 0.5 in 1990 to 0.4 deaths per 100,000 people in 2019. In line with the reduction in mortality rates, the contribution of ambient ozone to the global air pollution burden for 20–54 year olds increased from 1.7 to 1.8% over the period.
3. Materials and Methods
Data from the Institute for Health Metrics and Evaluation (IHME) Global Burden of Disease Study 2019 were used to assess the magnitude of the burden of disease caused by air pollution in working-age populations in 204 countries worldwide [16]. The spatial distribution of the burden was assessed using indicators representing the number of years of life lost (YLL) and the number of potential years of life with disability (YLD) due to diseases associated with exposure to air pollution. The burden measures were chosen on the basis of methods proposed in the literature to assess the phenomenon under study [42,43,44]. The approach adopted makes it possible to estimate the potentially lost effective working time of people of working age, while at the same time indicating the level of disease burden caused by a given risk factor on national economies. In the GBD 2019 study, three groups of pollutants were considered in the estimation of air pollution levels: (1) ambient particulate matter pollution, defined as the annual average daily exposure to outdoor concentrations of particulate matter with an aerodynamic diameter ≤2.5 μm (PM2.5); (2) household air pollution (NDS) from solid fuels, measured as individual exposure to indoor PM2.5 concentrations due to the use of solid fuels for cooking and heating; and (3) ozone air pollution. The average exposure data by country are population-weighted, i.e., they take into account the geographical distribution of the population in relation to the exposure.
Given the objective of the study, i.e., determining the degree of inequality in the burden on national economies resulting from the loss of effectiveness of human resources during the productive period, and the availability of aggregated data in the IHME database for age groups representing the range of highly productive labour resources, the analysis was based on variables describing the phenomenon under study in the population aged 20–54. Assuming that the level of health burden from air pollution is a function of both long-term exposure and increasing susceptibility to health risks associated with underlying diseases with increasing age, the reference group thus adopted in the process studied allowed at the same time to reduce the impact of age and related other cumulative health determinants on the occurrence of health damage. Comparability of data between countries was achieved by using intensity ratios, which refer to the number of cases per population size (rate). Statistical measures were used to determine the degree of variation in the parameters analysed across the study group of 204 countries.
Given the demonstrated heterogeneity of the burden of air pollution and its variability over time, the assumed global convergence in the burden of lost productivity on national economies was measured separately for parameters based on estimates of the burden of premature death (YLL(AP) rate) and long-term disability (YLD(AP) rate) in the working-age population defined for the whole study. The expected effect of decreasing global inequalities in the level of the burden of the consequences of air pollution on the world’s economies will be an apparent process of positive convergence, consisting of a decrease over time in the average level of the indicators studied as their level of dispersion decreases. In order to assess the progress of the system under study towards equilibrium, the concept of beta (β) unconditional convergence, which takes into account different initial conditions and predicts that outliers will catch up more quickly with the target, and the concept of sigma (σ) convergence, defined as a decrease in the dispersion of performance, have been used. To test the β convergence hypothesis using cross-sectional data, a model was used to explain the growth of the trait under study in each country (I = 1 …, N) between period t0 and t0 + T, using the initial value of the trait in each member state according to the formula:
where: yit—value of characteristic y in area i in period t; uit—random disturbance. The existence of beta convergence is confirmed by the negative and statistically significant value of the estimator b.
The analysis assumes that beta convergence takes place in the study area when countries with an initially lower value of a given variable (the highest level of the YLL(AP) rate or the YLD(AP) rate) catch up by showing a faster rate of transition to the expected state, i.e., the ratio of the parameters yit0+T/yit0 reaches the lowest possible value. The inclusion of absolute (unconditional) convergence in the study implies the assumption that all countries move towards the same long-run equilibrium state and reach it at the same time. However, countries with a worse initial position have a longer way to go. The occurrence of sigma convergence implies the achievement of the expected reduction in the level of dispersion of the characteristic under consideration over time. In order to verify the hypothesis of the occurrence of sigma convergence in the system under study, the amount of variance of the population in period t (σt2) is used as a measure of the dispersion of the characteristic in question.
Taking into account the specificity of the studied process (burden of the studied world economies with the consequences of diseases caused by air pollution), the expected positive effect of the convergence process is a decrease in the average level of the studied parameters over time ( along with a simultaneous decrease in the level of their dispersion (). The results obtained make it possible to evaluate the pattern of convergence in the system studied.
4. Results
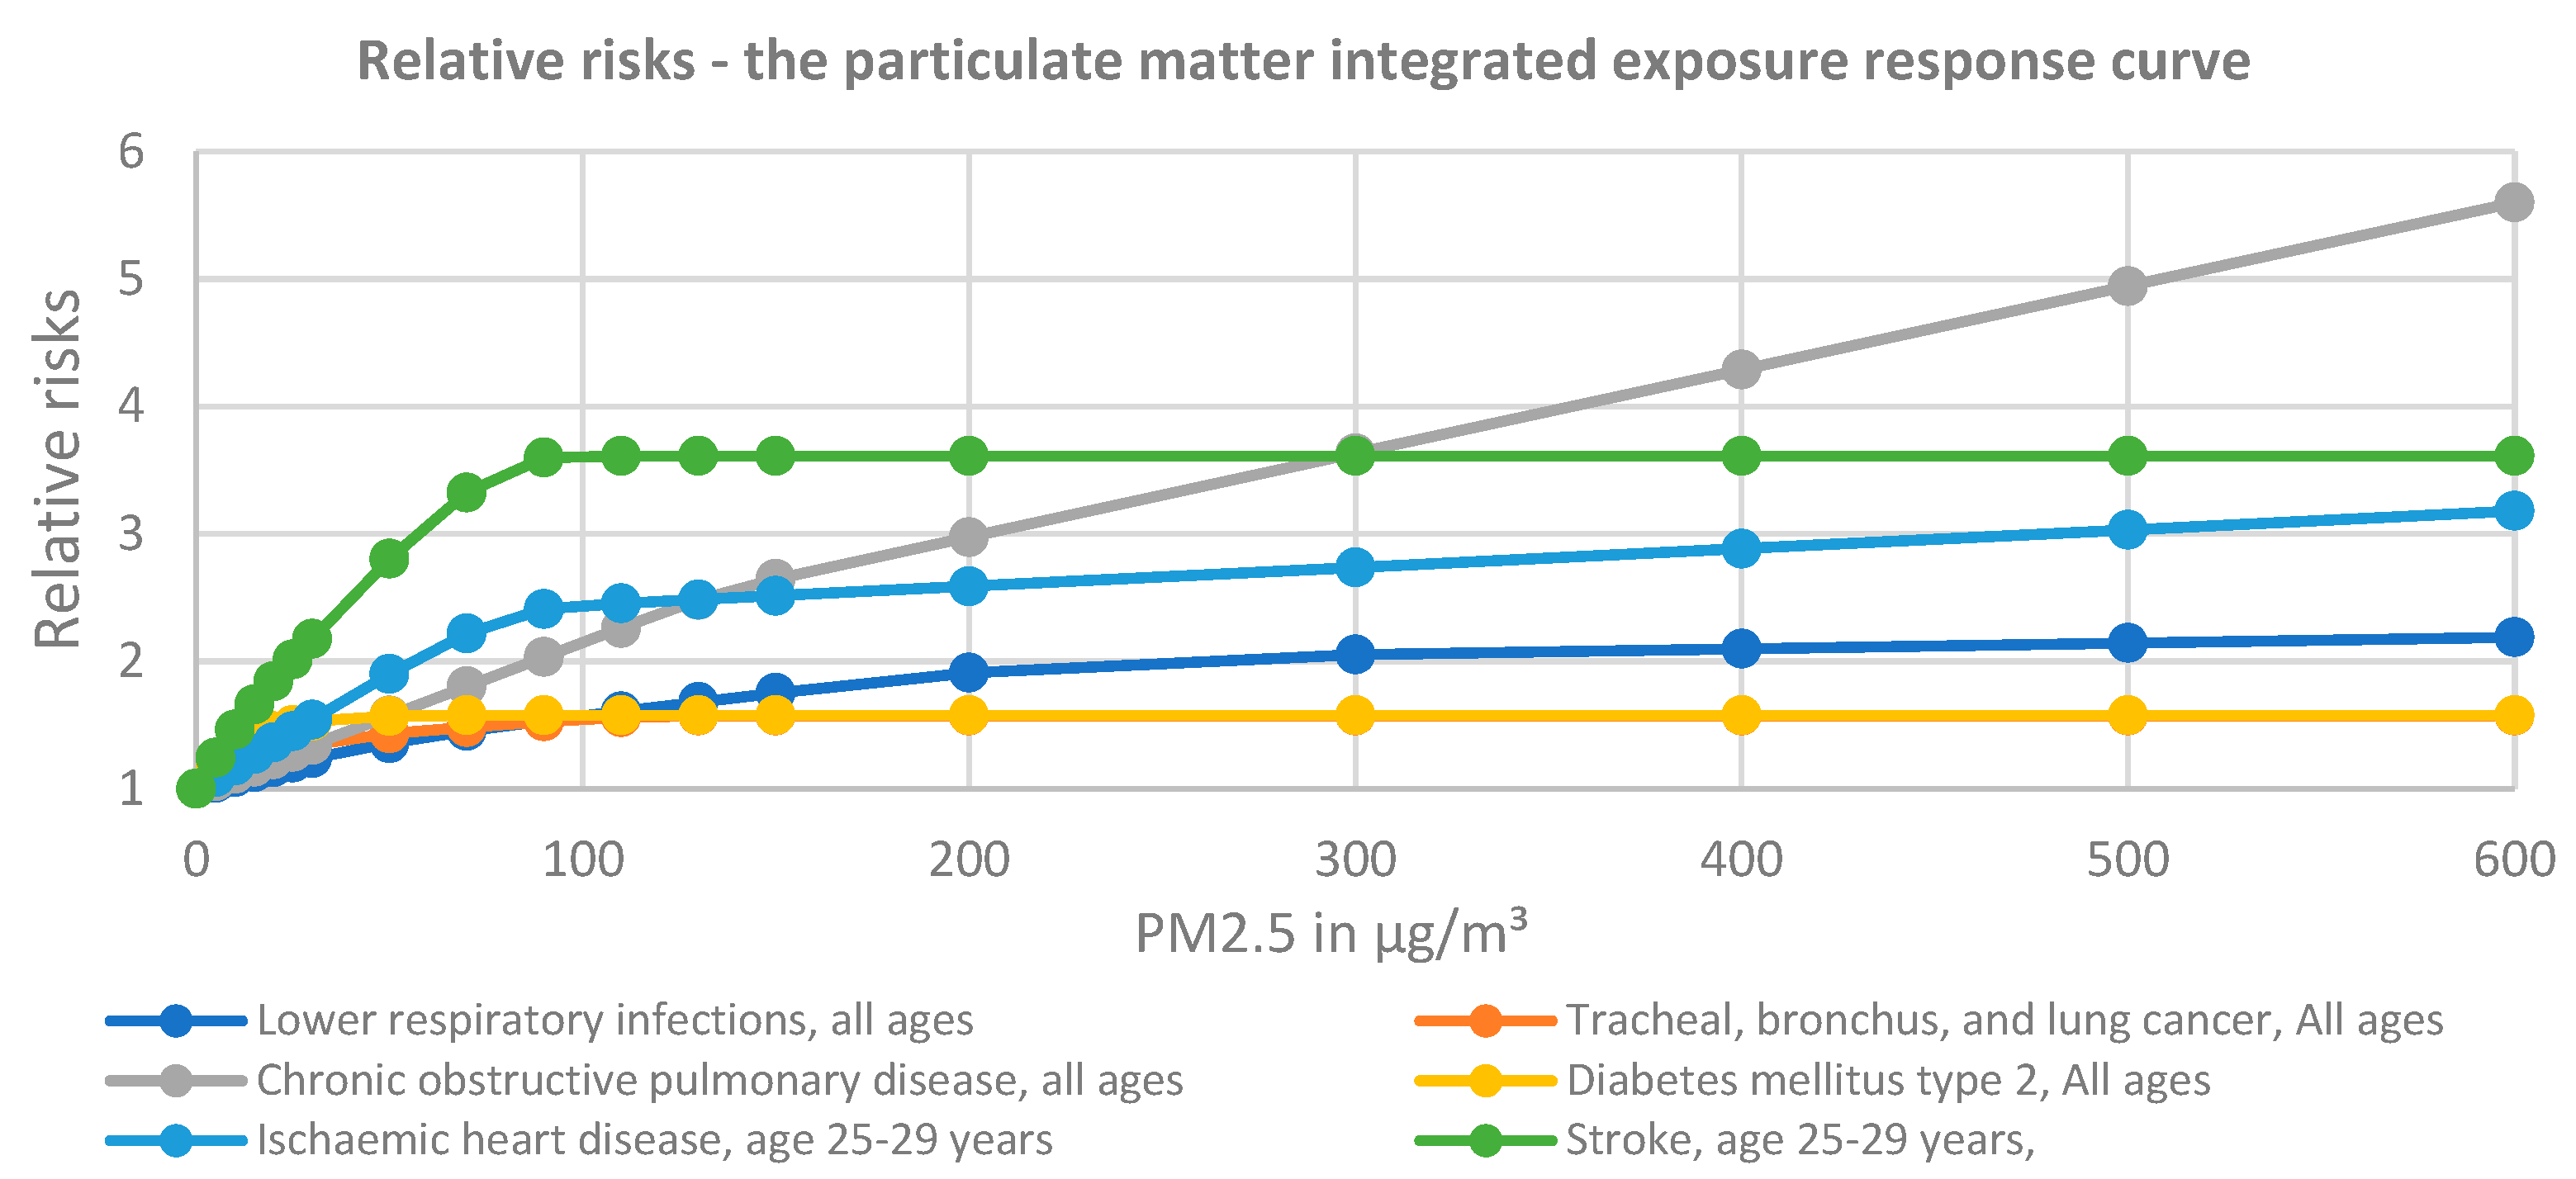
Estimating the burden of disease due to air pollution required simultaneous consideration of both the area-specific intensity of the risk factor (mainly PM2.5 in µg/m3, indoor and outdoor) and the sensitivity of individual diseases to long-term exposure to these factors. A set of risk curves constructed from GBD data [45] shows that chronic obstructive pulmonary disease is particularly sensitive to increases in PM2.5 intensity (Figure 1). In this case, the level of the relative risk (RR) burden increases virtually linearly, reaching RR = 5.6 at a potential PM2.5 concentration of 600 µg/m3. This means that the probability of adverse effects of chronic obstructive pulmonary disease (loss of life or health) in a person with long-term exposure to this level of PM2.5 is more than 5.5 times higher than in a person not exposed to this risk factor. A significant increase in the relative risk level with increasing PM2.5 concentrations in m3 is also observed for ischaemic heart disease—in this case, with long-term exposure to PM2.5 at 600 µg/m3, the RR increases to 3.2. For the burden of diseases such as stroke, type 2 diabetes, cancers of the trachea, bronchus, and lung, and lower respiratory tract infections, there is a strong increase in relative risk at initial exceedances of the safe exposure standards, while exceedances of 100 µg/m3 no longer have a significant effect on the increase in risk. In the case of stroke, long-term exposure to PM2.5 concentrations in the order of 90 µg/m3 makes a person exposed to such exposure more than 3.5 times more likely to suffer or die from the disease than a person not exposed (RR = 3.6).
At the same time, GBD 2019 Summary Exposure Value (SEV) data [45] show a decrease in global exposure to total air pollutants over the past 30 years (Table 1), with the decrease driven by a significant reduction in exposure to household air pollution from solid fuels. Total exposure has increased for risk factors such as ambient particulate matter and ambient ozone.
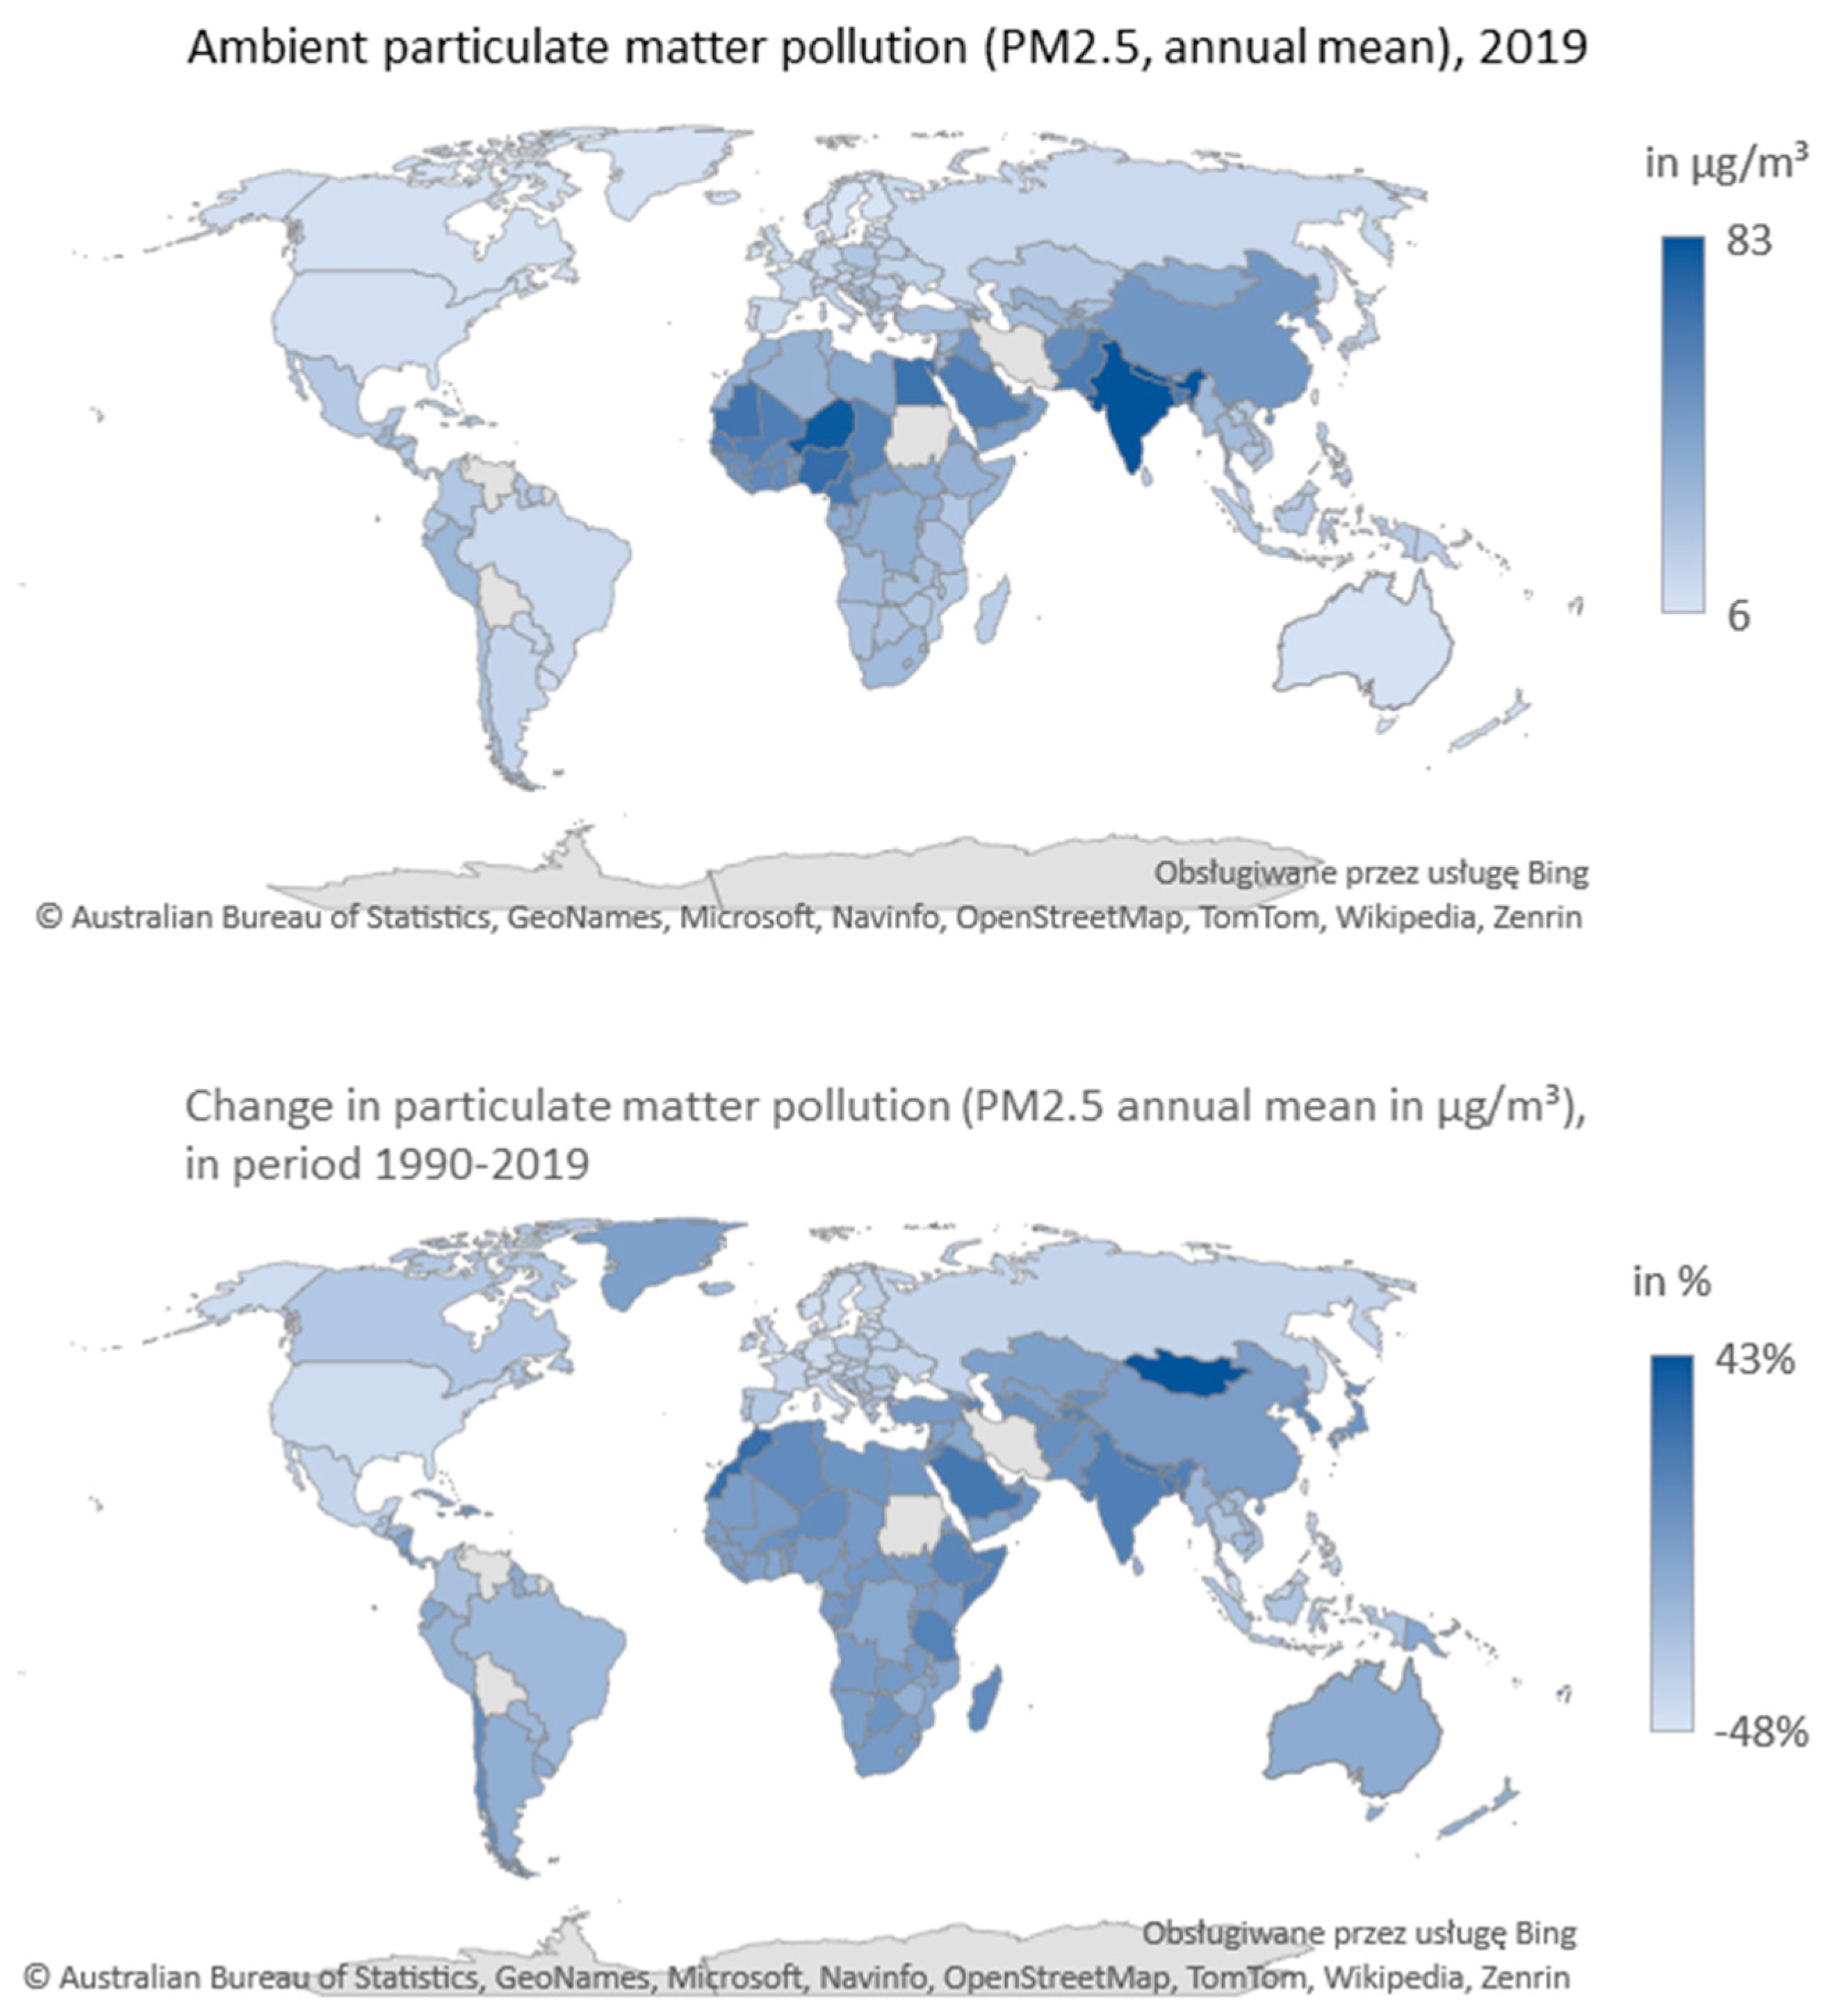
At present, air pollution levels vary widely between regions and countries. A greater burden of air pollution is observed in low- and middle-income countries, due to both the high levels of indoor pollution characteristic of low-income countries (due to reliance on solid fuels for cooking and heating) and the increasing levels of outdoor pollution as developing countries become more industrialised [46]. Global data on air pollution levels confirm the inequalities that still exist in this area. In fact, high average PM2.5 concentrations mainly affect African and Asian countries (Figure 2). Countries with the highest average PM2.5 concentrations include India (83 µg/m3), Niger (80 µg/m3), Nigeria (70 µg/m3) and Egypt (68 µg/m3). Their levels are almost double the global average and more than 500% higher than the European average. Between 1990 and 2019, while PM2.5 pollution levels in the European area decreased by almost 30%, the intensity of this risk factor increased by 9% in the Asian area. In the Indian area, the increase was 16%. However, the largest increase in PM2.5 intensity (43%) was recorded in Mongolia.
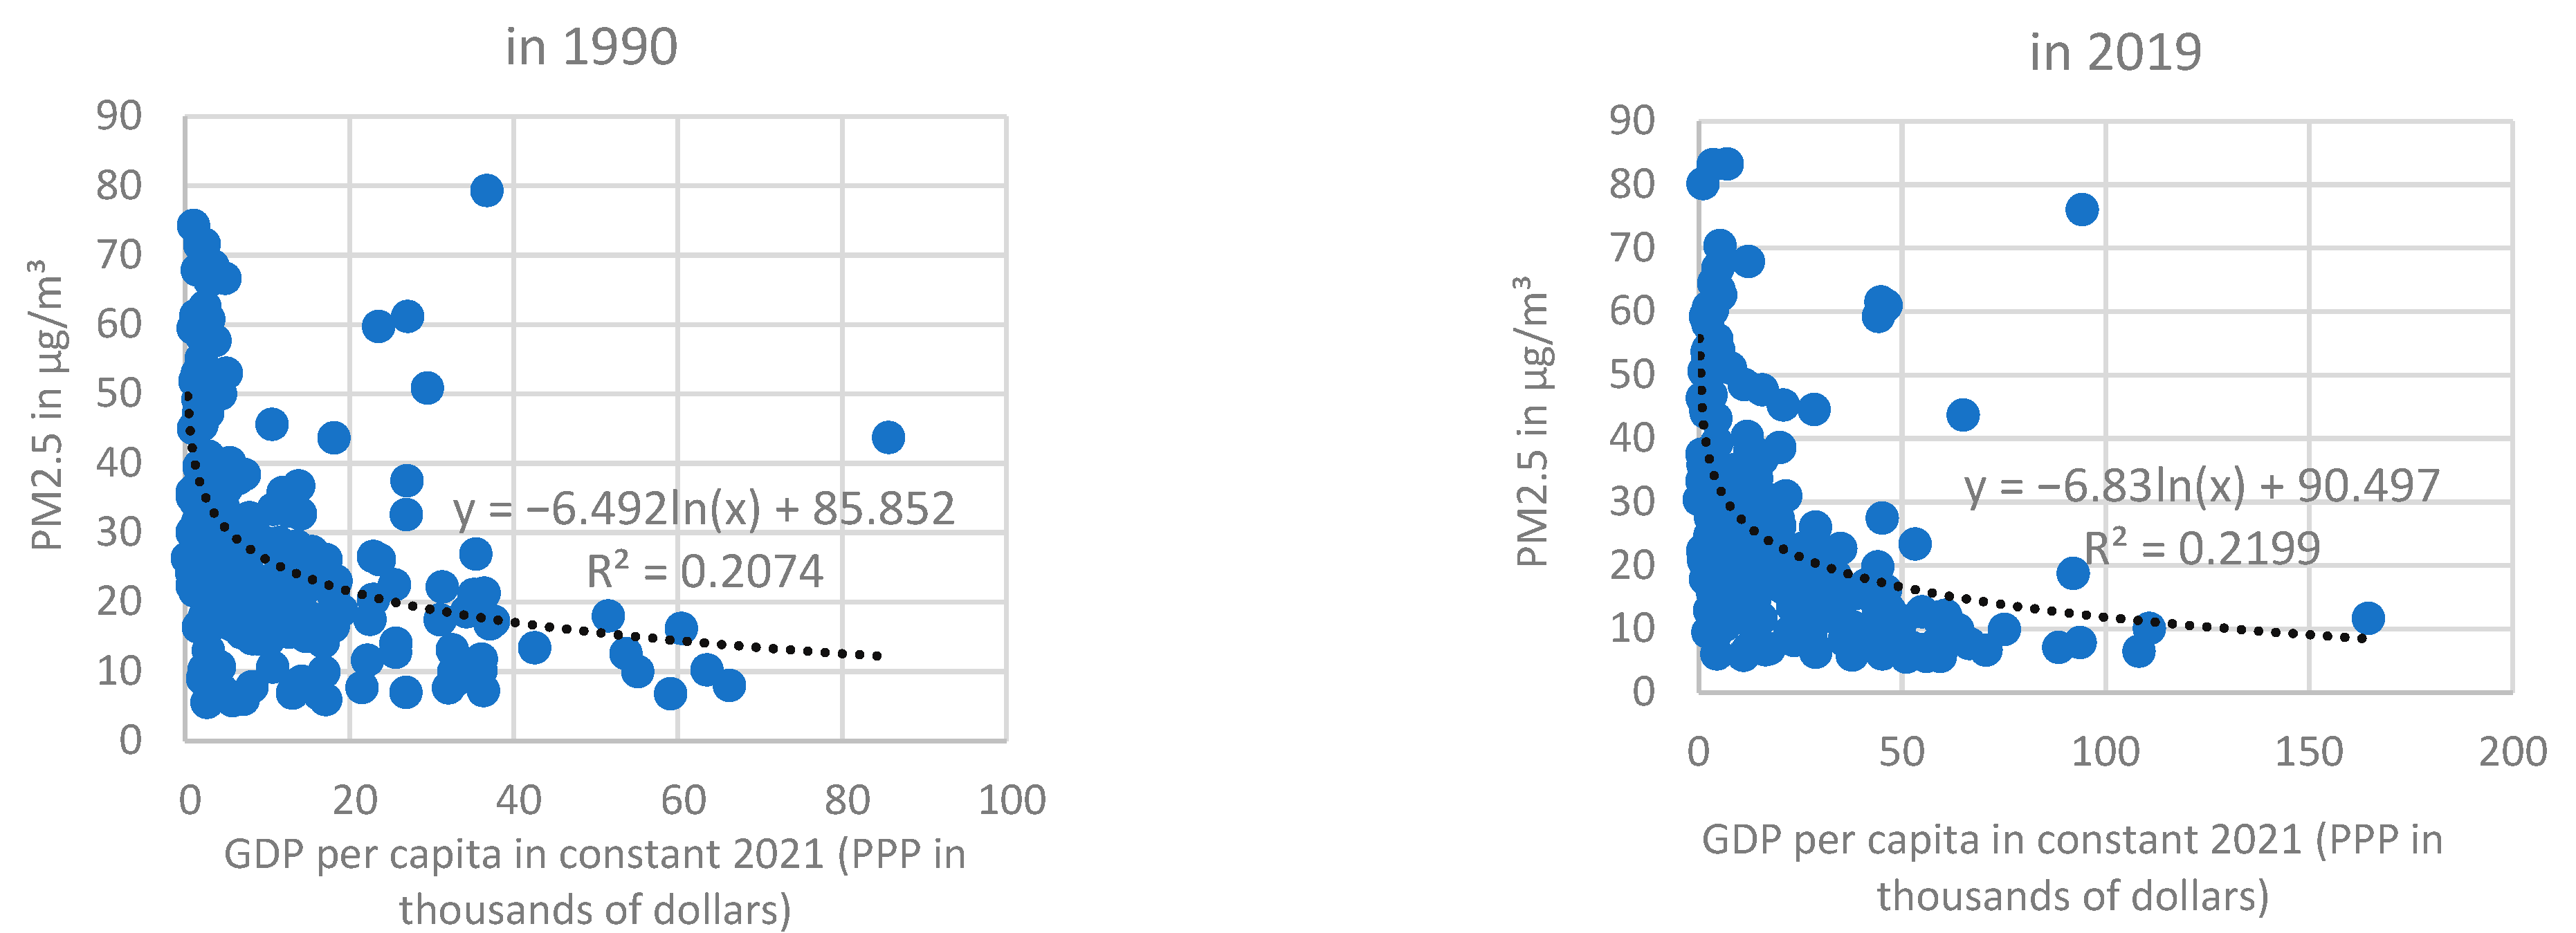
An analysis of the relationship between a country’s level of income (GDP per capita) and the average level of PM2.5 intensity (µg/m3) in its territory shows that there is a persistent unfavourable relationship between air pollution levels and national product levels worldwide. This means that a large proportion of countries with low levels of production (low GDP per capita) have high levels of PM2.5 intensity (Figure 3). Over the period 1990–2019, the level of the correlation coefficient between the value of gross domestic product per capita and the intensity of PM2.5 in the air increased from −0.34 (1990) to −0.37 (2019), indicating a continuing stable trend in this respect.
According to IHME [16] data on the global burden of disease worldwide, in 2019, in the population aged 20–54 years, the average burden of disease resulting from long-term exposure to air pollution, as measured by the number of years of life and health lost due to these diseases (DALYs), was 1145.2 per 100,000 people in this age group. Taking into account the 204 global economies included in the study, this rate, depending on the country, ranged between 8672.6 (Solomon Islands) and 33.1 (Sweden). The key sources of air pollution burden in this age group were cardiovascular diseases (DALYrate = 786.5), chronic respiratory diseases (DALYrate = 108.7), diabetes and kidney disesse (DALYrate = 102.4), respiratory infections and tuberculososos (DALYrate = 84.1), and neoplasms (DALYrate = 54.7).
A characteristic feature of the health burden of air pollution is the relatively high burden of premature mortality among those exposed. The ratio of years lived with disability (YLDs) to total years of healthy life lost (DALYs) due to exposure to air pollution in the population aged 20–54 years was on average 10.0%. In the study group it ranged from 4.3% (Solomon Islands) to 39.3% (Norway). A key issue in the burden on the potential of people of working age is therefore the high mortality rate of those affected by diseases related to air quality.
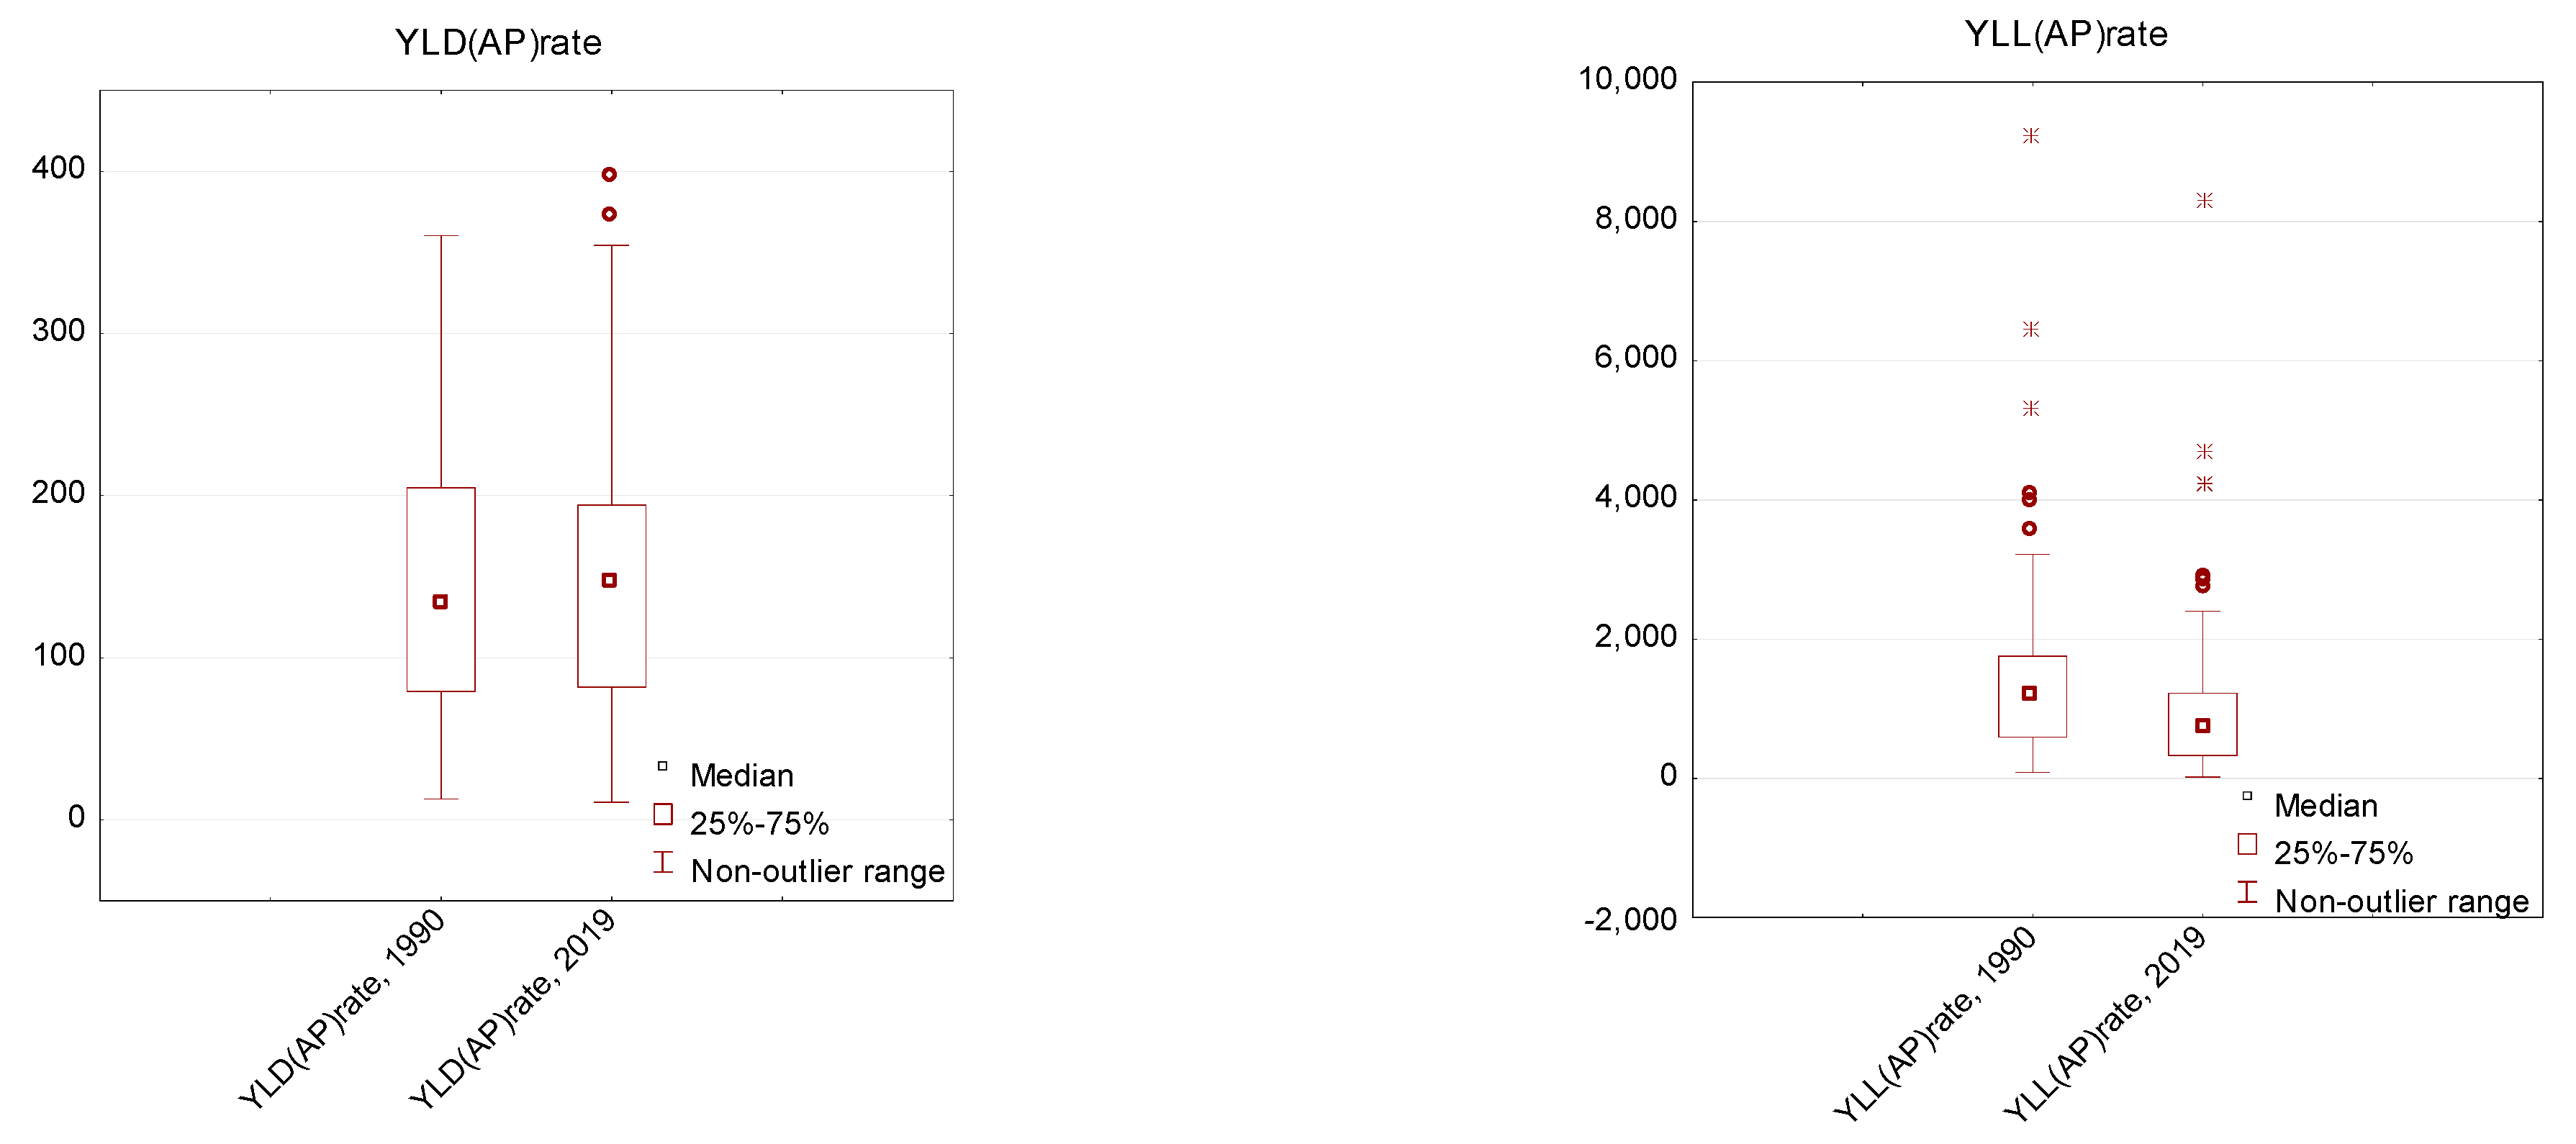
Over the period 1990–2019, the burden of premature mortality due to air pollution decreased significantly in the group of 204 countries studied—the average YLL(AP) rate fell from 879.8 to 1349.0 life years lost per 100,000 people aged 20–54 (the study also confirmed the statistical significance of these differences, assuming α = 0.05, Wilcoxon test results p = 0.000). However, the scores remained highly dispersed, indicating persistent inequalities within the group (Figure 4). During the study period, the coefficient of variation of the YLL(AP) rate parameter increased from 81.0 to 100.4%. In contrast, the level of disability burden due to air pollution did not change significantly. The average YLD(AP)rate decreased from 144.6 to 143.0 life years lost per 100,000 persons aged 20–54. The level of the coefficient of variation decreased from 54.7 to 52.7 per cent over the period, indicating no apparent trend towards levelling out existing inequalities in this area (Table 2).
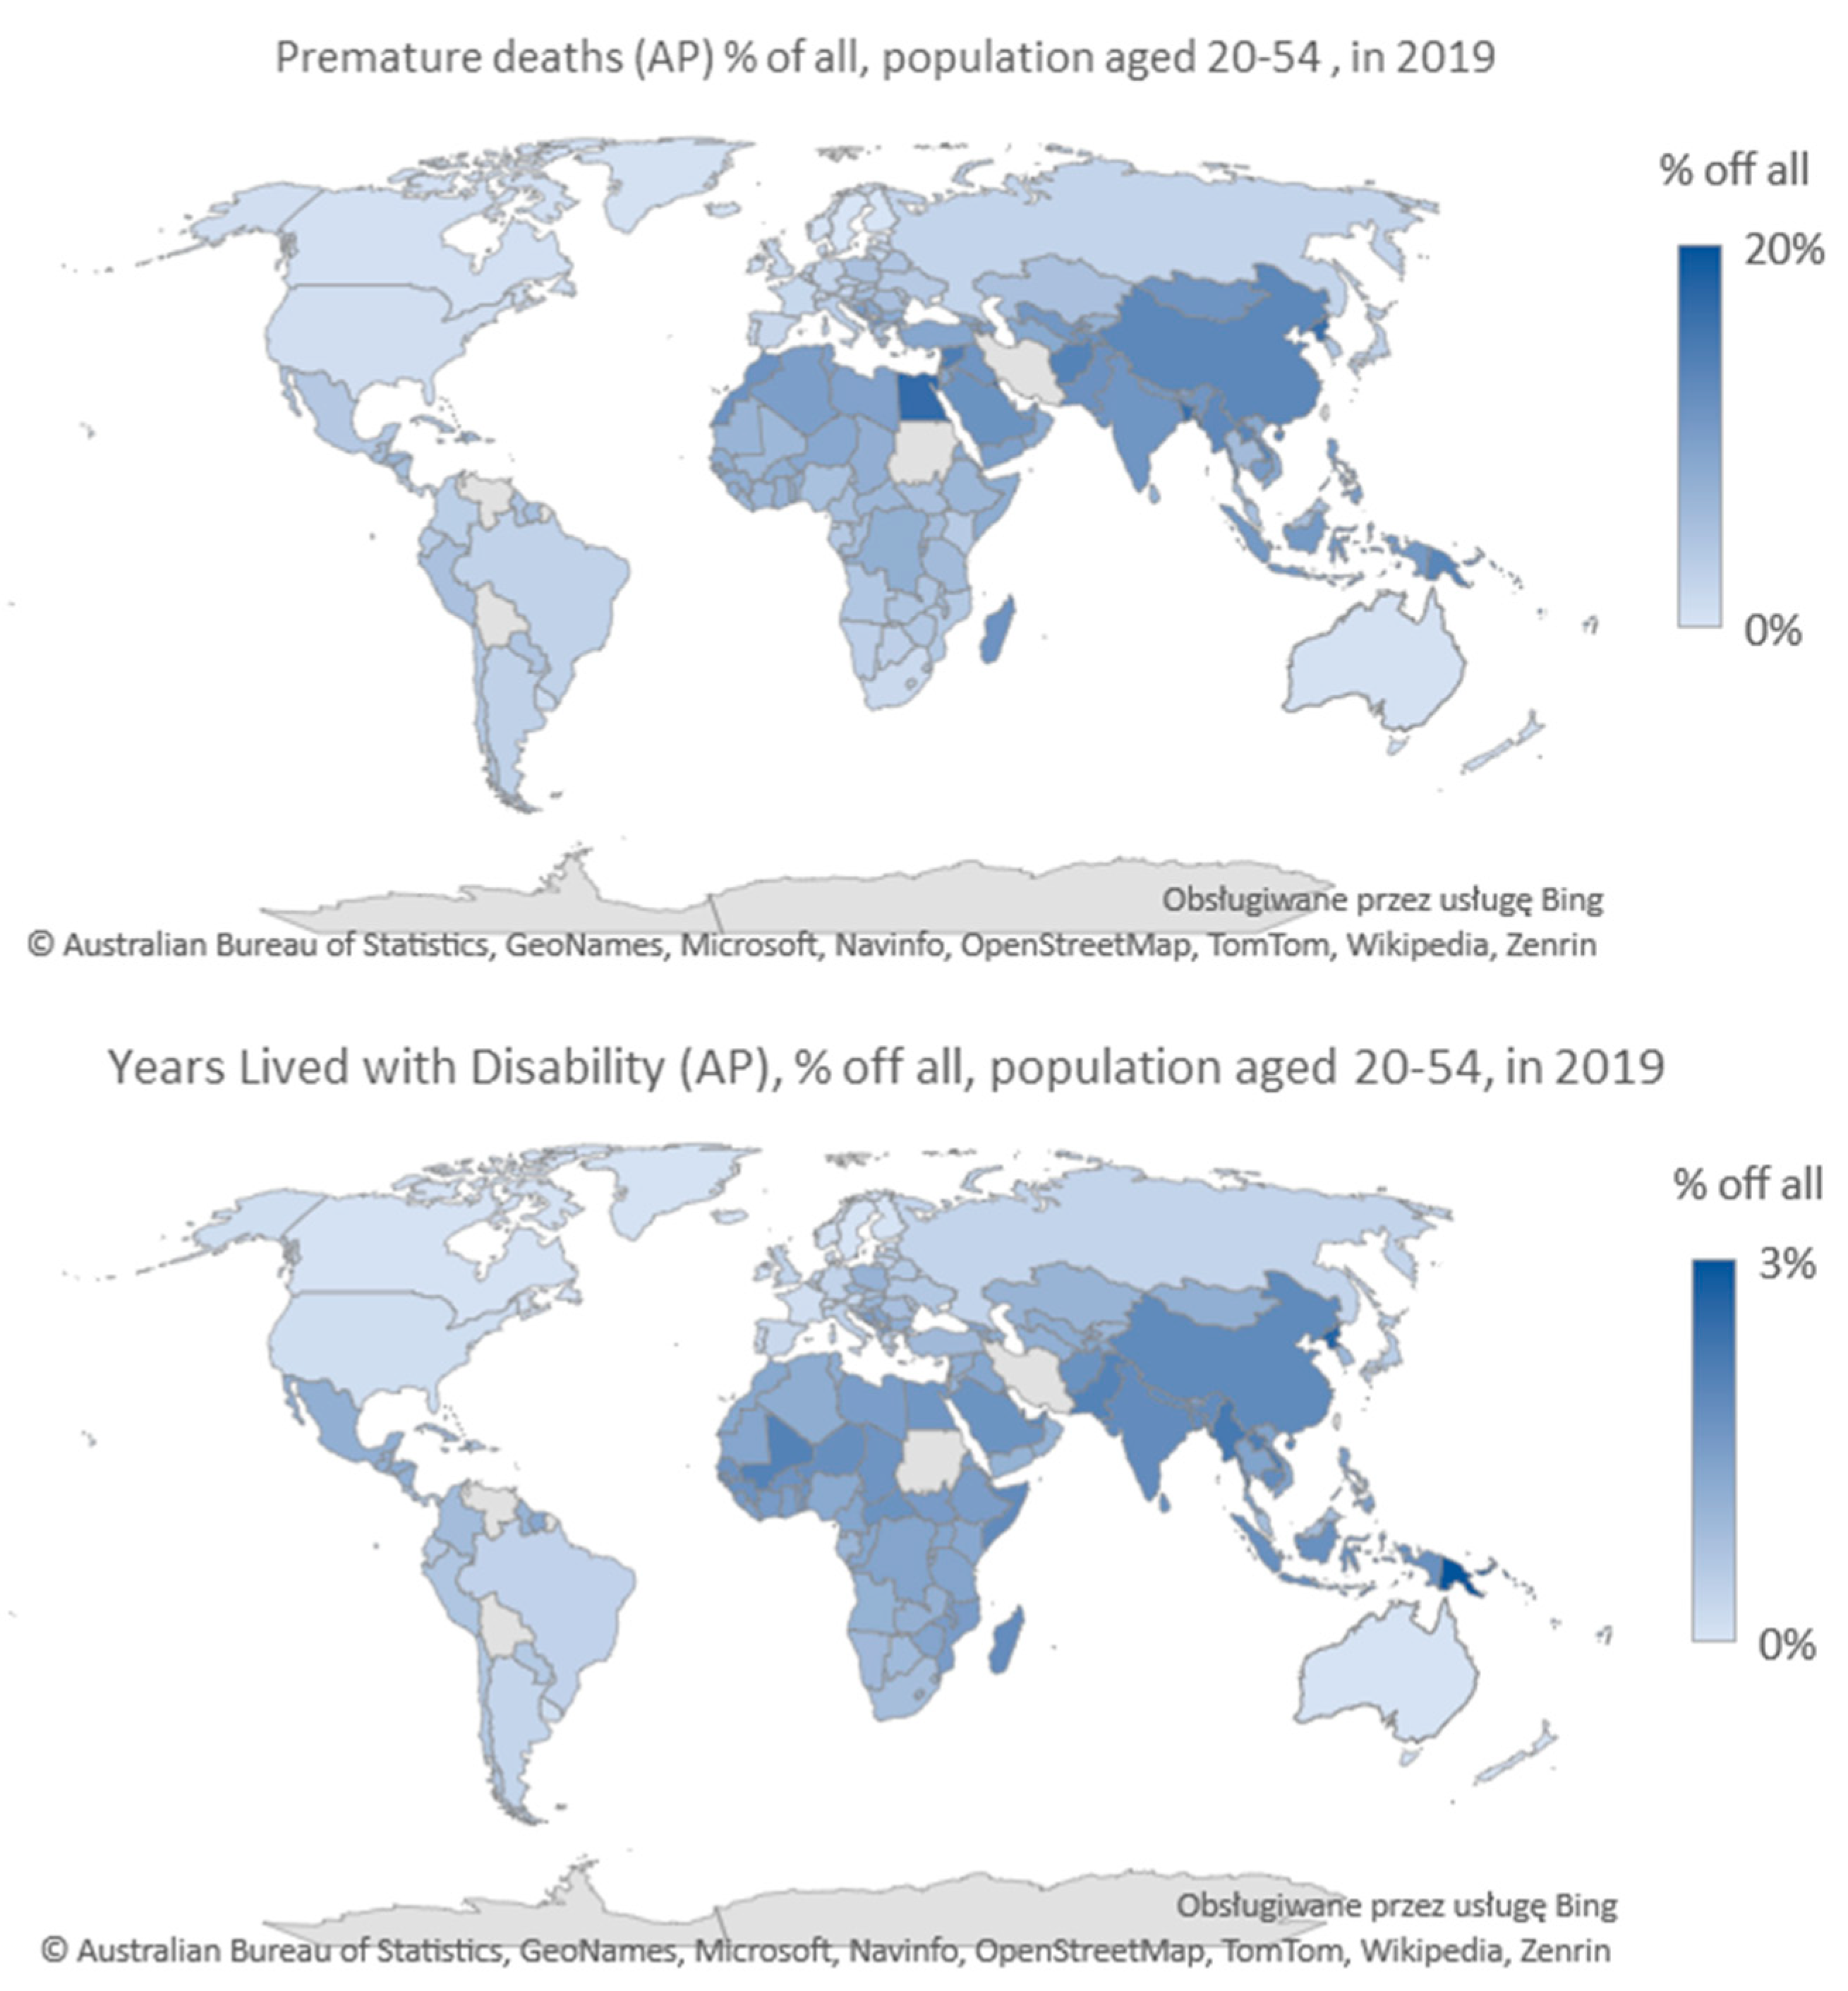
Preliminary analysis of the IHME data confirms the assumption of inequalities in the global health burden of air pollution among the working-age population. This means that these people experience different levels of risk of morbidity and mortality from air pollution depending on the level of economic development of the area. As a result, most countries in Africa and Asia experience high levels of morbidity and mortality from exposure to air pollution, with a high contribution of this risk factor to the burden measured in healthy life years (HLY) lost due to death (YLL) or disability (YLD). The regional divide in this respect is clear, with most countries in Europe, North America and Latin America representing areas where the contribution of air pollution to total morbidity and mortality is low (Figure 5). In the study group of 204 countries, for the age group 20–54 years, the highest contribution of air pollution to total deaths occurred in Solomon Islands (20.0%), Vanuatu (17.7%), Kuwait (17.6%) and Egypt (16.9%). In contrast, the lowest contribution of air-pollution-related diseases to premature deaths was found in Finland (0.5%), Sweden (0.5%), Iceland (0.7%) and Estonia (0.7%). The highest contribution of air pollution to the burden measured in years of disability for the population aged 20 to 54 was found in Papua New Guinea (3.4%), Solomon Islands (3.4%) and Vanuatu (3.2%), and the lowest in Iceland (0.09%), New Zealand (0.10%) and Sweden (0.11%).
According to IHME data on the global burden of disease in 2019 [16], the YLL(AP) rate (i.e., YLLs per 100,000 people) in the population aged 20–54 years varied between 219.4 (high-income group countries) and 1428.5 (low-income group countries), depending on the level of economic development of the country (as measured by the World Bank). The level of the YLD(AP) rate (i.e., YLDs per 100,000 population) in the population aged 20–54 years varied during the study period between 68.7 (high-income countries) and 223.3 (lower-middle-income countries) (Table 3). The contribution of diseases caused by air pollution to the total number of years of life lost (YLL) in the 20–54 age group varied between 3.1% (high income group countries) and 9.5% (lower middle income group countries). It should be noted that in the high- and upper-middle-income countries, this share has decreased significantly over the period 1990–2019 (Table 3). In lower middle and low income countries, the share of air pollution as a risk factor for premature death increased by more than 12% on average. In terms of years of healthy life lost (YLDs), the contribution of air-pollution-related diseases to the total number of years lived with disability from all causes ranged from 0.5% (high-income countries) to 2.0% (lower-middle-income countries). Over the period 1990–2019, this share increased for high-income countries (an increase of 3.4%) and decreased for middle and low-income groups (a decrease of between 3% and 5%, depending on the income group).
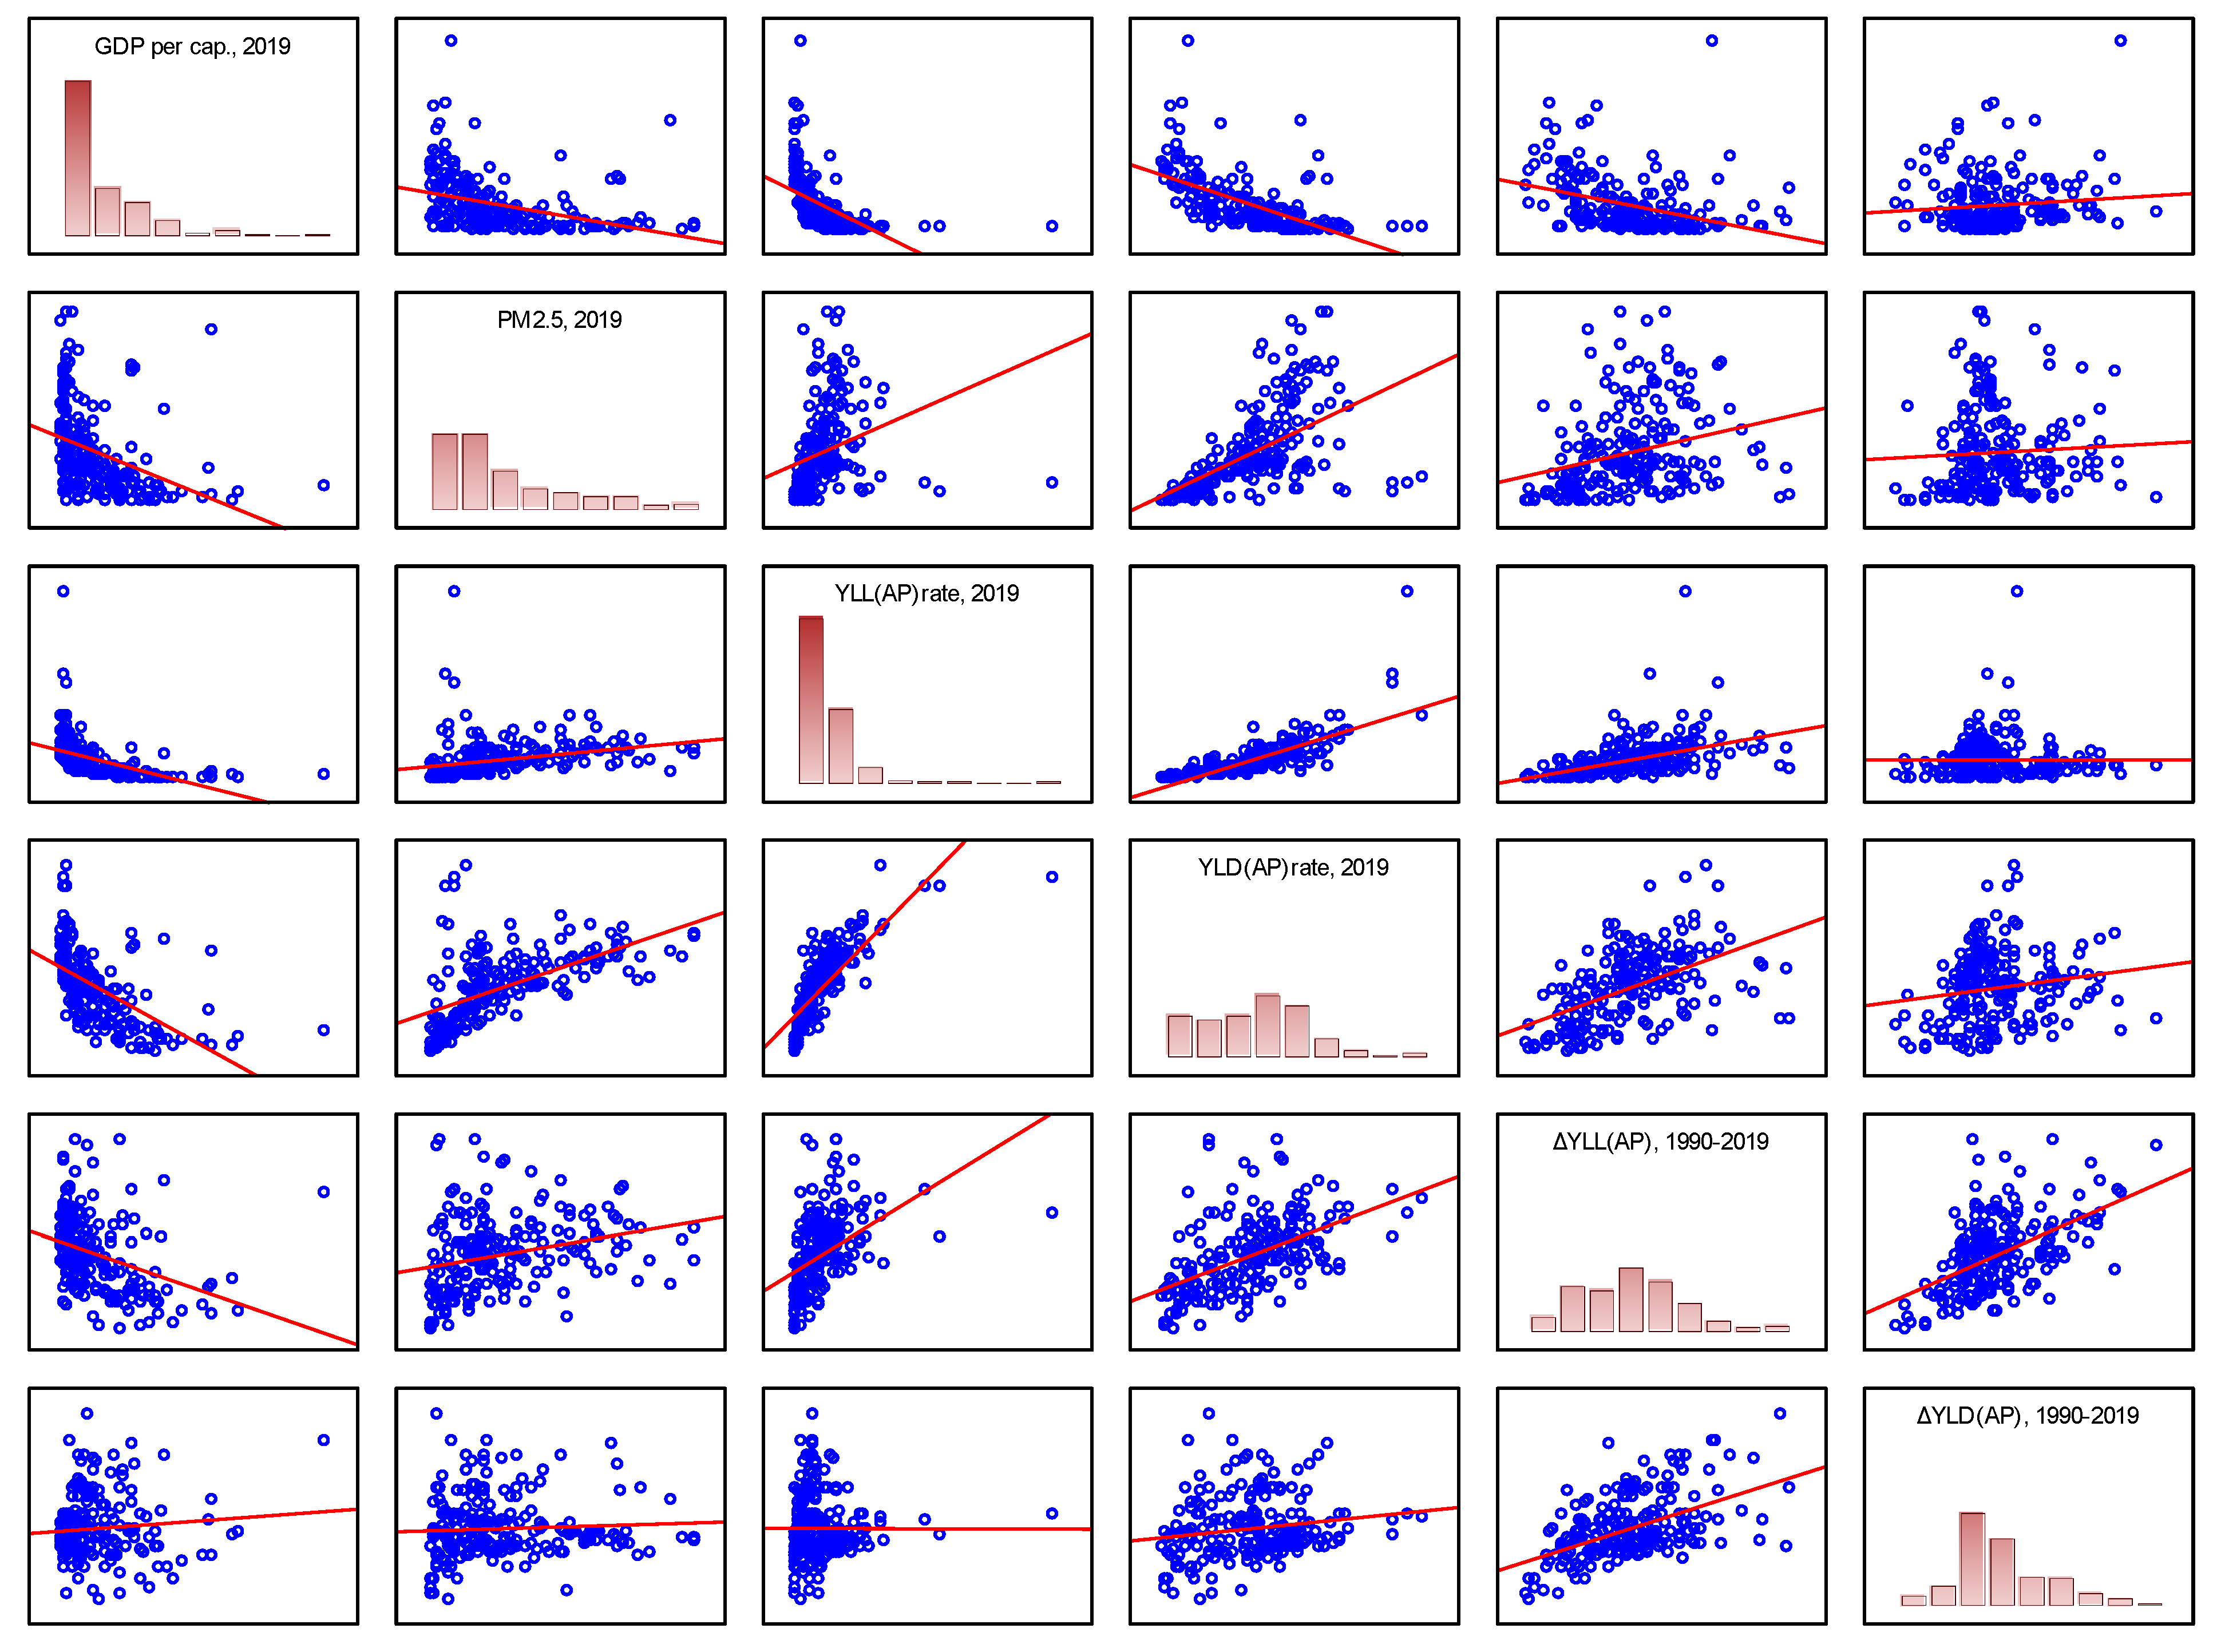
The assessment of the correlation between the level of economic development and the level of the burden of disease caused by air pollution confirms the existence of a relatively strong relationship between these parameters in the group of 204 countries studied (Figure 6). The results show a clear correlation between the level of economic development of a country, measured by the value of GDP per capita, and the number of years of life (YLL(AP)rate) and health (YLD(AP)rate) lost due to air pollution. The relationships presented here confirm the unfavourable patterns observed globally—residents of countries with lower national product can statistically expect a higher burden of premature death and disease from air pollution. However, it is important to remember that globally, rising GDP is independently associated with greater urbanisation, and the increase in average exposure on the upward side of the EKC curve reflects both increasing industrialisation and a greater proportion of the total population living in urban areas, where air pollution levels are highest.
Relatively strong (r ≥ 0.5) and statistically significant (p < 0.05, for α = 0.05) levels of negative correlation were obtained for both variable analyses (Table 4). The results obtained explain to some extent the reasons for the phenomenon of high air pollution levels in low-income economies. The statistically significant correlation (r = −0.37) shown between the level of national product (GDP per capita) and the level of PM2.5 pollution in its area indicates that a large part of low productivity economies are affected by higher levels of air pollution. At the same time, these results do not confirm the expected high positive correlation between PM2.5 intensity and the burden of disease from this risk factor on national economies. This suggests that there are other determinants of this process, such as access to health care. For the burden of premature mortality due to air pollution on the economy (YLLrate) in the 20–54 age group, the correlation coefficient was only 0.28. There was a stronger correlation between the intensity of exposure to PM2.5 and the burden of years of life lost due to disability (YLDrate). In this case, the correlation coefficient was 0.56 (with static significance) (Table 4).
In order to assess the persistence of global inequalities in the level of the burden of the consequences of air pollution on the world’s economies, the correlation between the observed rate of change of the parameters under study (%ΔY, 1990–2019) and their level in 2019 was also assessed. The correlation coefficient obtained for the parameter YLLrate, r = 0.46 (at p < 0.05, for α = 0.05), indicates the existence of a statistically significant, but not very strong, relationship between the current level of the burden of premature mortality due to air pollution and its rate of change over the study period. The results suggest that for a significant proportion of the countries studied, a high level of the burden indicator was associated with a higher rate of increase. This suggests that inequalities in the study group are being maintained over time. In the case of the burden of the effects of air pollution measured in years of disability (YLDrate), the correlation coefficient between the relative increase over time and the current level of burden was 0.16, which does not confirm the existing relationships in this area.
In order to verify the hypothesis assuming the existence of beta convergence in the studied process, an explanatory model of the growth of the studied characteristic in individual countries according to formula (1) was used. Assuming different initial conditions for individual world economies, determined by the level of the variables YLL(AP)rate and YLD(AP)rate in 1990, the rate of change of the analysed parameters in individual countries in the studied period (relation 2019/1990) was determined. It was assumed that in the case of countries with difficult initial conditions (high initial levels of the variables), this ratio should be as low as possible, indicating a rapid rate of decline of the parameter under study, giving the effect of catching up with the group (beta convergence).
Estimated from Formula (1), the regression models explaining the growth of the indicators studied, which determine the burden of premature death (YLLrate) or disability (YLDrate) due to air-pollution-related diseases in the study group of 204 countries, took the form:
- (a)
- YLL (AP)rate variable:
- (b)
- YLD variable (AP)rate:
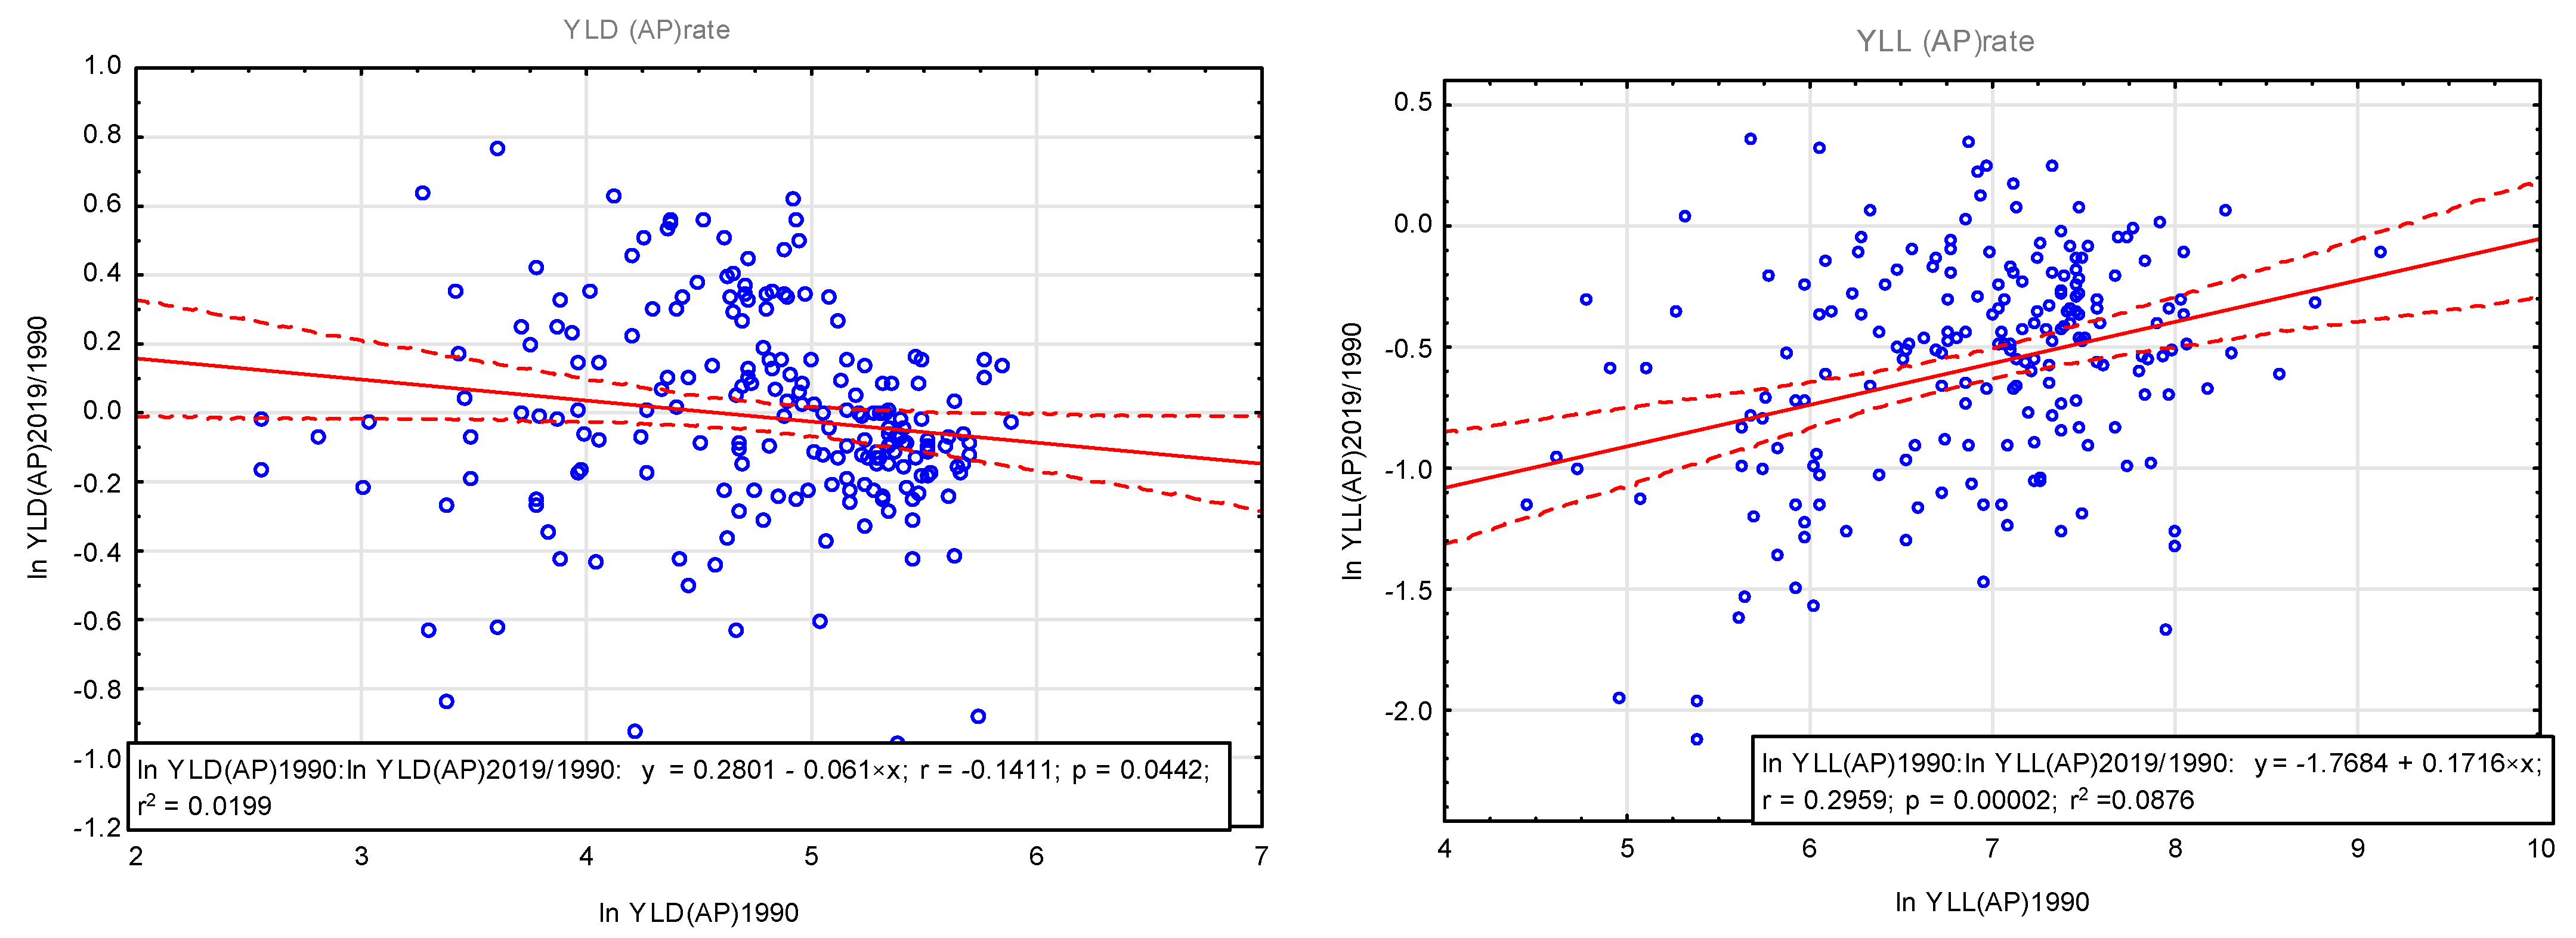
The resulting linear regression results of the parameters studied are shown in Figure 7.
In the case of the YLL(AP)rate parameter, the regression results obtained show that the value of the b-estimator is positive, indicating the absence of positive convergence effects within the group, despite a slight decrease in the degree of dispersion (variance) of the indicator under study between 1990 and 2019 (data in Table 2). This implies that disparities between the countries under study have decreased, but the observed lack of beta convergence does not warrant further conclusions in this respect. The expected effects of convergence, bringing the outlier economies (with the highest mortality burden) closer to the global average, are not visible.
In the case of the parameter YLD(AP)rate, the regression results obtained indicate that the value of the b-estimator is negative at −0.061 (at p = 0.044, for α = 0.05), which could indicate a slow convergence effect in the group (however, the so-called half-life index derived from it indicates that, at the rate of convergence determined, the current disparities would only be halved in the next 330 years). The level of variance of this variable has also decreased slightly over time (data in Table 2), confirming the slow levelling of disparities associated with the convergence process. However, the lack of a measurable decrease in the YLD(AP) ratio over time in the group of world economies studied (the level of the variable decreased by only 7% over the period 1990–2019), as well as the small share of this burden in the total air pollution burden noted above, does not provide a sound basis for inferring a reduction in global inequalities in the health burden of air pollution.
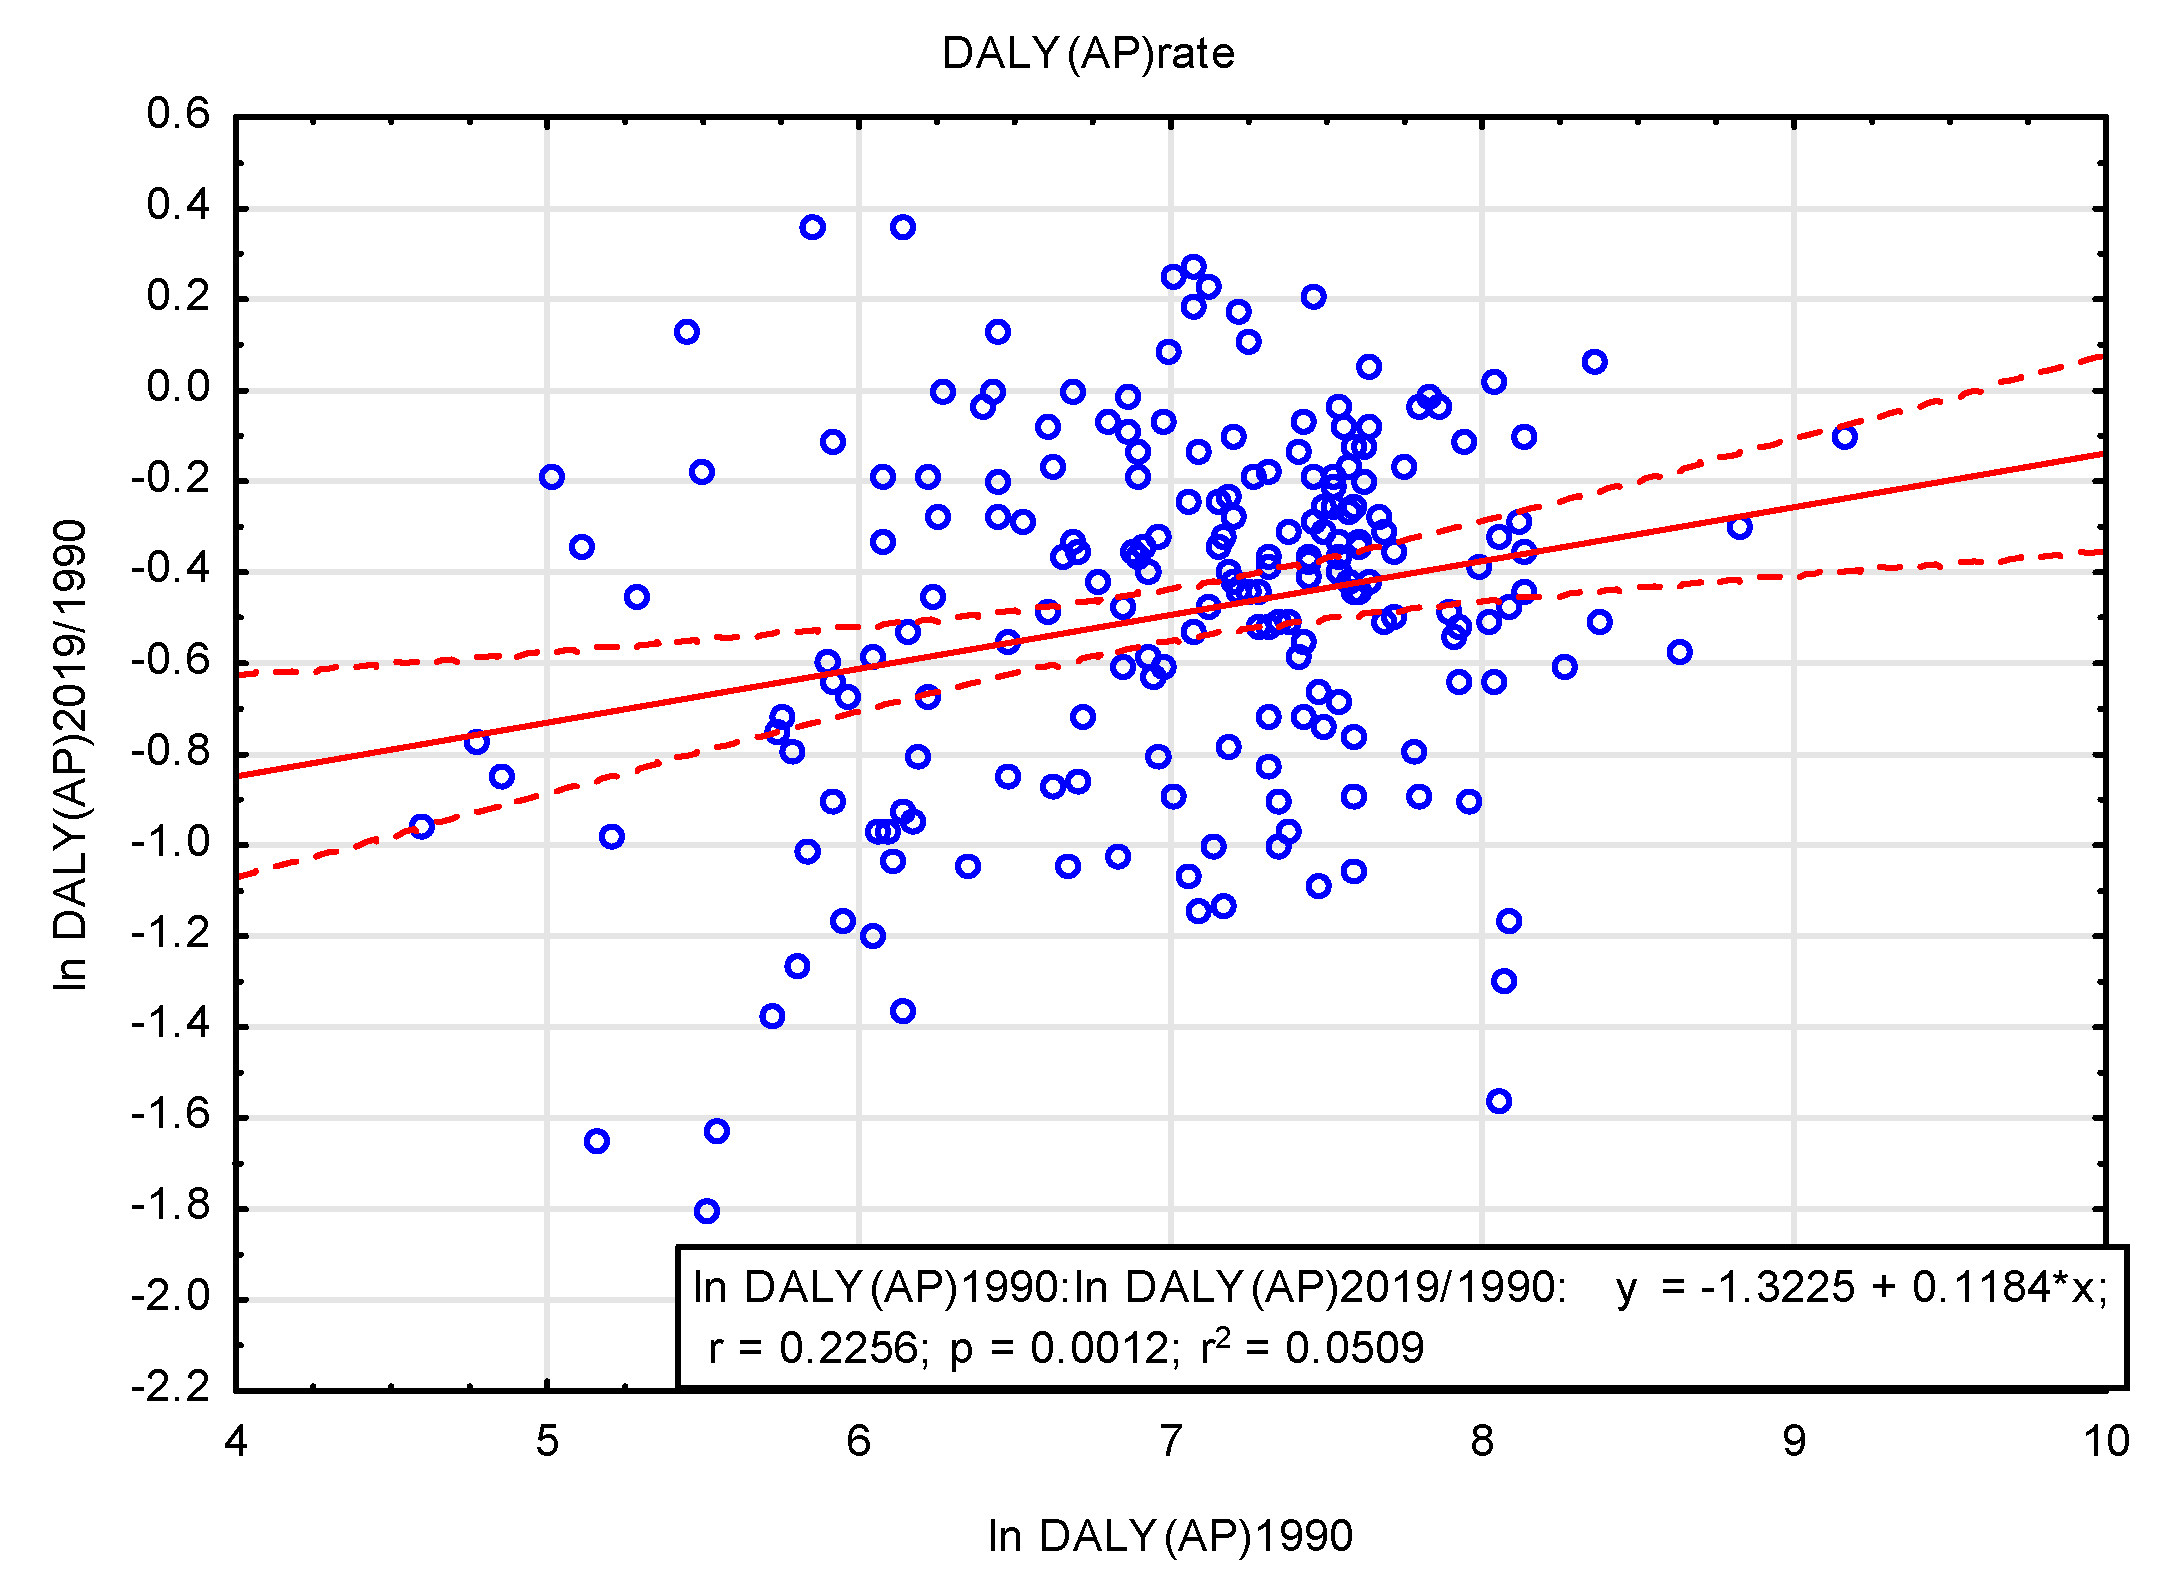
The estimated regression model explaining the incremental total burden of premature death and disability (DALYrate) due to air-pollution-related diseases in the study group of 204 countries (Figure 8) was as follows:
The results confirm that there is therefore no basis for inferring an ongoing process of convergence in the total health burden of air pollution worldwide. The parameter b (regression coefficient) is positive in this case b = 0.1184 and statistically significant (p = 0.0012, with an assumed α = 0.05).
5. Discussion
Research reported in the literature indicates that adverse health effects of PM are strongly related to the size, composition and concentration of the pollutant particles and can occur even when relative risk estimates indicate that the pollutant parameters are within the specified range of values. The combination of species and diurnal variation in particle mass and composition are also major contributors to the toxicity of PM [48]. In practice, measuring the relevant parameters and quantifying their health effects is a difficult task, as many additional external factors strongly influence human morbidity and mortality [49]. Identifying and correcting for the influence of confounding factors remains a challenging task, although scientific advances are continually providing new information on the toxicity of trace elements in ambient PM [50,51]. It is expected that in the future, multi-element analysis will be required for PM determination, allowing the use of models to identify and partition sources [52,53]. On the other hand, a growing number of studies indicate that air pollution is more hazardous to human health than previously thought [54]. The current limit values for total mass concentrations of PM10 and PM2.5 are considered to be indicators of potential risk to the environment and human health. The PM10 fraction is light enough to float in the air for long periods of time and can therefore be transported over long distances, while PM2.5 is of particular health concern because it is small enough to enter the bloodstream through the lungs and cause serious illness [55]. In September 2021, the WHO published updated global air quality guidelines, with new reference values for most air pollutants significantly lower than in the previous guidelines. The annual average values for PM2.5 were reduced from 10 to 5 μg/m3, for PM10 from 20 to 15 μg/m3 and for nitrogen dioxide from 40 to 10 μg/m3 [56].
Air pollution is a major determinant of human well-being worldwide, and the effects of air pollution and socioeconomic position (SEP) on health are well documented in the literature. Research shows that many socially disadvantaged communities, including in particular, low-income and ethnic minority communities, are exposed to disproportionately high levels of air pollution and are likely to be more vulnerable to the health effects of these pollutants due to the additional effects of material deprivation and psychosocial stress. However, the issue of assessing the socioeconomic consequences of air pollution is particularly complicated by the mechanisms that determine both the level of exposure of an area to environmental risk factors and its capacity to protect society from their adverse effects. Recent studies increasingly suggest that the level of exposure to air pollution is significantly determined by the socioeconomic position of those exposed and may play a key role in the epidemiology of disease and death [57]. As a consequence of the above, it must be borne in mind that a single variable, or a single index of several variables, cannot fully capture the mechanisms responsible for the cumulative health effects observed in specific communities following exposure to adverse environmental factors. However, many studies rely on single measures of SES, such as income or educational attainment, for lack of other options, without being able to consider the broader mechanisms through which SES may influence the relationship between air pollution and health.
The findings presented in this study are part of a trend in the literature concerning the unequal exposure of certain populations to environmental hazards and the disproportionate distribution of the effects of these hazards across populations [58,59,60,61,62]. At the same time, they are related to theories of environmental inequalities that allow deeper insights into the pathways of SES effects on levels of health inequalities [63,64], as well as providing an analytical framework to further develop studies of interactions between air pollution and social inequalities that have been conducted in the literature [65,66]. Indeed, it appears that groups with high SES, even when exposed to higher concentrations of air pollution, do not necessarily have a higher risk of disease or death. The results presented in this paper confirm that, globally, there is a stronger correlation between the level of GDP than between the level of average exposure of an area and PM2.5. Socio-economic differences, which determine limited access to resources, thus appear to be the common denominator underlying environmental inequalities.
The interdisciplinary nature of the study of environmental inequalities allows the use of a range of perspectives and tools appropriate to the social, natural and health sciences. Economic inequalities and their consequences for health have long been the focus of research by both economists and researchers from other disciplines concerned with population health. These researchers seek to understand the pathways by which socio-economic status is inversely related to indicators of health and disease. In the models they propose, people’s characteristics are linked to various environmental exposures and to access to and quality of health care [67,68,69,70]. These studies clearly confirm the influence of socioeconomic factors and air pollution on life expectancy [71,72].
Despite the remarkable popularity of the issues of social and environmental inequalities in terms of health burden, there is still a need both to seek answers and to formulate proposals for solutions. Few studies in the area of environmental risks have even looked at changes in inequalities over time, which this study seeks to fill to some extent. Essentially, its aim was to answer the question: assuming that a global clean air policy has been pursued over the past few decades, has it succeeded in reducing the existing differences between countries in this area? The results of the present study do not provide a positive answer to this question, because despite a reduction in the average burden of air pollution, measured in terms of years of life and health lost, there has been no convergence in this area leading to a reduction in the average differences between countries, as the worse-off countries catch up with the better-off ones.
It should be emphasised that considerable progress has been made in the last decade in assessing the economic burden of air pollution [73,74], but estimates based on the indirect costs of disease are still subject to a high degree of uncertainty. Indeed, there is still no consensus on appropriate methods for assessing both the value of life and the costs of mortality due to air pollution [75]. For example, attempts have been made to value the economic impact of premature deaths based on the value of statistical life expectancy (VSL) [76] or the impact of pollution, mortality and disease on GDP growth rates [77]. This makes it difficult to objectively assess the persistent inequalities in the health burden of air pollution between countries and to set public and environmental health priorities.
6. Conclusions
The economic costs of the health burden of air pollution vary considerably depending on the assessment methods used. This study shows that the health burden is unevenly distributed globally and correlates more with the level of national product than with the actual level of exposure of an area to PM2.5 concentrations. This suggests that reducing the health burden of air pollution will require addressing two issues simultaneously: reducing exposure to pollutants and improving general health and health care in low-income countries. The results do not support the assumption of an ongoing process of positive convergence in the global burden of health effects from air pollution. Despite the observed decrease in average levels of the burden of air pollution in terms of years of life and health lost over the period 1990–2019, there was no reduction in average differences between countries, as countries with a worse situation (higher burden) caught up with countries with better performance.
By focusing the analysis on the working-age population, it has also been possible to gain perspective on the so-called indirect costs of air-pollution-related ill-health due to lost economic productivity. In the case of low-income economies, this reveals an existing mechanism for amplifying negative environmental effects, as even relatively small increases in risk factors have serious health consequences. At the same time, the results obtained go beyond the environmental aspect by providing quantifiable ways of estimating the economic costs of air pollution in individual countries, taking into account the costs of lost economic productivity. The development of a counterfactual scenario in which a risk factor is reduced or eliminated in a given area is important in this case.
Funding
This research received no external funding.
Data Availability Statement
Global Burden of Disease Collaborative Network. Global Burden of Disease Study 2019 (GBD 2019) Results. Seattle, United States: Institute for Health Metrics and Evaluation (IHME), 2020. Available from https://vizhub.healthdata.org/gbd-results/ (accessed on 29 April 2023); Global Burden of Disease Collaborative Network. Global Burden of Disease Study 2019 (GBD 2019) Air Pollution Exposure Estimates 1990–2019. Seattle, United States of America: Institute for Health Metrics and Evaluation (IHME), 2021; Global Burden of Disease Health Financing Collaborator Network produced estimates for Gross Domestic Product (GDP) from 1960–2050. Estimates are reported as GDP per person in constant 2021 purchasing-power parity-adjusted (PPP) dollars. https://ghdx.healthdata.org/record/ihme-data/global-gdp-per-capita-1960-2050-fgh-2021 (accessed on 29 April 2023).
Conflicts of Interest
The authors declare no conflict of interest.
References
- Cole, M.A.; Neumayer, E. The impact of poor health on total factor productivity. J. Dev. Stud. 2006, 42, 918–938. [Google Scholar] [CrossRef]
- William, J.; Lewis, M. Health Investments and Economic Growth: Macroeconomic Evidence and Microeconomic Foundations. World Bank Policy Research Working Paper Series; The World Bank Group: Washington, DC, USA, 2009. [Google Scholar]
- Jakubowska, A.; Bilan, S.; Werbiński, J. Chronic diseases and labour resources: “Old and new” European Union member states. J. Int. Stud. 2021, 14, 129–138. [Google Scholar] [CrossRef]
- Bialowolski, P.; McNeely, E.; VanderWeele, T.J.; Weziak-Bialowolska, D. Ill health and distraction at work: Costs and drivers for productivity loss. PLoS ONE 2020, 15, e0230562. [Google Scholar] [CrossRef] [PubMed]
- Zhang, W.; Sun, H. How to analyze work productivity loss due to health problems in randomized controlled trials? A simulation study. BMC Med. Res. Methodol. 2021, 21, 130. [Google Scholar] [CrossRef] [PubMed]
- Krol, M.; Brouwer, W. How to estimate productivity costs in economic evaluations. Pharmacoeconomics 2014, 32, 335–344. [Google Scholar] [CrossRef]
- Yoshimoto, T.; Oka, H.; Fujii, T.; Nagata, T.; Matsudaira, K. The Economic Burden of Lost Productivity due to Presenteeism Caused by Health Conditions Among Workers in Japan. J. Occup. Environ. Med. 2020, 62, 883–888. [Google Scholar] [CrossRef]
- Miller, M.R.; Shaw, C.A.; Langrish, J.P. From particles to patients: Oxidative stress and the cardiovascular effects of air pollution. Future Cardiol. 2012, 8, 577–602. [Google Scholar] [CrossRef]
- Van Rijn, R.M.; Robroek, S.J.; Brouwer, S.; Burdorf, A. Influence of poor health on exit from paid employment: A systematic review. Occup. Environ. Med. 2014, 71, 295–301. [Google Scholar] [CrossRef]
- Rice, N.E.; Lang, I.A.; Henley, W.; Melzer, D. Common health predictors of early retirement: Findings from the English Longitudinal Study of Ageing. Age Ageing 2011, 40, 54–61. [Google Scholar] [CrossRef]
- Brouwer, W.; Verbooy, K.; Hoefman, R.; van Exel, J. Production Losses due to Absenteeism and Presenteeism: The Influence of Compensation Mechanisms and Multiplier Effects. PharmacoEcon. 2023. Available online: https://link.springer.com/article/10.1007/s40273-023-01253-y (accessed on 29 April 2023). [CrossRef]
- Bloom, D.E.; Canning, D.; Fink, G. Disease and development revisited. J. Political Econ. 2014, 122, 1355–1366. [Google Scholar] [CrossRef]
- Abegunde, D.; Stanciole, A. An Estimation of the Economic Impact of Chronic Noncommunicable Diseases in Selected Countries, Working Paper; WHO Department of Chronic Diseases and Health Promotion, CHP, World Health Organization: Geneva, Switzerland, 2006. [Google Scholar]
- Brown, S.; Sessions, J.G. The economics of absence: Theory and evidence. J. Econ. Surv. 1996, 10, 23–53. [Google Scholar] [CrossRef]
- GBD 2019 Risk Factors Collaborators. Global burden of 87 risk factors in 204 countries and territories, 1990–2019: A systematic analysis for the Global Burden of Disease Study 2019. Lancet 2020, 396, 1223–1249. [Google Scholar] [CrossRef]
- Global Burden of Disease Collaborative Network. Global Burden of Disease Study 2019 (GBD 2019) Results; Institute for Health Metrics and Evaluation (IHME): Seattle, WA, USA, 2020; Available online: https://vizhub.healthdata.org/gbd-results/ (accessed on 29 April 2023).
- Stern, D.I. The environmental Kuznets curve. Companion Environ. Stud. 2018, 49, 49–54. [Google Scholar]
- Kuznets, S. Economic growth and income inequality. Am. Econ. Rev. 1955, 45, 1–28. [Google Scholar]
- Dinda, S. Environmental Kuznets curve hypothesis: A survey. Ecol. Econ. 2004, 49, 431–455. [Google Scholar] [CrossRef]
- Chen, J.; Hu, T.E.; Van Tulder, R. Is the environmental Kuznets curve still valid: A perspective of wicked problems. Sustainability 2019, 11, 4747. [Google Scholar] [CrossRef]
- Leal, P.H.; Marques, A.C. The evolution of the environmental Kuznets curve hypothesis assessment: A literature review under a critical analysis perspective. Heliyon 2022, 8, e11521. [Google Scholar] [CrossRef]
- Ojaghlou, M.; Ugurlu, E.; Kadłubek, M.; Thalassinos, E. Economic Activities and Management Issues for the Environment: An Environmental Kuznets Curve (EKC) and STIRPAT Analysis in Turkey. Resources 2023, 12, 57. [Google Scholar] [CrossRef]
- Mannucci, P.M.; Franchini, M. Health Effects of Ambient Air Pollution in Developing Countries. Int. J. Environ. Res. Public Health 2017, 14, 1048. [Google Scholar] [CrossRef]
- Mannucci, P.M.; Harari, S.; Franchini, M. Novel evidence for a greater burden of ambient air pollution on cardiovascular disease. Haematologica 2019, 104, 2349–2357. [Google Scholar] [CrossRef] [PubMed]
- Roth, G.A.; Mensah, G.A.; Fuster, V. The Global Burden of Cardiovascular Diseases and Risks: A Compass for Global Action. J. Am. Coll. Cardiol. 2020, 76, 2980–2981. [Google Scholar] [CrossRef]
- Rajagopalan, S.; Al-Kindi, S.; Brook, R. Air Pollution and Cardiovascular Disease. J. Am. Coll. Cardiol. 2018, 72, 2054–2070. [Google Scholar] [CrossRef] [PubMed]
- Cai, J.; Yu, S.; Pei, Y.; Peng, C.; Liao, Y.; Liu, N.; Ji, J.; Cheng, J. Association between Airborne Fine Particulate Matter and Residents’ Cardiovascular Diseases, Ischemic Heart Disease and Cerebral Vascular Disease Mortality in Areas with Lighter Air Pollution in China. Int. J. Environ. Res. Public Health 2018, 15, 1918. [Google Scholar] [CrossRef] [PubMed]
- Sørensen, M.; Poulsen, A.H.; Hvidtfeldt, U.A.; Christensen, J.H.; Brandt, J.; Frohn, L.M.; Ketzel, M.; Andersen, C.; Valencia, V.H.; Lassen, C.F.; et al. Effects of Sociodemographic Characteristics, Comorbidity, and Coexposures on the Association between Air Pollution and Type 2 Diabetes: A Nationwide Cohort Study. Environ. Health Perspect. 2023, 131, 027008. [Google Scholar] [CrossRef]
- Bandyopadhyay, A. Neurological Disorders from Ambient (Urban) Air Pollution Emphasizing UFPM and PM2.5. Curr. Pollut. Rep. 2016, 2, 203–211. [Google Scholar] [CrossRef]
- Kim, H.; Kim, W.H.; Kim, Y.Y.; Park, H.Y. Air pollution and central nervous system disease: A review of the impact of fine particulate matter on neurological disorders. Front. Public Health 2020, 8, 575330. [Google Scholar] [CrossRef]
- Aldraihem, M.O.; Al-Ghamdi, F.; Murtaza, G.; Bashir, S. Air pollution and performance of the brain. Arab. J. Geosci. 2020, 13, 1158. [Google Scholar] [CrossRef]
- Buoli, M.; Grassi, S.; Caldiroli, A.; Carnevali, G.S.; Mucci, F.; Iodice, S.; Cantone, L.; Pergoli, L.; Bollati, V. Is there a link between air pollution and mental disorders? Environ. Int. 2018, 118, 154–168. [Google Scholar] [CrossRef]
- Khan, A.; Plana-Ripoll, O.; Antonsen, S.; Brandt, J.; Geels, C.; Landecker, H.; Sullivan, P.F.; Pedersen, C.B.; Rzhetsky, A. Environmental pollution is associated with increased risk of psychiatric disorders in the US and Denmark. PLoS Biol. 2019, 17, e3000353. [Google Scholar] [CrossRef]
- Attademo, L.; Bernardini, F.; Garinella, R.; Compton, M.T. Environmental pollution and risk of psychotic disorders: A review of the science to date. Schizophr. Res. 2017, 181, 55–59. [Google Scholar] [CrossRef]
- Hahad, O.; Lelieveld, J.; Birklein, F.; Lieb, K.; Daiber, A.; Münzel, T. Ambient Air Pollution Increases the Risk of Cerebrovascular and Neuropsychiatric Disorders through Induction of Inflammation and Oxidative Stress. Int. J. Mol. Sci. 2020, 21, 4306. [Google Scholar] [CrossRef]
- Wang, Y.; Duong, M.; Brauer, M.; Rangarajan, S.; Dans, A.; Lanas, F.; Lopez-Jaramillo, P.; Puoane, T.; Yeates, K.; Chifamba, J.; et al. Household Air Pollution and Adult Lung Function Change, Respiratory Disease, and Mortality across Eleven Low-and Middle-Income Countries from the PURE Study. Environ. Health Perspect. 2023, 131, 047015. [Google Scholar] [CrossRef]
- Rajkumar, R.P. The Relationship between Ambient Fine Particulate Matter (PM2.5) Pollution and Depression: An Analysis of Data from 185 Countries. Atmosphere 2023, 14, 597. [Google Scholar] [CrossRef]
- Migliore, L.; Coppedè, F. Environmental-induced oxidative stress in neurodegenerative disorders and aging. Mutat. Res. Genet. Toxicol. Environ. Mutagen. 2009, 674, 73–84. [Google Scholar] [CrossRef]
- Argacha, J.F.; Bourdrel, T.; van de Borne, P. Ecology of the cardiovascular system: A focus on air-related environmental factors. Trends Cardiovasc. Med. 2018, 28, 112–126. [Google Scholar] [CrossRef]
- Franchini, M.; Mannucci, P.M. Thrombogenicity and cardiovascular effects of ambient air pollution. Blood 2011, 118, 2405–2412. [Google Scholar] [CrossRef]
- Laden, F.; Schwartz, J.; Speizer, F.E.; Dockery, D.W. Reduction in fine particulate air pollution and mortality: Extended follow-up of the Harvard Six Cities study. Am. J. Respir. Crit. Care Med. 2006, 173, 667–672. [Google Scholar] [CrossRef]
- Williams, A. Calculating the global burden of disease: Time for a strategic reappraisal? Health Econ. 1999, 8, 1–8. [Google Scholar] [CrossRef]
- Łyszczarz, B.; Sowa, K. Production losses due to mortality associated with modifiable health risk factors in Poland. Eur. J. Health Econ. 2022, 23, 33–45. [Google Scholar] [CrossRef]
- Al-Hemoud, A.; Gasana, J.; Al-Dabbous, A.N.; Al-Shatti, A.; Al-Khayat, A. Disability Adjusted Life Years (DALYs) in Terms of Years of Life Lost (YLL) Due to Premature Adult Mortalities and Postneonatal Infant Mortalities Attributed to PM2.5 and PM10 Exposures in Kuwait. Int. J. Environ. Res. Public Health 2018, 15, 2609. [Google Scholar] [CrossRef] [PubMed]
- Institute for Health Metrics and Evaluation (IHME). Global Burden of Disease Collaborative Network. In Global Burden of Disease Study 2019 (GBD 2019) Air Pollution Exposure Estimates 1990–2019; Institute for Health Metrics and Evaluation (IHME): Seattle, WA, USA, 2021. [Google Scholar]
- Ritchie, H.; Roser, M. Air Pollution. Published Online at OurWorldInData.org. Available online: https://ourworldindata.org/air-pollution (accessed on 29 April 2023).
- Global Burden of Disease Health Financing Collaborator Network Produced Estimates for Gross Domestic Product (GDP) from 1960–2050. Estimates Are Reported as GDP Per Person in Constant 2021 Purchasing-Power Parity-Adjusted (PPP) Dollars. Available online: https://ghdx.healthdata.org/record/ihme-data/global-gdp-per-capita-1960-2050-fgh-2021 (accessed on 29 April 2023).
- Davidson, C.I.; Phalen, R.F.; Solomon, P.A. Airborne particulate matter and human health: A review. Aerosol Sci. Technol. 2005, 39, 737–749. [Google Scholar] [CrossRef]
- Al-Kindi, S.G.; Brook, R.D.; Biswal, S.; Rajagopalan, S. Environmental determinants of cardiovascular disease: Lessons learned from air pollution. Nat. Rev. Cardiol. 2020, 17, 656–672. [Google Scholar] [CrossRef] [PubMed]
- Agibayeva, A.; Guney, M.; Karaca, F.; Kumisbek, A.; Kim, J.R.; Avcu, E. Analytical Methods for Physicochemical Characterization and Toxicity Assessment of Atmospheric Particulate Matter: A Review. Sustainability 2022, 14, 13481. [Google Scholar] [CrossRef]
- Hassan Bhat, T.; Jiawen, G.; Farzaneh, H. Air Pollution Health Risk Assessment (AP-HRA), Principles and Applications. Int. J. Environ. Res. Public Health 2021, 18, 1935. [Google Scholar] [CrossRef] [PubMed]
- Ogrizek, M.; Kroflič, A.; Šala, M. Critical review on the development of analytical techniques for the elemental analysis of airborne particulate matter. Trends Environ. Anal. Chem. 2022, 33, e00155. [Google Scholar] [CrossRef]
- Lavigne, E.; Burnett, R.T.; Weichenthal, S. Association of short-term exposure to fine particulate air pollution and mortality: Effect modification by oxidant gases. Sci. Rep. 2018, 8, 16097. [Google Scholar] [CrossRef]
- Carvalho, H. New WHO global air quality guidelines: More pressure on nations to reduce air pollution levels. Lancet Planet. Health 2021, 5, e760–e761. [Google Scholar] [CrossRef]
- Lelieveld, J.; Evans, J.; Fnais, M.; Giannadaki, D.; Pozzer, A. The contribution of outdoor air pollution sources to premature mortality on a global scale. Nature 2015, 525, 367–371. [Google Scholar] [CrossRef]
- WHO. WHO Global Air Quality Guidelines. In Particulate Matter (PM2.5 and PM10), Ozone, Nitrogen Dioxide, Sulfur Dioxide and Carbon Monoxide; World Health Organization: Geneva, Switzerland, 2021. [Google Scholar]
- O’Neill, M.S.; Jerrett, M.; Kawachi, I.; Levy, J.I.; Cohen, A.J.; Gouveia, N.; Wilkinson, P.; Fletcher, T.; Cifuentes, L.; Schwartz, J.; et al. Workshop on Air Pollution and Socioeconomic Conditions. Health, wealth, and air pollution: Advancing theory and methods. Environ. Health Perspect. 2003, 111, 1861–1870. [Google Scholar] [CrossRef]
- Hajat, A.; Hsia, C.; O’Neill, M.S. Socioeconomic disparities and air pollution exposure: A global review. Curr. Environ. Health Rep. 2015, 2, 440–450. [Google Scholar] [CrossRef]
- Gouveia, N. Addressing Environmental Health Inequalities. Int. J. Environ. Res. Public Health 2016, 13, 858. [Google Scholar] [CrossRef]
- Goodman, A.; Wilkinson, P.; Stafford, M.; Tonne, C. Characterising socio-economic inequalities in exposure to air pollution: A comparison of socio-economic markers and scales of measurement. Health Place 2011, 17, 767–774. [Google Scholar] [CrossRef]
- Molitor, J.; Su, J.; Molitor, N.T.; Rubio, V.G.; Richardson, S.; Hastie, D.; Morello-Frosch, R.; Jerrett, M. Identifying vulnerable populations through an examination of the association between multi-pollutant profiles and poverty. Environ. Sci. Technol. 2011, 45, 7754–7760. [Google Scholar] [CrossRef]
- Jakubowska, A.; Rabe, M. Air Pollution and Limitations in Health: Identification of Inequalities in the Burdens of the Economies of the “Old” and “New” EU. Energies 2022, 15, 6225. [Google Scholar] [CrossRef]
- Grandjean, P.; Bellanger, M. Calculation of the disease burden associated with environmental chemical exposures: Application of toxicological information in health economic estimation. Environ. Health 2017, 16, 123. [Google Scholar] [CrossRef] [PubMed]
- Miranda, M.L.; Edwards, S.E.; Keating, M.H.; Paul, C.J. Making the Environmental Justice Grade: The Relative Burden of Air Pollution Exposure in the United States. Int. J. Environ. Res. Public Health 2011, 8, 1755–1771. [Google Scholar] [CrossRef]
- Fairburn, J.; Schüle, S.A.; Dreger, S.; Karla Hilz, L.; Bolte, G. Social Inequalities in Exposure to Ambient Air Pollution: A Systematic Review in the WHO European Region. Int. J. Environ. Res. Public Health 2019, 16, 3127. [Google Scholar] [CrossRef] [PubMed]
- Shen, W.; Srivastava, S.; Yang, L.; Jain, K.; Schröder, P. Understanding the impacts of outdoor air pollution on social inequality: Advancing a just transition framework. Local Environ. 2020, 25, 1–17. [Google Scholar] [CrossRef]
- Santana, P.; Almendra, R.; Pilot, E.; Doreleijers, S.; Krafft, T. Environmental Inequalities in Global Health. In Handbook of Global Health; Kickbusch, I., Ganten, D., Moeti, M., Eds.; Springer: Cham, Switzerland, 2021. [Google Scholar] [CrossRef]
- Spalt, E.W.; Curl, C.L.; Allen, R.W.; Cohen, M.; Williams, K.; Hirsch, J.; Adar, S.D.; Kaufman, J. Factors influencing time-location patterns and their impact on estimates of exposure: The Multi-Ethnic Study of Atherosclerosis and Air Pollution (MESA Air). J. Expo. Sci. Environ. Epidemiol. 2016, 26, 341–348. [Google Scholar] [CrossRef]
- Samet, J.M. The environment and health inequalities: Problems and solutions. J. Health Inequalities 2019, 5, 21–27. [Google Scholar] [CrossRef]
- Martinez, G.S.; Spadaro, J.V.; Chapizanis, D.; Kendrovski, V.; Kochubovski, M.; Mudu, P. Health Impacts and Economic Costs of Air Pollution in the Metropolitan Area of Skopje. Int. J. Environ. Res. Public Health 2018, 15, 626. [Google Scholar] [CrossRef] [PubMed]
- Yang, H.; Wang, S.; Ren, Z.; Liu, H.; Tong, Y.; Wang, N. Life expectancy, air pollution, and socioeconomic factors: A multivariate time-series analysis of Beijing City, China. Soc. Indic. Res. 2022, 162, 979–994. [Google Scholar] [CrossRef]
- Pu, H.; Wang, S.; Wang, Z.; Ran, Z.; Jiang, M. Non-linear relations between life expectancy, socio-economic, and air pollution factors: A global assessment with spatial disparities. Environ. Sci. Pollut. Res. 2022, 29, 53306–53318. [Google Scholar] [CrossRef]
- Yin, H.; Brauer, M.; Zhang, J.; Cai, W.; Navrud, S.; Burnett, R.; Howard, C.; Deng, Z.; Kammen, D.M.; Schellnhuber, H.J.; et al. Population ageing and deaths attributable to ambient PM2·5 pollution: A global analysis of economic cost. Lancet Planet Health 2021, 5, e356–e367. [Google Scholar] [CrossRef]
- Conti, S.; Ferrara, P.; D’Angiolella, L.S.; Lorelli, S.C.; Agazzi, G.; Fornari, C.; Cesana, G.; Mantovani, L.G. The economic impact of air pollution: A European assessment. Eur. J. Public Health 2020, 30 (Suppl. S5), ckaa165-084. [Google Scholar] [CrossRef]
- Nair, M.; Bherwani, H.; Mirza, S.; Anjum, S.; Kumar, R. Valuing burden of premature mortality attributable to air pollution in major million-plus non-attainment cities of India. Sci. Rep. 2021, 11, 22771. [Google Scholar] [CrossRef]
- Safari, Z.; Fouladi-Fard, R.; Vahedian, M.; Mahmoudian, M.H.; Rahbar, A.; Fiore, M. Health impact assessment and evaluation of economic costs attributed to PM2.5 air pollution using BenMAP-CE. Int. J. Biometeorol. 2022, 66, 1891–1902. [Google Scholar] [CrossRef]
- Maiti, M.; Jadhav, P. Impact of pollution level, death rate and illness on economic growth: Evidence from the global economy. SN Bus. Econ. 2021, 1, 109. [Google Scholar] [CrossRef]
Figure 1.
Integrated exposure–response curve for long-term exposure to PM2.5—relative risk (RR) values as a function of total PM2.5 intensity. Source: own elaboration based on: [45].
Figure 1.
Integrated exposure–response curve for long-term exposure to PM2.5—relative risk (RR) values as a function of total PM2.5 intensity. Source: own elaboration based on: [45].

Figure 2.
Spatial distribution of PM2.5 concentrations in 2019 and change from 1990 to 2019, N = 204. Source: own elaboration based on: [45].
Figure 2.
Spatial distribution of PM2.5 concentrations in 2019 and change from 1990 to 2019, N = 204. Source: own elaboration based on: [45].

Figure 3.
Relationship between the level of GDP per capita income level and PM2.5 air pollution levels. Source: GDP per capita [47] and PM2.5 in µg/m3 [45].

Figure 4.
Distribution of YLL(AP)rate and YLD(AP)rate, population aged 20–54, 1990 and 2019, N = 204. Source: own study based on the data: [16].
Figure 4.
Distribution of YLL(AP)rate and YLD(AP)rate, population aged 20–54, 1990 and 2019, N = 204. Source: own study based on the data: [16].

Figure 5.
Contribution of air pollution (AP) to premature deaths and disability years, population aged 20–54, in 2019, N = 204.
Figure 5.
Contribution of air pollution (AP) to premature deaths and disability years, population aged 20–54, in 2019, N = 204.

Figure 6.
Correlation matrix.

Figure 7.
Patterns of convergence of YLLrate and YLDrate due to air pollution—beta convergence, over the period 1990–2019, N = 204.
Figure 7.
Patterns of convergence of YLLrate and YLDrate due to air pollution—beta convergence, over the period 1990–2019, N = 204.

Figure 8.
Patterns of DALYrate convergence due to air pollution—beta convergence, over the period 1990–2019, N = 204.
Figure 8.
Patterns of DALYrate convergence due to air pollution—beta convergence, over the period 1990–2019, N = 204.


Table 1.
Summary exposure value (SEV) rate for 1990, 2019 and annualised rate of change (ARC) for 1990–2019.
Table 1.
Summary exposure value (SEV) rate for 1990, 2019 and annualised rate of change (ARC) for 1990–2019.
| Risks | SEV 1990 * | SEV 2019 | ARC 1990–2019 |
|---|---|---|---|
| I. Environmental/occupational risks | 52.55 (48.66–55.92) ** | 45.36 (41.16–49.19) | −0.51 (−0.62–−0.40) * |
| A. Air pollution | 45.37 (32.89–56.28) | 34.72 (25.86–44.40) | −0.92 (−1.25–−0.61) * |
| A1. Particulate matter pollution | 44.26 (31.87–55.07) | 33.84 (25.08–43.43) | −0.93 (−1.26–−0.61) * |
| A1a. Ambient particulate matter pollution | 15.65 (10.61–21.58) | 26.19 (21.55–30.48) | 1.78 (0.95–2.71) * |
| A1b. Household air pollution from solid fuels | 27.33 (16.18–38.86) | 12.04 (6.72–18.82) | −2.83 (−3.53–−2.20) * |
| A2. Ambient ozone pollution | 50.67 (22.95–73.01) | 61.19 (32.26–80.39) | 0.65 (0.33–1.25) * |
* Summary exposure value (SEV) is the RR-weighted prevalence of exposure, a univariate measure of risk weighted exposure, taking the value zero when no excess risk for a population exists and the value one when the population is at the highest level of risk. SEVs have been reported on a scale from 0% to 100%, on which a decline in SEV indicates reduced exposure to a given risk factor and an increase in SEV indicates increased exposure. ** 95% uncertainty interval (UI). Source: [45].
Table 2.
Descriptive statistics—YLL(AP)rate and YLD(AP)rate, population aged 20–54, 1990 and 2019, N = 204.
Table 2.
Descriptive statistics—YLL(AP)rate and YLD(AP)rate, population aged 20–54, 1990 and 2019, N = 204.
| Variable | Descriptive Statistics | ||||||
|---|---|---|---|---|---|---|---|
| N Valid | Mean | Min. | Max. | Variance | SD | CV | |
| YLL(AP)rate, 1990 | 204 | 1349.0 | 86.0 | 9249.9 | 1,193,365.6 | 1092.4 | 81.0 |
| YLL(AP)rate, 2019 | 204 | 879.8 | 20.4 | 8299.1 | 780,868.3 | 883.7 | 100.4 |
| YLD(AP)rate, 1990 | 204 | 144.6 | 12.9 | 360.3 | 6259.0 | 79.1 | 54.7 |
| YLD(AP)rate, 2019 | 204 | 143.0 | 11.0 | 396.3 | 5674.7 | 75.3 | 52.7 |
Source: own study based on the data: [16].
Table 3.
Air pollution (AP) burden of disease—YLLrate/YLD rate, population aged 20–54, by country group (breakdown by World Bank income level), in 2019 and change from 1990 to 2019.
Table 3.
Air pollution (AP) burden of disease—YLLrate/YLD rate, population aged 20–54, by country group (breakdown by World Bank income level), in 2019 and change from 1990 to 2019.
| World Bank Income Group | YLLs (AP) 2019 | YLDs (AP) 2019 | ||||
|---|---|---|---|---|---|---|
| Rate * | % in | Rate * | % in | |||
| All Causes | NCD | All Causes | NCD | |||
| 2019 | ||||||
| High Income | 219.4 | 3.1% | 4.2% | 68.7 | 0.5% | 0.6% |
| Upper-Middle Income | 771.5 | 7.6% | 12.4% | 163.6 | 1.6% | 1.9% |
| Lower-Middle Income | 1343.0 | 9.5% | 16.3% | 223.3 | 2.0% | 2.5% |
| Low Income | 1428.5 | 7.3% | 15.5% | 209.8 | 1.9% | 2.5% |
| Change over the period 1990–2019 (%) | ||||||
| High Income | −50.0% | −31.5% | −40.3% | 7.9% | 3.4% | 1.4% |
| Upper-Middle Income | −40.4% | −17.6% | −19.9% | −2.4% | −4.7% | −6.8% |
| Lower-Middle Income | −22.6% | 12.6% | −7.5% | −7.6% | −4.1% | −7.2% |
| Low Income | −35.2% | 12.6% | −11.0% | −10.8% | −3.5% | −11.9% |
* YLLs/YLDs per 100,000 people.
Table 4.
Correlation results.
| Average | SD | GDP Per Cap., 2019 1 | PM2.5 (Annual Mean, µg/m3), 2019 2 | YLL(AP) Rate, 2019 3 | YLD(AP) Rate, 2019 3 | %ΔYLL(AP) Rate, 1990–2019 | %ΔYLD(AP) Rate, 1990–2019 | |
|---|---|---|---|---|---|---|---|---|
| GDP per cap., 2019 | 22658 | 24332 | 1.000 | −0.368 * | −0.489 * | −0.595 * | −0.362 * | 0.092 |
| PM2.5 (annual mean, µg/m3), 2019 | 26.1 | 17.7 | −0.368 * | 1.000 | 0.283 * | 0.560 * | 0.274 * | 0.056 |
| YLL(AP)rate, 2019 | 879.8 | 883.7 | −0.489 * | 0.283 * | 1.000 | 0.785 * | 0.458 * | −0.002 |
| YLD(AP)rate, 2019 | 143.0 | 75.3 | −0.595 * | 0.560 * | 0.785 * | 1.000 | 0.516 * | 0.163 * |
| ΔYLL(AP)rate, 1990–2019 | −38% | 26% | −0.362 * | 0.274 * | 0.458 * | 0.516 * | 1.000 | 0.522 * |
| ΔYLD(AP)rate, 1990–2019 | 3% | 31% | 0.092 | 0.056 | −0.002 | 0.163 * | 0.522 * | 1.000 |
Disclaimer/Publisher’s Note: The statements, opinions and data contained in all publications are solely those of the individual author(s) and contributor(s) and not of MDPI and/or the editor(s). MDPI and/or the editor(s) disclaim responsibility for any injury to people or property resulting from any ideas, methods, instructions or products referred to in the content. |
© 2023 by the author. Licensee MDPI, Basel, Switzerland. This article is an open access article distributed under the terms and conditions of the Creative Commons Attribution (CC BY) license (https://creativecommons.org/licenses/by/4.0/).
Share and Cite
MDPI and ACS Style
Jakubowska, A. The Burden of Air Pollution: A Perspective on Global Health Inequalities. Pollutants 2023, 3, 419-436. https://doi.org/10.3390/pollutants3030029
AMA Style
Jakubowska A. The Burden of Air Pollution: A Perspective on Global Health Inequalities. Pollutants. 2023; 3(3):419-436. https://doi.org/10.3390/pollutants3030029
Chicago/Turabian StyleJakubowska, Agnieszka. 2023. "The Burden of Air Pollution: A Perspective on Global Health Inequalities" Pollutants 3, no. 3: 419-436. https://doi.org/10.3390/pollutants3030029