1. Introduction
The wastewater forms part of the water cycle, and it also must be managed throughout the entire water cycle [
1]. Wastewater is defined as water whose quality has been altered due to the presence of anthropogenic substances [
2]. These include chemical substances and a variety of microorganisms [
3]. The vast majority of wastewater, including agricultural runoffs, is not collected or treated globally [
1]. As a result, in most cases, they are simply discharged into the environment without any prior treatment. Developed countries treat most of the wastewater they produce, followed by developing countries, and underdeveloped countries treat about 28% of their wastewater. However, in African countries, a lack of financial capital for the development of wastewater facilities limits wastewater management options [
1].
Sub-Saharan Africa is one of the world’s driest, with very little annual rainfall. As a result, it is also classified as water-stressed, as its water systems are frequently overburdened due to rapidly growing populations and rapid urbanization. Poor urban development and population growth have resulted in settlement expansion, which eventually contributes to water demand, wastewater discharge, and heavy water resource pollution [
4]. It is estimated that 60% of Sub-Saharan Africa’s urban population lives in shanty towns, where sanitation facilities are weak, insufficient, and unreliable [
5]. It was reported that 32 of the 48 Sub-Saharan African countries lacked statistics on wastewater generation and treatment [
6].
South Africa has made it mandatory since 1956 by enacting the Water Act (Act 54 of 1956), which requires wastewater to go through the treatment process to permissible standards before being discharged to the water resource from which the water was initially acquired [
7]. In South Africa, treated wastewater effluent has played an important role in supplementing drinking water and meeting water demand [
8]. Wastewater treatment accounts for approximately 14% of South Africa's total potential water resource [
9]. As water demand increased as a result of economic and population growth, WWTWs became more and more stressed. At the same time, the efficiency of most of these treatment plants in the removal of chemico-physical and pathogenic and indicator species is relatively low due to the deteriorating facilities, in addition to insufficient maintenance and lack of qualified staff [
10]. The poor condition of this wastewater treatment in many municipalities presents significant risks to people living in the vicinity of treatment plants, as well as to the ecosystem. As a result of this situation, water and sanitation authorities have been under pressure to find ways to maintain the quality of water resources.
The Bushbuckridge Municipality is a Water Services Authority responsible for, among others, the management of the municipal WWTW within the Sand River Catchment. The municipality is the proprietor of the Dwarsloop and Thulamahashe WWTW. These WWTWs are responsible for the treatment of wastewater to reduce the organic content and nutrient level and inactivate pathogens from wastewater before releasing it into the receiving environment. Wastewater effluent that is discharged into the environment must meet specific requirements. Monitoring the quality of wastewater discharged into water sources is therefore critical to draw attention to the condition of water sources and provide the incentive for long-term government intervention, which is the focus of this investigation.
Water treatment is thus critical in order to remove some or all of the contaminants and pathogenic or disease-causing microorganisms. Secondly, before being discharged into the environment, there must be the assurance that the disposed effluent is fit for reuse or meets the required standards before being discharged into the environment without causing harm [
11]. Furthermore, it was testified that the costs of preserving potable water should be balanced against the benefits of postponing or eliminating the need for additional water supply sources. Direct potable reuse occurs when the effluent from a wastewater reclamation facility is connected to a drinking water distribution network. Treatment costs are quite high because the water must adhere to increasingly stringent rules, both in terms of the number of variables monitored and the pollutant limits that can be exceeded [
12]. Water quality parameters of concern are faecal coliforms,
E. coli, dissolved oxygen (DO), chemical oxygen demand (COD), chloride, ammonia, nitrate, phosphate, total suspended solids (TSS), and electrical conductivity (EC) according to the standard method [
13]. The presence of the above-mentioned elements alters the quality of a water resource and hence contributes to the pollution of the catchment.
A Wastewater Treatment Works (WWTWs) should specify the quantity and the quality of effluent which can be applied to irrigate the land or discharged to the receiving water environment [
14]. WWTWs must ensure that a significant quantity of pollutants is removed in order to meet regulatory standards for water discharge while maintaining low costs related to construction and operation, thus improving the efficiency of the WWTWs and reducing environmental impact [
15]. As a result, additional criteria have to be considered to assess the WWTW's technical dependability as well as the potential environmental harm caused by the treated effluent.
Poorly treated sewage effluents can contaminate water resources, causing high nutrient and salt levels, decreased oxygen levels, and an increase in the number of pathogens in the water body [
16]. Previous research has found that the deteriorating state of municipal WWTWs infrastructure in South Africa is the main contributor to pollution problems experienced in the country, as well as the leading contributor to health problems in poor communities [
12].
In the Sabie Sand Catchment, the microbiological water quality in all four sub-catchments is of major concern. According to the report, the numbers of
Escherichia coli (
E. coli) counts were high during the investigation period. These high
E. coli counts could have been caused by overflows from sewage system infrastructure manholes, illegal dumping of solid waste material, burst sewage reticulation pipelines, and non-functional pump stations. All of these pose serious health risks to people's livelihoods along the sub-catchment because these catchment areas are the primary sources of water for industrial, domestic, and agricultural uses [
17]. The pollution of water sources is a global problem that is predominantly affecting rural communities that directly depend on untreated water from these sources daily for domestic use. Therefore, the aim of this study was to investigate the extent to which the WWTWs along the Sand River Catchment cause pollution, as well as to serve as a tool for recommending remedial and mitigating strategies to enhance riverine water quality by identifying pollution sources and their effects.
2. Materials and Methods
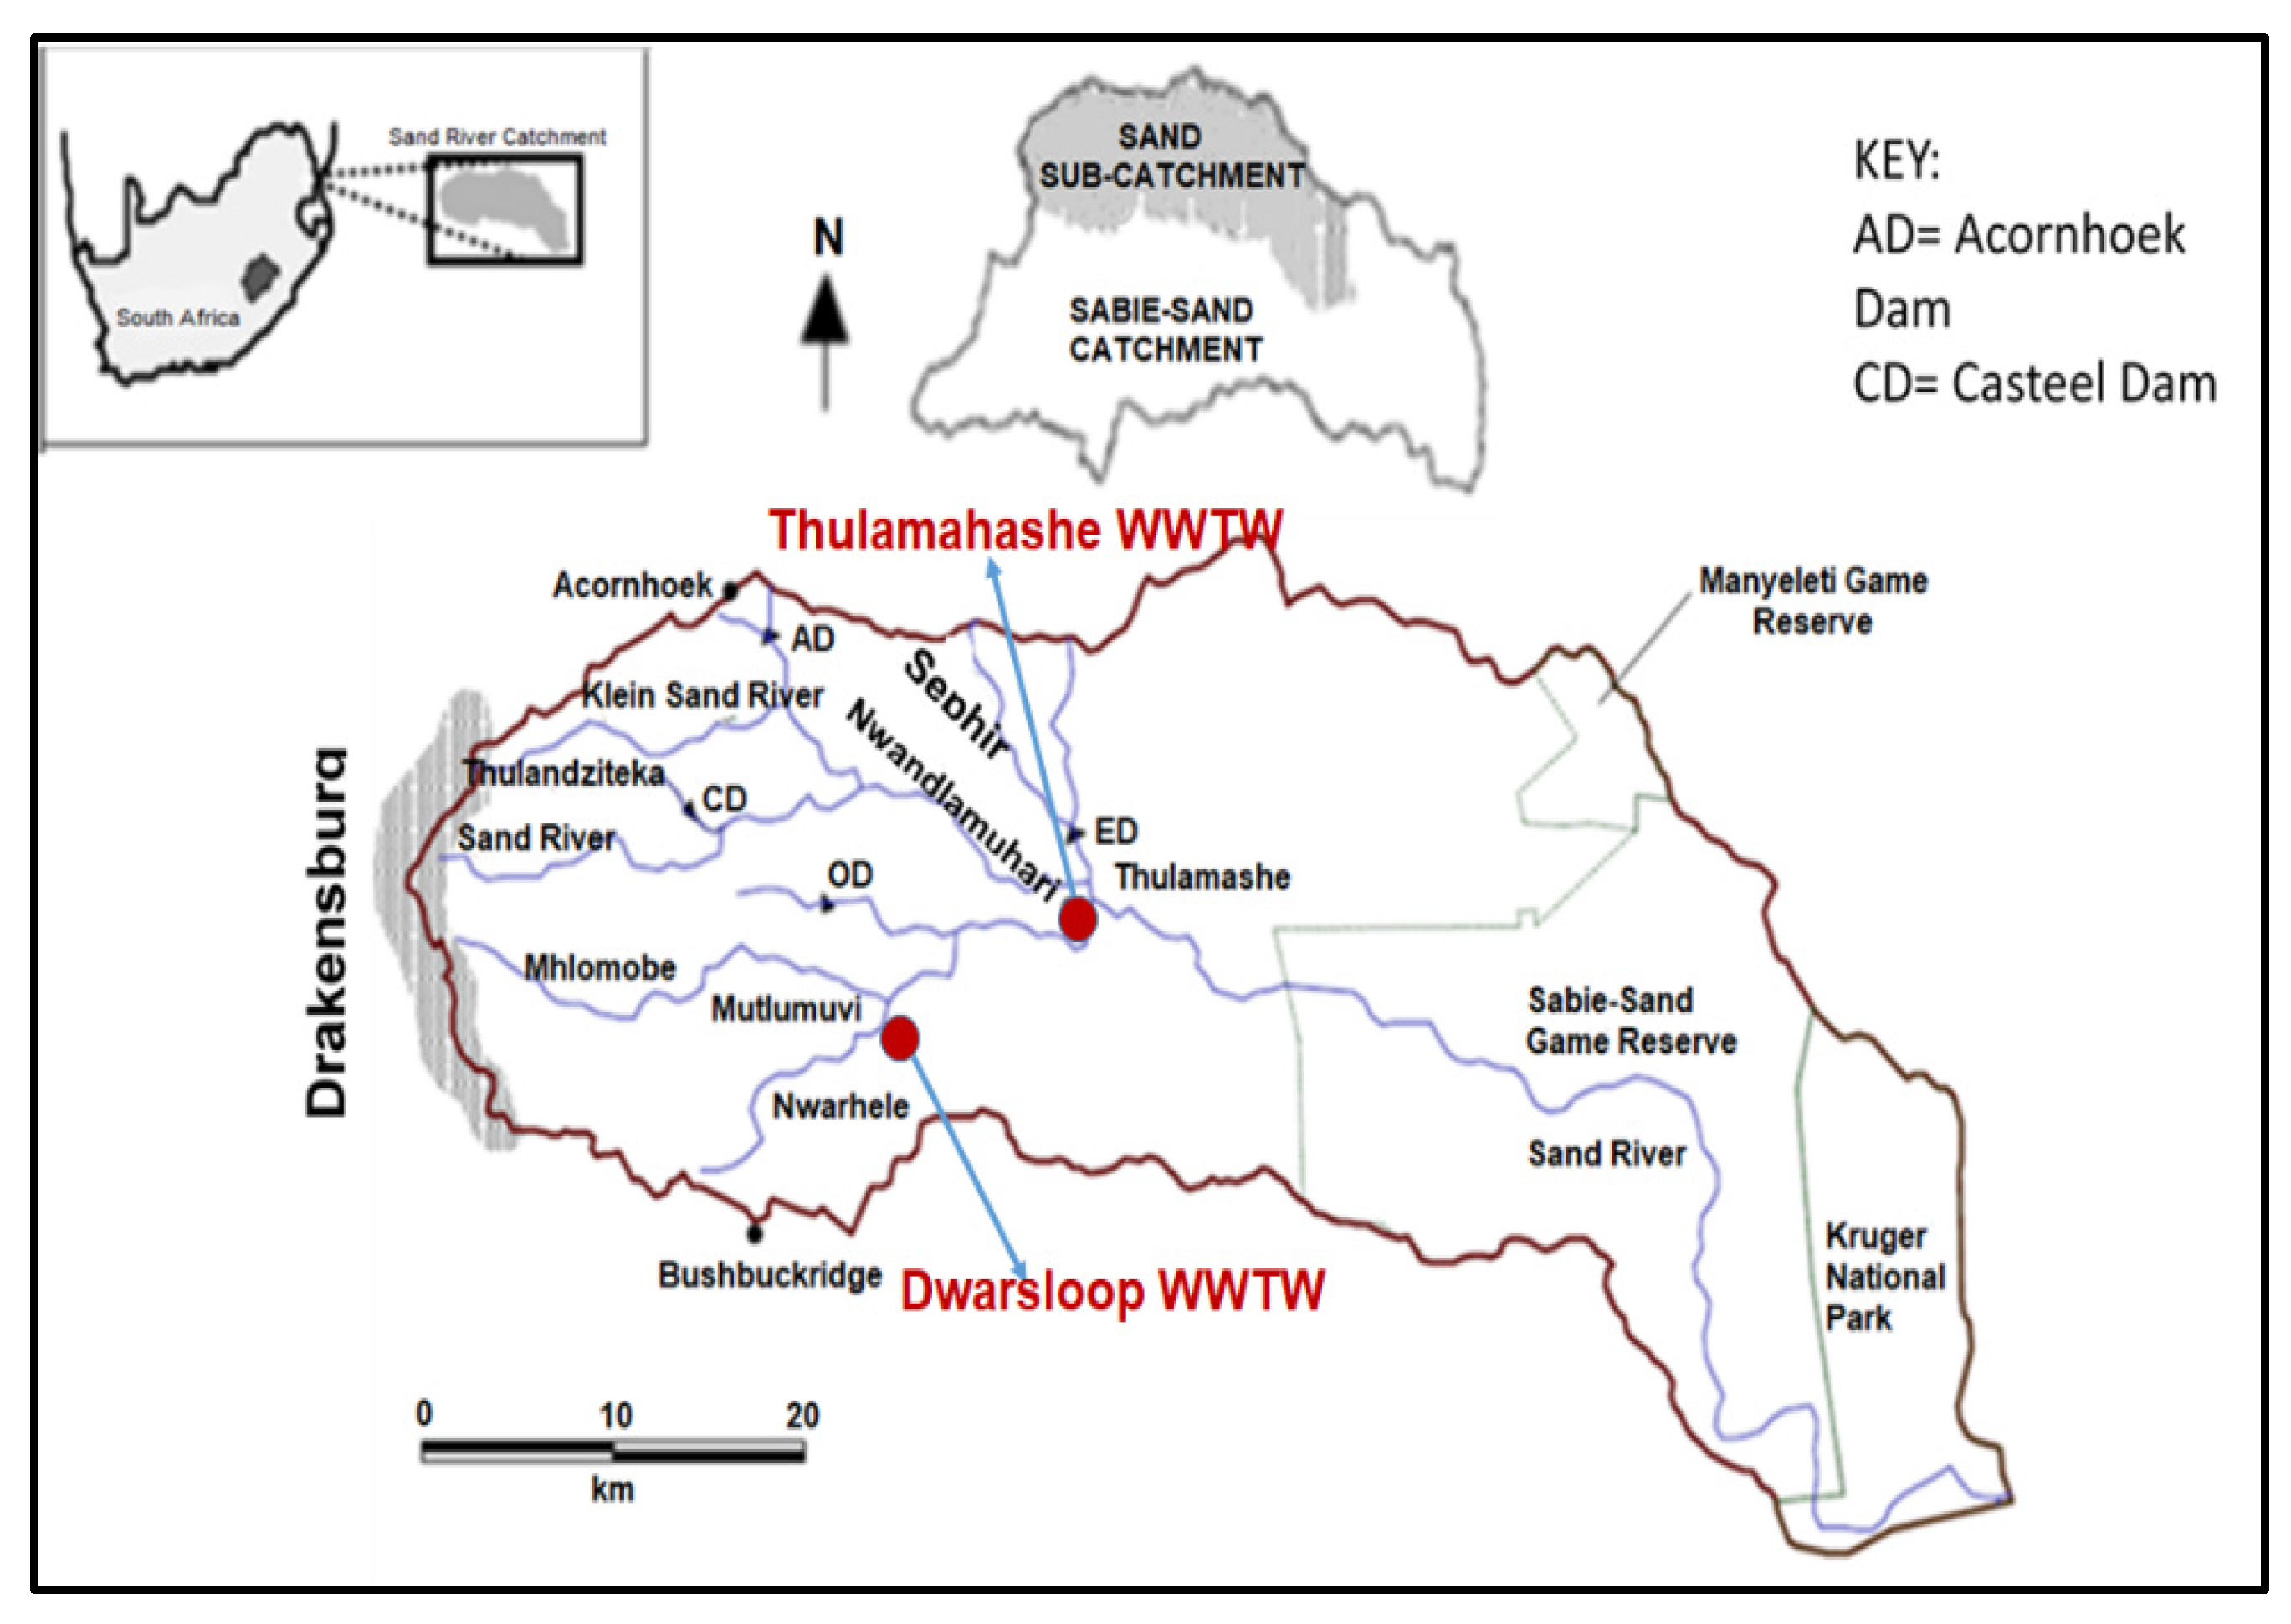
This study adopted a descriptive and experimental design approach. The study population comprised members from the Municipal authority, individual interested affected parties, Nongovernmental Organizations (NGOs), and members from Irrigation Boards. They were surveyed with the supplement of the snowball sampling method, administered to 60 participants in Mpumalanga Province’s Enhlazeni District within the Bushbuckridge Local Municipality. The study area has two wastewater treatment plants, which are currently in operation. These are Dwarsloop and Thulamahashe Wastewater Treatment Works. The study was conducted in the Sand River Catchment (
Figure 1). The Sand River is the tributary of the Sabie River, which makes up the Sabie Sand Catchment.
There are five main dams in the Sabie Sand Catchment, namely: Inyaka, Dagama, Eidenburg, Mahleve, and the Swartfontein Dams. The catchment is dominated by trout farming, forestry at the upper reaches of the catchment, as well as housing developments such as guest houses, lodges, and hotels.
Data collection was performed using open-ended questionnaires, Waste Water Treatment Works (WWTWs) assessment forms, and water quality monitoring for microbiological and chemical variables. Water samples were collected from October 2019 to September 2020 during dry and wet seasons. Samples were collected on a monthly basis using thoroughly cleaned and sterile 1 L plastic bottles according to the standard procedures described in the sampling guide of the Department of Water and Sanitation. Each bottle was tagged to record its location, date and time of sampling, and unique site name. For microbiological analysis, sample bottles contained sodium thiosulphate to neutralize chlorine. Thereafter samples were carefully packed and transported in a cooler box containing ice packs to prevent possible physical, chemical, or biological changes to the samples. The samples were transported to Zamangwane Water Technology Laboratory for analysis within 24 h after collection.
The WWTWs performance data were collected by conducting plant performance assessment monthly at the two selected WWTWs located within the Sand River Catchment to assess the performance of the particular WWTW for a year. The data from the administered questionnaires and WWTW’s assessment forms were statistically analyzed using the Statistical Package for the Social Sciences (SPSS) version 26.0 (IBM Corporation, Armonk, New York, NY, USA).
The collected water samples were analyzed for the following physical parameters: pH and electrical conductivity (EC). These parameters were measured in situ using the HACH model HQ30D multi-parameter portable pH and conductivity/TDS meter. The instrument and probes were calibrated for pH using buffer 4 and 7 solutions and for EC using 141.3 mS/m according to the manufacturer’s instructions. A gravimetric method was used to analyze the total suspended solids (TSS) of the water samples [
18]. The spectrophotometric method was used, DR600 (HACH) spectrophotometer, to assess the concentrations of ortho-phosphate as phosphorous, nitrate/nitrite as nitrogen, ammonia as nitrogen, and chemical oxygen demand (COD) in water samples. Samples for COD analyses were digested with a HACH reactor Model DRB 200 and then analyzed by the Spectrophotometer DR 6000. Water samples were analyzed in triplicate to evaluate the validity of the results, and a control standard was also included. The enumeration of faecal coliforms and
E. coli in the water samples was carried out using the Colilert™ 18 Quanti-Tray/2000 system (IDEXX Laboratories (Pty) Ltd., Johannesburg, South Africa) following the manufacturer's specifications. The Colilert 18 method uses a multiple tube technique that gives the most probable number (MPN) of cells,
E. coli which was detected after sealed quanti-trays were incubated at 35 °C for 18–24 h. Trays were examined under UV, and wells that fluoresced were recorded, and the MPN of
E. coli in the sample was inferred from the statistical table provided with the Colilert reagent, whereas a yellow color indicated the presence of the total coliforms.
All ethical codes of conduct were followed according to the Tshwane University of Technology (TUT) requirements. Participants were informed about the essence and nature of the study before the study began.
3. Results
3.1. Questionnaire Survey
The distribution of 60 stakeholders who participated in the study were mostly representatives of the Municipality (n = 21; 35%) followed by the individual interested and affected parties (n = 17; 28%), the NGOs (n = 12; 20%) and irrigation boards (n = 10; 17%) were represented by a minority of participants, respectively. According to all participants (n = 60; 100%) in the study, the Sand River Catchment receives high levels of sewer pollution, which negatively affects the catchment’s water quality. In a survey about pollution and the state of the water quality in the Sand River Catchment, 51% (n = 31) of respondents replied that WWTWs are the source of pollution, while 27% (n = 16) said human settlement and 22% (n = 13) said agriculture. In terms of the roles of CMAs, communities, and municipalities in protecting the catchment, 83% of participants stated that “communities can assist in reporting any spillages that may pollute the catchment to the municipality and the CMA.” They also suggested that the municipality should provide in-service training for employees and employ experienced process controllers and managers for the operation of the WWTW.
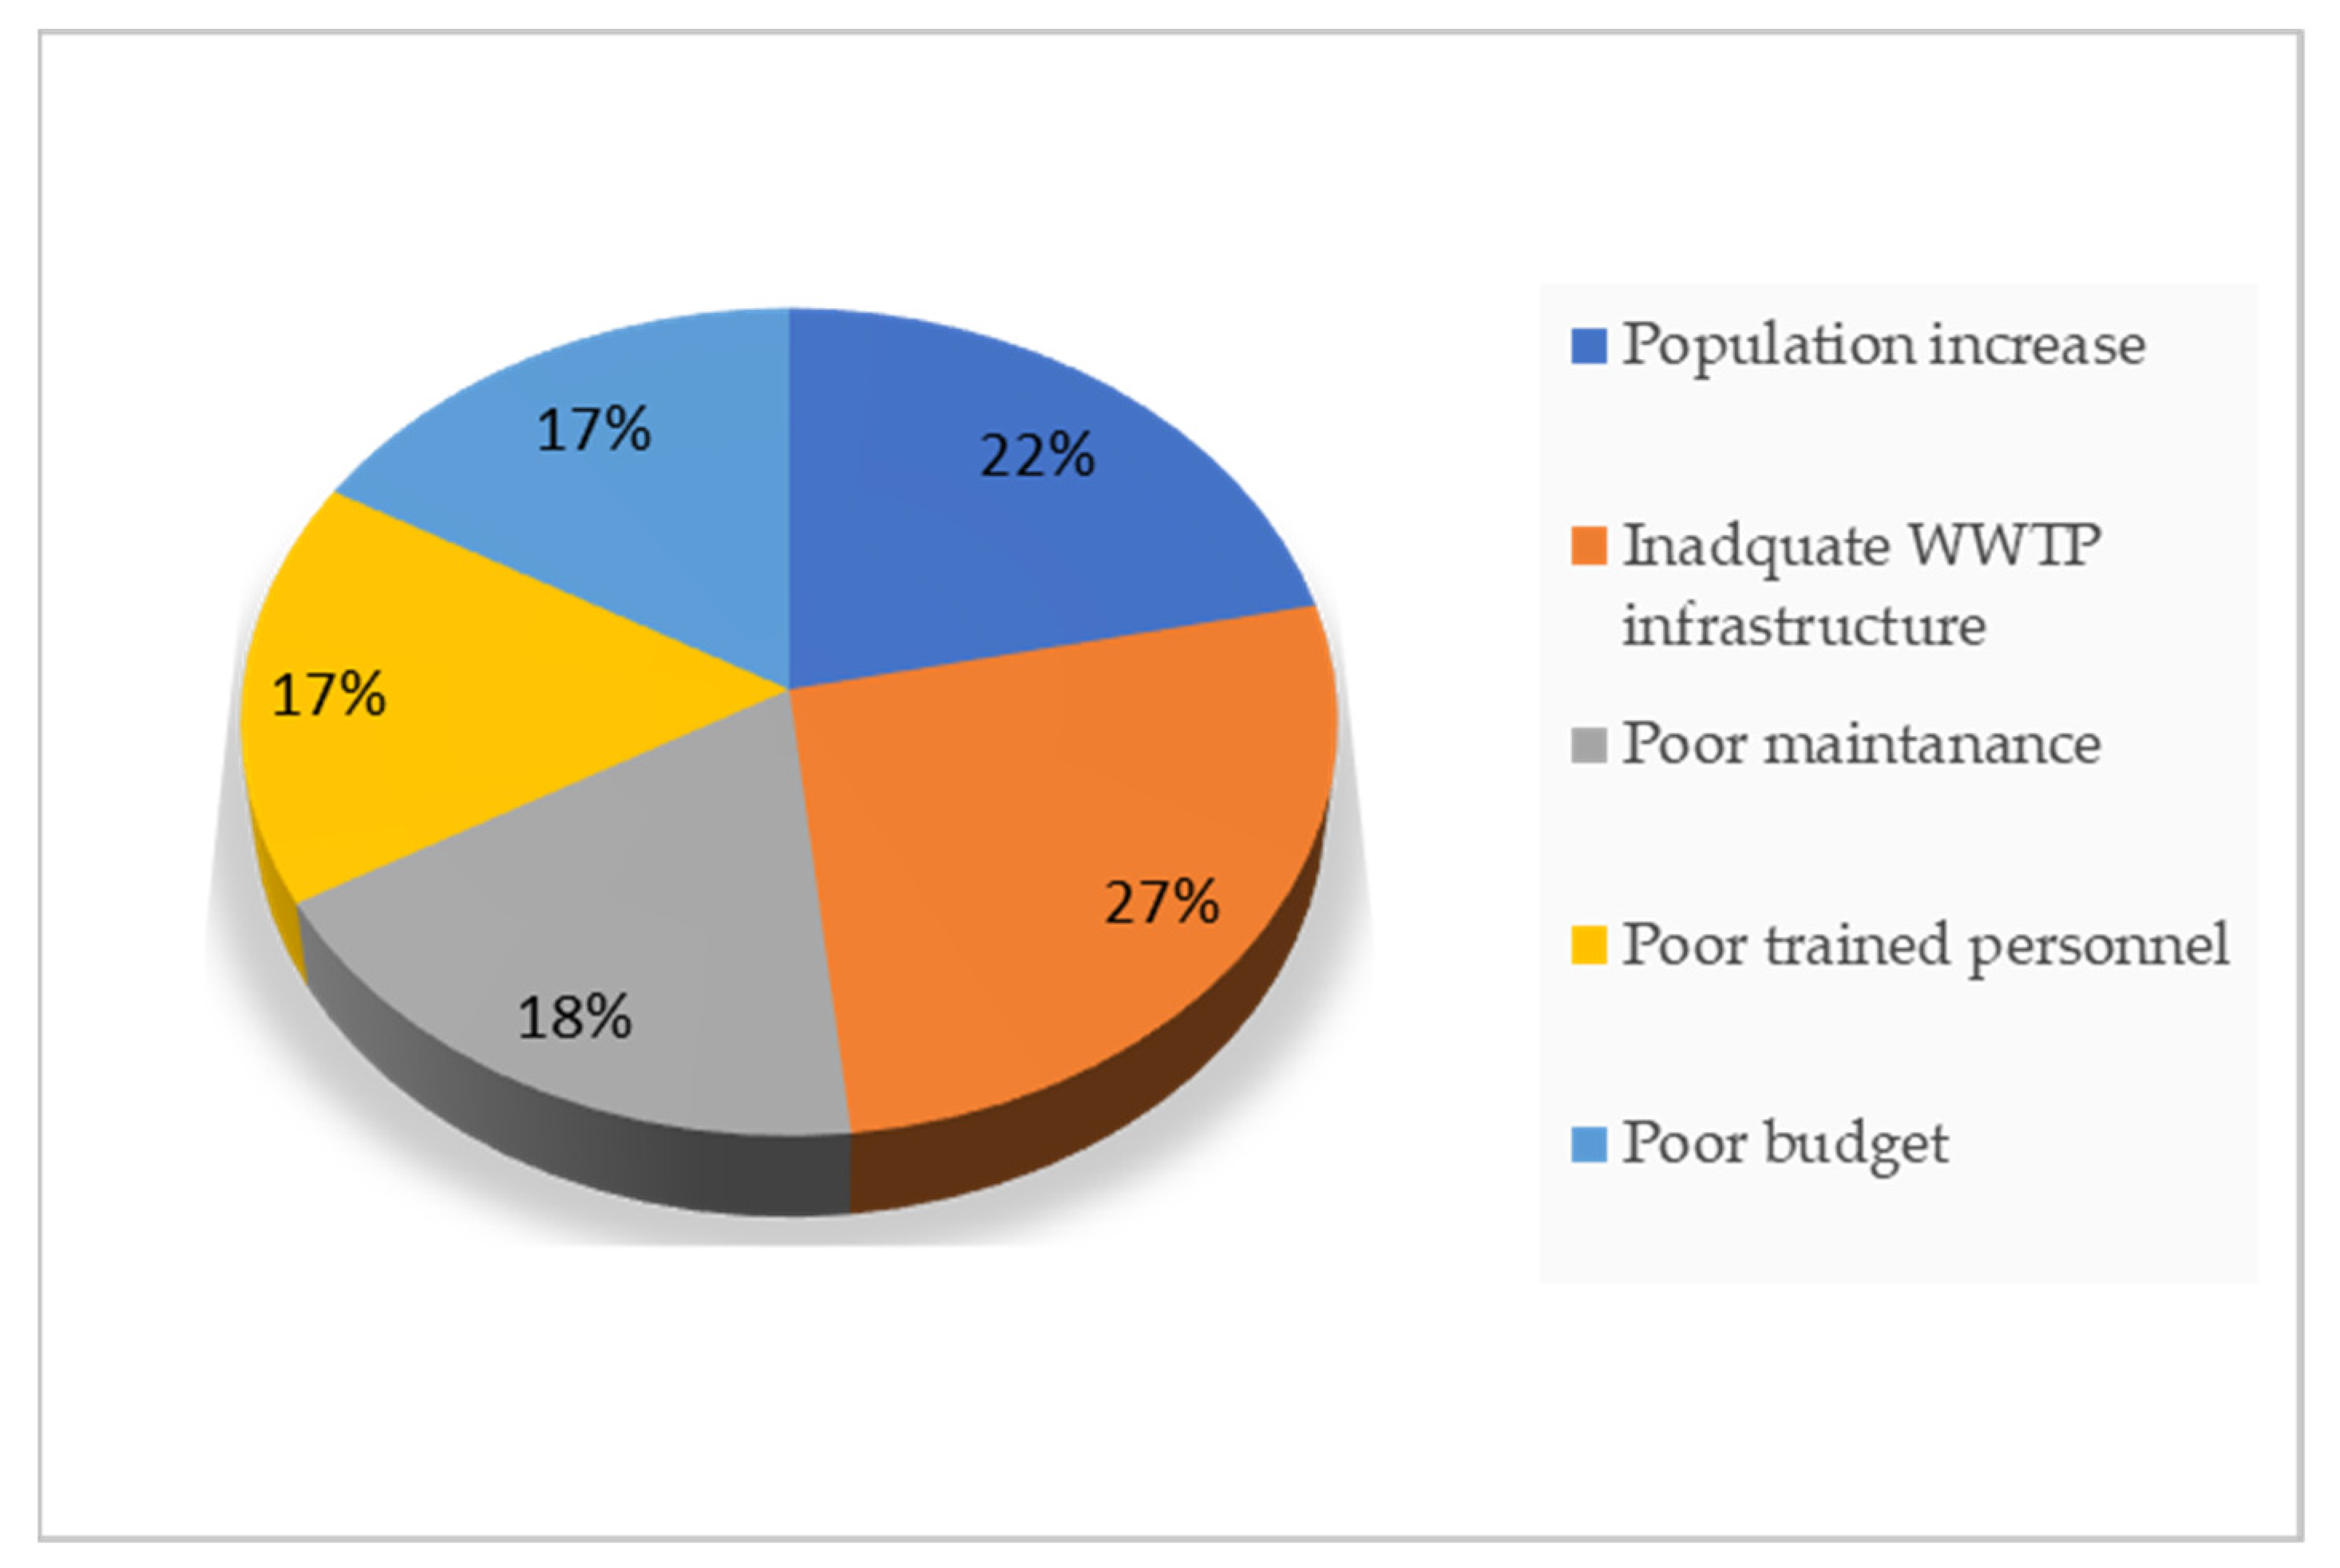
The study found that the Bushbuckridge Municipality has issues regarding the operation and maintenance of Wastewater Treatment Works, with 83% (n = 50) of participants responding “Yes” and 17% (n = 10) responding “No” to the same situation. The respondents also provided comments and several reasons for the problems encountered.
Figure 2 depicts Problems experienced by Bushbuckridge Municipality in operating and maintaining their WWTWs effectively as per the survey results.
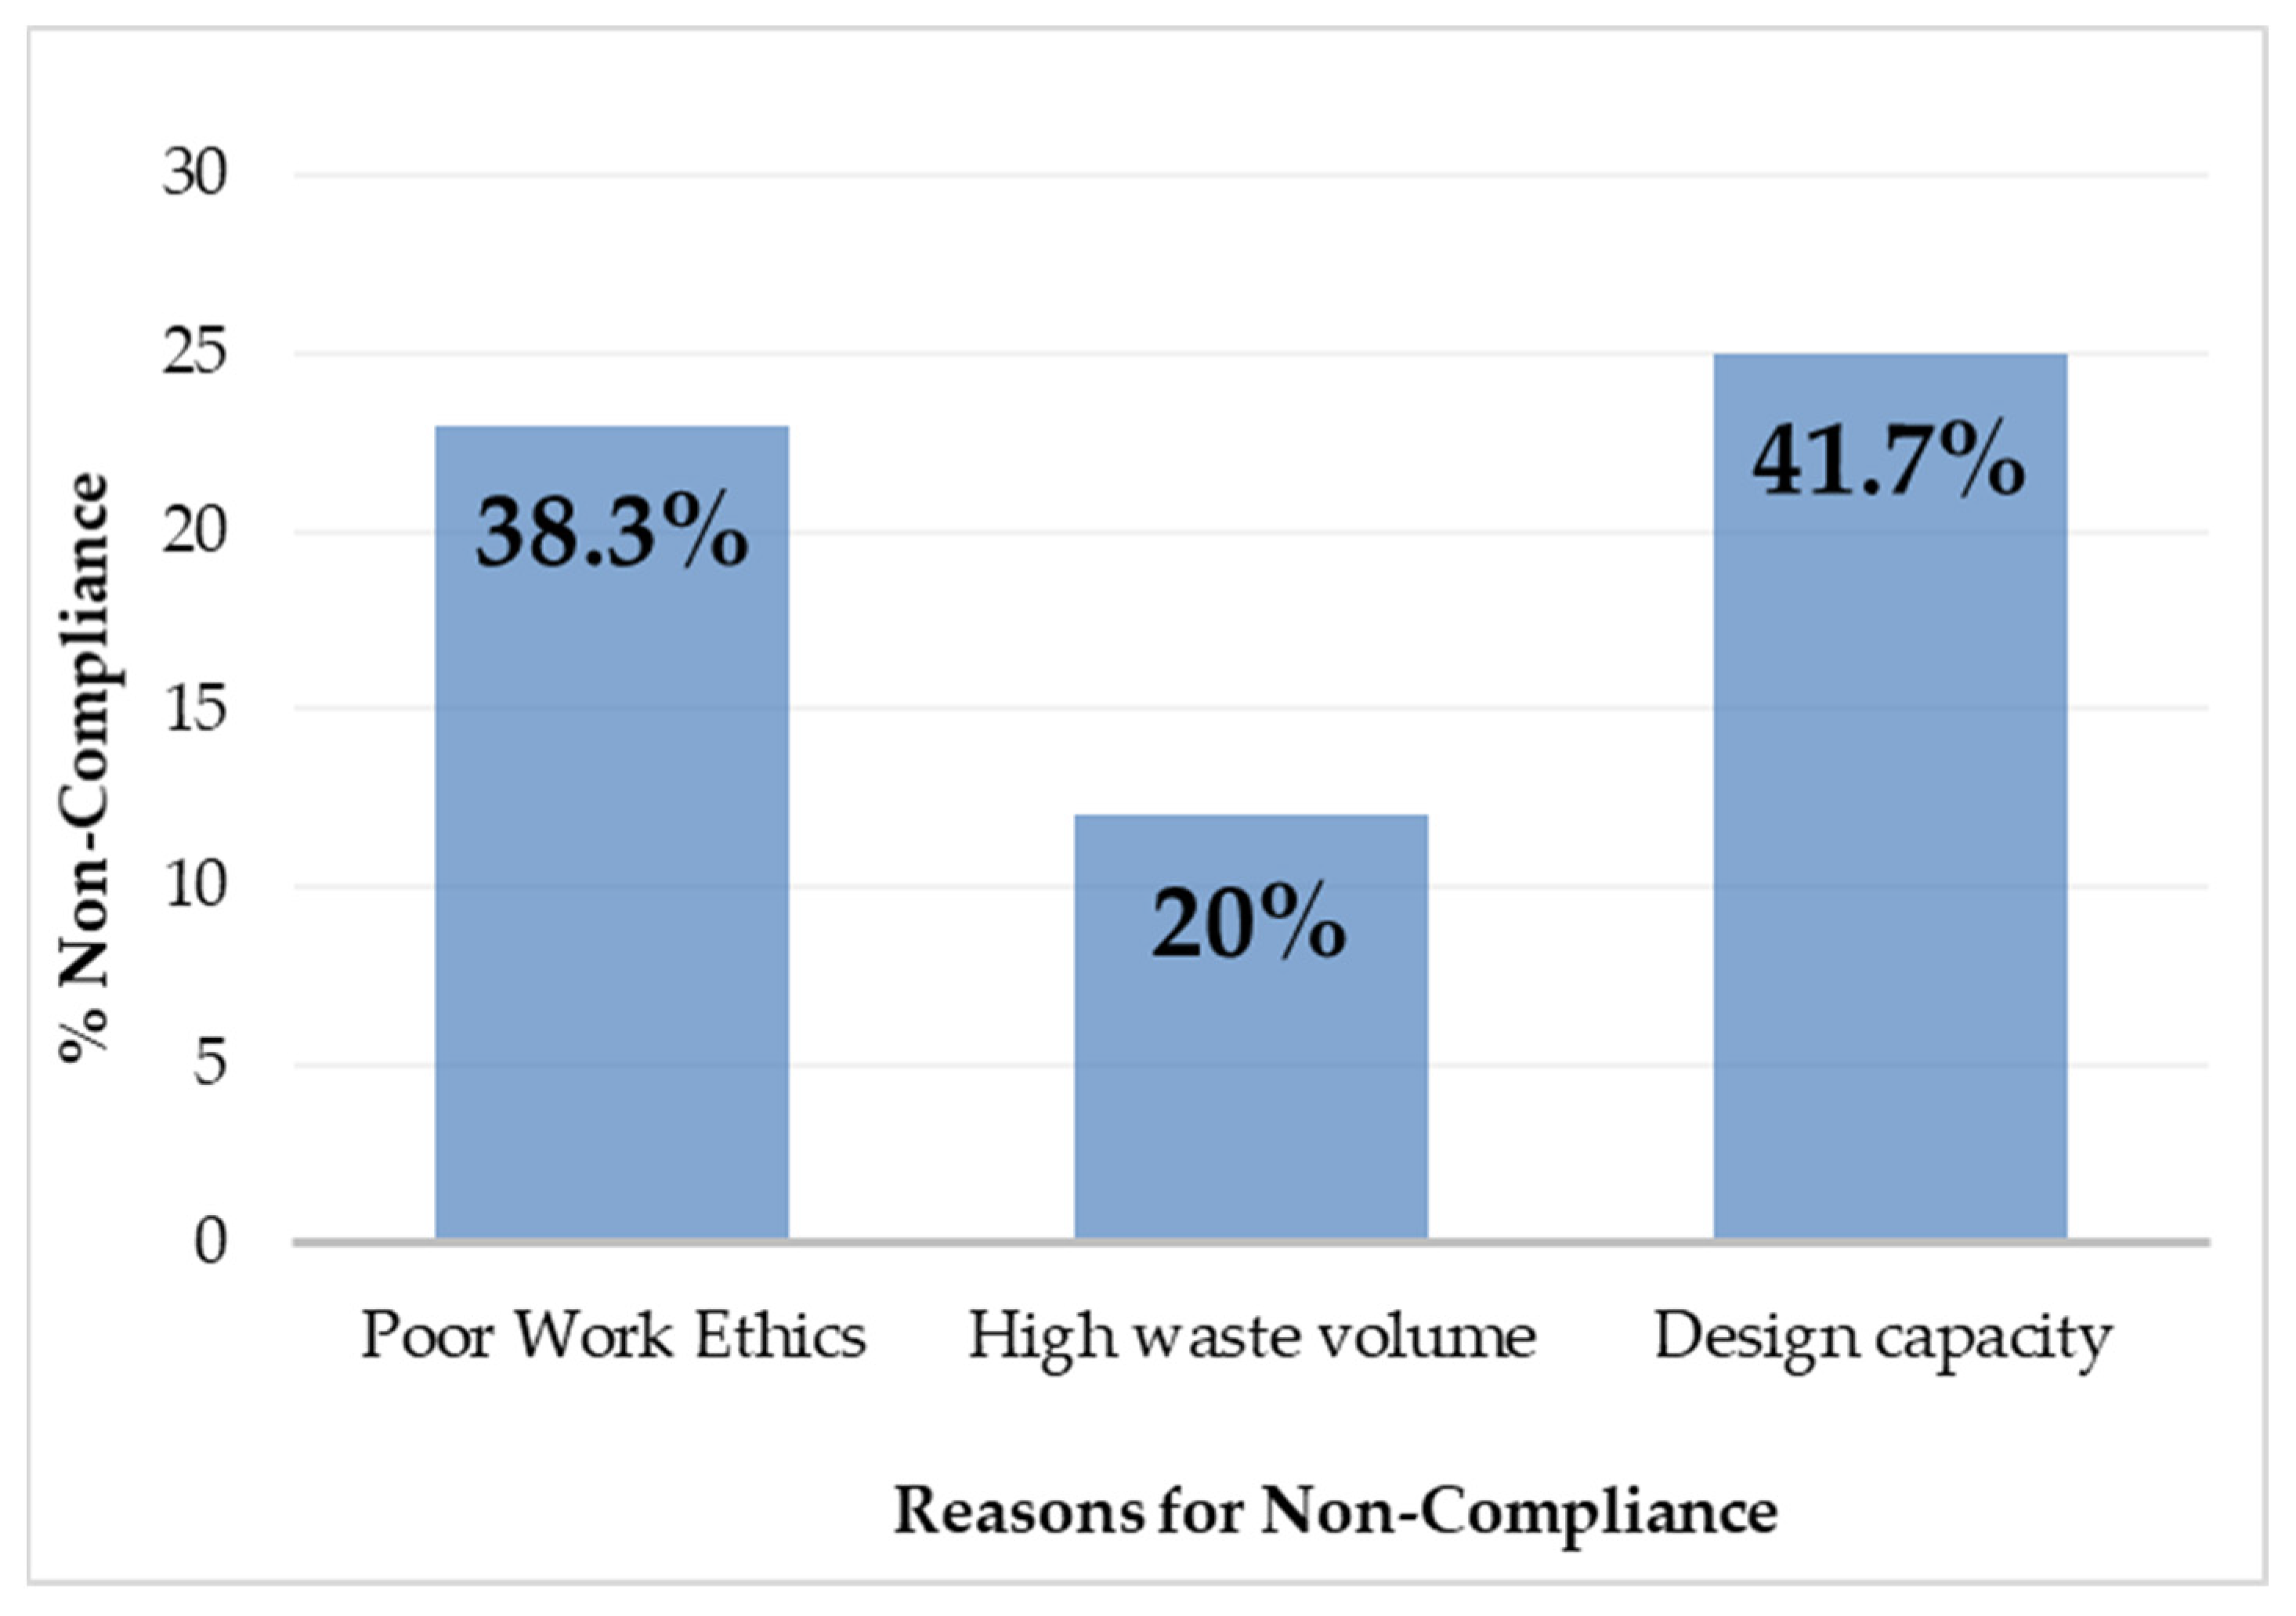
The survey findings in the study revealed that the majority (n = 54; 90%) of participants responded “Yes” to the question that the sewage systems in Bushbuckridge do not adhere to the South African water quality discharge standards, while 10% (n = 6) of participants responded “No.”
Figure 3 below depicts the reasons given by respondents for the discharge of effluent that do not meet the required water quality standards by sewage systems. Most of the respondents in the study suggested that the WWTW’s design capacity (41.7%) and poor work ethics (38.3%) are the major factors causing poor compliance, while a small percentage (20%) stated that the municipality receives a high amount of waste.
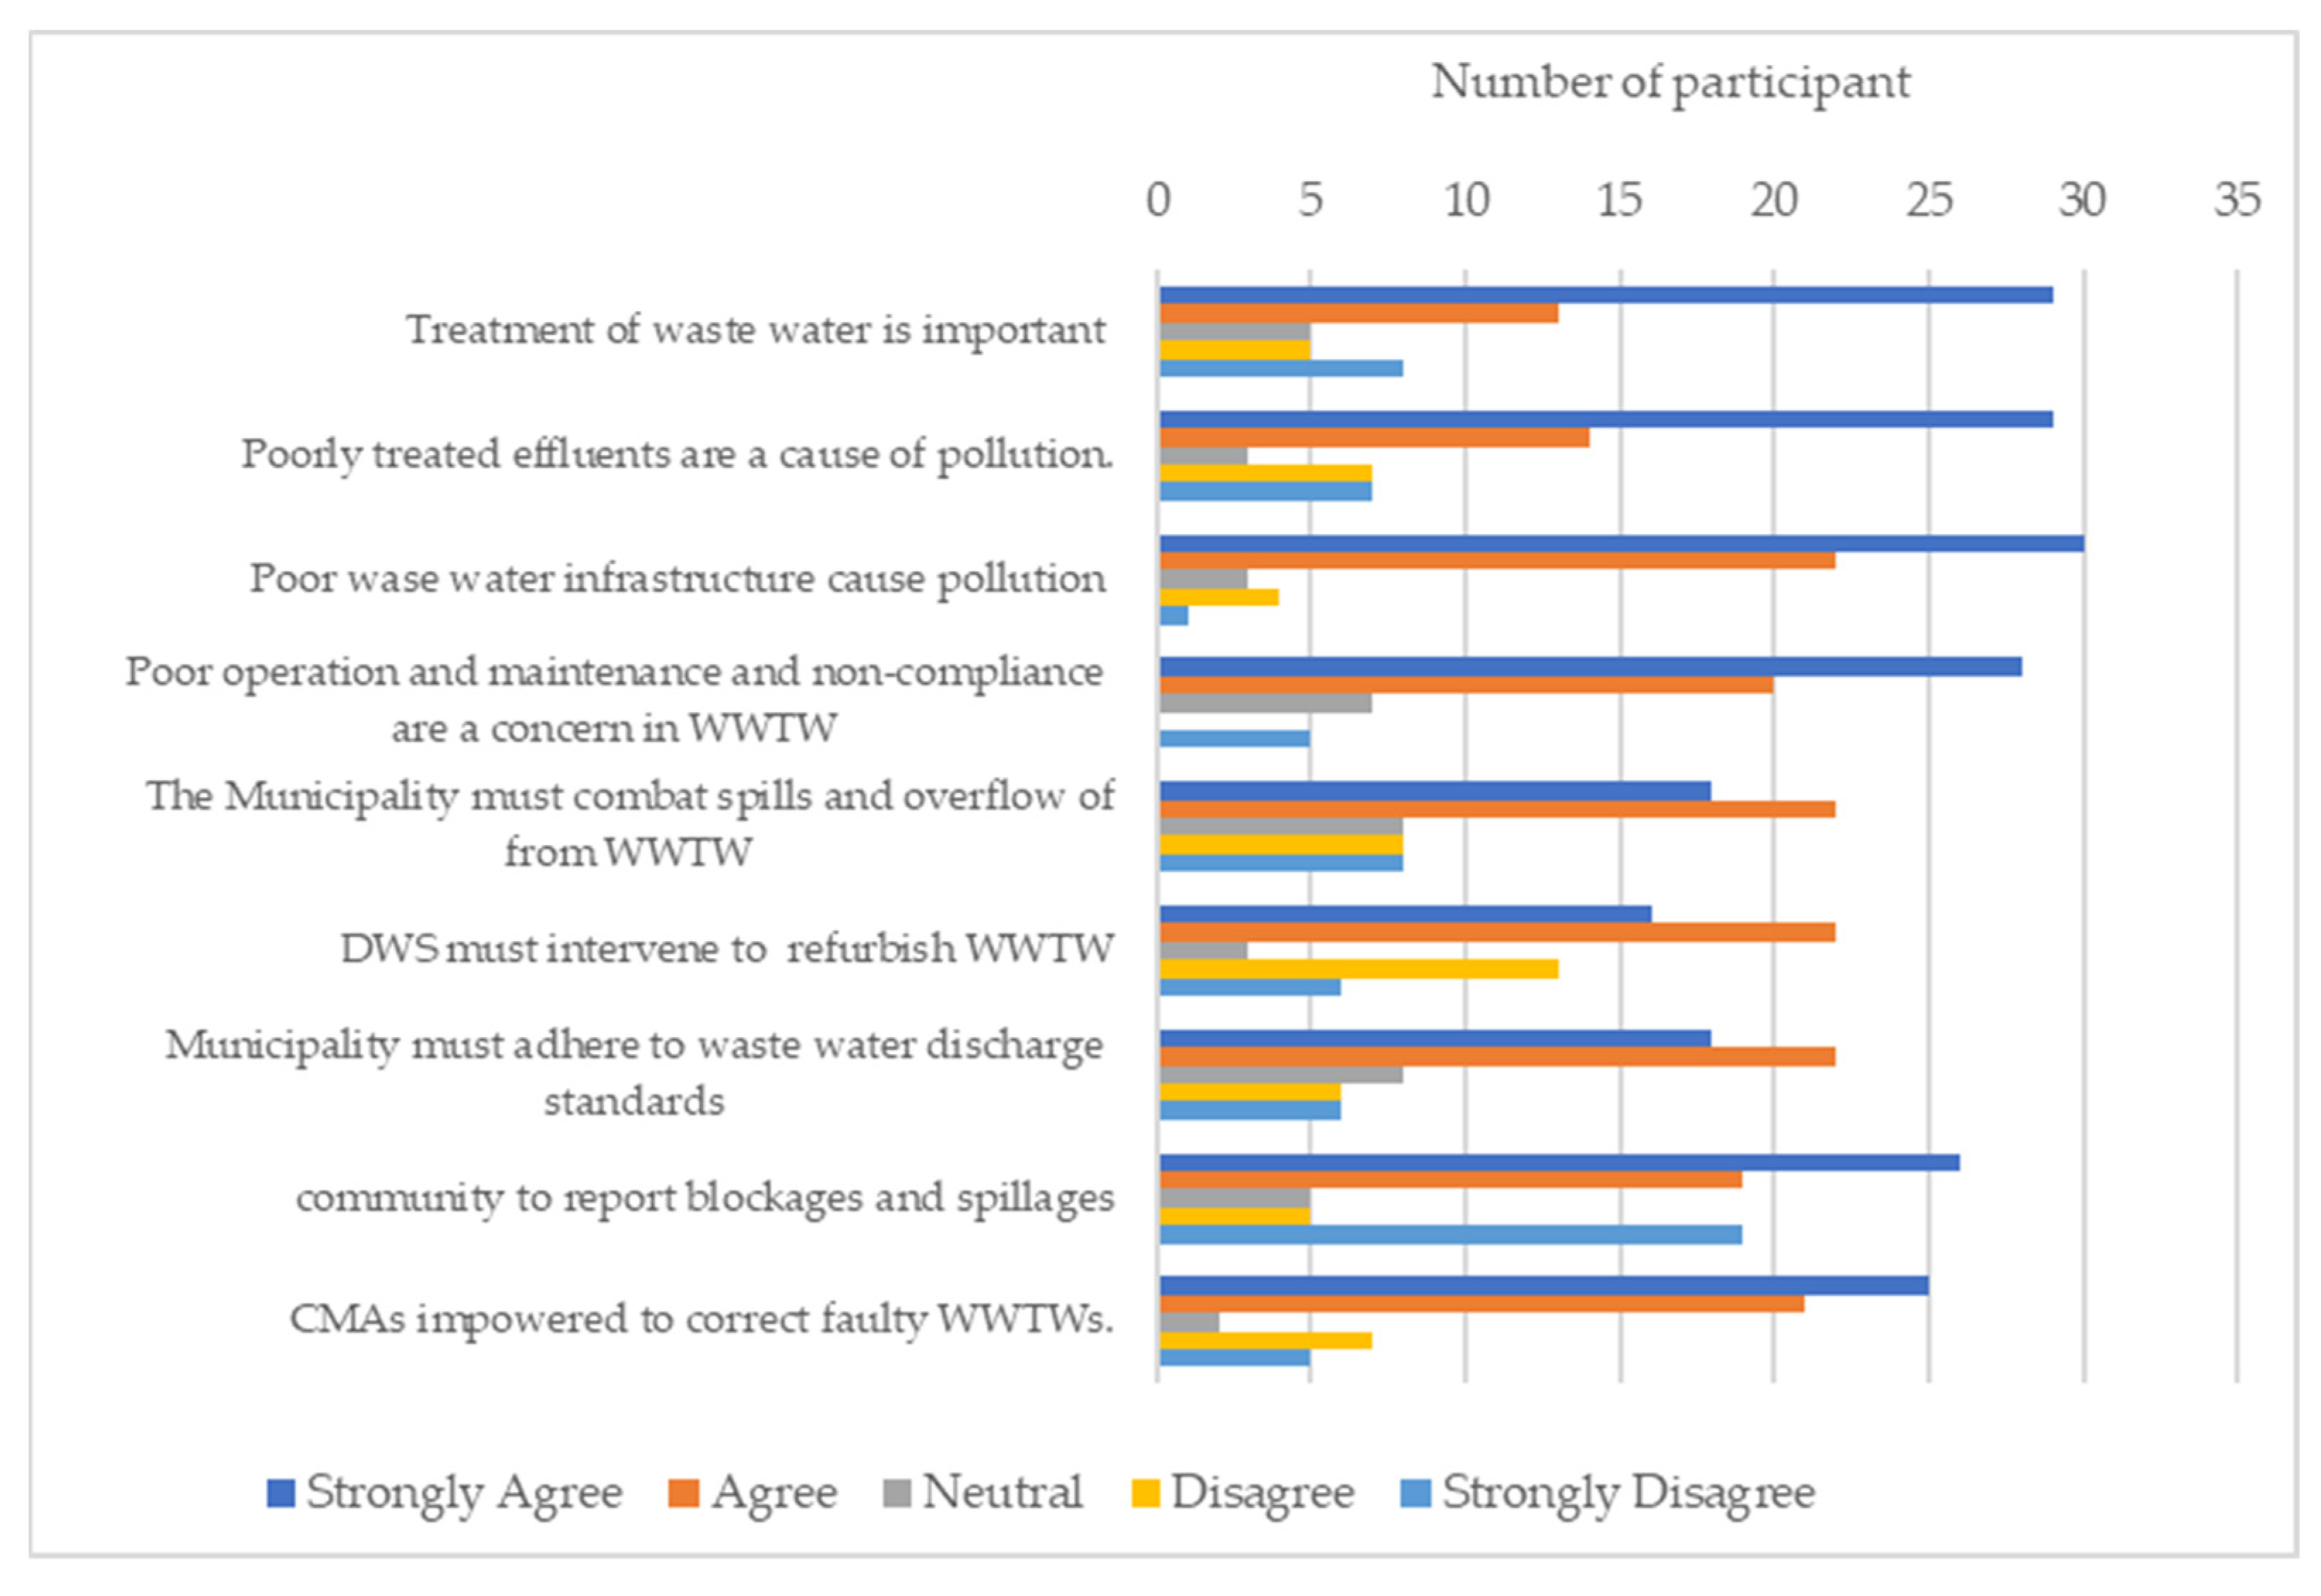
In order to determine the factors from the WWTW that may contribute to the pollution of the Sand River Catchment, a survey was conducted using the questions shown in
Figure 4. The responses on the Likert scale clearly indicate that respondents strongly agree to a greater degree on all the statements. According to the study, out of 60 participants, 29 strongly agreed that wastewater treatment is very important and also strongly agreed that poorly treated effluents are the source of pollution in the catchment. Thirty-four (34) participants strongly agreed that poor wastewater treatment infrastructure contributes to pollution. Although 28 strongly agreed that inadequate operation, management, and non-compliance of WWTWs are issues to be concerned about. Only 22 participants agreed that the municipality would deal with the WWTW’s overflows and spillages, as well as meet wastewater treatment discharge requirements. They also agreed that the Department of Water and Sanitation (DWS) should support refurbishing these WWTWs. In terms of the community reporting blockages and spillages, 26 participants strongly agreed, while 41 participants strongly agreed that CMAs should have the authority to correct faulty WWTWs. The study indicates that there is poor adherence to discharge Water Quality Standards, which were reported to be a result of poor work ethics from poorly trained personnel.
3.2. Inspection of the WWTWS in the Bushbuckridge Municipality
The assessment was carried out in two WWTWs, namely Thulamahashe and Dwarsloop. Both WWTWs treat raw domestic wastewater, which is gravitated to the plant. The Thulamahashe WWTW operates at a design capacity of 1.5 ML/d, while Dwarsloop WWTW has a design capacity of 1.6 ML/d. However, because the flow meters were not operational in both treatments work during the inspection period, the daily incoming flows were not measured for 12 months. The WWTWs have screening systems that can be operated manually or mechanically. Though the mechanical screening system was not in operation during the inspection period, they were operated manually in both treatment's works. The grit removal systems were operational in both treatments' work.
The rotating arms of the biological filters were not effectively maintained, and the arms have since collapsed and no longer rotated, resulting in mechanical issues. This shows that there was an uneven distribution of flow because wastewater was only distributed to one point of the filter, which caused a short circuit and prevented the wastewater from being treated, resulting in inhibiting the nitrification process while also attracting snails and filter flies. The humus tanks (clarifiers) were operational.
During the inspection period, it was observed that the Thulamahashe WWTWs used chlorine gas as a disinfectant, while the Dwarsloop WWTWs relied on HTH as a disinfectant. The gas cylinder room, as well as the gas cylinder itself, were in terrible condition at the Thulamahashe WWTWs. The dosing gauge and gas cylinder scale was not working, and the cylinder scale’s electrical power supply was not plugged in. The chlorine dosing system at the Dwarsloop WWTWs was not in operation. Therefore, the required dosing rate was estimated in both treatments works.
3.3. Water Quality Assessment
The samples collected from the WWTWs’ influent and effluent points were used to assess the WWTWs efficiency in removing contaminants prior to discharge, as well as the effects of the wastewater effluents on the Sand River Catchment.
3.3.1. Monthly Performance of Thulamahashe and Dwarsloop WWTWs over One Year
The treatment efficiency of the WWTWs was assessed every month for the duration of the study, and the following parameters were used to evaluate performance: pH, electrical conductivity (EC), suspended solids (SS), ammonia, nitrate/nitrite, ortho-phosphate, chemical oxygen demand (COD), Faecal coliforms, and Escherichia coli (E. coli).
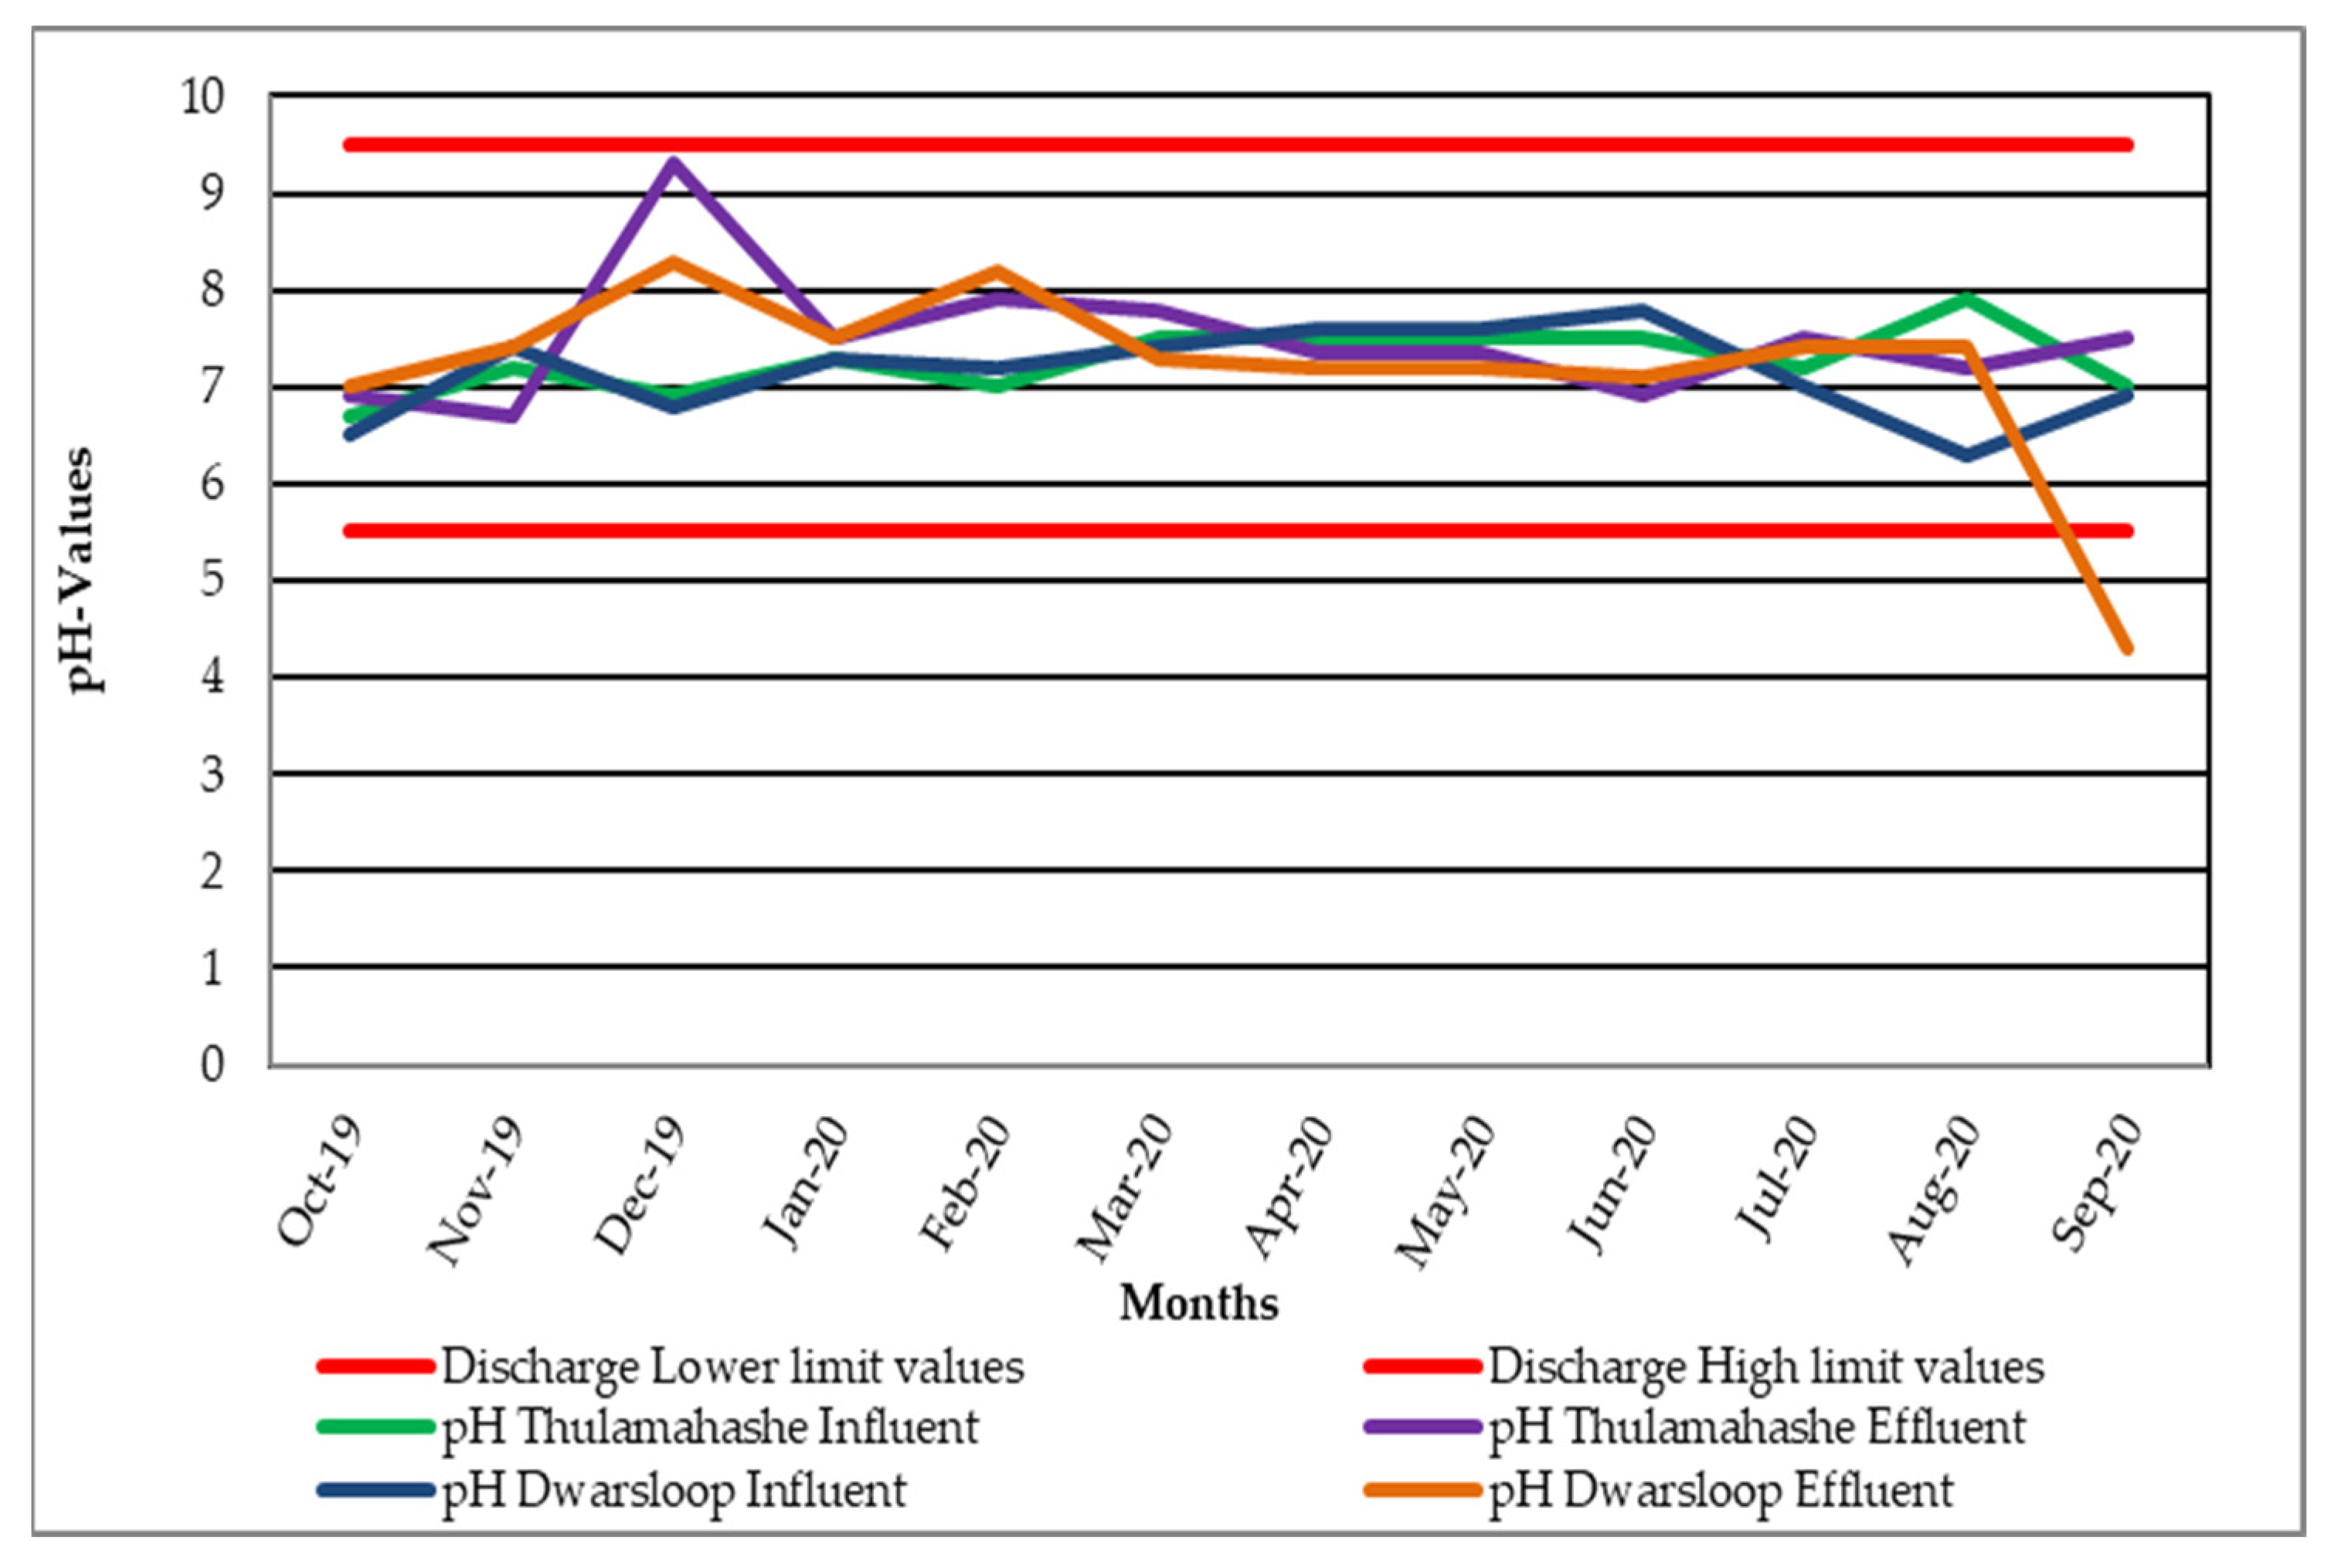
Figure 5 depicts the mean pH-values in Thulamahashe WWTW influent and effluent ranging from 6.70 to 7.00 and 6.90 to 9.30, respectively, while Dwarsloop WWTW ranged from 6.50 to 7.80 and 4.30 to 8.30. At Dwarsloop WWTW, the mean pH-value decreased from the influent (6.90) to the effluent (4.30) during September 2020. According to the general effluent standard pH of treated wastewater effluent should range between 5.5 and 9.5. The pH levels at the Dwarsloop WWTWs were low in September, which could have had an impact on the receiving water bodies.
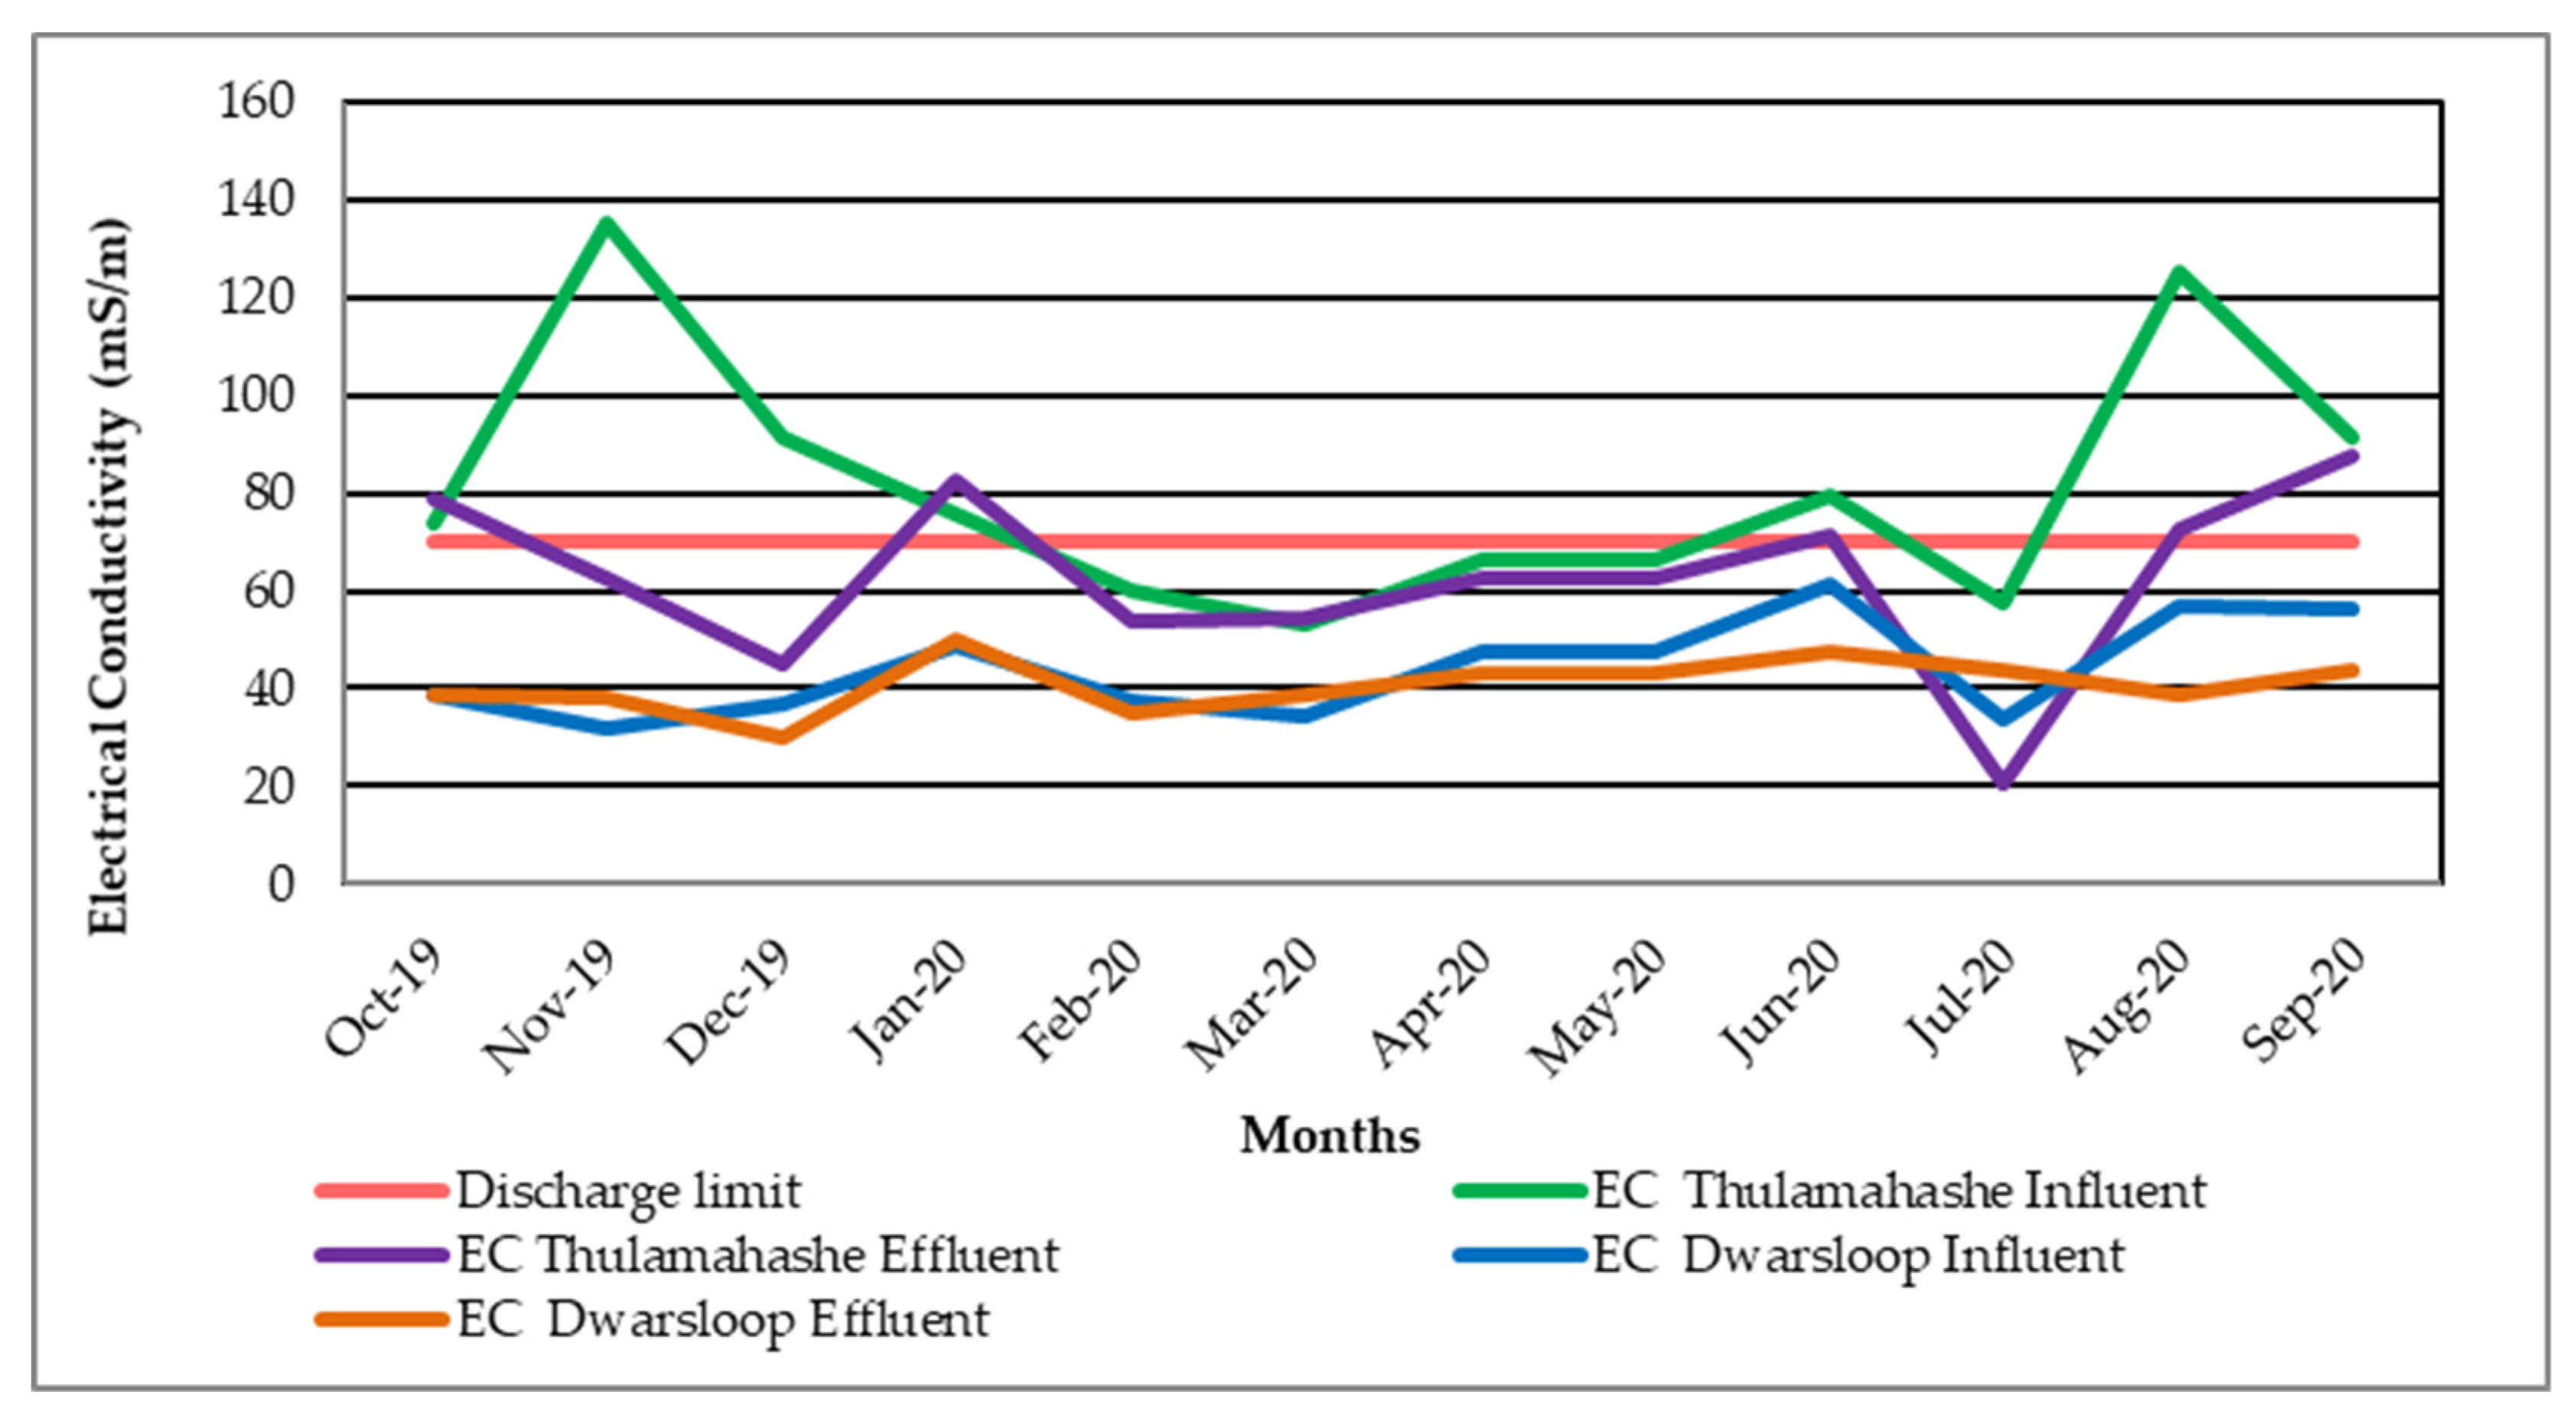
Figure 6 shows the average electrical conductivity concentrations in the Thulamahashe WWTW’s influent and effluent ranging from 52.80 to 135.20 mS/m and 20.80 to 87.50 mS/m, respectively, while the Dwarsloop WWTW ranged from 31.90 to 61.10 mS/m and 29.70 to 44.00 mS/m. In both treatment plants, there was a decrease in the electrical conductivity concentration from the influent to the affluent. This implies that the two WWTWs could remove some ions from the wastewater prior to discharge. The electrical conductivity concentration in the Thulamahashe and Dwarsloop WWTW's effluents was within the general effluent standard limit of 70 to 150 mS/m throughout the study period. Conductivity measurements could be used to monitor processes such as biological nitrogen removal in wastewater treatment, which might cause a change in conductivity [
10]. Electrical conductivity is a good indicator of the total salinity. Therefore, if the wastewater effluent is used for irrigation and the electrical conductivity is above the permissible limit, it can cause serious harm to crop and turf grass growth [
19].
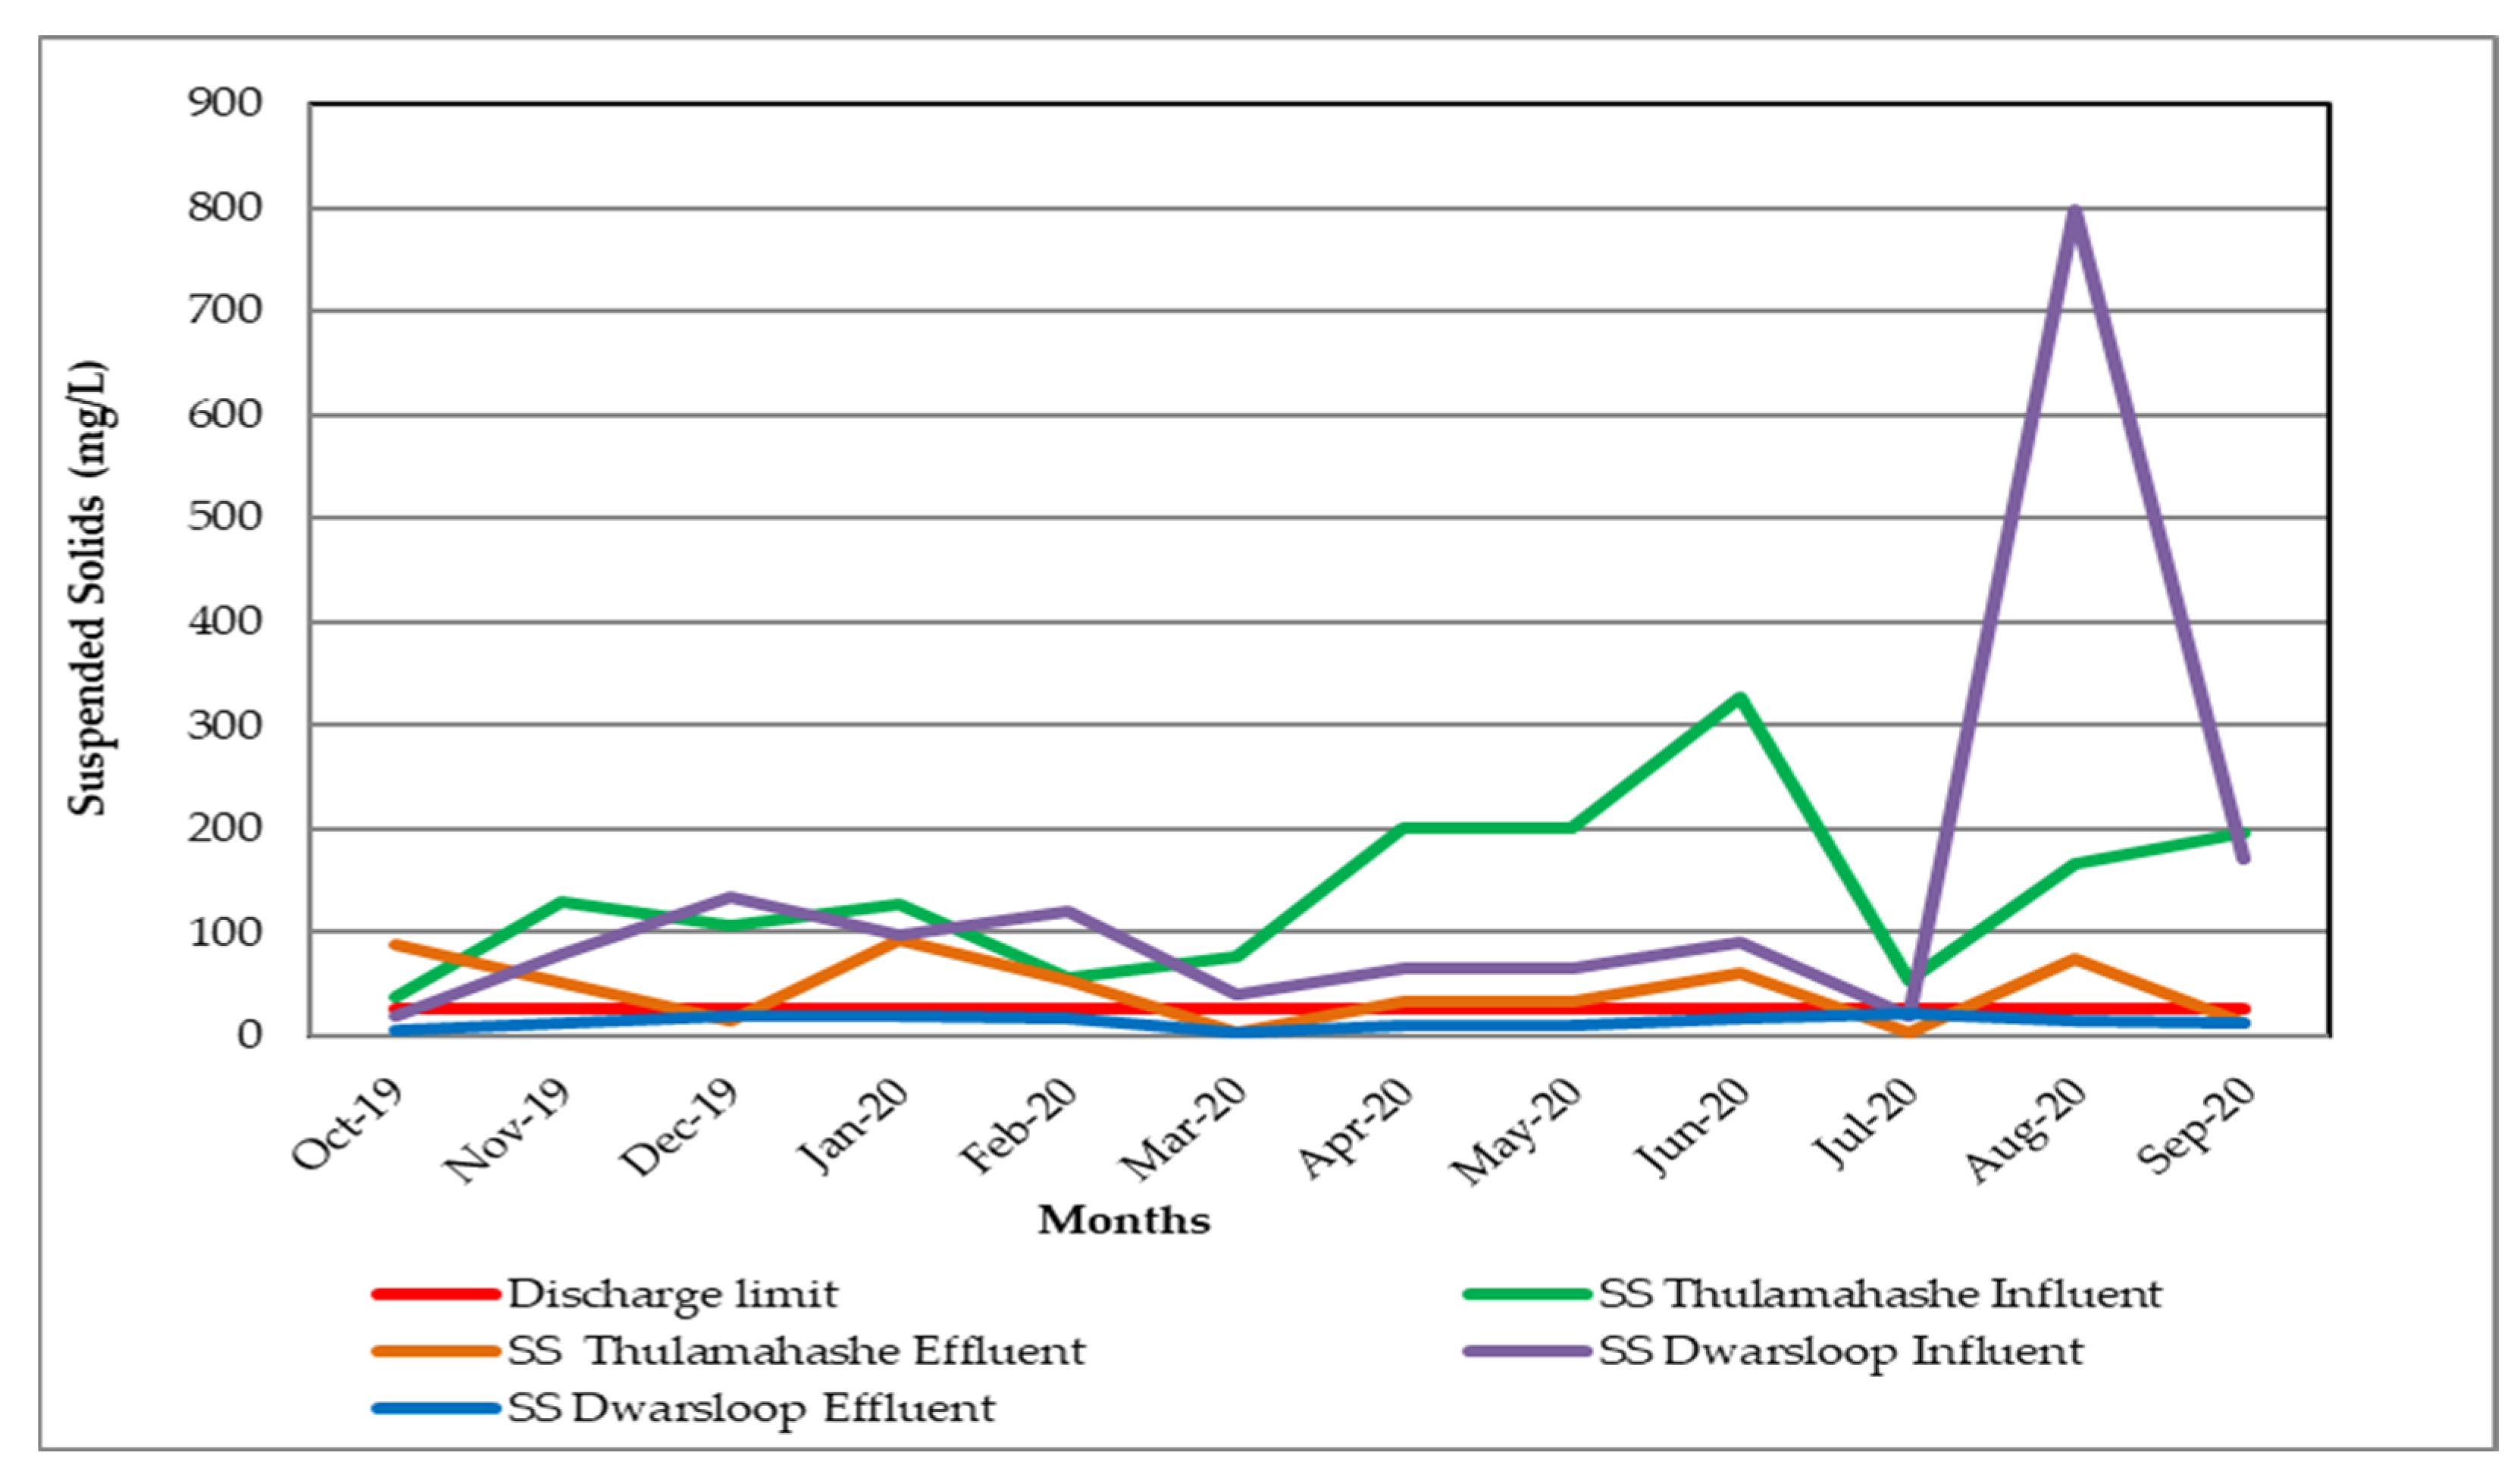
Figure 7 depicts the average concentrations of suspended solids in the influent and effluent of Thulamahashe WWTW, which ranged from 37.60 to 326.00 mg/L and 2.00 to 93.60 mg/L, respectively, while at the Dwarsloop WWTW, the concentrations ranged from 18.00 to 797.00 mg/L and 2.00 to 21.50 mg/L. The Thulamahashe WWTW had higher average SS concentrations in the effluent than the specified general effluent standard limit of 25 mg/L throughout the study period, except for December 2019, March 2020, July 2020, and September 2020. While in the Dwarsloop WWTW, the effluent concentrations were within the specified limit. The higher concentration of total suspended solids (TSS) in trickling filter WWTW effluents may be due to uncontrolled biomass slough-off [
20].
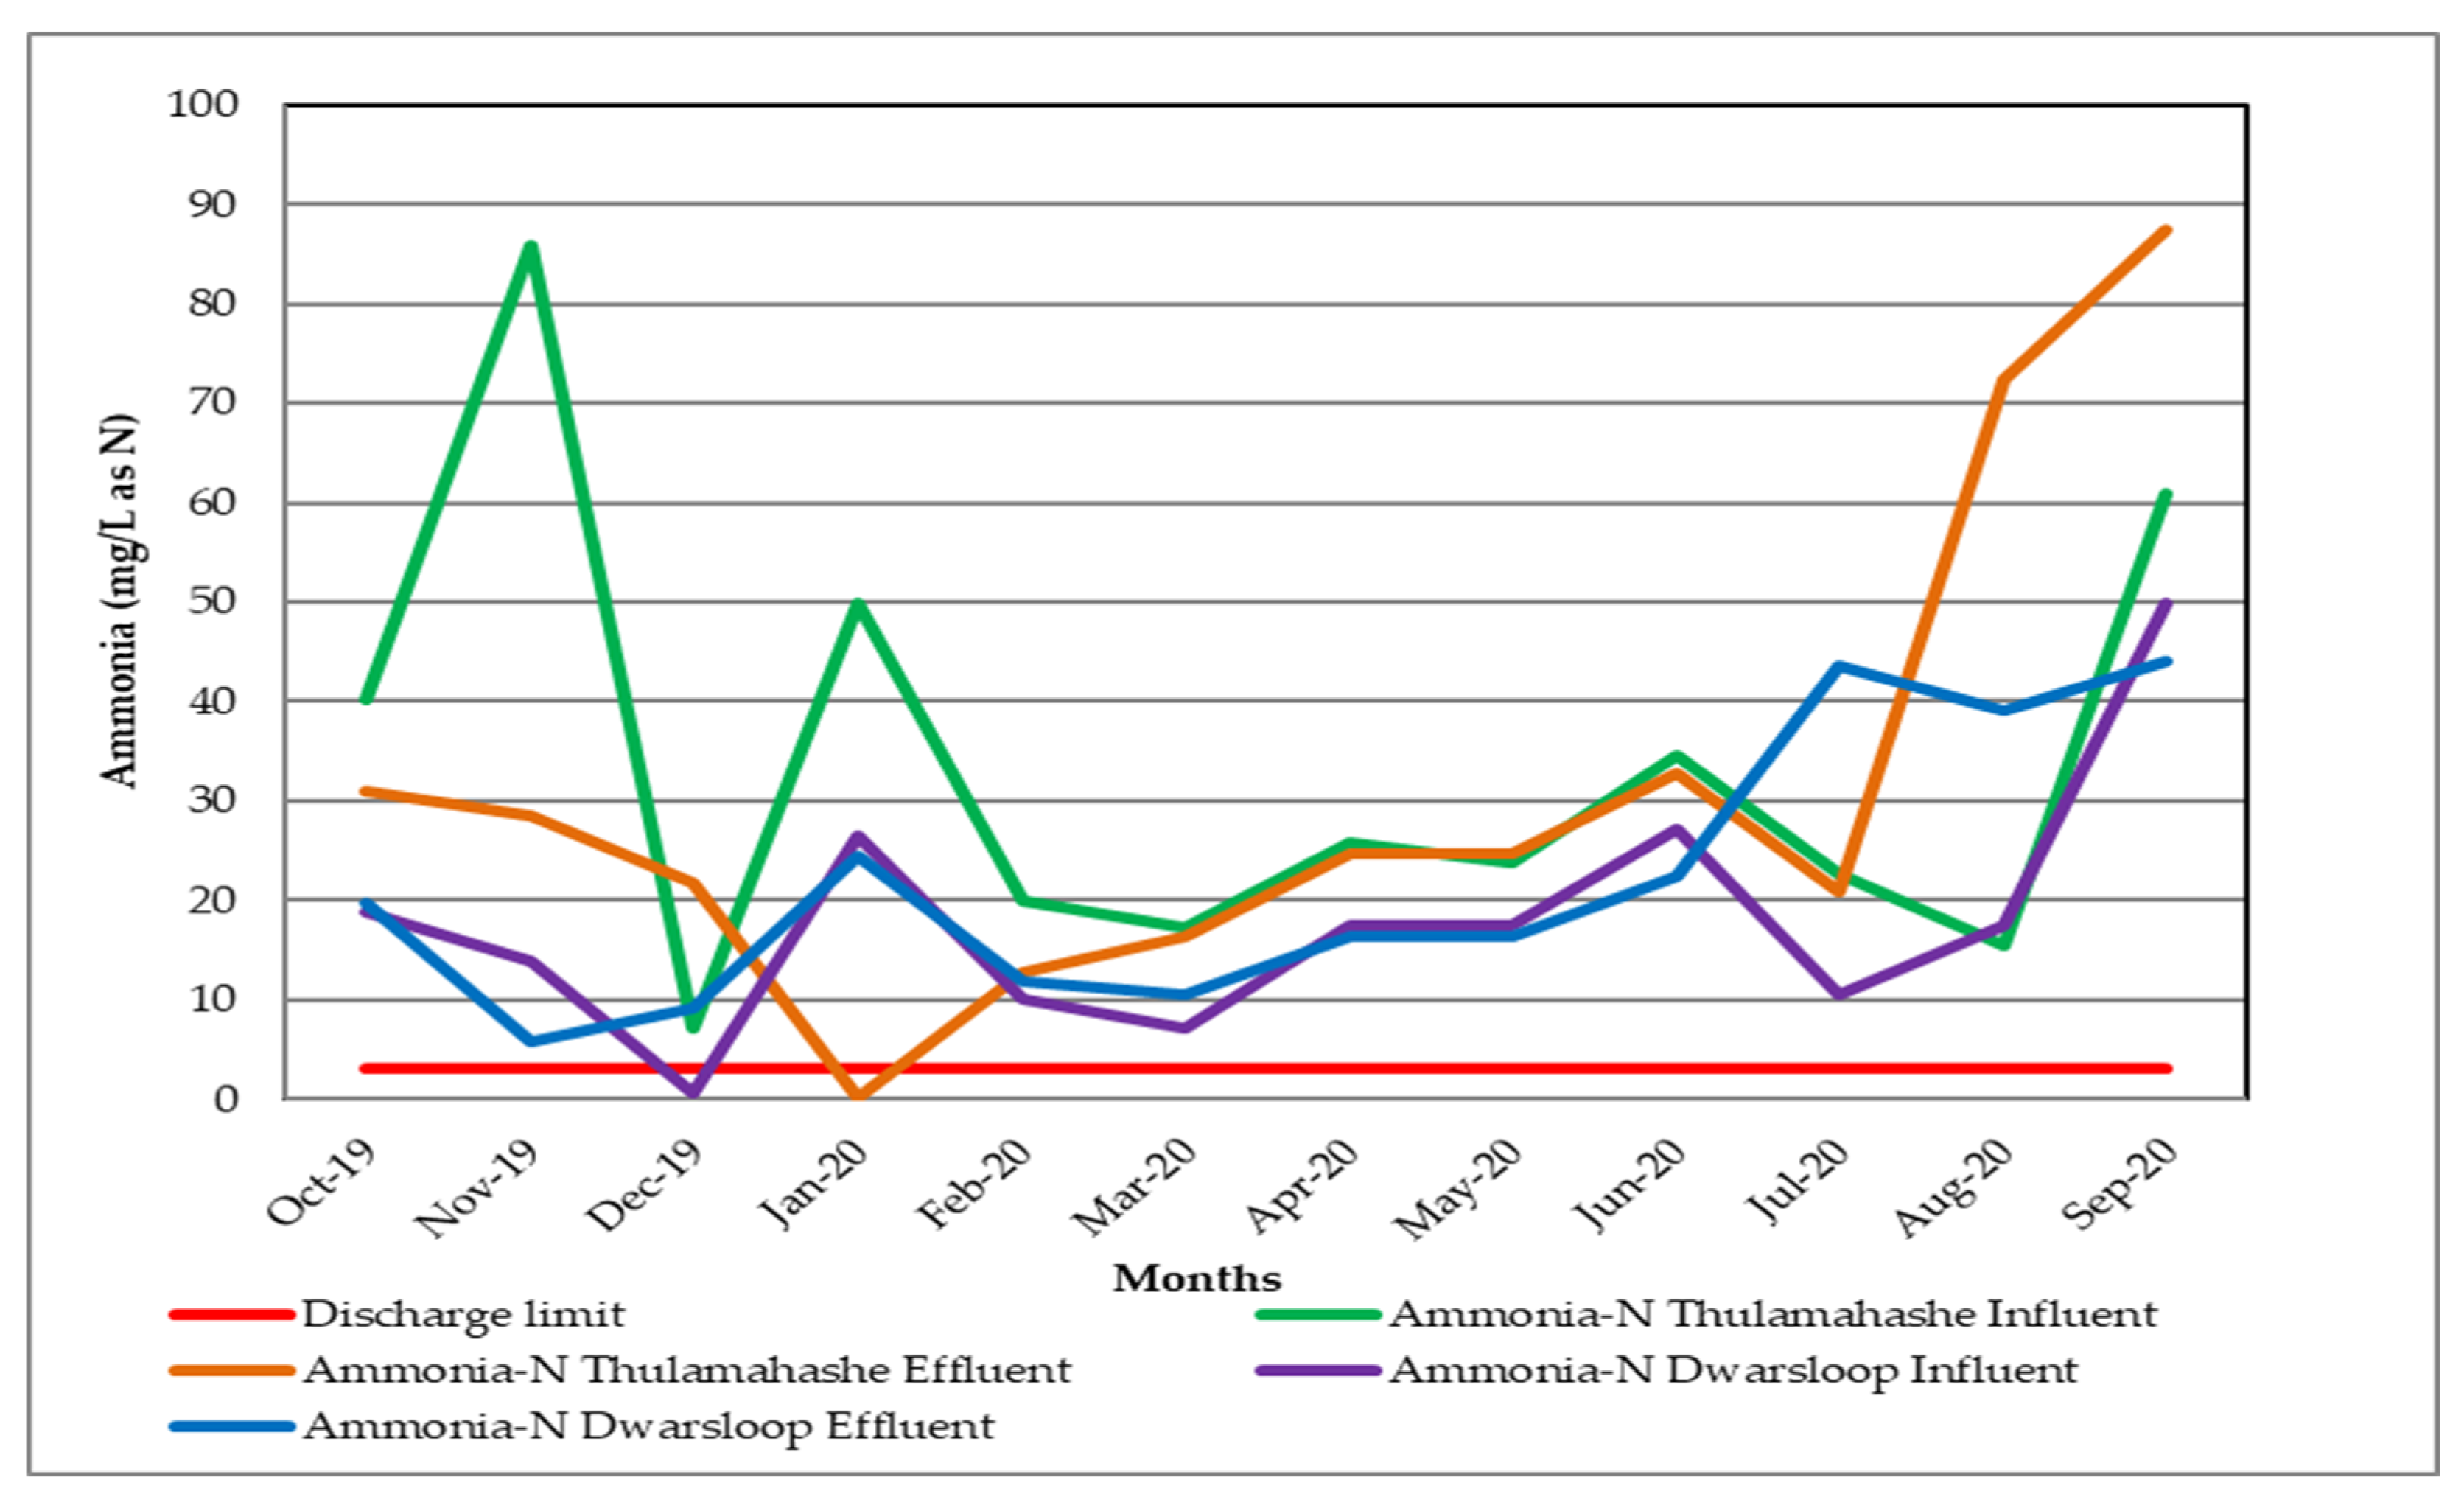
Figure 8 depicts the average ammonia concentrations in the influent and effluent of the Thulamahashe WWTW, which ranged from 7.22 to 86.80 mg/L as N and 0.12 to 87.50 mg/L as N, respectively, whereas Dwarsloop WWTW ranged from 0.62 to 50.00 mg/L as N and 5.80 to 39.00 mg/L as N. The study found that ammonia concentrations were above the recommended limit of 3 mg/L) in both WWTW effluents throughout the study period, except for January 2020 at Thulamahashe WWTW, where it was found to be within the limit (0.12 to 87.50 mg/L as N). This indicates that wastewater treatment plants are ineffective at removing ammonia, as they have constantly failed to comply with the specified limits. The fact that the biological filters’ rotating arms did not rotate during the investigation can be interpreted as a contributing factor to the lack of ammonia-nitrogen removal because it inhibited the nitrification process. This means that ammonia was not completely oxidized to nitrite. Chlorine disinfection can also be adversely affected.
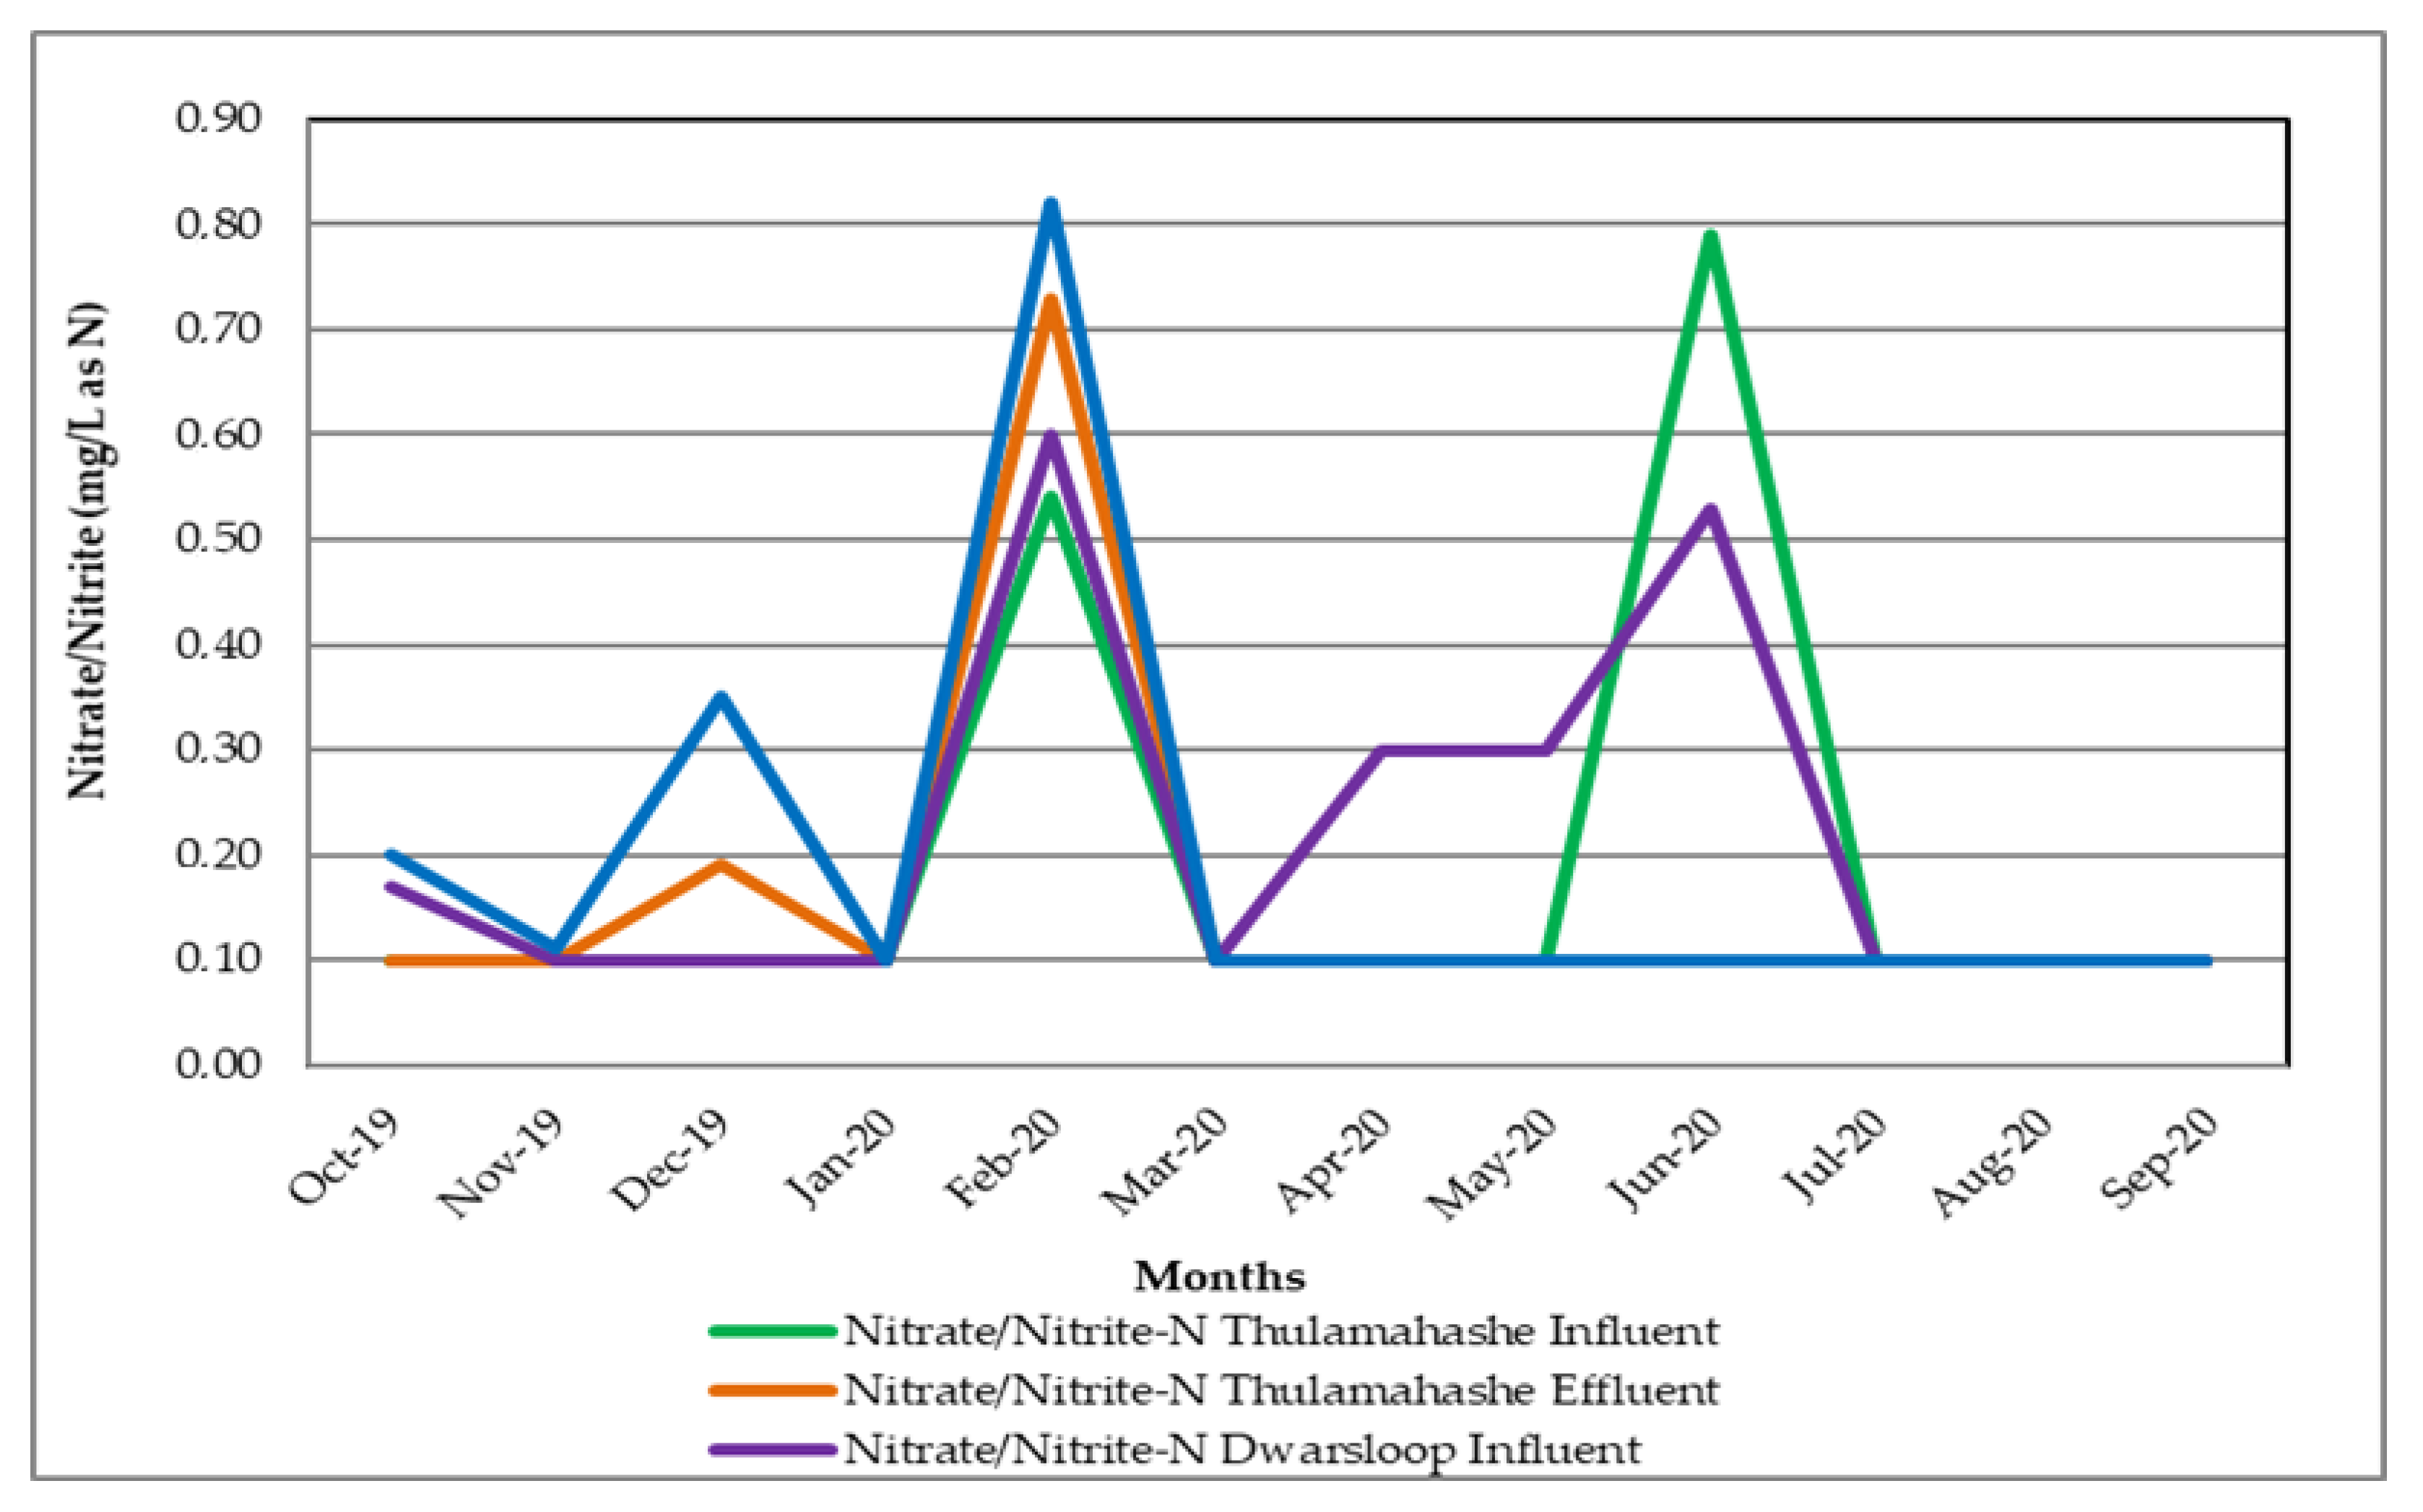
Figure 9 depicts the average nitrate/nitrite concentrations in the influent and effluent of the Thulamahashe WWTW, which ranged from 0.10 to 0.79 mg/L as N and 0.10 to 0.73 mg/L as N, respectively, whereas the Dwarsloop WWTW ranged from 0.10 to 0.60 mg/L as N and 0.10 to 0.35 mg/L as N. Throughout the study period, nitrate/nitrite concentrations were within the general effluent standard limit of 15 mg/L as N in both WWTWs, according to the findings. The current study established that nitrate/nitrite concentrations in both WWTW are extremely low and thus have no impact on the receiving water bodies. However, under normal conditions, where nitrate concentrations are within permissible limits, nitrates are beneficial to plant nutrition and are responsible for a healthy aquatic environment.
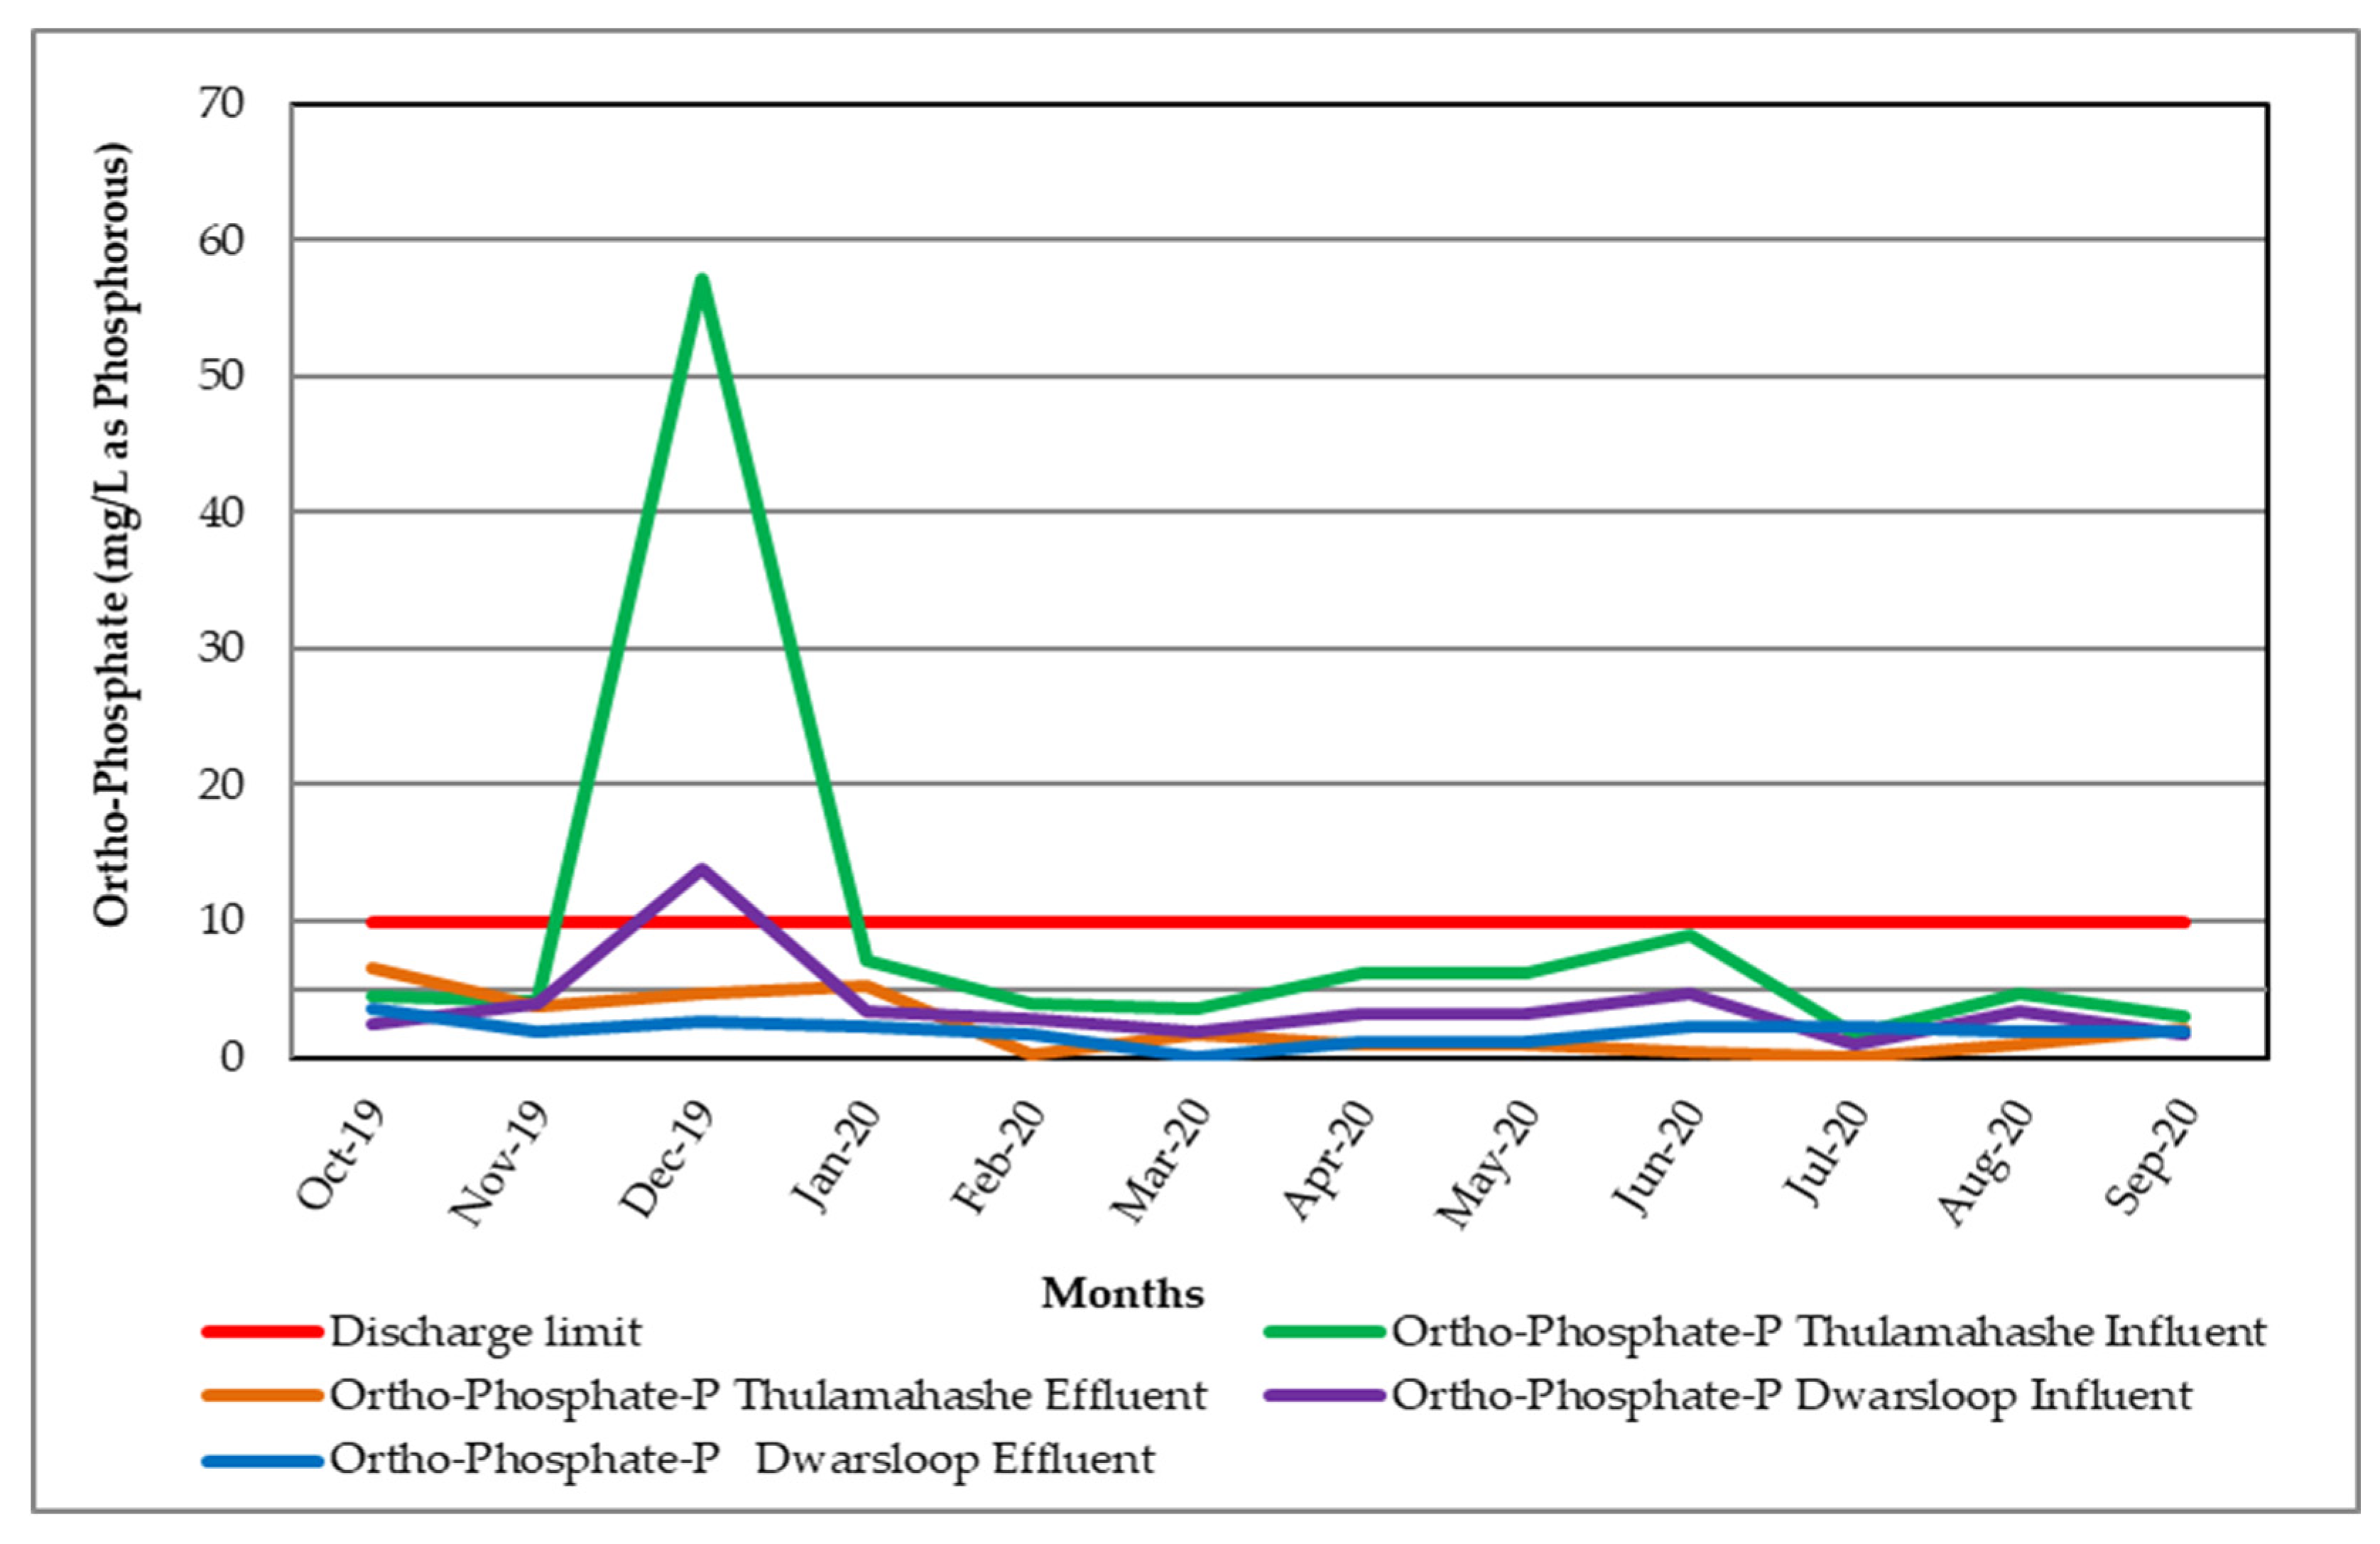
Figure 10 depicts the average ortho-phosphate concentrations in the influent and effluent of the Thulamahashe WWTW, which range from 2.92 to 57.20 mg/L as P and 0.01 to 6.50 mg/L as P, respectively, while the concentrations in the Dwarsloop WWTW ranged from 0,93 to 13.90 mg/L as P and 0.01 to 3.60 mg/L as P. Phosphate removal from the influent to the effluent was observed in both treatment plants. Therefore, during the study period, the effluent phosphate concentration for both WWTW was less than 10 mg/L as P, as specified in the general effluent standard, which does not impact the receiving water bodies.
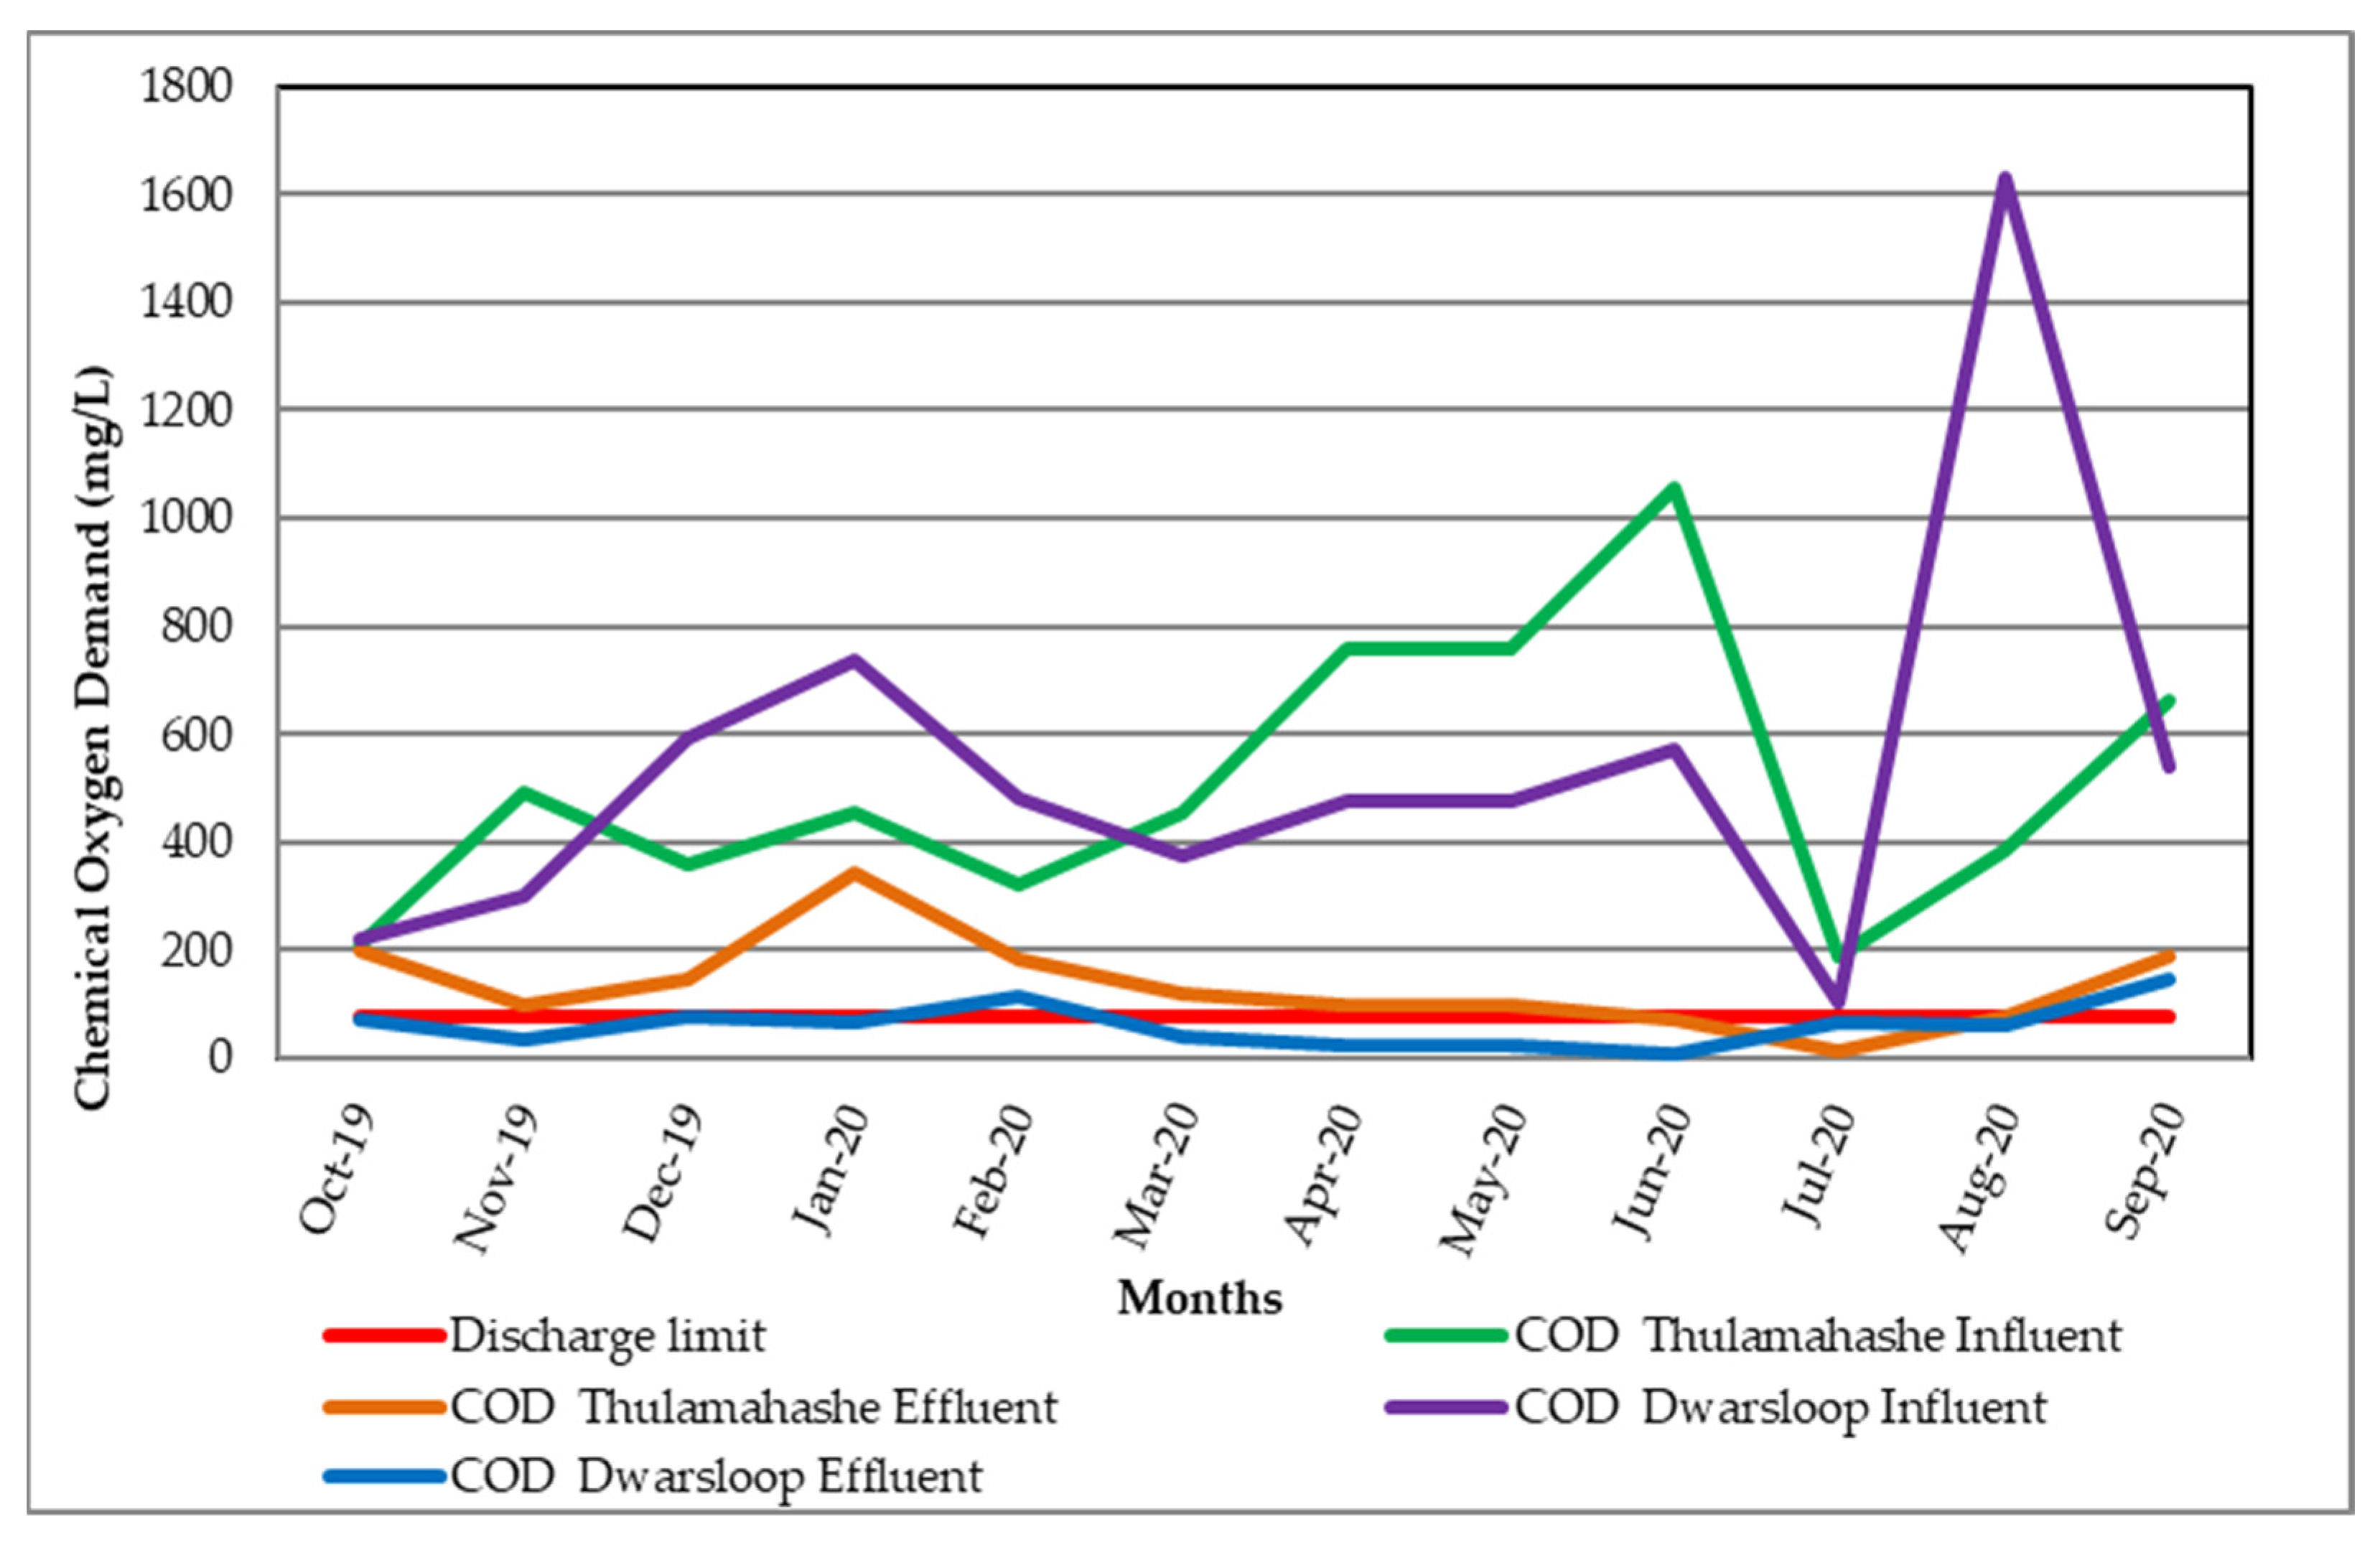
Figure 11 depicts the average COD concentrations in the Thulamahashe WWTW influent and effluent, which range from 188.00 to 1057.00 mg/L and 16.00 to 76.00 mg/L, respectively, while concentrations in the Dwarsloop WWTW ranged from 106.00 to 1632.00 mg/L and 25.00 to 149.00 mg/L. Both wastewater treatment plants demonstrated their effectiveness in removing chemical oxygen-demanding compounds from influents, even though they did not meet the required limit. The recommended limit of COD should be 75 mg/L. COD concentrations in the Thulamahashe WWTW were above the limit throughout the study period, except for the June and July 2020 effluent, which had low concentrations of 74 and 16 mg/L, respectively. Concentrations in the Dwarsloop WWTW were low, except in February and September 2020, when they were significantly higher than the recommended limit, at 113 and 149 mg/L, respectively. Higher COD levels indicate that there is more oxidizable organic material in the water bodies, which reduces dissolved oxygen (DO) levels. A reduction in DO can lead to anaerobic conditions, which are harmful to higher aquatic life forms, and the COD is an important water quality parameter because it provides an index to assess the impact of discharged wastewater on the receiving environment [
21].
3.3.2. Water Quality Assessment Sand River Catchment
The water samples were collected from October 2019 to September 2020. The indicator variables selected for study purposes are pH, electrical conductivity (EC), ammonia, nitrate/nitrite, ortho-phosphate, and
Escherichia coli (
E. coli).
Table 1 shows the concentrations of the Physico-chemical parameters at each of the six sampling points.
3.3.3. Physical Parameters
Rainfall and Streamflow at Sand River Catchment
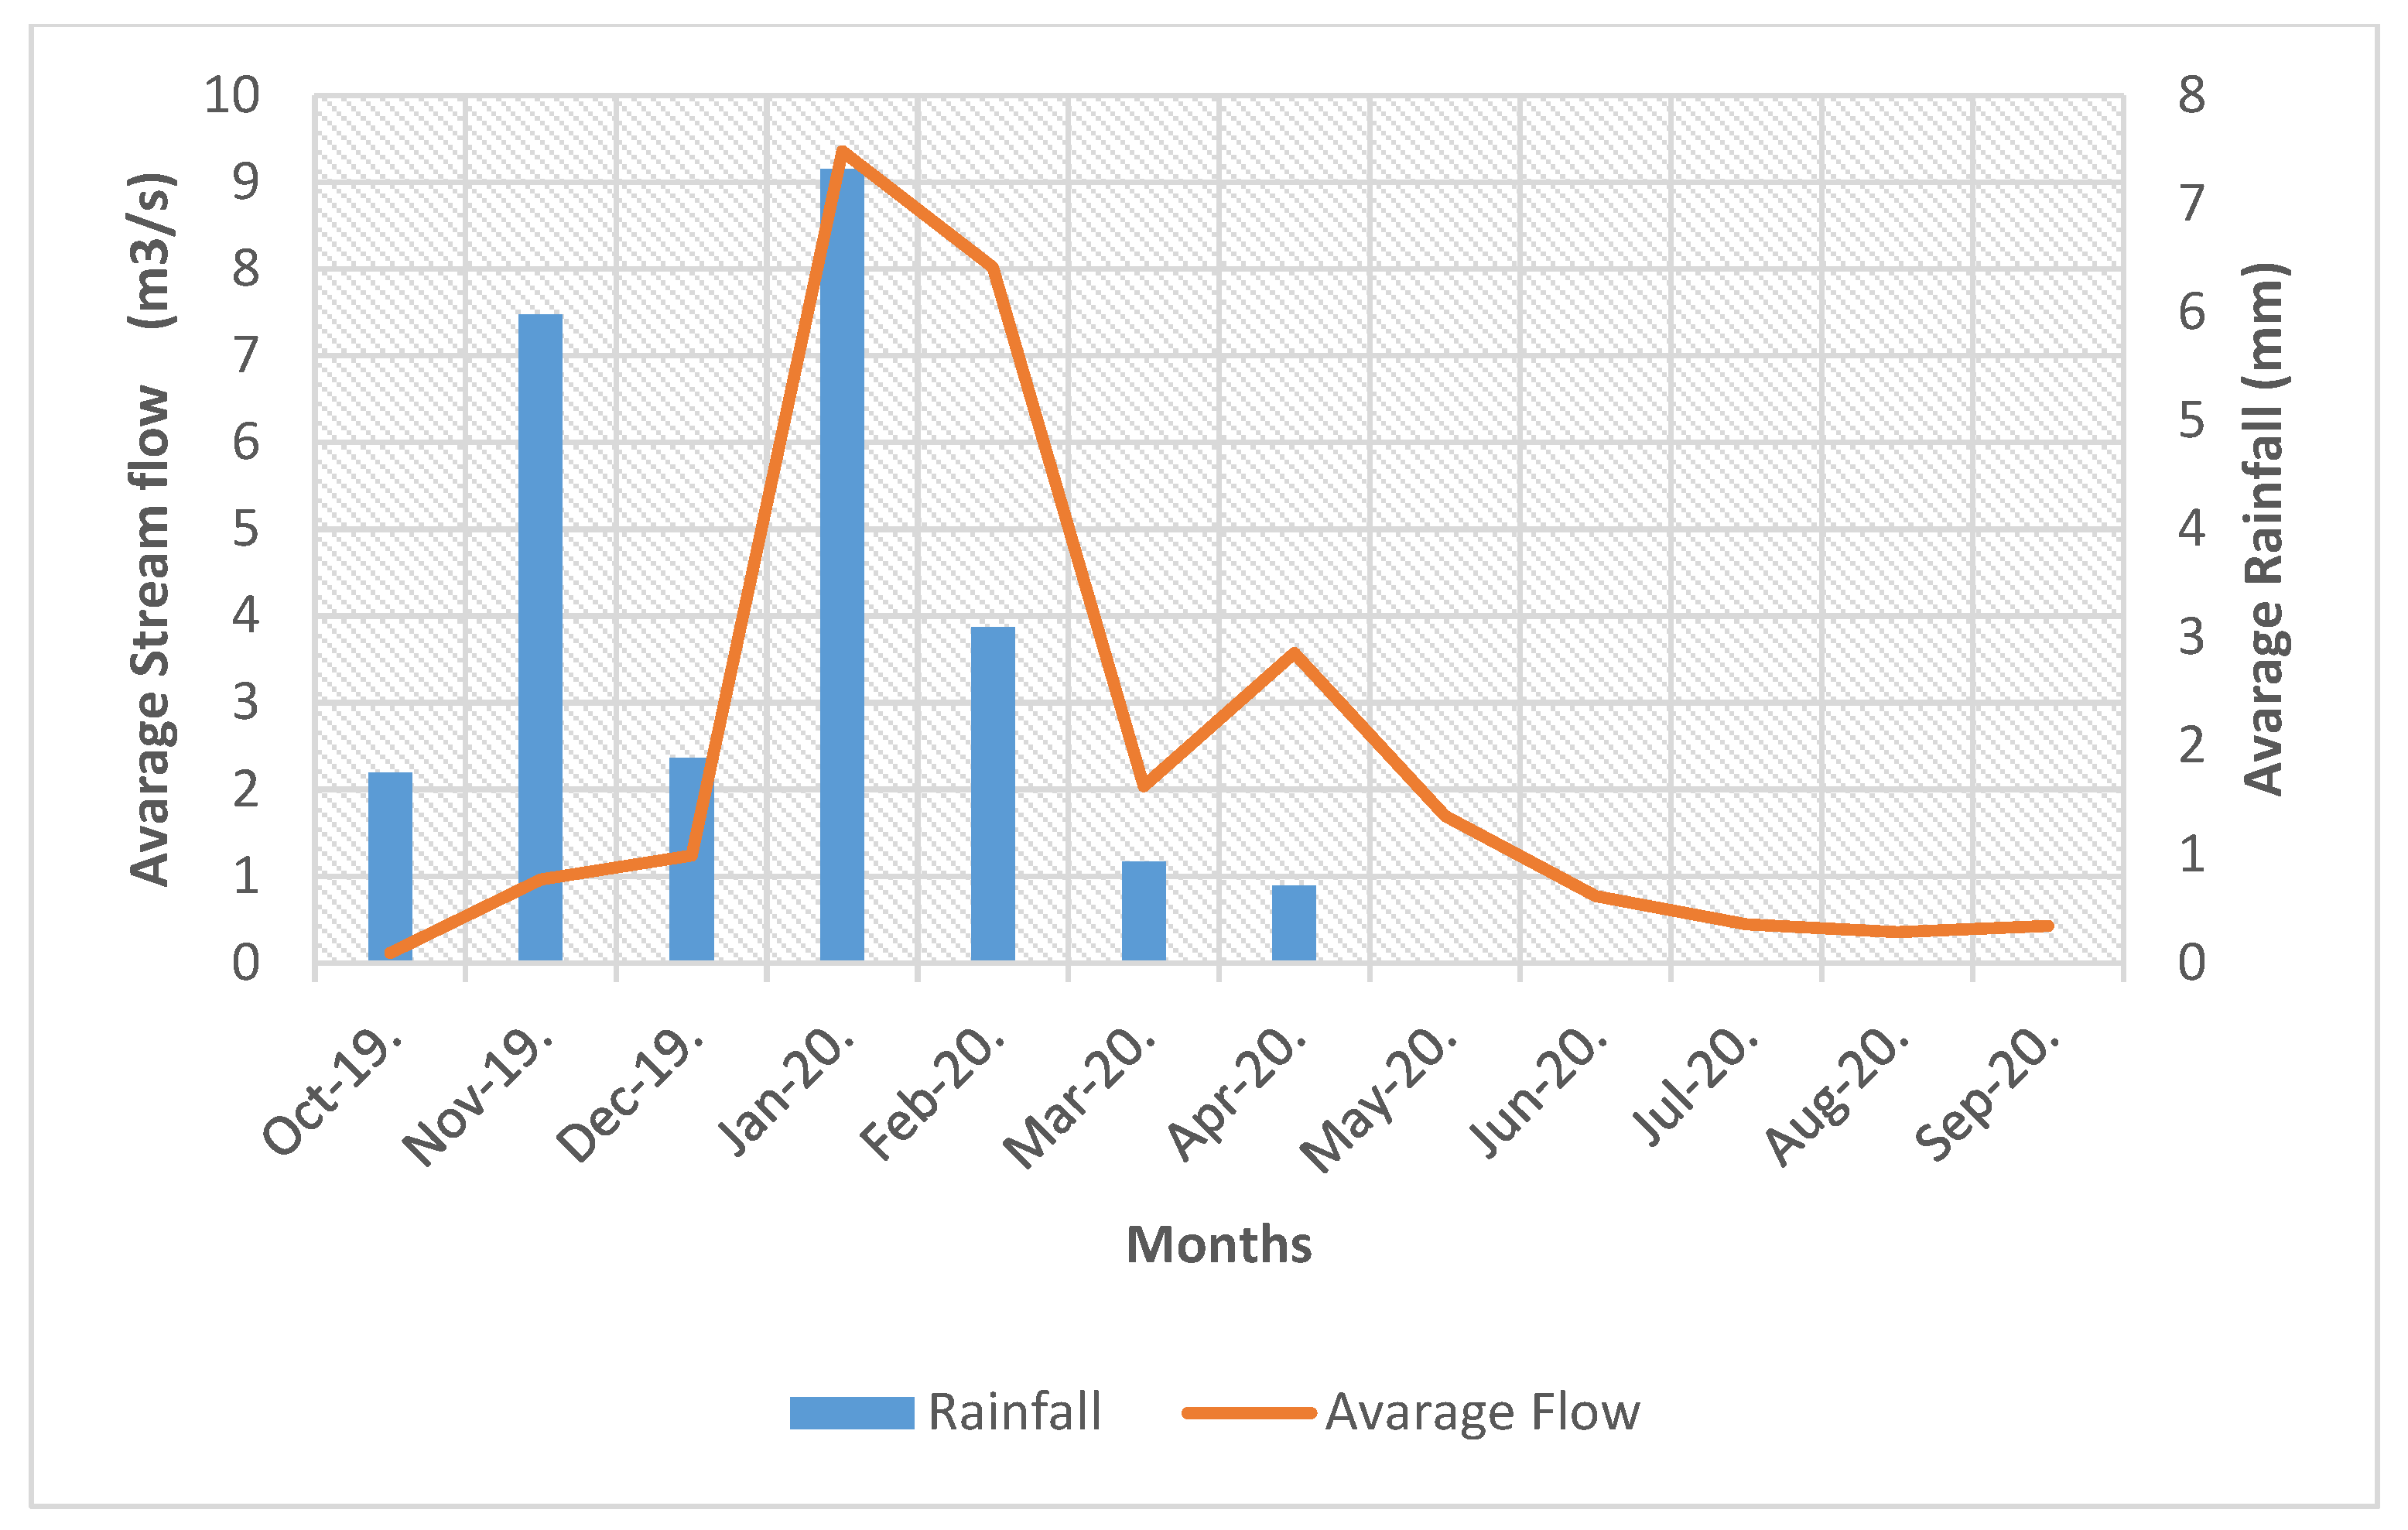
The monthly rainfall data collected at the Sand River Catchment during the study period ranges from 0 to 12.81 mm, with the average monthly rainfall for 2019 being 4.00 mm and 2.00 mm for 2020. Between October 2019 and April 2020, a variance in rainfall was observed in the area, presenting the rainfall season. From the graph, it was observed that in October 2019, at the beginning of the new rainfall season, there was an increase in precipitation.
Figure 12 depicts the Sand River Catchment’s monthly average streamflow, which ranged from 0.095 to 7.488 m
3/s. Peak flow was significantly higher in January and February 2020, with average flows of 7.488 and 6.414 m
3/s, respectively. The similar study observed the same pattern. The observation is that during the rainy season, runoff occurs in dissolved forms eroded during flow events, accounting for a significant proportion of transport from most cultivated lands [
22]. It is highly likely that the higher concentrations observed during periods of higher rainfall are due to this mode of nutrient transportation.
pH
The pH values ranged between 6.70 and 9.30 in all the sampling points along the Sand River Catchment and between 4.30 and 9.00 at the Mutlumivi River Sub Catchment throughout the resource monitoring. The pH of the Thulamahashe WWTW discharge point ranged from 6.70 to 9.30, 7.00 to 8.80 at the downstream point, and 6.90 to 7.80 at the upstream point of the Sand River Catchment, while the discharge point of the Dwarsloop WWTW ranged from 4.30 to 8.30, the downstream point ranged from 7.10 to 9.00, and the upstream point of the Mutlumivi River Sub Catchment ranged from 7.10 to 8.40. Both streams exhibited pH values that were mostly neutral, ranging between 6.90 and 9.00. Lower acidic pH levels that fall below the World Health Organisation's recommended limits for optimum water quality are harmful and toxic to aquatic organisms, reducing the chances for survival for species such as fish and some invertebrates that prefer clean water as a habitat and surface water with a pH of less than 4.5 is acidic and harmful to animals. This low acidic pH had no effect downstream of the Mutlumivi River Sub Catchment, where the pH was found to be 7.70. The pH ranged between 6.5 and 8.5, indicating that the streams were not contaminated with regard to pH levels14.
Electrical Conductivity (EC)
Electrical conductivity measurements at the Thulamahashe WWTW discharge point ranged between 20.8 and 87.5 mS/m, and at the downstream point of Sand River Catchment, between 20.2 and 51.2 mS/m, and the upstream point, between 16.6 and 44.7 mS/m. The discharge point of the Dwarsloop WWTW ranged between 29.7 and 49.9 mS/m, the downstream point ranged between 10.6 and 20.9 mS/m, and the upstream point of Mutlumivi River Sub Catchment ranged between 17.0 and 66.7 mS/m. The EC concentrations upstream and downstream for both catchments were within the Target Water Quality Standards (TWQS) for domestic use (0 to 70 mS/m), and for irrigation (40 mS/m), except in October 2019 and August 2020 in the downstream and upstream of the Sand River catchment, where the EC levels exceeded 40 mS/m, and the Mutlumivi River Sub Catchment exceeded in July 2020, the decrease in EC concentration at downstream could be attributed to rainfall, which increased the dilution capacity along the catchments. The geology of the area can influence conductivity in streams and rivers; for example, water passing through granite bedrock tends to have lower conductivity than water passing through clay soils [
23]. However, any increase in EC pollution could put the health of those who consume the water downstream at risk.
3.3.4. Chemical Parameters (Nutrients)
Nitrate/Nitrite
The nitrate/nitrite concentrations at the Thulamahashe WWTW discharge point ranged from 0.10 to 0.44 mg/L as N, from 0.01 to 0.102 mg/L as N at the downstream point, and from 0.01 to 0.73 mg/L as N at the upstream point of the Sand River Catchment. While the discharge point of the Dwarsloop WWTW ranged from 0.10 to 0.82 mg/L as N, the Mutlumivi River Sub Catchment downstream point ranged from 0.01 to 0.42 mg/L as N, and the upstream point ranged from 0.01 to 0.32 mg/L as N. The nitrate/nitrite concentrations for both streams were within the TWQS for domestic use (0 to 6 mg/L as N), irrigation (0 to 5 mg/L as N), and aquatic ecosystem (0 to 0.5 mg/L as N). However, in December 2019 and February 2020, downstream of both the Sand River and Mutlumivi River Sub Catchments, the limits were above the TWQS for aquaculture (0 to 0.05 mg/L as N), which could result in a stream that is toxic to salmonids. This could be attributed to high nitrate/nitrite concentrations at both the Thulamahashe and Dwarsloop WWTW discharge points, regardless of the fact that they have met the general effluent discharge standard.
Higher levels of nitrate/nitrite in aquatic systems cause increasingly rapid growth of algae and algal blooms, which can then cause problems such as unpleasant odors and tastes in water, as well as the possibility of toxicity.
Phosphate
The orthophosphate concentrations ranged from 0.01 to 0.10 and 0.01 to 0.4 mg/L as P at the upstream and downstream points of the Sand River Catchment, respectively, whereas at the Thulamahashe WWTWs discharge point, it ranged from 0.01 to 6.5 mg/L as P. At Dwarsloop WWTWs discharge point, the orthophosphate concentrations ranged from 0.01 to 3.60 mg/L as P, and at downstream and upstream points of the Mutlumivi River Sub Catchment, they ranged from 0.01 to 4.44 and 0.01 to 0.06 mg/L as P, respectively. All discharge points from the WWTW were within the general effluent standard limits of 10 mg/L, as P. Phosphate pollution did not occur in either of the catchments during the study. This also means that the eutrophic processes in the catchments will be less affected. Phosphate levels are not specified in South African water quality guidelines for domestic use, irrigation, aquatic, and recreational purposes. However, the TWQS for aquaculture is from 0 to 0.1 mg/L as P. The results showed that the phosphate level downstream of the Sand River Catchment was above the aquaculture limit in February 2020, while the phosphate level in the Mutlumivi River Sub Catchment was above the limit in July 2020).
Ammonia
At the upstream and downstream points of the Sand River Catchment, respectively, ammonia concentrations varied from 0.01 to 0.23 and 0.01 to 1.43 mg/L as N, but at the Thulamahashe WWTW’s discharge point, it ranged from 0.02 to 32.9 mg/L as N. Ammonia concentrations varied from 5.8 to 39.0 mg/L as N at the Dwarsloop WWTW’s discharge site, and from 0.01 to 13.10 and 0.01 to 0.03 mg/L as N at downstream and upstream points of the Mutlumivi River Sub Catchment, respectively. The discharge points for both WWTW during the study were not within the specified discharge limits of 3 mg/L. The ammonia concentrations in both catchments and some sapling points in different months of sampling were above the TWQS for domestic use (0 to 1.0 mg/L as N), aquaculture (0 to 0.025 mg/L as N in cold water) and aquatic ecosystem (0 to 0.007 mg/L as N). Ammonia as a gas is reported to be toxic to fish and other aquatic species. The ammonia concentrations in the current study surpassed the chronic and acute effect values, which lead to respiratory systems of numerous animals and can induce acute poisoning in fish, as well as systemic loss of balance, hyperexcitability, increased breathing rate, cardiac output, and oxygen consumption [
24]. Furthermore, it can cause convulsions, coma, and even death in severe circumstances. This high ammonium level has proved to be a prevalent sewage pollutant that contributes to eutrophication.
3.3.5. Microbiological Parameter
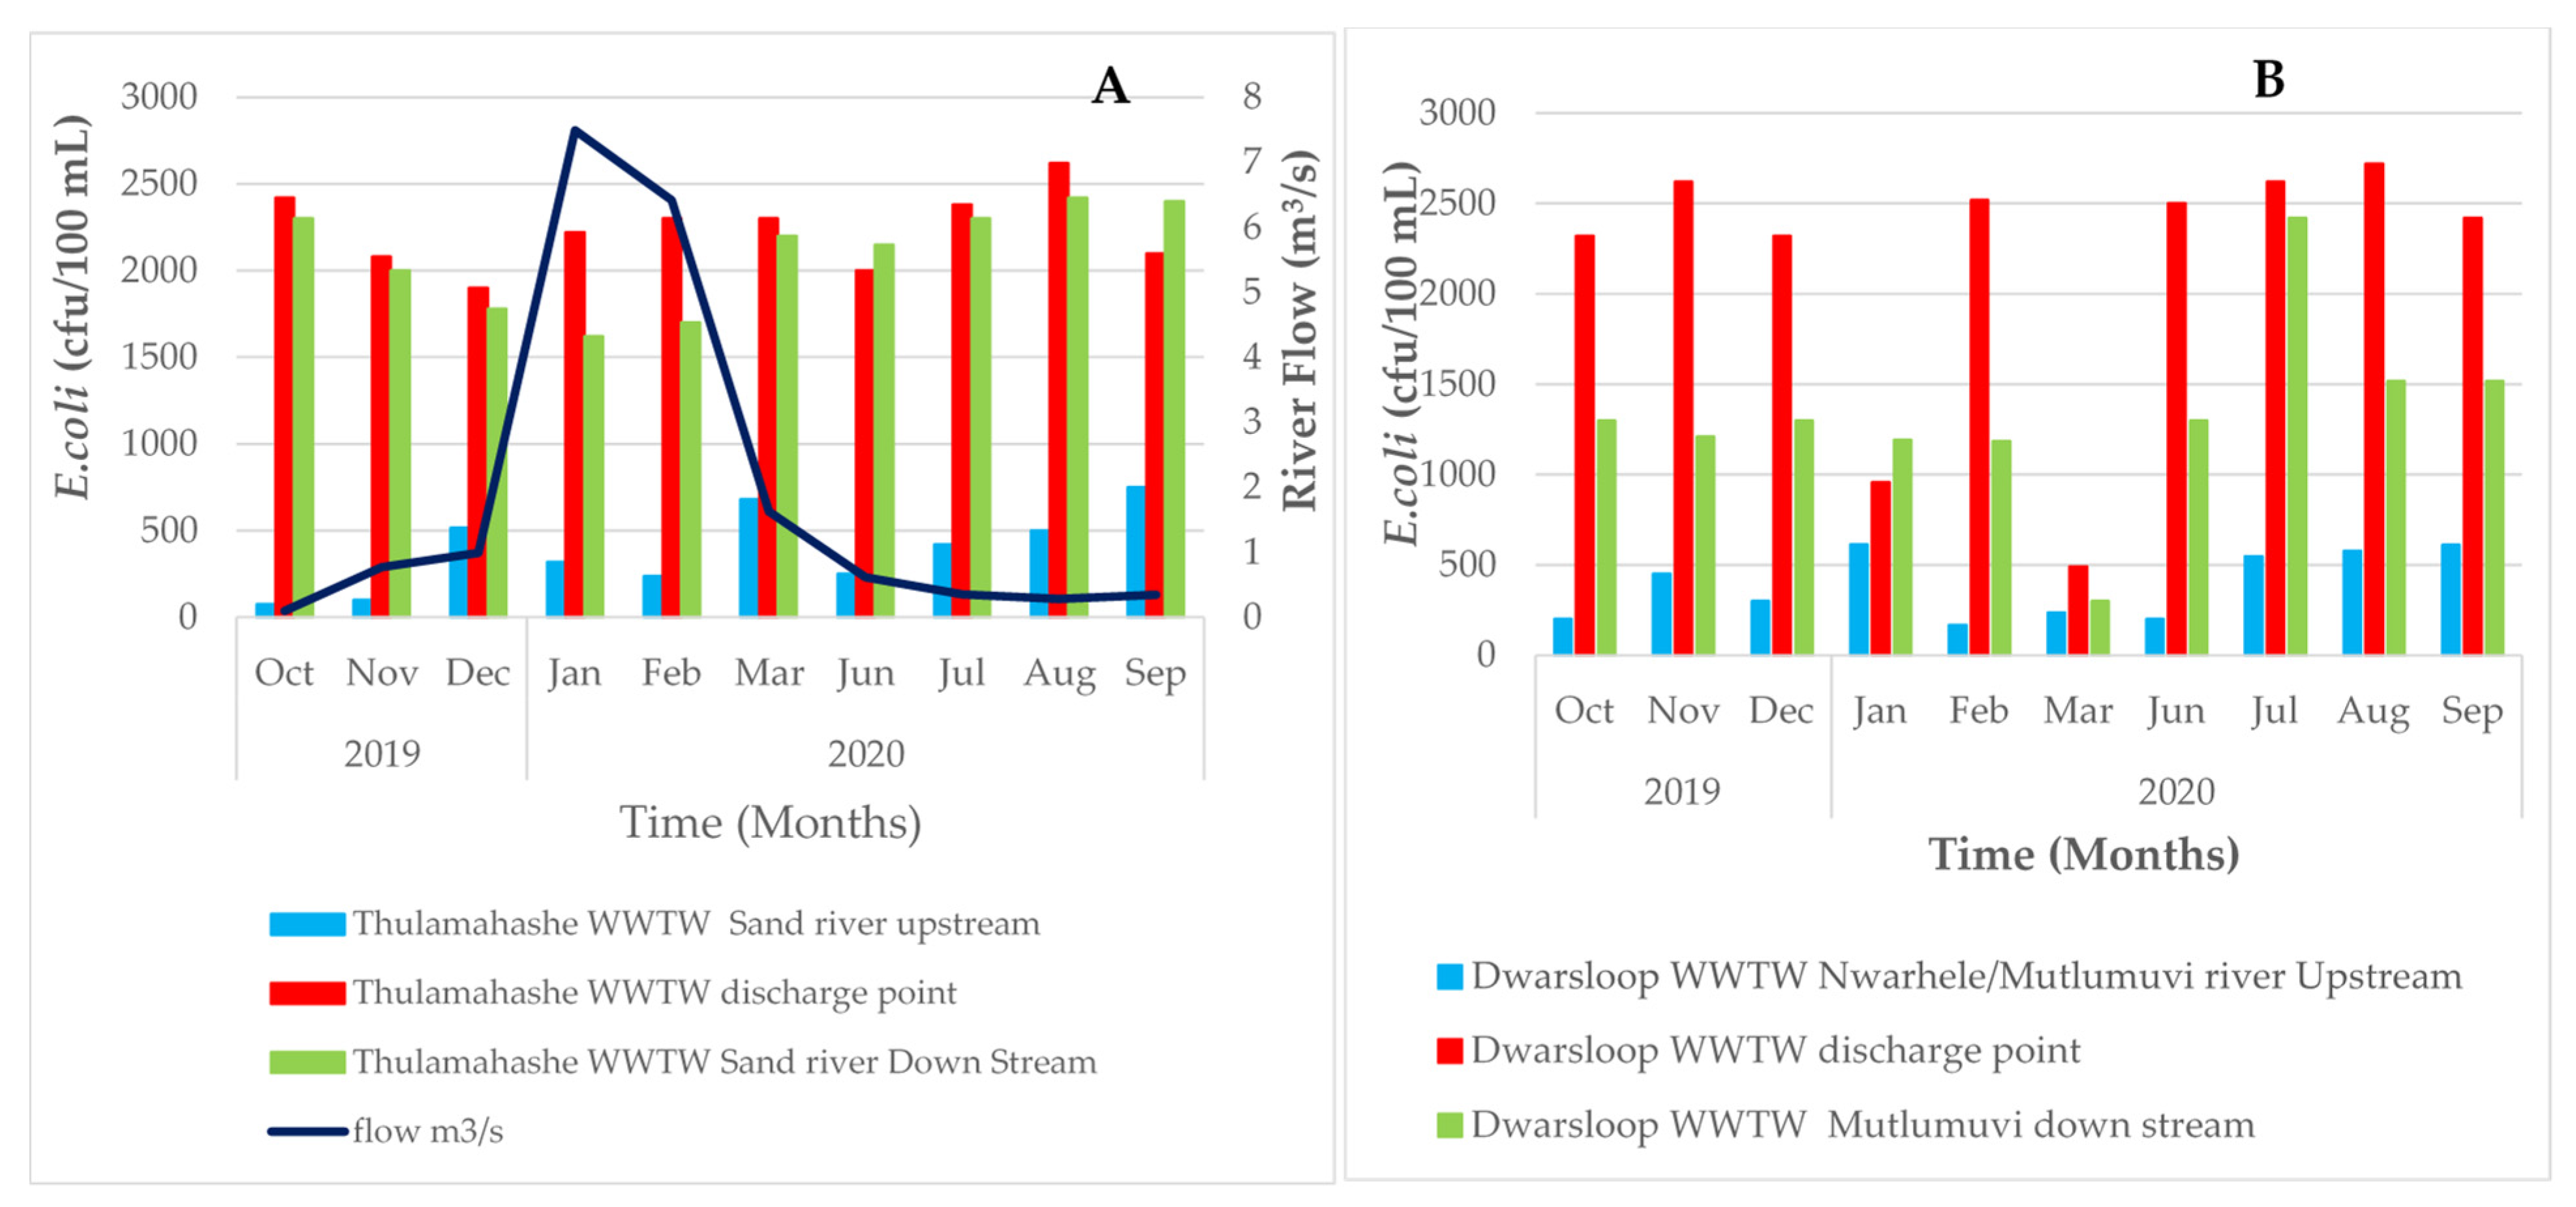
As indicated in
Figure 13A,
E. coli counts ranged from 1811 to 2520 CFU/100 mL at the Thulamahashe WWTW discharge point, from 75 to 720 counts/100 mL at the upstream point, and from 1620 to 2420 counts/100 mL at the downstream point of the Sand River Catchment. While
E. coli counts (B) ranged from 185 to 613 CFU/100 mL and 299 to 2420 CFU/100 mL, respectively, in the upstream and downstream points of the Mutlumivi River Sub Catchment, but also from 491 to 2720 CFU/100 mL at the Dwarsloop WWTW discharge point.
Escherichia coli was detected in both WWTW discharge samples. The acceptable irrigation limit for
E. coli as a hygiene indicator exceeded 0 CFU/100 mL. The high number of
E. coli presence in the effluent samples further suggested that the wastewater discharged was putting the environment and the communities at a higher risk of disease if the water source was used for Irrigation. Non-compliance for both catchments was also observed in the case of South African TWQS for domestic use (0 CFU/100 ml) and for recreational watering) use (0–130 CFU/100 ml) and agricultural (irrigation and livestock) (0–200 CFU/100 mL).
4. Discussion
The present study findings revealed that population growth, inadequate/dilapidating infrastructure, poor budgeting, and a lack of trained personnel to operate the WWTWs are the contributors to poor effluent discharged from WWTWs. Inadequate/dilapidated infrastructure was reported as the most prevalent factor, which could be attributed to poor maintenance and population growth. Generally, most municipal wastewater treatment works are in poor condition due to a lack of maintenance. Population growth can be linked to the inability of WWTW to handle waste because, as the population grows, so does domestic waste [
25]. Population increase and industrialization have generated an enormous amount of untreated wastewater being discharged into water bodies as raw water. It was also found that population growth is the case in the Sabie-Sand River Catchment. Other factors, such as a lack of trained personnel and poor budget utilization, could also be attributed to inadequate/dilapidated infrastructure [
26].
According to a similar study performed in Tanzania, regulations governing the allowable waste discharge into WWTW, and surface waters are becoming increasingly stringent as a result of large waste volumes and poor work ethics among WWTW’s employees [
27]. Moreover, it was also consistently found in the Kesikamma study that poor planning in the construction of houses as the population grows is a contributing factor because it connects housing units to the same existing treatment plant without addressing the treatment plant's limited design capacity [
28]. The design of most treatment works did not provide enough capacity to handle the current volume of wastewater and sewage influences, and it did not account for the likelihood of future population increase. Another concern expressed by participants is a lack of work ethics among wastewater treatment plant employees, as attested by an interview with an employee at Giyani Treatment Plant who stated, “Nobody cares what we release from our works, and nobody checks.” We get paid regardless of quality” [
29]. It is also evident in the lack of interest shown by treatment workers employees in gaining educational knowledge, owing to the fact that most of them are under-skilled. It was previously reported that discharges from the Dwarsloop and the Thulamahashe WWTs continuously decrease the quality of raw water in the Sand River catchment [
30]. This is due to the enormous inflow load of wastewater into the overloaded treatment plant resulting in untreated or inadequately treated wastewater/sewage being discharged into the river, contaminating water resources. The United States. Environmental Protection Agency also attests that catchment pollution can occur when wastewater flow surpasses the design capacity of treatment plants, resulting in untreated sewage water being discharged directly into receiving water bodies such as rivers and lakes [
31].
The participants (27%) also mentioned human settlement as another contributing factor to Sand River catchment pollution. In a similar 2015 study in Mpumalanga, environmental pollution began with the development of towns and built-up areas in the nineteenth century [
32]. Furthermore, low-income human settlements are more densely dispersed in congested urbanized townships along the Sand River catchment downstream of Thulamashe WWT. This rapid expansion of human settlement along the catchment has resulted in the WWTWs becoming overloaded and also increases anthropogenic activities that contribute to water resource pollution.
Questionnaire Participants (22%) also mentioned anthropogenic activities such as agricultural pollution as another source of pollution in the Sand River catchment. A study conducted in the Sabie Catchment further reported that the most common subsistence agricultural activities in these areas are livestock (cattle, goats, pigs, and poultry) and crop farming (maize, vegetables, and so on) [
33]. Crop farming can transfer nitrogen and phosphorus into streams through the use of fertilizers, which may be washed from agricultural lands into the catchment, polluting the water. Furthermore, human waste from open defecation or untreated livestock excrement pollutes water in the same way as fertilizers, and due to potential nutrient build-up, this could cause algal bloom, leading to eutrophication in the catchment. The study conducted in boseong county, Korea, also suggests that eutrophication advanced due to which the nutrients from human and natural activities transport occur, resulting in the deterioration of the water quality [
34].
The poor quality of wastewater effluents is responsible for the degradation of the receiving surface water body; however, it was observed that the instream quality might be influenced by instream flow. During high rainfall, low microbiological quality was recorded upstream and downstream of the WWTWs. The release of raw and improperly treated wastewater onto watercourses has both short- and long-term effects on the environment and human health. It is therefore recommended that there should be proper enforcement of water and environmental laws to protect the health of inhabitants of both rural and urban communities. In summation, it should be highlighted that poor planning and design of the treatment plants, which were found to be old, as well as the lack of current refurbishment, may have led to the poor management of WWTWs, which is likely to exacerbate the treatment works' inefficiency. Poor enforcement of environmental laws, as well as faulty equipment and machinery, are among the other factors that this study did not adequately address. All of these factors, when combined, contribute significantly to poor operation and maintenance, which in this case, has an impact on the quality of water resources. Furthermore, in the two wastewater treatment plants under investigation, there is a significant shortage of experienced personnel and the usage of untrained plant operators. According to the regulations of the National Water Act 36 of 1998 and WSA 108 of 1997, all WWTWs must be classified based on a variety of criteria. Therefore, Thulamahashe WWTWs are classified as class B and Dwarsloop as class D according to the regulation stated by the DWS (1986). The operational personnel (Process Controllers and Supervisors) must also be registered in accordance with DWS regulation 2834, as this is a legal requirement under the NWA (1998) and/or the WSA (1997) regulations. As per Regulation of the Water Services Act 108 (1997), the process controllers must be correctly placed depending on the classification of the WWTWs. During the inspection, it was noted that both WWTWs operate on a shift basis, with four process controllers and one supervisor in each treatment work. At Thulamahashe WWTWs, it was discovered that all process controllers were classified in accordance with the regulations, except for one process controller who was not. The treatment plant supervisor is classified as Class V, while one process controller is classified as Class III, and the other two process controllers are classified as Class II. However, at Dwarsloop WWTWs, all employees were not classified according to the regulations but were listed as “learner” process controllers. The lack of a “skilled” process controller could be the other factor that contributes to the malfunctioning of the Dwarsloop WWTWs. According to the regulation, Class B WWTWs are required to have two (Class I) process controllers, one (Class II), one (Class III), one “learner” process controller, and one supervisor (Class IV). At the same time, Class D requires one process controller (Class I), one “learner” process controller, and one supervisor (Class II) (DWS Regulation 2834, 1986). In conclusion, the inspection of two wastewater treatment plants in Mpumalanga revealed that they are confronting unprecedented mechanical and technical challenges. As a chemical component of the wastewater, pH has a direct influence on wastewater treatability regardless of whether the treatment is physical/chemical, or biological [
35]. As a result, preserving the alkalinity of wastewater is especially important for nitrification bacteria, which consume large amounts of alkalinity as they nitrify the ammonia in the wastewater.
5. Conclusions
Water is a commodity that sustains life, and its quality is critical for the aquatic environment and the advancement of living standards. As a result, having access to clean, safe water is critical for protecting community health by limiting the spread of waterborne diseases. This is due to municipal wastewater treatment plants failing to meet treated wastewater effluent requirements. The inability of wastewater treatment plants to remove microbial contamination in their final effluent may also be a major source of the spread of waterborne diseases in surrounding communities, so it is critical that the final effluents be free of potentially harmful chemicals and pathogenic organisms. This article study suggests a connection between the wastewater treatment plants and the water quality parameters, with poor water quality being linked to the condition of the WWTWs. According to the findings, the stakeholders in the Sand River Catchment have a high level of knowledge about the impact of WWTWs on water quality. The study revealed that factors such as population growth, poor operation and maintenance of WWTWs, poor budgeting, and a lack of well-trained personnel contributed to WWTW failure. Consequently, inadequate effluent quality was discharged into receiving water bodies, which might potentially cause adverse health, economic, and environmental implications. It’s critical to remember that this study found that human settlement and agriculture, as well as ineffective WWTWs, have an impact on the water quality of receiving water bodies. Both WWTWs selected for this study used biological filters to treat their wastewater, although these filters were not operating properly during the study period. As a result, the treatment systems were ineffective, causing parameters such as E. coli, suspended solids, ammonia, and COD discharged from WWTWs to fail to meet the general effluent discharge standard. Furthermore, due to ineffective chlorination systems, wastewater disinfection was ineffective. Throughout the study period, the chlorination dosing mechanism in both treatment works was not functional, which could have resulted in low or overdose of chlorine dosing at times. In short, the treatment plant has experienced numerous system failures due to aging systems and pressure on the deteriorating facilities, resulting in raw wastewater discharges into the catchments. It is, therefore, unscientific to build more wastewater and sewage infrastructure without addressing the underlying factors that cause these facilities to fail, such as population growth and treatment plants maintenance. Furthermore, South Africa has put in place effective measures to address these issues, but these measures must be transformed from paper to action.


