Article

Reckoning Groundwater Quality and Hydrogeochemical Processes for Drinking and Irrigation Purposes under the Influence of Anthropogenic Activities, North India

1
Department of Geology, Baba Farid Institute of Technology, Dehradun 248001, Uttarakhand, India
2
Department of Geology, Aligarh Muslim University, Aligarh 202002, Uttar Pradesh, India
3
Department of Petroleum Engineering, Glocal University, Saharanpur 247121, Uttar Pradesh, India
4
School of Industrial Technology, Universiti Sains Malaysia, Minden 11800, Pulau Pinang, Malaysia
5
Earth Process Modeling, CSIR-National Geophysical Research Institute, Hyderabad 500007, Telangana, India
*
Author to whom correspondence should be addressed.
Pollutants 2022, 2(4), 486-509; https://doi.org/10.3390/pollutants2040032
Submission received: 8 August 2022 / Revised: 19 September 2022 / Accepted: 15 November 2022 / Published: 5 December 2022

Abstract

:
The present study was carried out near an industrial area with a high-density urban population and large-scale agricultural activities. These anthropogenic activities lead to groundwater pollution and depletion of the water table. This study attempted to classify pollution sources and hydrochemical facies that help to ensure the suitability of water for agriculture and drinking. Irrigation suitability indexes, water quality index (WQI), principal component analysis (PCA), and hierarchical cluster analysis (HCA) were applied to twenty-six groundwater samples that were analysed during May 2018 for major cations and anion concentrations. The results revealed that the mechanism of groundwater chemistry has been controlled by the evaporation process with the dominance of hydrochemical facies viz., Ca-Mg-HCO3, Na-K-Cl-SO4, Ca-Mg-Cl, and Na-K-HCO3. The mean dominant concentration for cations is in the order of Ca2+ > Na+ > Mg2+ > K+ while anions are HCO3 > SO4 > Cl > NO3 > CO32− > F. Irrigation suitability indexes indicated that groundwater in the study area is high in saline and low to medium alkali hazards due to industrial activities. The PCA and HCA also recognized that most of the variations are elucidated by anthropogenic processes, predominantly due to excessive population, industrial emissions, and agricultural activities. Further, the WQI of the study area suggested that 15% of the samples were unsuitable, 69% poor, and the remaining 16% only suitable for drinking purposes. The present article helps to understand the suitability and hydrochemical processes of groundwater for irrigation and drinking, which will help policymakers in water supply planning and management.

1. Introduction

Water resources are distributed inequitably in India over time and space. Groundwater has played a significant role in agriculture and household use in arid or semiarid regions, where surface water is scarce and of poor quality. Nevertheless, groundwater has become severely polluted as a result of increased industrialization and urbanization [1,2,3]. More than two-thirds of India’s cities depend on groundwater as their primary source of drinking water, and water shortages occur when groundwater is contaminated [4]. Prompt action is needed to conserve and secure groundwater, particularly in arid or semiarid locations where groundwater is polluted, scarce, and of poor quality [5]. In addition, contaminated groundwater has been connected to many diseases that harm human health in several parts of India and other developing nations.
Although groundwater quality has become a significant aspect influencing human beings’ lives and agricultural growth, monitoring its quality is essential for sustainable groundwater development [6]. Natural processes and human activity contribute to groundwater quality in general. However, it is widely accepted that the latter classification, which includes uncontrolled urbanization, and industrial and agricultural operations, has more considerable variations in groundwater quality than natural phenomena [7,8]. Freshwater quality is frequently deteriorated by activities such as corrosion or incrustation of tube well screens, inorganic fertilizers, microscopic species, parasites, pesticides, herbicides, hydrocarbons, trace metals, and other harmful synthetic products [9]. According to a WHO report, most emerging countries are being discharged more than 65% of their untreated industrial effluent into the nearest water bodies, which has become a major source of pollution of surface water resources that has led to groundwater contamination [10,11].
There is no adequate drainage or sewerage infrastructure in the Aligarh area and, hence, wastewater effluents into the streams [12]. Therefore, contaminated water enters the many water bodies that constitute the Ganga and Yamuna River systems. The anthropogenic practices are the major source of water contamination that has a negative influence on the quality and quantity of groundwater. Groundwater contamination in Aligarh city and the surrounding area is strongly influenced by industrial operations, such as tanning leather, textiles, lock production, and foundries, which have a large population density. Further, as the stream obtains sewage disposal from point source pollution, such as textile industries, four mills, small-scale industries, and congested populated areas, the rising pollution load discharged into the stream was carried out to the water reservoir and ultimately resulted in deterioration of groundwater in an aquatic system. Household and untreated industrial discharges into the Yamuna and Ganga rivers may be responsible for the high concentration values of electrical conductivity, TDS, alkalinity, and salt in the rivers. Previous studies have included several initial and shallow assessments of groundwater quality in the city, which do not identify the actual causal variables that govern water quality, or random sampling [13,14,15].
However, other techniques that include remote sensing, hydrochemistry, and statistical analysis are useful methods for determining contamination sources. In addition, groundwater hydro-geochemical characteristics are investigated quickly and effectively using clustering analysis, which has been utilized extensively worldwide. Cluster analysis techniques have used principal component analysis and hierarchical cluster analysis to define the clusters of groundwater samples and determine the chemistry of groundwater [16]. Moreover, the water quality index (WQI) allows for the accurate classification of groundwater quality into several ranks based on groundwater quality standards. For the WQI calculation, groundwater in India is categorized into five ranks based on the Quality Standards for Groundwater of India. Geospatial technology makes it easy to understand groundwater hydrochemistry, which is critical to determining areas where groundwater is vital for domestic and agricultural purposes [17]. An assessment of water quality provides detailed information on the subsurface geological conditions in which water quality is observed [18]. It has been recognized that groundwater is influenced by its hydro-geological conditions, seasonal fluctuations, and human activities; nevertheless, there are few investigations on these aspects of groundwater hydro-geochemistry have been carried out [15,19,20,21], Hierarchical clustering methods and factor analysis have been applied by many researchers on seasonal hydrochemical data to understand the source and dynamics of hydrochemical processes [22,23,24,25,26]. The present study attempted to identify irrigation suitability using the Sodium Adsorption Ratio (SAR), Residual Sodium Carbonate (RSC), Kelly Ratio (KR), Potential Salinity (PS), Permeability Index (PI), and Sodium Percent (SP). Further, hydrochemical facies, groundwater quality, and pollution sources were evaluated using a Piper trilinear, Durov chart diagram, Gibbs’s ratio, water quality index (WQI), and multivariate statistical techniques.

2. Materials and Methods
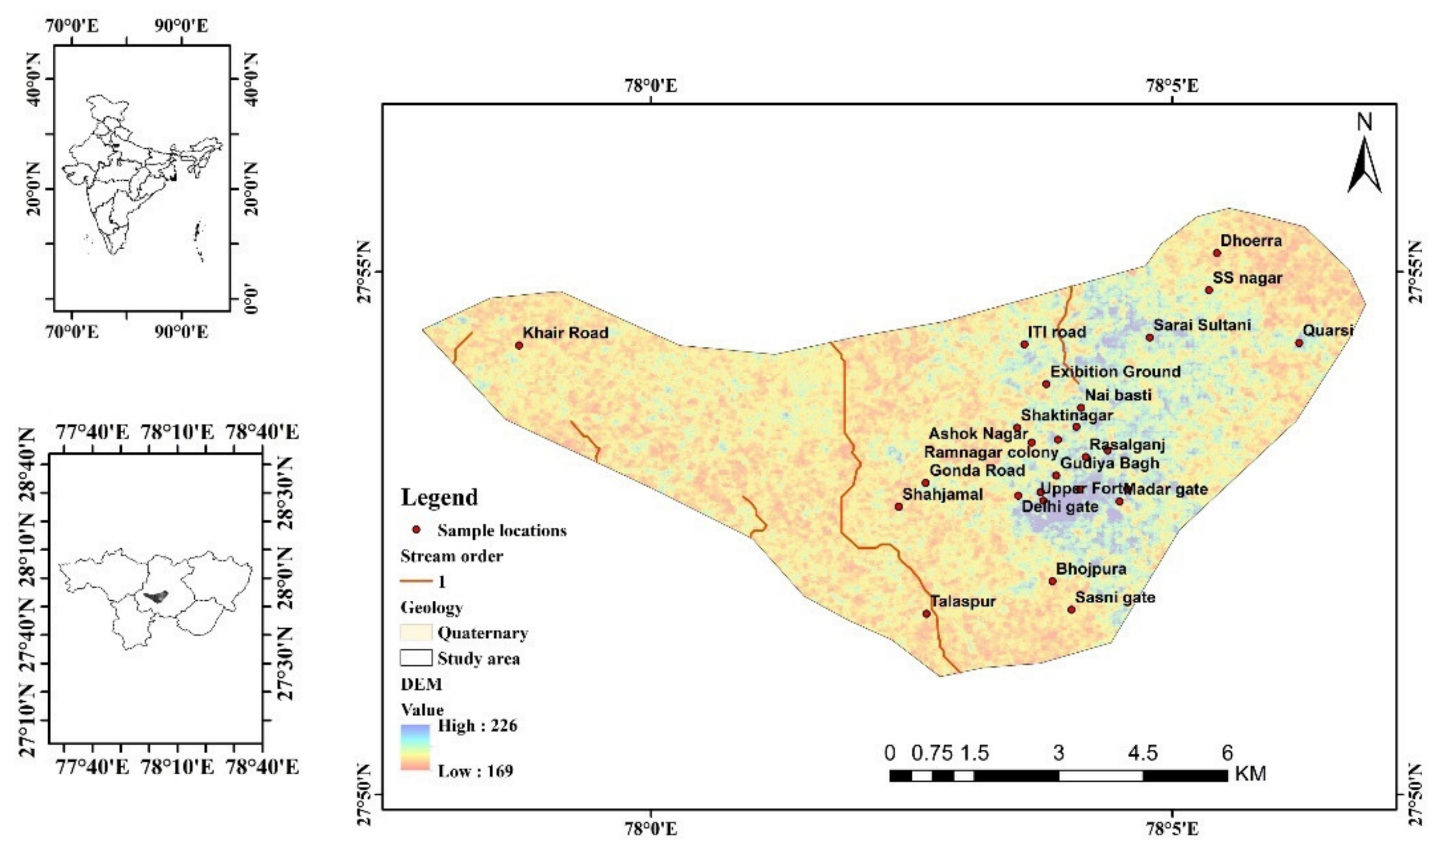
2.1. Study Area

The research area lies between the latitude 27°08′ N and longitude 78°08′ E with a population of around 36.7 lakh and a land area of 4023 sq. km. Aligarh is situated in Uttar Pradesh Central Ganga Plain. Aligarh district is a plain tenderly slanting from north to south. Aligarh area is situated in a Shallow fluvial depression between the two noteworthy streams, the Ganga and Yamuna. The zone falls under a tropical monsoon atmosphere where maximum rainfall occurs during the storm (June–Sept.). Yearly rainfall measures around 708.7 mm, and the maximum temperature stays around 42 °C, in May. In the winter season, the temperature ranges from around 10 °C to 21 °C. The bedrock formation is experienced at a depth of 340 m below ground level (m bgl). Alluvial sediments overlie the Vindhyan formation in an unconformable way. The thickness of the rock bed ranges from 287 to 380 m. Older alluvium possesses the upland of the region, while the newer alluvium involves the swamp region along with the courses of Ganga, Yamuna, and their tributaries, such as Kali streams [27]. In the area, a large pile of alluvial deposits with varying grades of sand, clay, and silt existed. The lithological information indicated that a variety of fine to medium sand, calcareous gravels, and clay are common in the area. The depth range of the most potential aquifer is about 0.0–122.0 m.b.g.l. in the study area.

2.2. Sample Collection and Preparation

Twenty-six water samples were collected from the shallow aquifer in various parts of the Aligarh district during May 2018 and this district is densely populated and more prone to groundwater contamination. Sample number 7 was taken from just the outskirts of the study area; number 3 was taken from the food processing factories area, and the rest of the samples were collected from an open area distributed across the study area (Figure 1). The physicochemical investigation was conducted in May 2018, to be precise, to comprehend the chemical variations of groundwater. Before taking the samples, the storage water in the borewell casing was removed by the initial water withdrawal for 8–10 min from the borehole. Then, the sample was stored in polyethylene containers of one liter at 4 °C, prewashed with 1N-HCl and double-distilled water. The groundwater samples were analyzed using standard procedures [28].
The EC and pH were estimated by a pre-calibrated conductivity meter and portable pH meters in the field immediately after tapping water samples using the Hanna water quality meter. Furthermore, TDS values were determined from the EC meter by the conversion factor from 0.55 to 0.75, depending on the relative concentration of ions [29]. An EDTA (Ethylenediamineteracetate) titrimetric approach was used to assess calcium and magnesium concentrations, utilizing ammonium purported as a predictor for the measurement of Ca+2 composition alone and “Eriochrome Black T” as an indicator for Ca+2 and Mg2+. The hardness was calculated by the concentration of calcium and magnesium. Sodium and potassium concentrations were measured using digital flame emission photometry. Further, sulfate, nitrate, and fluoride were analyzed using a double beam UV–visible spectrophotometer (model-SHIMADZU CORP. 07410, SERIAL NO. A114549). Standard silver nitrate titration (0.01N) was used to estimate the chloride (Cl) ion concentration, with 1 mL of potassium chromate (5%) acting as an indicator. The carbonate (CO3) and bicarbonate (HCO3) were determined using a volumetric approach, such as (0.01N H2SO4). The variation of cation and anion concentrations in the study area was plotted using ArcGIS 10.3 software. Furthermore, groundwater quality maps were prepared using inverse distance weight (IDW) interpolation in a GIS environment to show the spatial distribution for various physio-chemical parameters. The groundwater quality has been compared with the drinking water standards of the Bureau of Indian Standards [30] and the world health organization [11].
Sodium Adsorption Ratio (SAR), Percentage Sodium (Na%), Permeability Index (PI), Potential Salinity (PS), Kelly Ratio (KR), and Residual Sodium Carbonate (RSC) methods were used to determine the irrigation suitability of groundwater in this study, and their formulas are shown in Table 1. Further, the various hydro-geochemical characteristics of groundwater for drinking and irrigation suitability were recognized using Piper trilinear diagrams, Wilcox plot, and USSL (United States Salinity Laboratory), as well as Gibbs ratios (CA-I and CA-II), which have been used for the investigation of sources of groundwater parameters. The Piper diagram, Durov, Gibbs, and other diagrams were plotted using Aquachem 9.0 software to demonstrate the pattern of major ions.

2.3. Water Quality Index (WQI)

The WQI, based on physical and chemical parameters, has been used to evaluate the range of groundwater quality and pollution [2,38]. Furthermore, the WQI can help determine overall water quality and measure the impact of individual parameters. According to their impact on water quality, different weightage values were assigned for these parameters. For example, the following weightage is distributed such as 5 for TDS and nitrate, 4 for pH, EC, sulfate, and fluoride, 3 for bicarbonate and chloride, 2 for sodium, potassium, and calcium, total hardness, and 1 for magnesium. For each parameter, WQI may be calculated utilizing an equation to estimate the relative weight (Wi), sub-index (SIi), and quality rating scale (qi).
W i = W i n = 1 n W i
q i = C i S i 100  
SI i = W i q i
WQI = i = 1 n Sl i
where Wi denotes the relative weight of the ith parameters, wi indicates the weight assigned to ith parameters, and n is the number of parameters, as shown in Equation (1). In Equation (2), qiis the quality rating scale, Sishows the standards permissible limit for ith parameters except for pH, and Ci is the ith parameter concentration. The water quality sub-index (Sli) determines each ith parameter to extract the WQI value using Equation (3), and finally, (Sli) is utilized to estimate the WQI using Equation (4). The calculated WQI values are characterized into five classes: excellent water class (WQI < 25); good water (25–50); poor water (50–75); very poor water (75–100); and water unsuitable for drinking (WQI > 100).

2.4. Multivariate Statistical Analysis

Human activity (irrigation and industrial effluents) is a major source of groundwater contamination and natural processes (such as the weathering of rocks, and geological and hydrological processes). Source distribution was evaluated and interpreted quantitatively and independently using a multivariate statistical technique [39]. Statistical software was used to conduct these investigations (SPSS version 21). The Pearson correlation coefficient (r), principal component analysis (PCA), and hierarchical cluster analysis (HCA) were utilized in this study because of their importance in groundwater-related investigations. Factor analysis or PCA is mainly applied to determine the hidden dimension that can’t be interpreted through indirect analysis [40]. To reduce the size of large datasets with a minimum loss of information, the PCA method was used. SPSS software was used to compute PCA using Varimax rotation. All factors were auto-scaled by average range to zero and variance to 1, respectively. To investigate the interpretation of the dataset, PCA with an eigenvalue of 1 was taken into account. The measurement of similarity among the water quality variables was compared using Ward’s linkage approach with Euclidean distance. To identify statistically distinct hydrochemical variables, HCA was performed, which was based on grouping. Based on their similarities, clusters, and groupings are formed, and this is an unsupervised pattern detection process [41]. The Pearson correlation coefficient technique is a helpful method for identifying the relationship between numerical variables, and it is used to analyze the closeness and degree of linear correlation of dependent and independent variables [42].

3. Results and Discussion

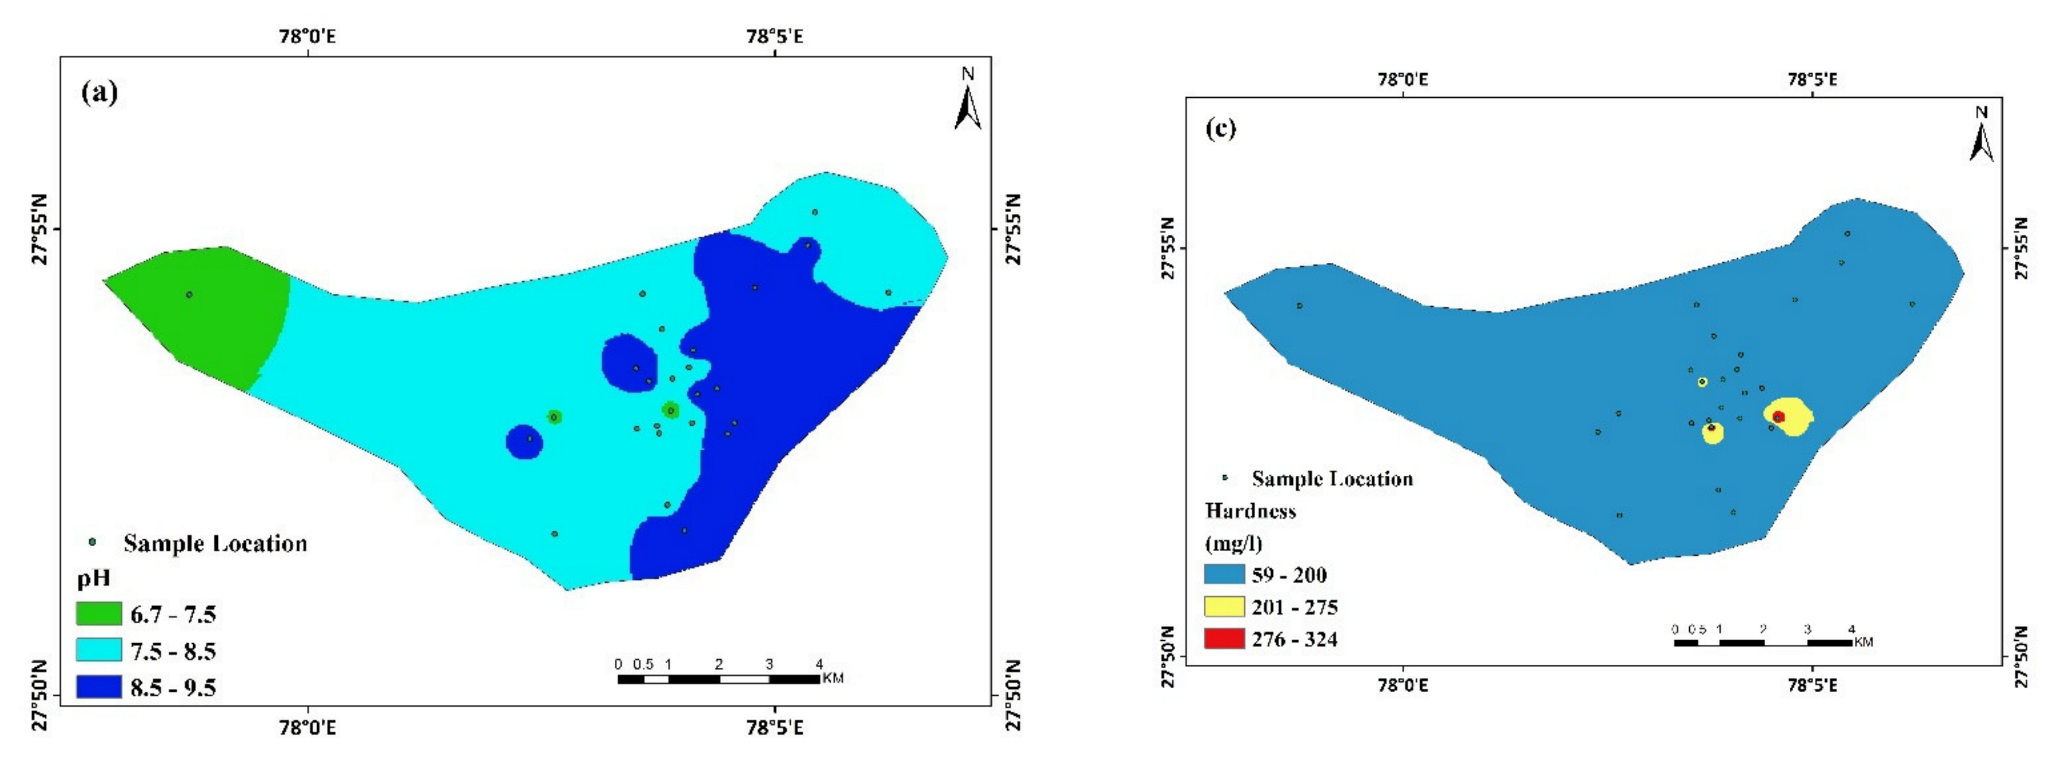
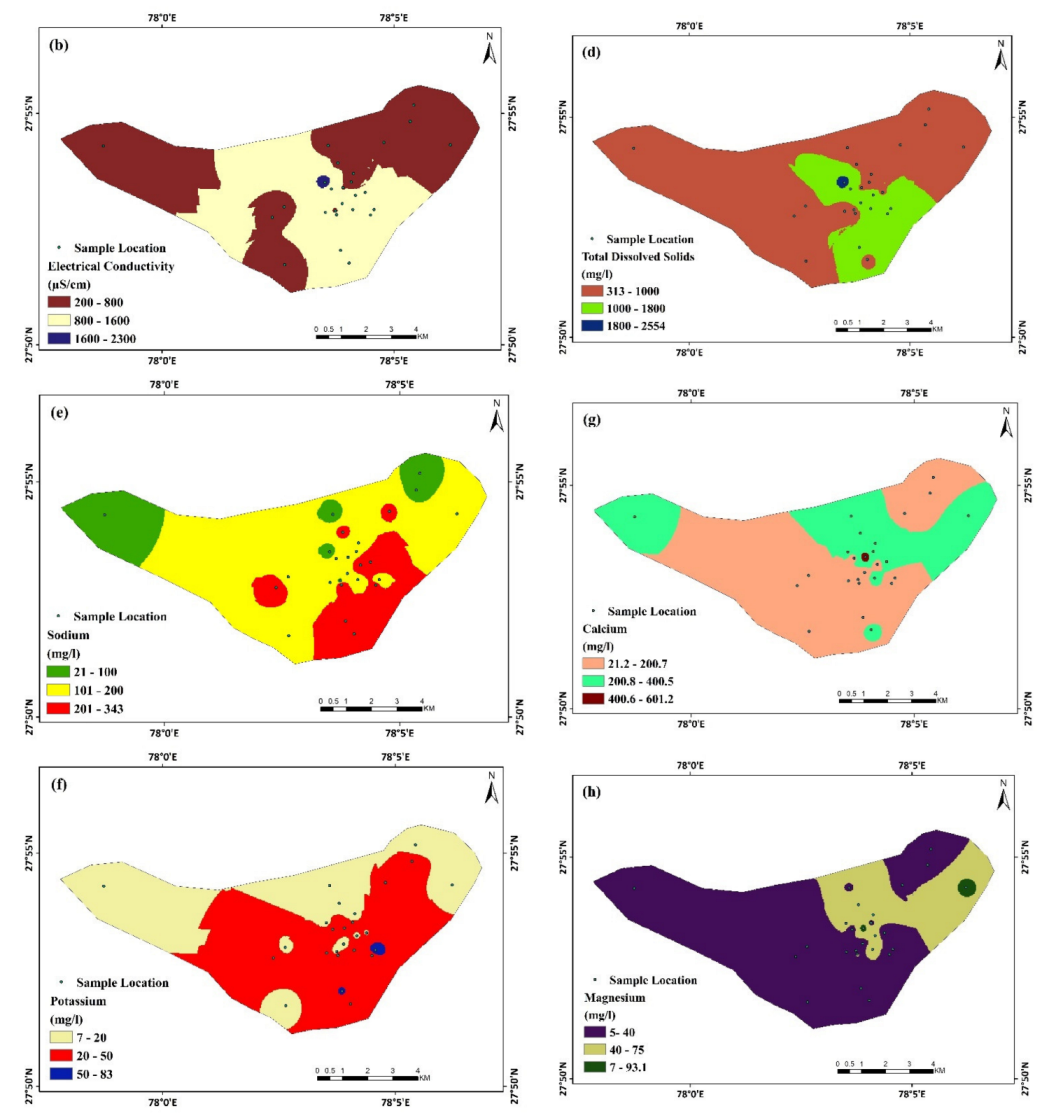
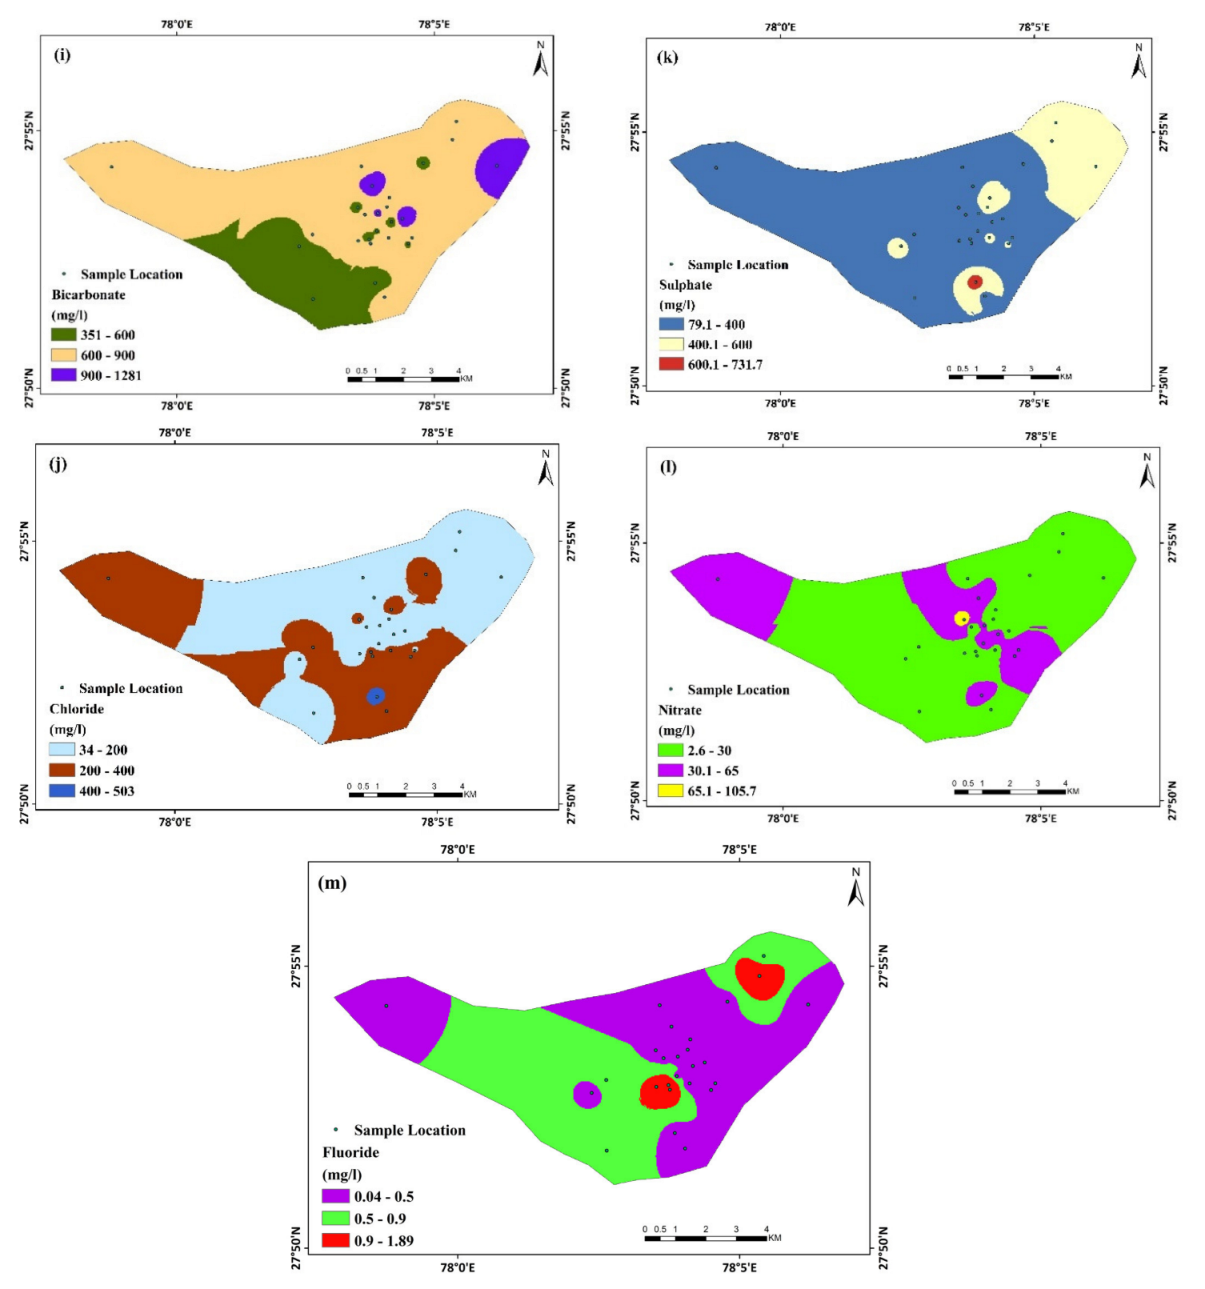
3.1. Groundwater Chemistry and Drinking Water Quality

Descriptive statistics of the concentration of pH, EC, TDS, hardness, and main ions in groundwater comprising maximum, minimum, and average values for each variable along with standards deviations evaluated and compared with standards of drinking water suitability guidelines approved by BIS (BIS, 2012) and WHO [11]. Furthermore, the weight and relative weight of each parameter are also described, as shown in Table 2. The spatial distribution of concentration of different parameter is shown in Figure 2.
In the research area, the pH was found the ranges from 6.7 to 9.5, with an average of 8.3, indicating that the few samples were alkaline due to high concentration. Further, a pH of more than 8.5 was found in 11 groundwater samples because of human activities. Groundwater samples have shown total hardness ranges from 59 to 324 mg/L with an average of 139.37 mg/L. In determining the suitability of water samples for household and crop irrigation, hardness was a crucial component, and only three groundwater samples were accepted within the acceptable limit, and the rest of the samples were below the permissible. The hardness values of water are classified as soft, hard, moderately hard, and very hard [43]. There is a specified limit of 500 mg/L the maximum hardness that can be used in drinking water and hardness greater than 1000 mg/L is allowable for landscape irrigation. In the groundwater, the EC concentrations ranged between 200 to 2300 µS/cm, with a mean value of 836.92 µS/cm. EC is specifically correlated with the ionic levels found in water, and larger values correspond to higher salinity and total dissolved concentration.
The TDS values varied between 313 mg/L to 2554 mg/L with an average of 933 mg/L, and the TDS results revealed three samples below the 500 mg/L except for a high value in Shaktinagar (2554 mg/L), and other samples showed a moderate range. In addition, TDS is the total of carbonates, potassium, calcium, chlorides, sodium, bi-carbonates, phosphate, magnesium, and other particles. The dominance of groundwater samples is found in the higher amount of TDS from 1500 mg/L which indicates the water is not suitable for drinking purposes; however, the TDS results were classified as slightly saline to moderately saline water type. Further, if the concentration of TDS lies above the prescribed limit given by the standards described above, it can cause gastrointestinal problems in the human body. Agricultural waste and industrial seepages, as well as channel water with sediments, may all contribute to excessive TDS concentrations in the water body. Further, the country’s rocks are also the most significant cause of rising groundwater-dissolved solids.
The concentrations of cations such as Na+, K+, Mg2+, and > Ca+2 was ranged from 21 to 343 mg/L with an average of 167 mg/L, 7 to 83 mg/L with an average of 23 mg/L, 5.2 to 93.1 mg/L mg/L with an average of 34.56 mg/L and 21.2 to 601.2 mg/L mg/L with an average of 181.66 mg/L, respectively. Based on the results, the samples of Bhojpura, Upper Fort, and Railway Road showed a high concentration of sodium in groundwater. The calcium values were intolerable in the groundwater samples of Khair Road, Ashok Nagar, Mahavirgan, Railway Road, and Ramnagar colony. The magnesium concentrations in groundwater showed an extremely high range of samples in Sarai Sultani, Ashok Nagar, Shaktinagar, and Rasalganj. On the other hand, chloride is one of the most common inorganic anions in groundwater, and its concentrations in the study area were found between 34.56 and 502.68 mg/L with an average of 191.59 mg/L. Some samples contributed high concentrations in the groundwater, such as Bhojpura, Nai Basti, and other areas because of poor sanitary conditions, industrial effluents, chemical fertilizers, irrigation return flow, and industrial effluents in the area. There were seven samples from the study region that exceeded the permissible limit and maximum acceptable limit of chloride value (250 mg/L), according to WHO, and these samples were unsuitable for drinking purposes, while the rest of the samples were within the permissible limits for drinking. The fluoride values in groundwater samples were observed from 0.04 to 1.89 mg/L with an average of 0.49 mg/L and the 2 samples showed a value above 1.50 mg/L.
The bicarbonate concentration has been found in the range of 351 to 1281 mg/L with an average of 705 mg/L. The high concentration of HCO3 compared to chloride concentration in groundwater is due to high anthropogenic loads, mostly from domestic sewag. The sulfate concentration was found to range from 79.1 to 731.7 mg/L with an average value of 340.99 mg/L, which is a significant and pervasive environmental concern due to industrial contamination. The 19 samples showed sulfate concentrations that were more than the permissible limits prescribed by the BIS.
The concentration of nitrates was observed between 2.6 to 105.7 mg/L with an average of 26.72 mg/L falls below the recommended WHO limit of 45 mg/L. In the Shakti Nagar area, the value of nitrate was exceptionally high 105.7 mg/L because of irrigation applications. Generally, the concentration of NO3 in groundwater does not exceed 10 mg/L, which implies anthropogenic contamination, mainly due to poor sanitation and the widespread use of greater fertilizers for increased crop productivity [44]. However, the concentration of NO3 can cause cyanosis in infants, and it additionally influences the cardiovascular and sensory systems and creates gastric cancer in adults [45]. The order of cations was showed Na+ > K+ > Mg2+ > Ca+2 and anions were ordered as HCO3− > SO42− > Cl > NO3 >F, respectively. Plotting significant ions in the Piper trilinear diagram helps to understand the hydrochemical evolution of groundwater in the research area (Figure 3). There are only two samples in the lower right triangle with Mg2+ contributions that exceed 50% of the total anion load, and the remainder of the samples have no dominating type, which indicates mixed water.

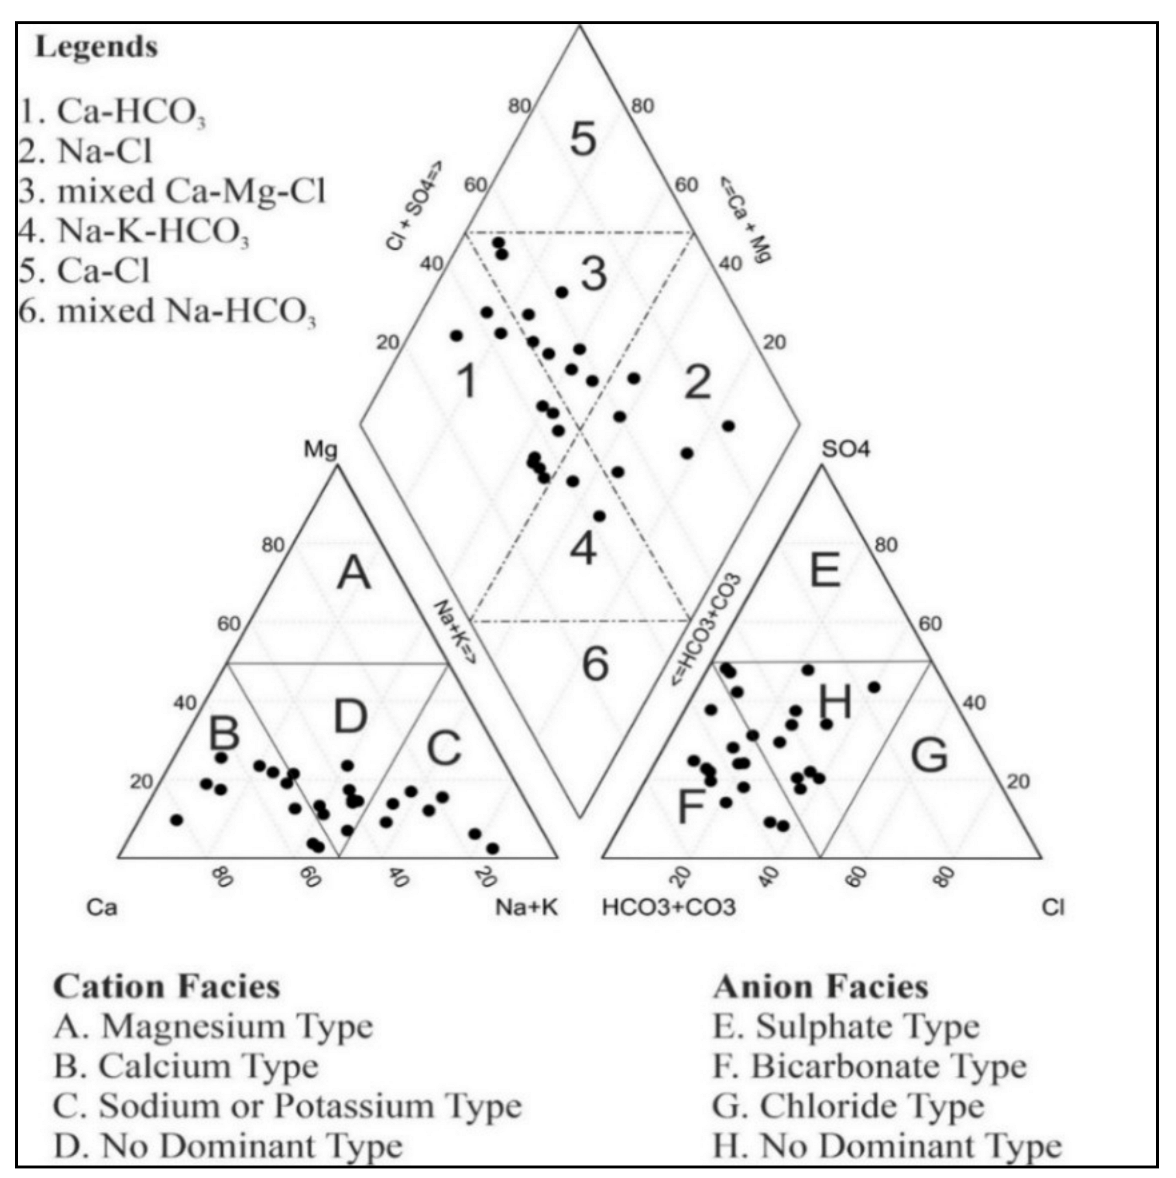
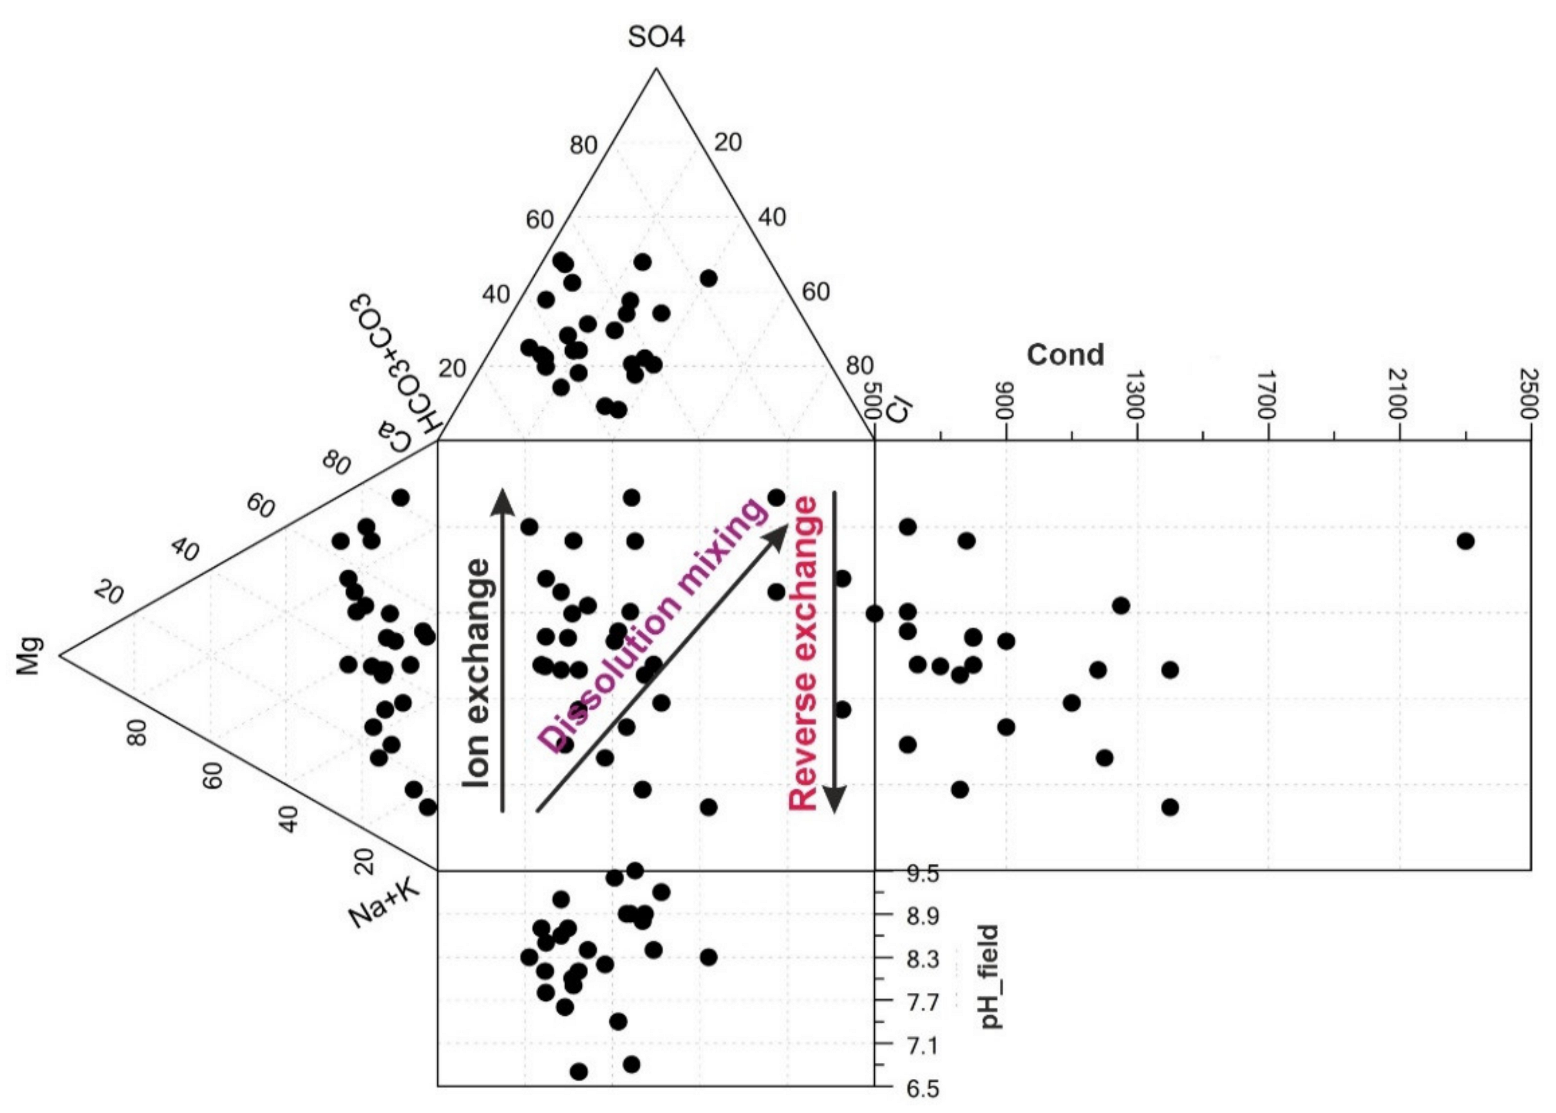
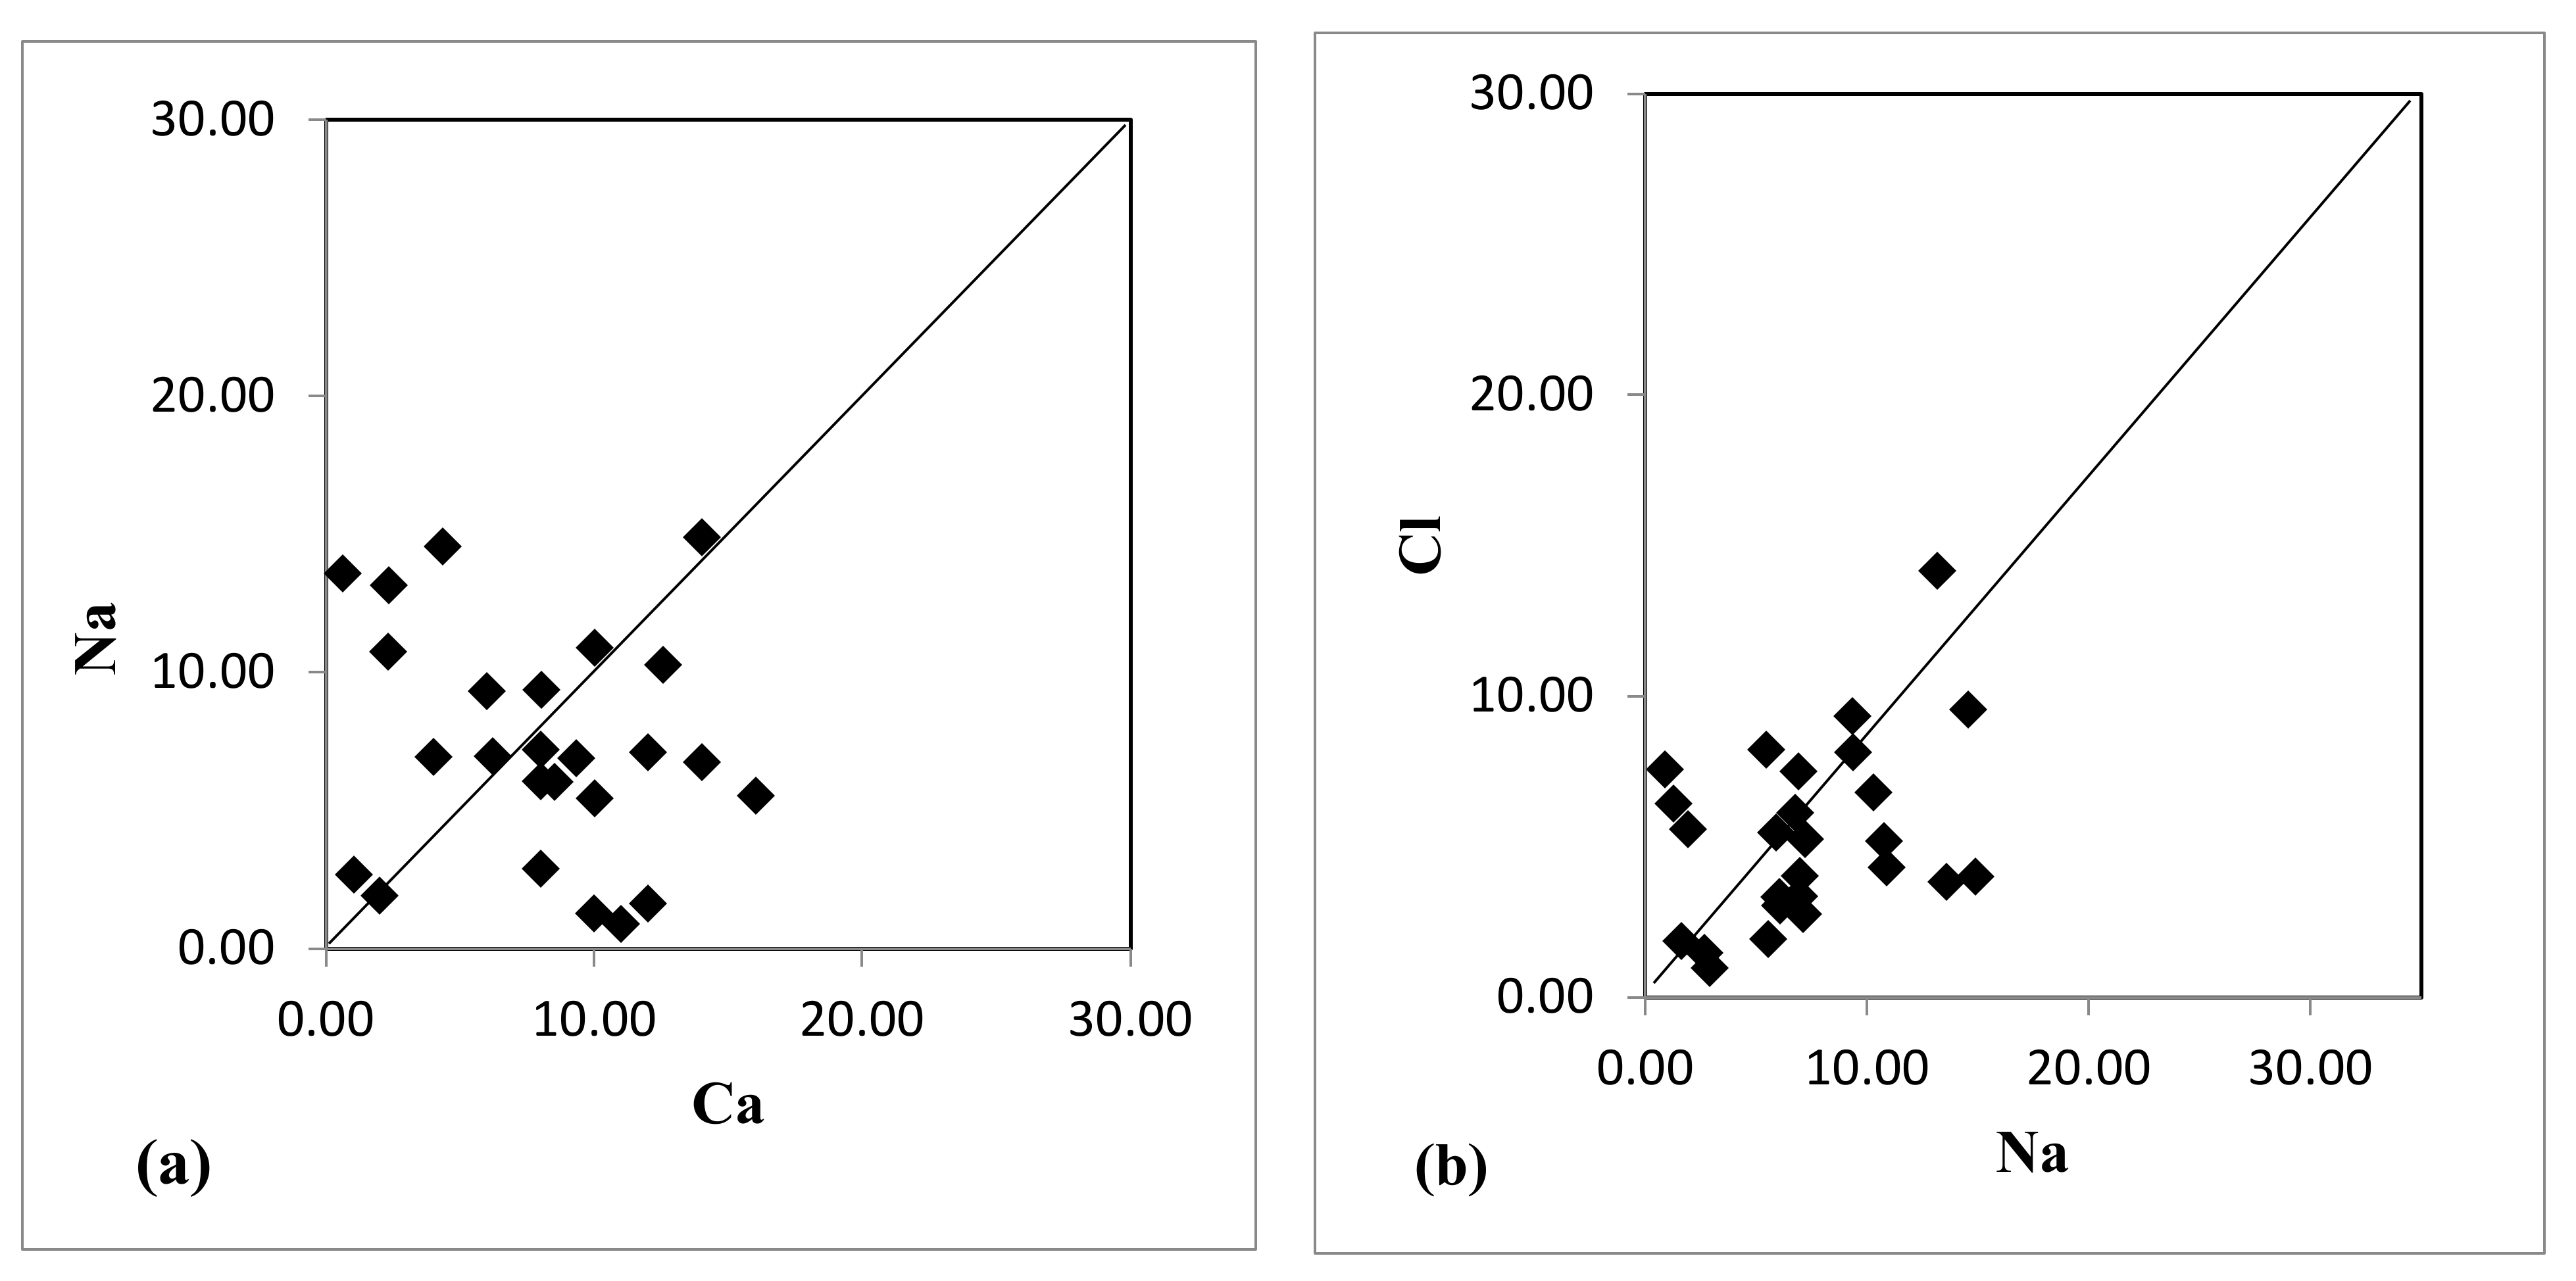
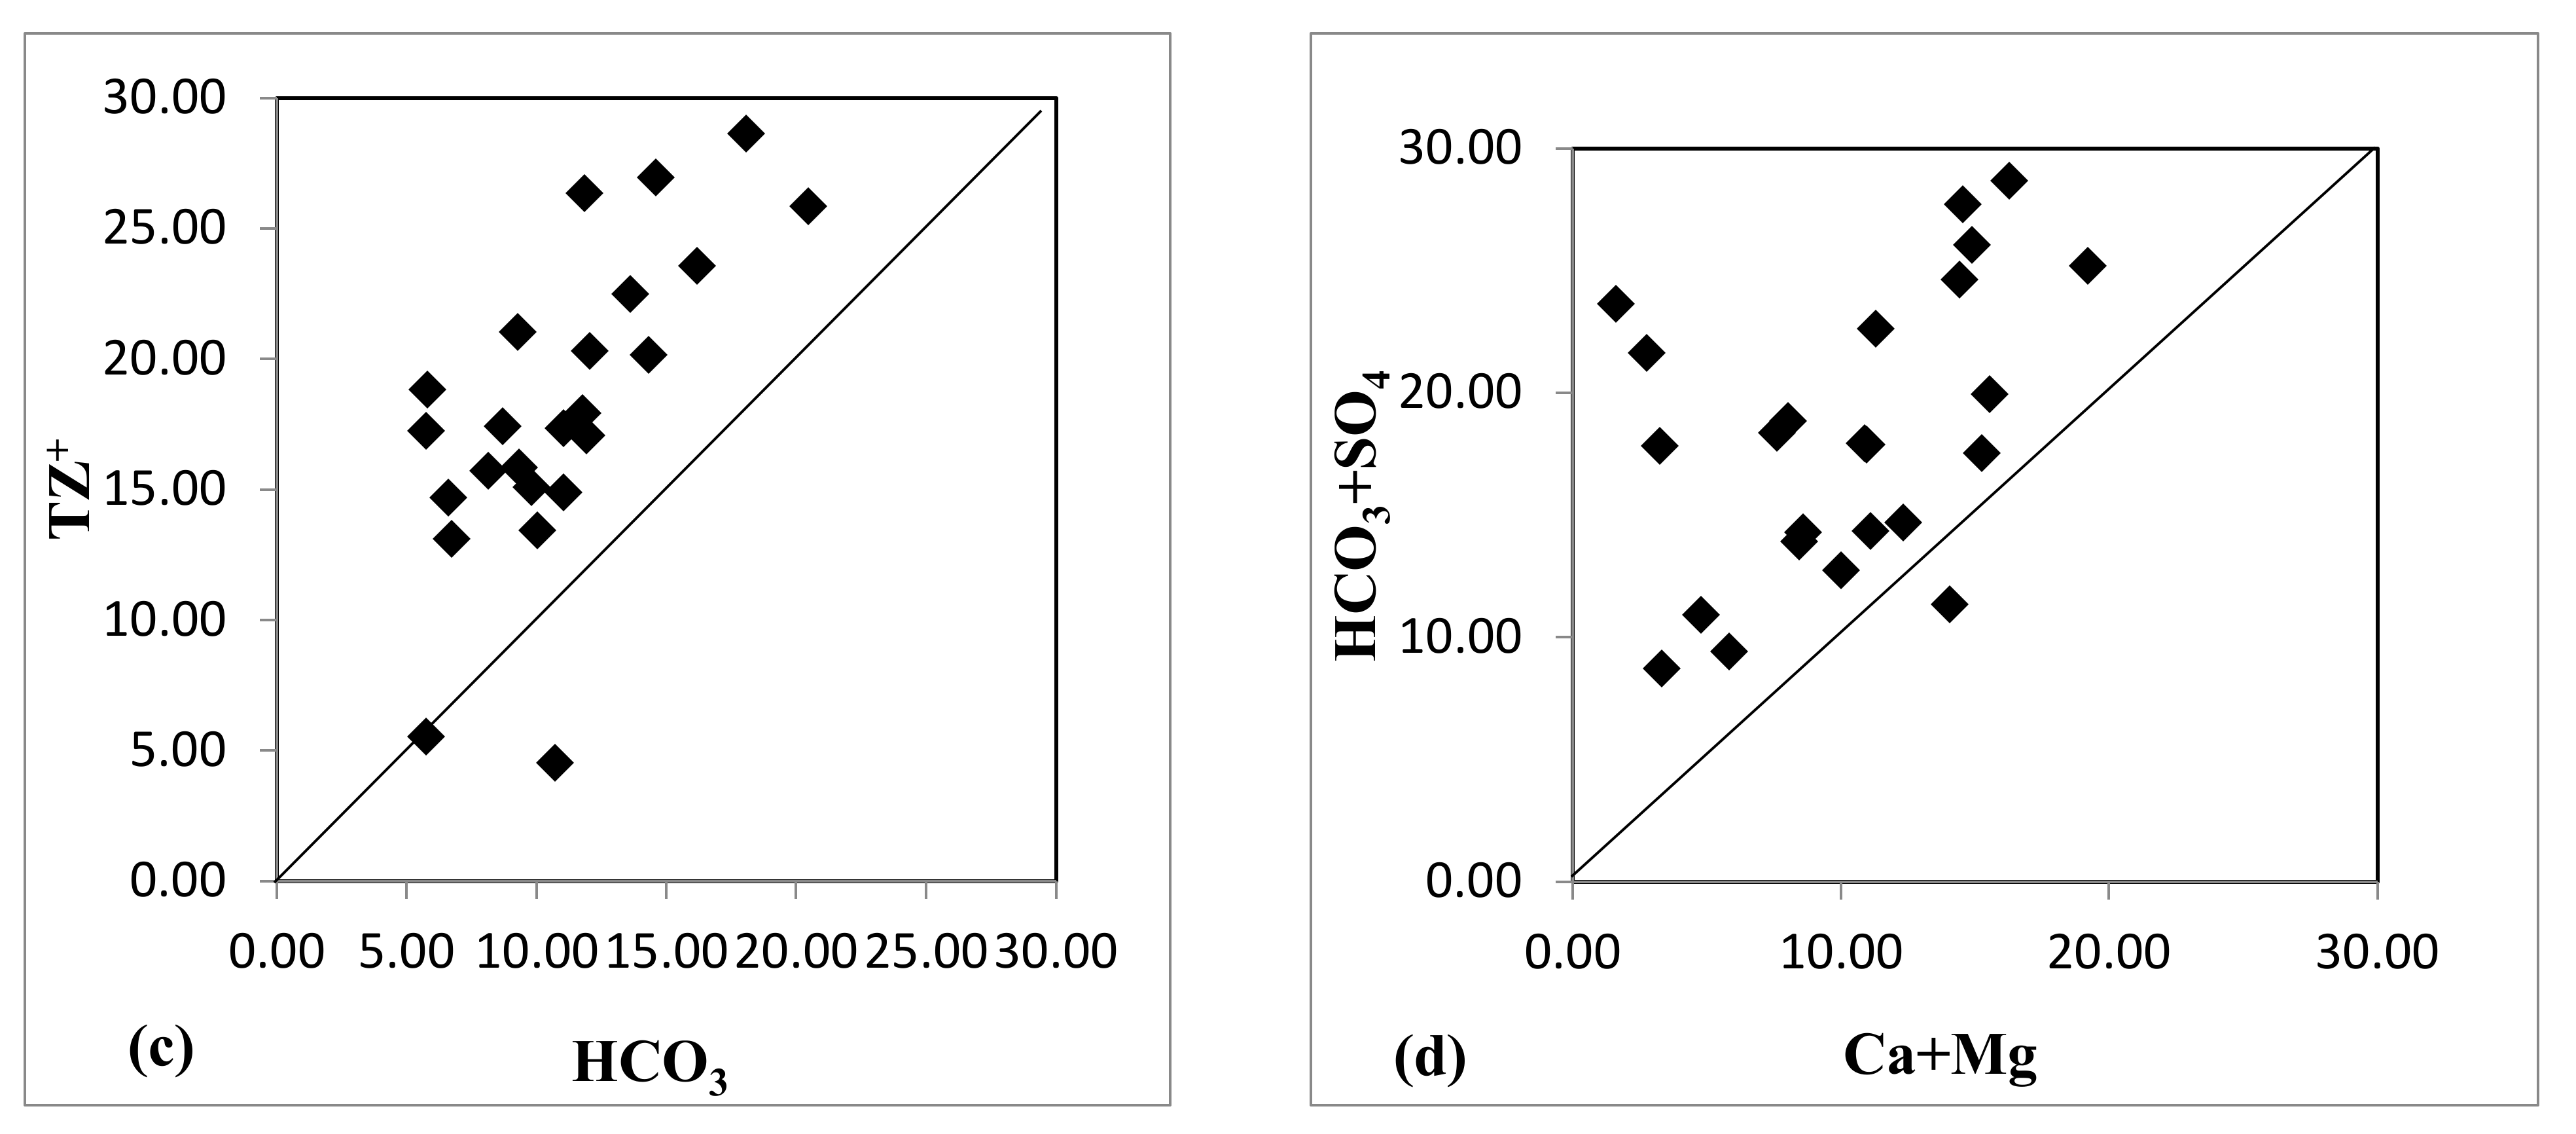
3.2. Hydro-Geochemical Facies

The term hydro-chemical facies refers to the volume of the chemical composition of groundwater changes based on factors such as solution kinetics, rock weathering, rock–water interaction, and pollution sources [46]. Piper [47] proposed a method for comparing and classifying water types based on their ionic composition by laying out the chemical information on a trilinear diagram (Figure 3). Furthermore, Durov’s [48] diagram and trilinear diagram were also used to understand the hydrochemical facies of groundwater.
Lithology, groundwater flow velocity and quality, geochemical reaction type, salt solubility, and human activities all influence the concentrations of dissolved ions in groundwater samples. The dominant water types showed the order of combined Ca-Mg-Cl > Ca-Cl > Ca-HCO3. The piper plot showed the cations and anions to identify the major types of facies, such that Ca-Mg-HCO3 and Na-K-Cl-SO4 types of facies dominated, while mixed Ca-Mg-Cl and Na-K-HCO3, as shown in Figure 3. The source of surface water pollutants, including solid and liquid waste evacuated into the adjacent land and channel, household wastes, septic system toxic waste, and irrigation return flow, are mixed with existing water before the ion exchange process is carried out, indicating the mixing of high salinity water. On the other hand, Ca-HCO3 and Ca-Cl water types indicated mineral dissolution, water–rock interaction, and the recharge of freshwater.
The Gibbs diagram [49] is typically used to evaluate the relations between water composition and its associated aquifer characteristics, such as precipitation dominance (chemistry of precipitated water), rock–water interaction, and evaporation dominance (evaporation rates) for groundwater chemistry. Furthermore, the Gibbs diagram is also used to investigate the sources of dissolved mineral content in groundwater [49]. This study showed that a majority of the samples, regardless of formation, fell into evaporation dominance due to causes of surface pollution sources and semi-arid environmental climate conditions. Moreover, primarily, a high use of fertilizers, irrigation return flow, domestic discharges, and industrial outflows may also be the associated factors that ultimately lead to increased salinity with Cl and Na+ because of the evaporation process. Groundwater samples in Aligarh show that hydrochemistry was dominated by the evaporation process based on Gibbs ratios I and II of the study areas (Table 3), ranging from 0.08 to 0.71, with an average of 0.32 and 0.09 to 0.96 of 0.48, respectively, as discussed in Figure 4. The few samples falling outside the plot were caused by different sources related to anthropogenic activities, which may explain the similar samples.
The Durov diagram illustrates several geochemical processes that may have an impact on water origin and is used to demonstrate the data, as shown in Figure 5. Table 3 of water categorization and geochemical processes reveals the groundwater samples that generally occurred in two zones (2) and (5). Whereas Ca and HCO3 ions predominate in zone (2) with an expected association with dolomite, a critical exchange is assumed if Mg is present. However, if Na is present, a critical exchange is presumed. In addition, simple dissolution or mixing occurs in water in this zone (5), with no dominant anion or cation.
Chloro-alkaline indices (CA-I and CA-II), also known as the Base Exchange index, validate the exchange of ions among groundwater and the environment by residence or travel, as expressed in Equations (5) and (6). It is essential to understand the origins of groundwater by examining the interactions between groundwater and aquifer minerals. Using the hydro-geochemical data, the present study determined the hydro-geochemical activities in the aquifer system. During the residence time or transport process of water, ion exchange reactions between the exchanger of aquifer materials (typically clay minerals) and the groundwater are expected to alter the concentration of pre-existing dissolved solids derived from one or more solute acquisition processes (prominent among them being rock weathering). Reverse cation and anion exchange processes (chloro-alkaline disequilibrium) and direct cation exchange (Base Exchange) are indicated by CAI-I and CAI-II having positive and negative values, respectively.
CA(I) = Cl -(Na+ + K+)/Cl
CA(II) =Cl -(Na+ + K+)/(SO42− + HCO3 +CO32− +NO3)
In the study area, the value of CAI-I varies from −2.75 to 13.15, with a mean value of 3.62 whereas CAI-II ranges from 0.81 to 13.51 with a mean of 4.98, which signifies that both CAI-I and CAI-II are positive in the maximum number of samples and indicate an exchange of Na+ and K+ ions from the water with Mg2+ and Ca2+ of the soil/rocks in maximum water samples. However, in some samples, CAI-I was negative, revealing the exchange of Mg2+ and Ca2+ of the water with Na+ and K+ of the rocks (Table 3).
The scatter plot (Figure 6a) of Ca2+ versus Na+ shows that most samples below the 1:1 line indicate the ion exchange process, which increases the calcium ions in the groundwater. However, a few samples had an excess of sodium ions, which indicates an anthropogenic source. The ratio (Table 3) of Na+/Cl varies from 0.12 to 3.72 with a mean value of 1.64; about 73% of the sample has the value of Na+/Cl >1, which indicates no halite’s source and release of Na ions from saline soil, weathering, or might be an anthropogenic source, and the remaining sample have Na+/Cl < 1 suggesting that the ion exchange process (Figure 6b). The ratio (Figure 6c) of HCO3/Tz+ > 1 is 93% of the sample, and the scatter plot between HCO3 versus Tz + falls above the 1:1 line, which signifies that the influence of anthropogenic sources acting in the study as a secondary source after the evaporation process acts as a primary source of ions in the groundwater. The plot (Figure 6d) of Ca2+ + Mg2+ versus HCO3 + SO42− shows that most of the sample is over HCO3+ SO42− ions than Ca2+ +Mg2+ signifies ion exchange process, while sample below the 1:1 line indicates reverse ion exchange process.

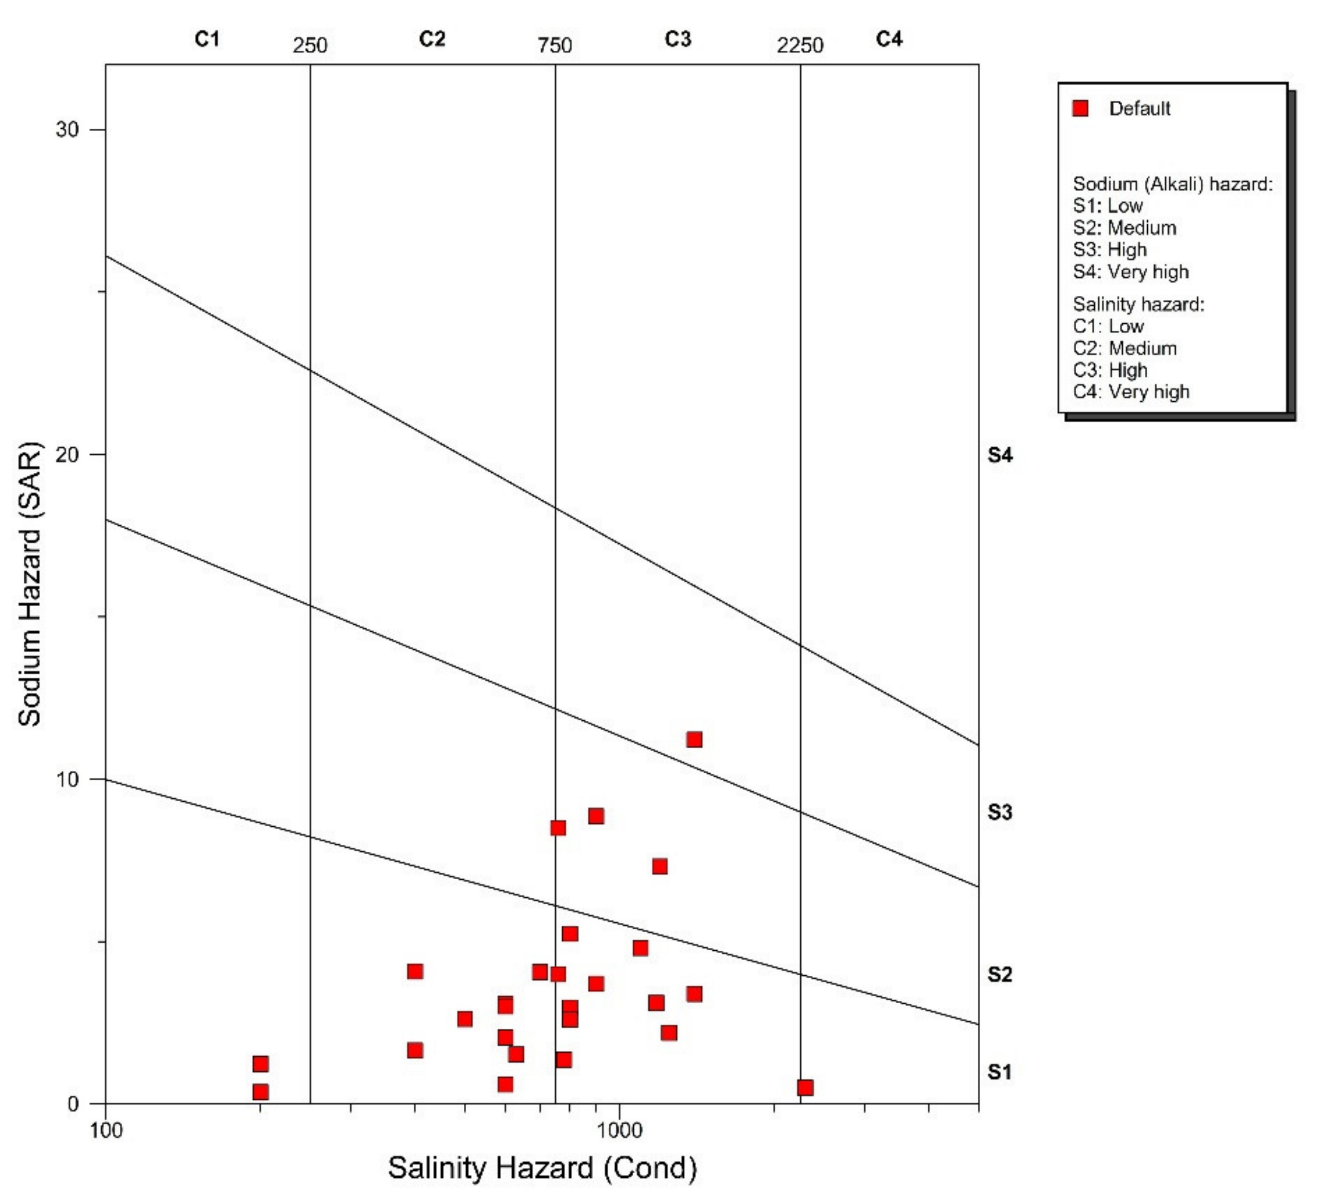
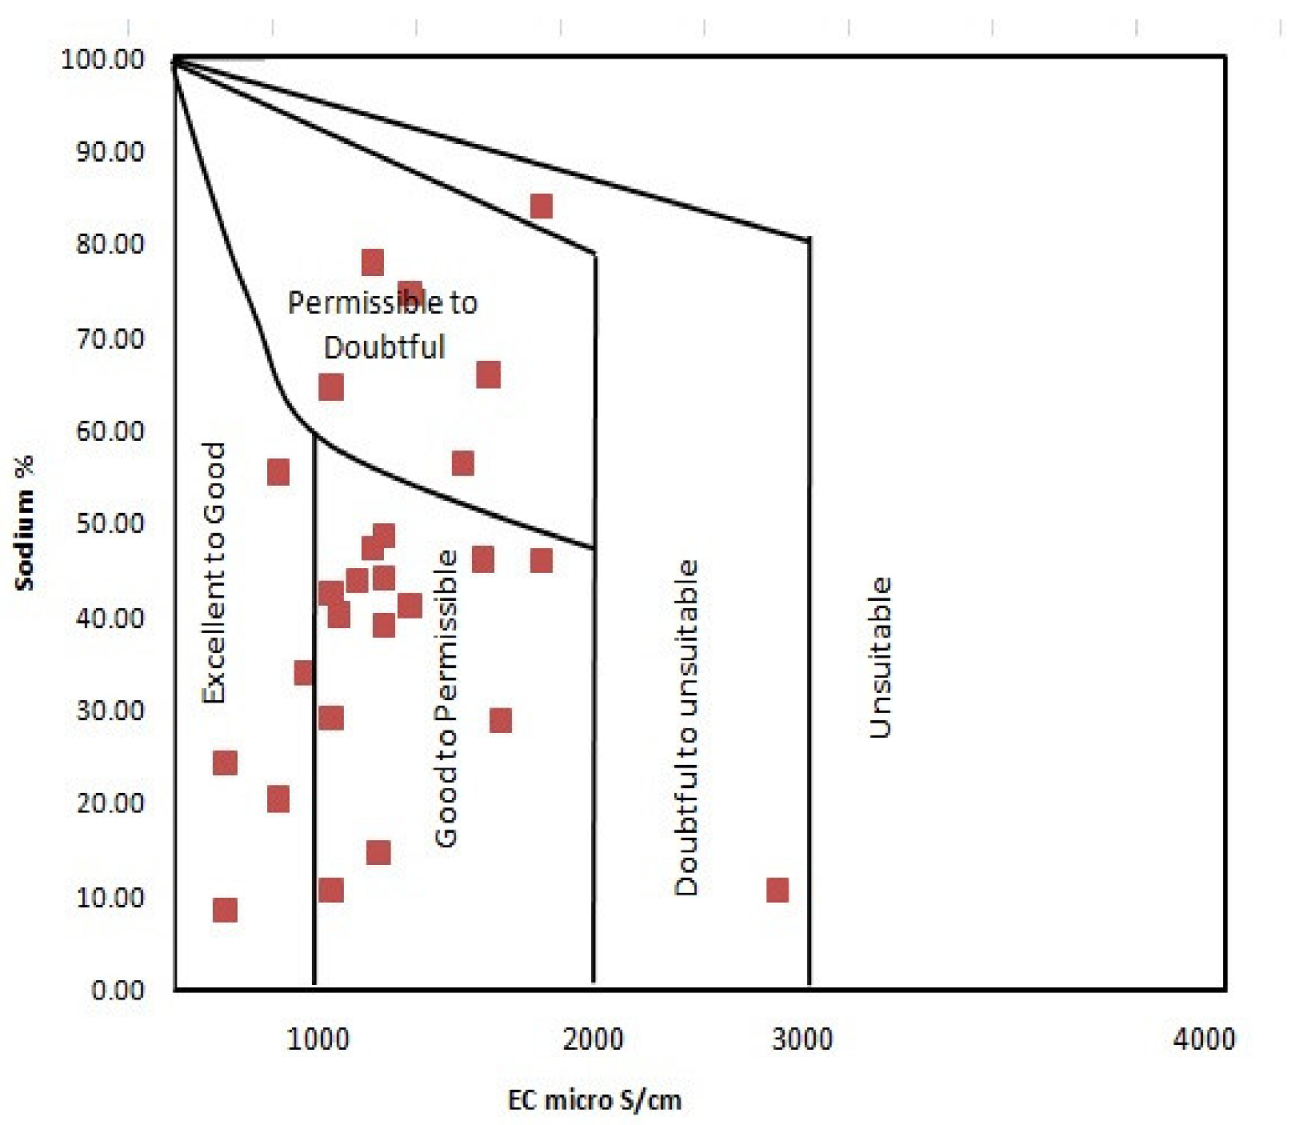
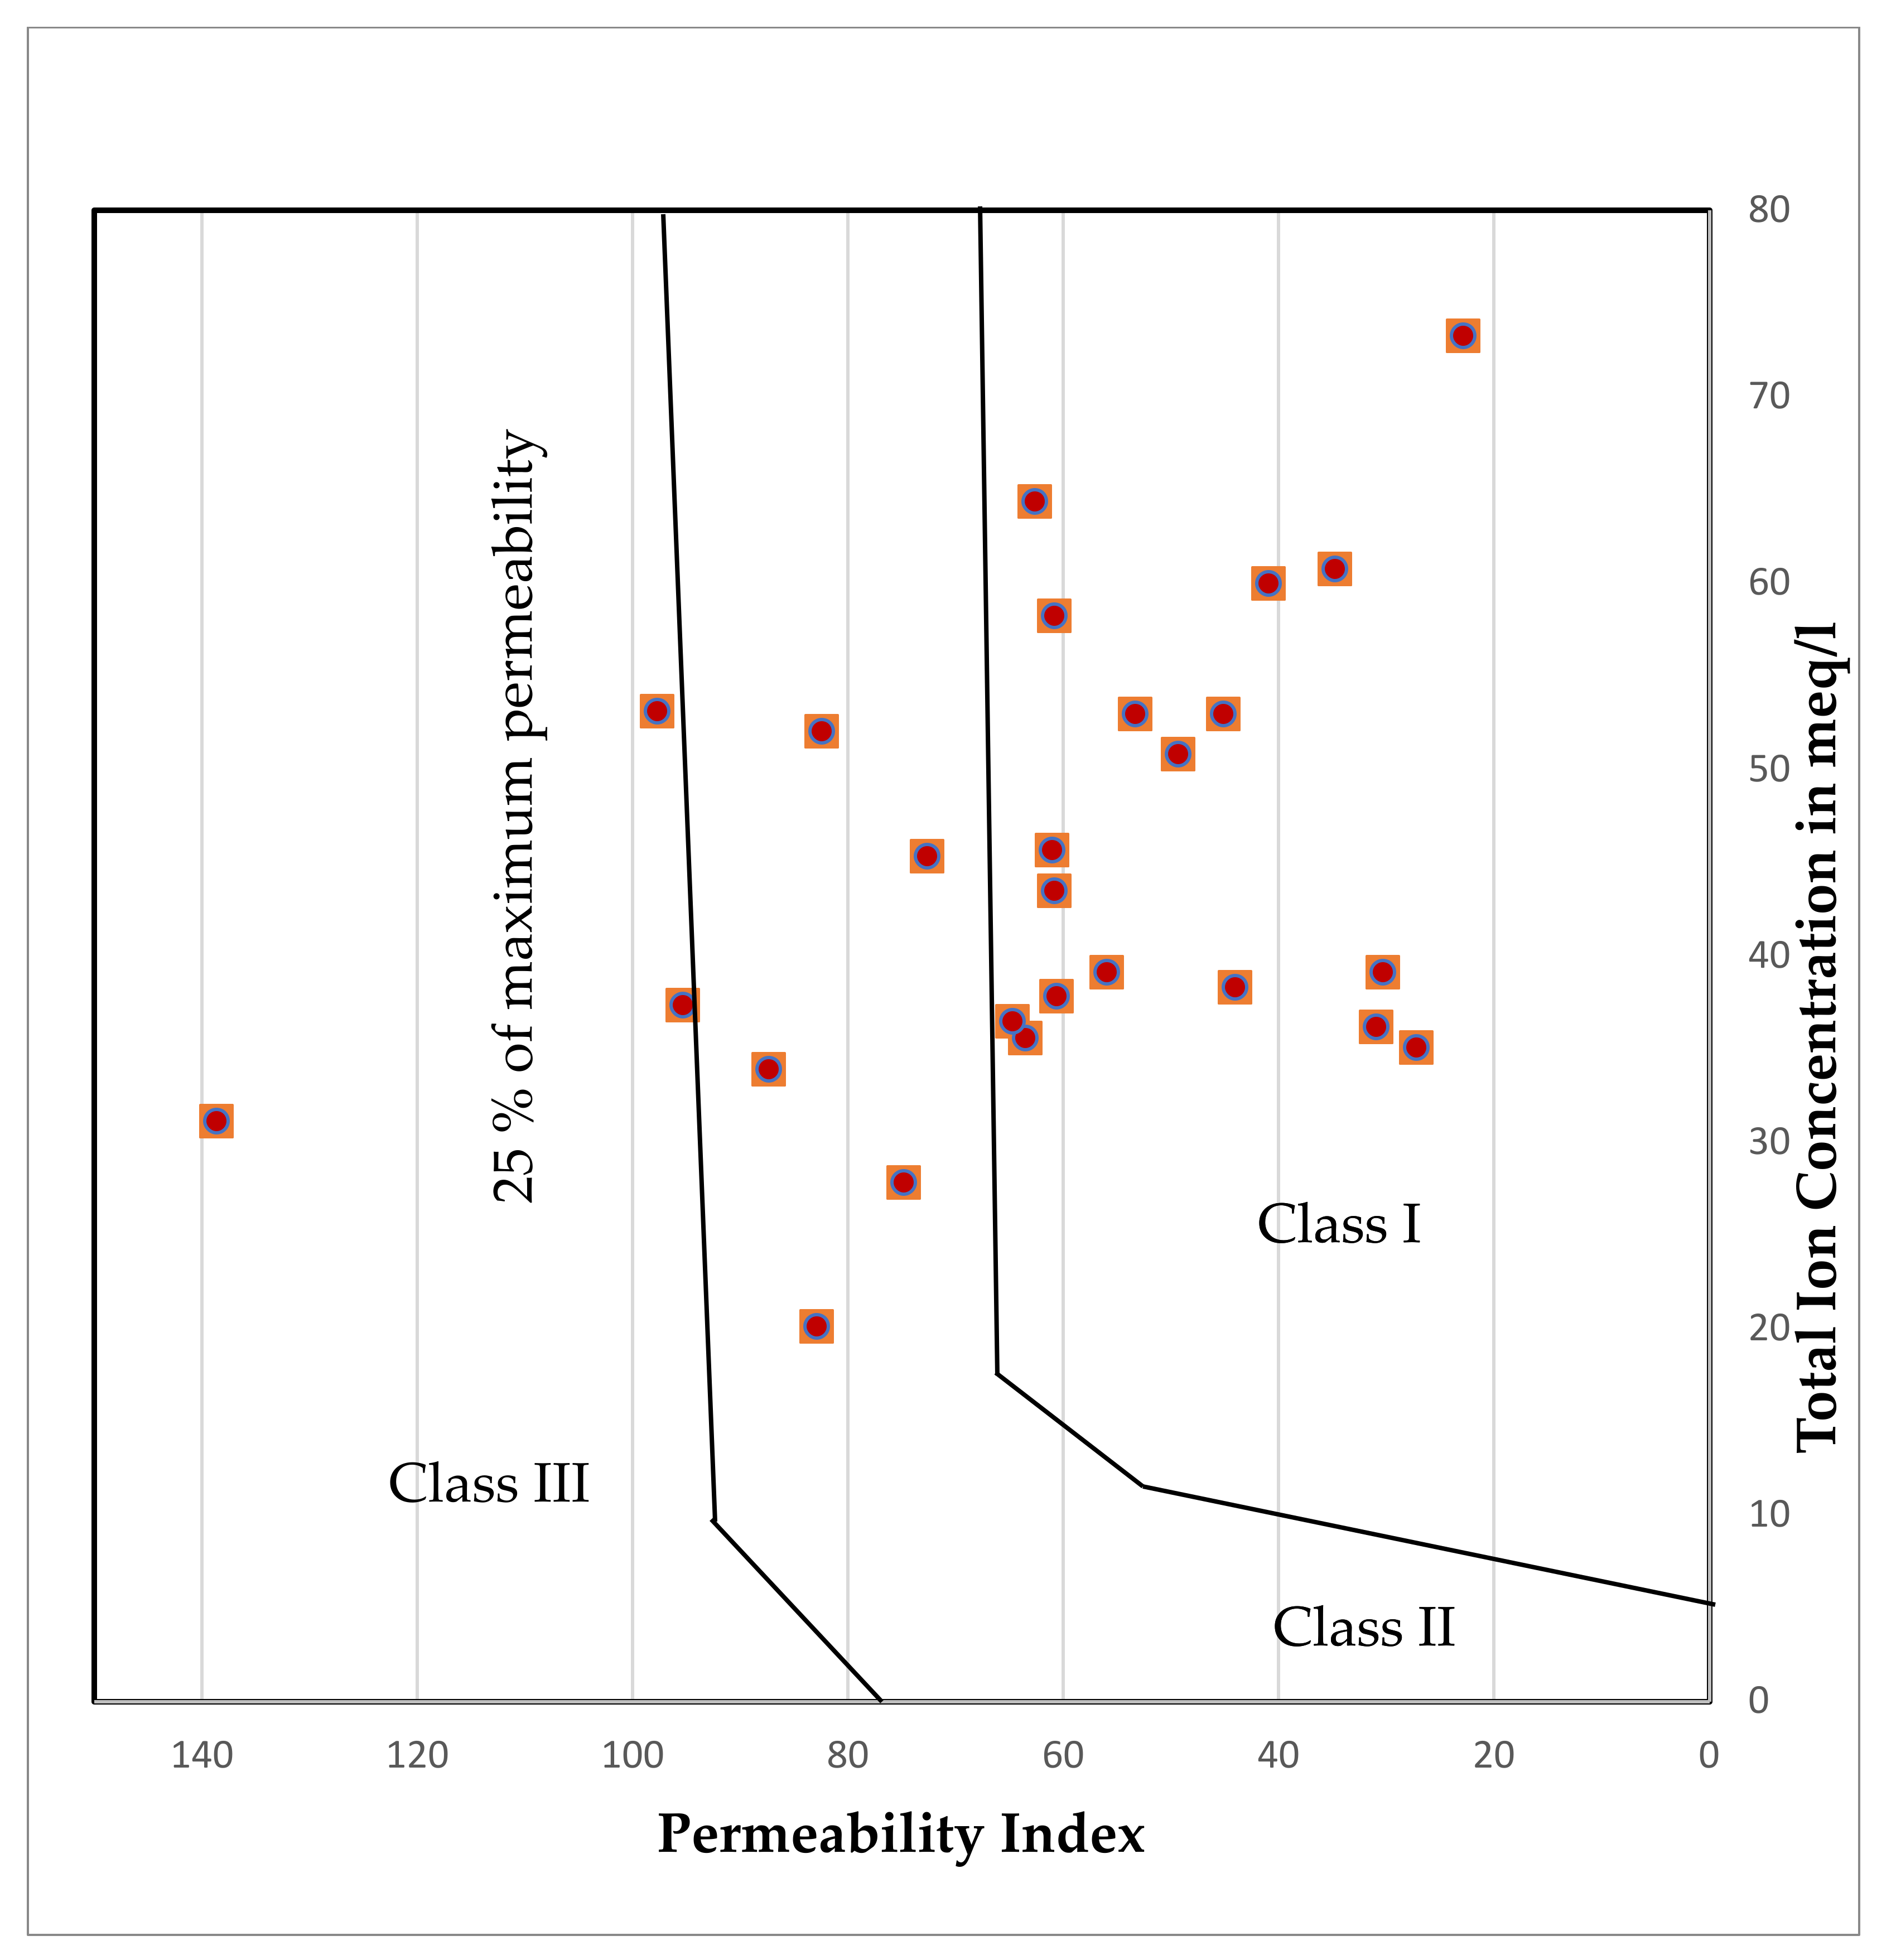
3.3. Groundwater Suitability for Irrigation

Large amounts of dissolved salts in irrigation water can modify osmotic pressures in the root zone, which in turn affect crops chemically and physically, resulting in a decrease in yields and hindering the growth of plants. Successful irrigation projects are not only dependent on the irrigation water supply to the land, and thus target regulating the dissolved substances and alkali of the soil. SAR is used for the management of sodium-affected soils and is an indicator of the suitability of water for agricultural purposes. In the study area, the value of SAR ranges from 0.37 to 11.21, with an average value of 3.62. Most samples in the study area were excellent for irrigation, as shown in Table 3. Consequently, the strategies of the United States Salinity Laboratory (USSL) and Wilcox diagrams were used to characterize and comprehend groundwater properties because the suitability of agriculture varies based on the mineralization of water and its influence on plants and soil. The relationship between SAR and EC is shown in the USSL diagram (Figure 7).
However, C3S1 type plots have shown 10 samples, indicating the increasing salinity and low sodium hazard. Further, C2S1 plots were observed in 9 samples indicating moderate salinity and low sodium hazard, and C1S1 obtained 2 samples showing low salinity and sodium hazard. In addition, C4S1 revealed one sample that exhibited very high salinity and low sodium hazard, and these types of groundwater can be used for irrigation, provided the salinity is preserved under control. Moreover, C3S2 was found in 3 samples showing high salinity and moderate sodium hazard, as well as one sample representing the high salinity and sodium hazard in C3S3. An elevated amount of sodium and salinity is severe for irrigation because sodium is a detrimental substance and greatly influences soil conditions [50]. Water with a high concentration of salts can change the osmotic pressure in the roots, reducing the quantities of water that plants can absorb and thus slow their growth [51]. Furthermore, the quality of water is affected by the existence of black cotton soil and kankar in rocky areas. Up to 12 m down, there is a recognizable lack of quality in the highly weathered zone.
The percent sodium (Na%) method introduced by Richards (1954) and L.V Wilcox (1958) was used to describe and comprehend the major chemical characteristics of groundwater, as its suitability for irrigation is dependent on water mineralization and its impact on plants and soil. Excess sodium in water produces unfortunate impacts from changing soil properties. When sodium-rich irrigation water is used, the clay particles absorb Na+ in the soil and remove the Mg2+ and Ca2+ ions from the lattice. Furthermore, this substitution of Na+ for Ca2+ and Mg2+ in soil from water can influence permeability and decrease internal drainage within the soil [52]. As a result, air and water movement are restricted in wet conditions, and such soils become hard when dry. The chemical quality of groundwater samples was studied from plots of EC plotted against the percentage of Na on the Wilcox diagram (Figure 8). The Wilcox diagram illustrates that 2 groundwater samples were not suitable, and the rest of the samples can be used for irrigation.
The permeability index (PI) was proposed by Doneen (1964) and is a significant characteristic of groundwater regarding soil for agricultural improvement. Class I water is suitable for irrigation, and soil demonstrates 100 percent of the most extreme permeability. Water classified as class II is ideal for agriculture and contains 75% of the maximum permeability of the soil, whereas water classified as class III is unacceptable for irrigation and contains only 25% of the maximum permeability. According to the PI, sixteen samples are of good quality for irrigation and will not affect soil permeability. Moreover, nine water samples are suitable for irrigation, whereas one is not, as illustrated in Figure 9.
Potential salinity was computed as the total chloride and sulfate concentrations. This clarified that dissolvable salts do not affect the quality of water for irrigation. The low dissolvability salts precipitate in the soil and combine with the highly soluble salts in subsequent irrigations, increasing soil salinity. Salinity potential ranges from 1.02 to 14.21 meqL−1 with an average of 5.50 meqL−1. Three classifications of salinity were established for groundwater samples (Table 3). It concludes that the potential salinity of the groundwater in the examined area is nearly excessive, rendering the water unsuitable for irrigation. The study region’s high potential salinity value was due to the high sulfate and chloride content produced from an anthropogenic source.
Kelly (1940) is the ratio of sodium ions to calcium and magnesium ions in meq/L which is used to determine the hazardous effect of sodium on water quality. If irrigation water contains a high concentration of Na+, then clay particles absorb Na+ displacing Mg2+ and Ca2+ ions. This exchange process can reduce the permeability of the soil and ultimately affect internal drainage [53]. According to the Kelly ratio, less than one value is suitable for irrigation, while those with a ratio of more than one are unsuitable. In the present study, Kelly’s ratio varied from 0.07 to 4.77, with an average value of 1.01. Further, only 7 water samples are unsuitable for irrigation with more than one Kelly ratio (Table 3).
Residual Sodium Carbonate (RSC) was introduced by Eaton [54] and was measured to determine the issues associated with carbonate and bicarbonate on the quality of groundwater used for agricultural and irrigation applications. Lloyd & Heathcote [55] developed a classification system for agricultural water based on RSC values. The significant concentrations of HCO3 and CO32− in groundwater demonstrate their ability to coagulate when combined with Ca2+ and Mg2+ ions. High RSC values lead to high pH and contribute to the infertility of irrigation land by deposition of sodium carbonate, as shown by the soil’s black color [56]. According to this classification, water samples with an RSC value of less than 1.25 are suitable for irrigation, whereas water with an RSC value of up to 2.5 is moderately suitable, and water with an RSC value of greater than 2.5 is unsuitable (Table 1). RSC values ranged from −21.54 to 9.97 throughout the study region, with an average of 0.10 meqL−1 (Table 3).

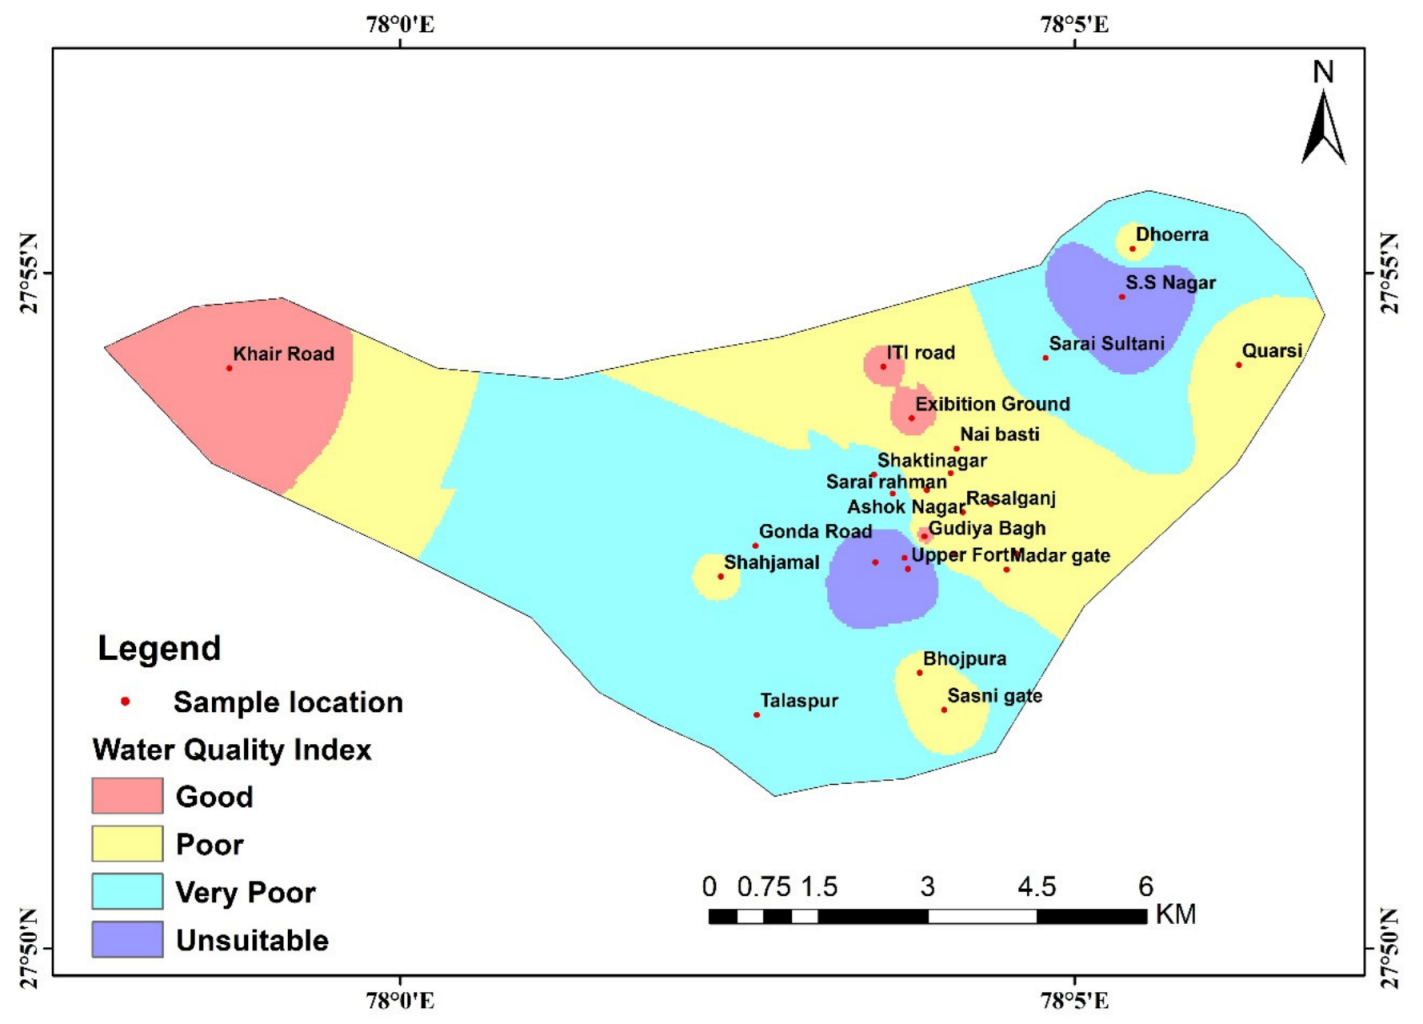
3.4. Water Quality Index (WQI)

The WQI method was used in three stages and determined the water quality status in the study area. In the initial step, every one of the 11 parameters (pH, EC, TDS, HCO3, Cl, SO4, NO3, F, Ca, Mg, Na, and K) was assigned a weight (wi) as per its relative significance in the overall quality of water for drinking and domestic and irrigation purposes (Table 1). The rating scales were fixed regarding perfect estimations of various physicochemical parameters based on their importance. For ascertaining the WQI, the following four equations were used. The spatial distribution map of the WQI was prepared to classify and provide a sound explanation of water quality in the study region (Figure 10). Based on the calculation, the WQI of the study area was calculated, and it was found that the maximum samples exhibited poor quality in the study area. The patches of pink color found in the western part and some minor patches near the northern region showed good quality water.
The open area has better water quality than the closed areas due to infiltration, less runoff, and higher microbial activity that captures contaminants [57]. The light-yellow color patch shows the poor quality of the region, which covers the eastern part, with some small patches found in the central and western parts. The patch covered the central part and moved toward the northwestern region, and the second patch covered the north-eastern part, denoted by a light blue color covering most of the study area. These areas were highly affected and had very poor quality. The purple color indicates the water lying in the category of unsuitable for drinking. Small regions of the central part and a major patch in the northern part are classified, thus warning of bad water quality. Overall, the WQI of the study area suggested that 15% sample was unsuitable, 69% was poor, and the remaining was suitable for drinking purposes. The poor quality of drinking water due to the locked food processing industry and illegal factories running in the houses in the varsity of old Aligarh city create significant groundwater quality problems [13,58]

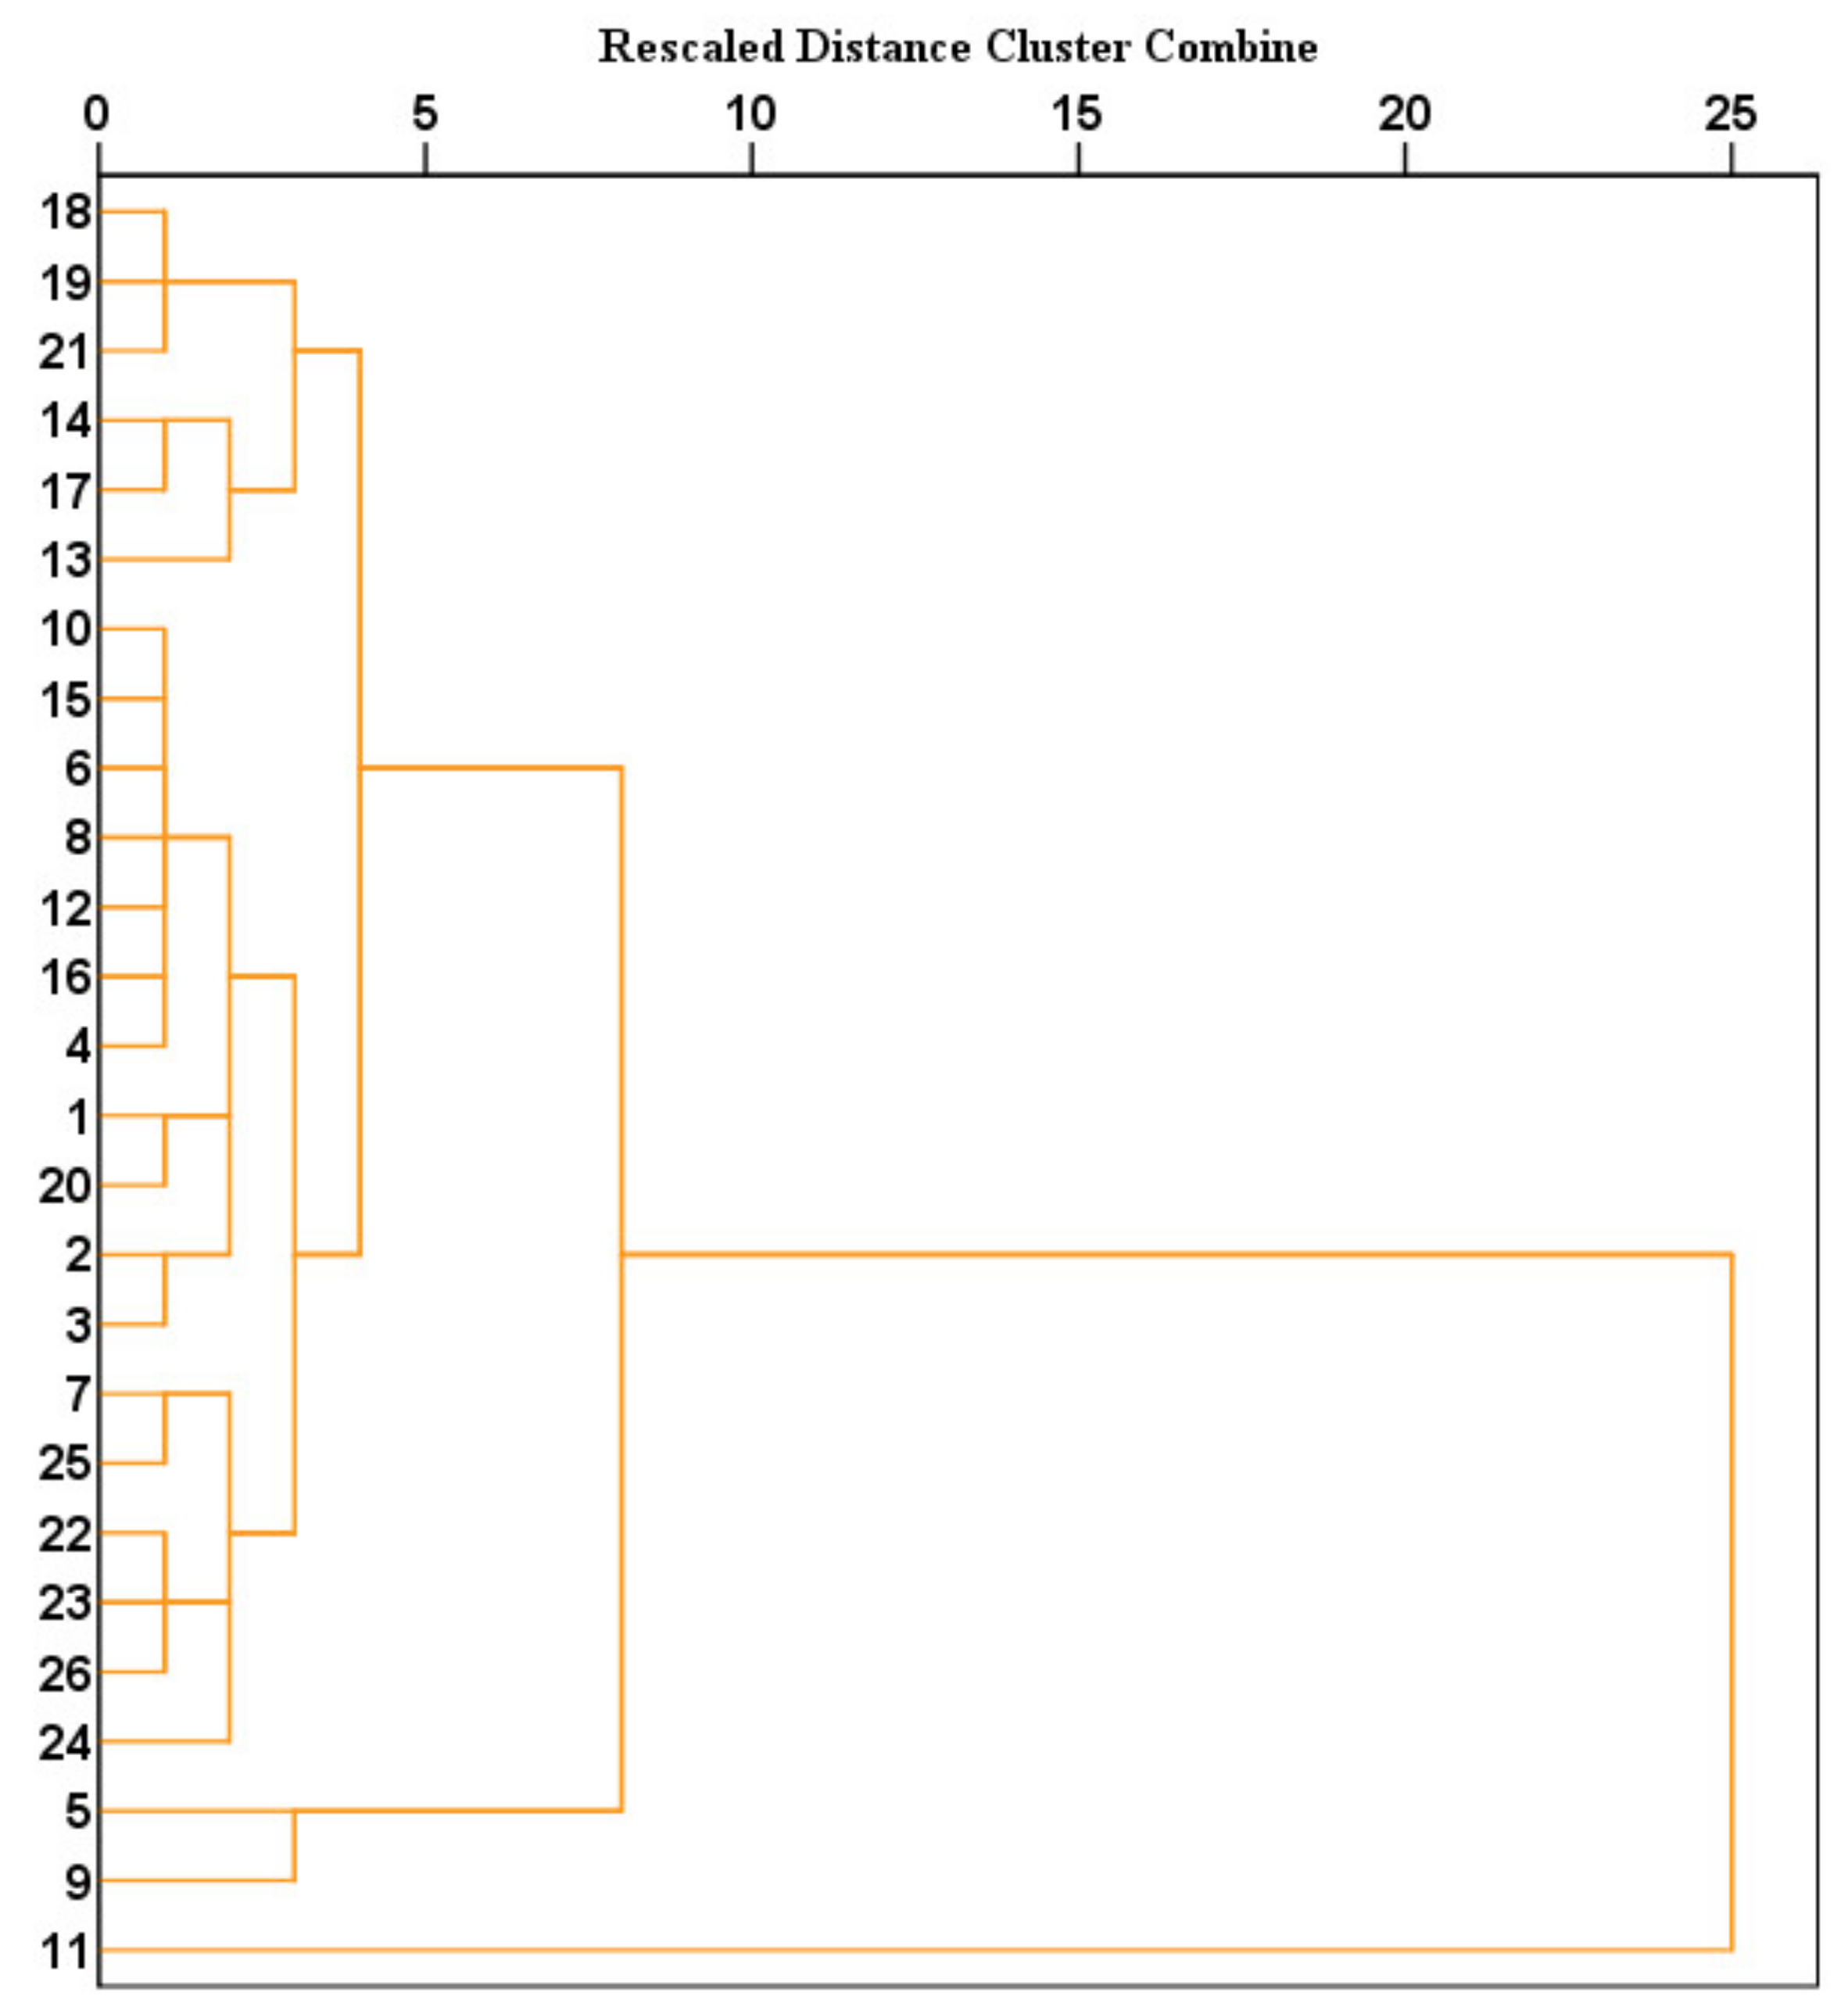
3.5. Multivariate Statistical Techniques

Pearson correlation analysis, PCA, and HCA were widely applied in this research on water quality data to extract relevant information. Pearson correlation analysis between groundwater samples was calculated and shows the results of the correlation coefficient calculations (Table 4). This component demonstrates that EC has a strong positive association with TDS. In addition, the component demonstrates that the concentrations of EC and TDS have a strong positive association with nitrates, revealing that these ions predominantly originate from the source of a significant number of organic fertilizers that are utilized in agriculture [59]. Furthermore, Ca exhibits a moderately positive connection with K, and both Ca and Mg have been demonstrated to reflect a correlation with HCO3, signifying that these ions are primarily sourced from sources of domestic discharges and industrial effluents [60]. As a result of the negative correlation resulting from many sources, such as geological and human activities, several parameters have been discovered.
The PCA findings encompassing the loadings, Eigenvalues, and % of total variance have been mentioned in Table 5. PCA detects relationships and minimizes the number of data into components that describe a percentage of the overall variation between physicochemical characteristics. The five factors explained 76.66% of the variance accounted for in the log-transformed dataset. The observed variance is mostly influenced by the chemical characteristics loadings generally categorized as strong (>0.75), moderate (0.75 to 0.50), and weak (0.50 to 0.30). PCA 1 accounted for 24.88 of the total variances and contained substantial strong positive loadings, including EC and TDS. These components were estimated to be associated with evaporation and human activity sources from untreated wastewater. Further, the other major process is considered agricultural practices due to the presence of moderate loadings, such as pH, TH, NO3, and Cl, in this component. Consequently, the increasing amounts of NO3 may be produced from local sanitation, and municipal wastes and associated with nutrient pollution due to the untreated urban setting and adjacent agriculture methods for many years [3]. PCA 2 accounted for 19.06% of the total variance and revealed that the sources of Ca, Mg, and HCO3 may be attributed to the breakdown of calcium and gypsum types of minerals. PCA 3 explains 14.34% of the variability and is highly connected with moderate positive loading K and Na and with other variables that have low negative loadings. It can be attributed to chemical weathering, leaching, and dissolution of secondary salts in the pore spaces, agriculture effluents, and the usual sinks are plants and clays [61]. PCA 4 accounted for 10.63% of the total variance and revealed moderate positive loading of TH and CO3, as well as high negative scores, reflecting areas essentially unaffected by the procedure. Finally, PCA 5 accounted for 7.74% of the total variance and showed a moderate positive loading of CO3, and others were negative, demonstrating the natural and human activities.
The HCA method is used to group samples collected that emerged from distinct monitoring stations based on their chemical composition (Figure 11). For this study, a dendrogram graph was created using Ward’s approach for combining the 26 sampling locations through what was identified as cluster 5, as shown in Figure 11. According to HCA findings, cluster I (sites 11), cluster II (5 and 9), cluster III (7, 25, 23, 26, and 24), cluster IV (3, 2, 20, 1, 4, 16, 12, 8, 6, 15, and 10), and cluster V (13, 17, 14, 21, 19, and 18) relate to the very highly polluted province, the heavily polluted areas, the moderate pollution, and the low polluted region [62]. The outcomes of the water quality analysis revealed that most of the samples categorized as Cluster I possessed exceptionally high pH, TDS, NO3 and EC levels of other physicochemical characteristics that increased the allowable levels for potable water and agricultural utilizes, showing high susceptibility to contamination caused by industrial, domestic, and high population actions [63]. It was found that Cluster II had the highest average values of TDS and NO3 which were attributed to the extreme utilization of fertilizers and pesticides in farming, which also contributed to the enrichment of nitrate in groundwater in particular places. Cluster III revealed moderate pollution, which is nearly identical to Cluster II, but it is related to it at a shorter distance. Cluster III and Cluster IV are linked to each other and indicate the naturally occurring chemicals containing sulfate originating from industrial effluents and sulfate fertilizers. Cluster V samples show a low pollution load in the study area from domestic effluents [64].

4. Conclusions

Groundwater quality and pollution sources were investigated using a combination of hydrochemical characterization and multivariate statistical approaches in this study. Physical and chemical findings revealed that groundwater is generally alkaline, moderately saline, and extremely hard. The hydrochemical results revealed drastically increased salinity; nitrate, and sulfate are the major contaminants threatening the drinking and irrigation water sources that are mostly produced by anthropogenic activities, including domestic sewage and excessive use of agricultural fertilizers. The major dominant mean concentrations for cations are Ca2+ > Na+ > Mg2+ > K+ while anions are HCO3 > SO42− > Cl > NO3 > CO32− > F.
The hydrochemical models indicated groundwater may pose a high to very high salinity and medium alkalinity threat when used for irrigation. The mixing of saline water induced by surface contamination with existing water and the decomposition of rock-forming minerals are the primary factors influencing water chemistry. The PCA and HCA results indicated that anthropogenic contaminants and the combination of natural solubility materials accounted for most of the variation. Anthropogenic stress is an important consideration in water resource management in the Aligarh area, and the findings of this study can help in the better management of groundwater for its quality and quantity.

Author Contributions

Conceptualization: S.A.; Methodology: S.A. and M.M.; Validation, formal analysis, and investigation: F.Q. and N.A.; Original draft preparation: S.A., N.A. and S.L.; Extensive review and editing: S.L. All authors have read and agreed to the published version of the manuscript.

Funding

This research received no external funding.

Data Availability Statement

Not applicable.

Acknowledgments

We are grateful to the Chairman of the Department of Geology, Aligarh Muslim University, Aligarh, for providing essential scientific facilities. Also thankful to the anonymous reviewers for their suggestions which helps to improve the quality of the manuscript.

Conflicts of Interest

The authors declare that they have no known competing financial interests or personal relationships that could have appeared to influence the work reported in this paper.

References

  1. Ahmed, S.; Khurshid, S.; Madan, R.; Abu Amarah, B.A.; Naushad, M. Water quality assessment of shallow aquifer based on Canadian Council of Ministers of the environment index and its impact on irrigation of Mathura District, Uttar Pradesh. J. King Saud Univ.-Sci. 2020, 32, 1218–1225. [Google Scholar] [CrossRef]
  2. Akhtar, N.; Ishak, M.; Ahmad, M.; Umar, K.; Yusuff, M.M.; Anees, M.; Qadir, A.; Almanasir, Y.A. Modification of the Water Quality Index (WQI) Process for Simple Calculation Using the Multi-Criteria Decision-Making (MCDM) Method: A Review. Water 2021, 13, 905. [Google Scholar] [CrossRef]
  3. Surinaidu, L.; Nandan, M.; Kumar, K.M.; Prasad, R. Hydrogeochemical processes and causative pollution sources in the highly urbanized crystalline aquifer system in Southern India. Geosyst. Geoenviron. 2022, 1, 100064. [Google Scholar] [CrossRef]
  4. Bharti, N.; Katyal, D. Water Quality Indices Used for Surface Water Vulnerability Assessment. Int. J. Environ. Sci. 2011, 2, 154–173. [Google Scholar]
  5. Umar, R.; Alam, F. Assessment of hydrogeochemical characteristics of groundwater in parts of Hindon–Yamuna interfluve region, Baghpat District, Western Uttar Pradesh. Environ. Monit. Assess. 2012, 184, 2321–2336. [Google Scholar] [CrossRef]
  6. Chandrasekar, N.; Selvakumar, S.; Srinivas, Y.; Wilson, J.S.J.; Peter, T.S.; Magesh, N.S. Hydrogeochemical assessment of groundwater quality along the coastal aquifers of southern Tamil Nadu, India. Environ. Earth Sci. 2014, 71, 4739–4750. [Google Scholar] [CrossRef]
  7. Brigg, D.J. A framework for integrated environmental health impact assessment of systemic risks. A review. Environ. Health. 2008, 7, 61–78. [Google Scholar] [CrossRef] [Green Version]
  8. Surinaidu, L.; Amarasinghe, U.; Maheswaran, R.; Nandan, M.J. Assessment of long-term hydrogeological changes and plausible solutions to manage hydrological extremes in the transnational Ganga river basin. H2Open J. 2020, 3, 457–480. [Google Scholar] [CrossRef]
  9. Patil, V.T.; Patil, P.R. Physicochemical Analysis of Selected Groundwater Samples of Amalner Town in Jalgaon District, Maharashtra, India. J. Chem. 2010, 7, 111–116. [Google Scholar]
  10. Ahmed, S.; Sultan, M.W.; Alam, M.; Hussain, A.; Qureshi, F.; Khurshid, S. Evaluation of corrosive behaviour and scaling potential of shallow water aquifer using corrosion indices and geospatial approaches in regions of the Yamuna river basin. J. King Saud Univ.-Sci. 2021, 33, 101237. [Google Scholar] [CrossRef]
  11. WHO. Guidelines for Drinking Water Quality, 4th ed.; World Health Organization: Geneva, Switzerland, 2017. [Google Scholar]
  12. Kaur, L.; Rishi, M.S.; Singh, G.; Thakur, S.N. Groundwater potential assessment of an alluvial aquifer in Yamuna sub-basin (Panipat region) using remote sensing and GIS techniques in conjunction with analytical hierarchy process (AHP) and catastrophe theory (CT). Ecol. Indic. 2020, 110, 105850. [Google Scholar] [CrossRef]
  13. Haq, S. Ground Water Brochure of Aligarh District. 2013; pp. 1–33. Available online: http://cgwb.gov.in/District_Profile/UP/Aligarh.pdf (accessed on 15 June 2017).
  14. Khan, A.; Umar, R.; Khan, H.H. Hydrochemical characterization of groundwater in lower Kali watershed, Western Uttar Pradesh. J. Geol. Soc. India 2015, 86, 195–210. [Google Scholar] [CrossRef]
  15. Wasim, S.M. Groundwater Quality in Parts of Central Ganga Basin, Aligarh City, Uttar Pradesh, India. Proc. Indian Natl. Sci. Acad. 2014, 80, 123–142. [Google Scholar] [CrossRef]
  16. Singh, C.K.; Kumar, A.; Shashtri, S.; Kumar, A.; Kumar, P.; Mallick, J. Multivariate statistical analysis and geochemical modeling for geochemical assessment of groundwater of Delhi, India. J. Geochem. Explor. 2017, 175, 59–71. [Google Scholar] [CrossRef]
  17. Salifu, A.; Petrusevski, B.; Ghebremichael, K.; Buamah, R.; Amy, G. Multivariate statistical analysis for fluoride occurrence in groundwater in the northern region of Ghana. J. Contam. Hydrol. 2012, 140, 34–44. [Google Scholar] [CrossRef]
  18. Surinaidu, L.; Nandan, M.; Sahadevan, D.; Umamaheswari, A.; Tiwari, V. Source identification and management of perennial contaminated groundwater seepage in the highly industrial watershed, south India. Environ. Pollut. 2021, 269, 116165. [Google Scholar] [CrossRef]
  19. Khan, M.; Khurshid, S. Study of Trace Elements in Ground Water of Aligarh City. Uttar Pradesh 2015, 3, 30–37. [Google Scholar]
  20. Khwaja, M.A.; Bhattacharya, G.S.; Aggarwal, V. Analysis of groundwater quality of Aligarh. Curr. World Environ. 2016, 3, 41–48. [Google Scholar]
  21. Irfan, A.; Khurshid, S. Effect of Water Quality on Human Health in Aligarh City, India. Jour. Integ. Comm. Health 2017, 6, 6–9. [Google Scholar]
  22. Hajji, S.; Allouche, N.; Bouri, S.; Aljuaid, A.M.; Hachicha, W. Assessment of Seawater Intrusion in Coastal Aquifers Using Multivariate Statistical Analyses and Hydrochemical Facies Evolution-Based Model. Int. J. Environ. Res. Public Health 2022, 19, 155. [Google Scholar] [CrossRef]
  23. Jacintha, T.G.A.; Rawat, K.S.; Mishra, A.; Singh, S.K. Hydrogeochemical characterization of groundwater of peninsular Indian region using multivariate statistical techniques. Appl. Water Sci. 2016, 7, 3001–3013. [Google Scholar] [CrossRef] [Green Version]
  24. Belkhiri, L.; Narany, T.S. Using Multivariate Statistical Analysis, Geostatistical Techniques and Structural Equation Modeling to Identify Spatial Variability of Groundwater Quality. Water Resour. Manag. 2015, 29, 2073–2089. [Google Scholar] [CrossRef]
  25. Machiwal, D.; Cloutier, V.; Güler, C.; Kazakis, N. A review of GIS-integrated statistical techniques for groundwater quality evaluation and protection. Environ. Earth Sci. 2018, 77, 681. [Google Scholar] [CrossRef]
  26. Ahmed, S.; Akhtar, N.; Rahman, A.; Mondal, N.; Khurshid, S.; Sarah, S.; Khan, M.M.A.; Kamboj, V. Evaluating groundwater pollution with emphasizing heavy metal hotspots in an urbanized alluvium watershed of Yamuna River, Northern India. Environ. Nanotechnol. Monit. Manag. 2022, 18, 100744. [Google Scholar] [CrossRef]
  27. Sastri, V.V.; Bhandari, L.L.; Raju, A.T.R.; Datta, A.K. Tectonic framework and subsurface stratigraphy of the Ganga basin. Geol. Soc. India 1971, 12, 222–233. [Google Scholar]
  28. American Public Health Association (APHA). Standard Methods: For the Examination of Water and Waste Water. Anal. Biochem. 1990, 186, 183. [Google Scholar] [CrossRef]
  29. Hem, J.D. Study and Interpretation of the Chemical Characteristics of Natural Water; United States Geological Survey Water Supply Paper 2254; Scientific Publishers: New Delhi, India, 1991. [Google Scholar]
  30. Bureau of Indian Standards; Publication Unit, BIS: New Delhi, India, 2012.
  31. Todd, D.K.; Mays, L.W. Groundwater Hydrology; John Willey Sons: Hoboken, NJ, USA, 1980. [Google Scholar]
  32. Richards, L.A. Diagnosis and Improvement of Saline and Alkaline Soils. Soil Sci. 1954, 65, 432. [Google Scholar] [CrossRef]
  33. Wilcox, L.V. Classification and Use of Irrigation Waters 969; US Department of Agriculture: Washington, DC, USA, 1955. [Google Scholar]
  34. Raghunath, I.I.M. Groundwater, 2nd ed.; Wiley Eastern, Ltd.: New Delhi, India, 1987; pp. 344–369. [Google Scholar]
  35. Doneen, L.D. Water Quality for Agriculture; Department Irrigation University California: Davis, CA, USA, 1964; Volume 48. [Google Scholar]
  36. Kelley, W.P. Permissible Composition and Concentration of Irrigation Water. Proc. ASCF 1940, 607, 607–613. [Google Scholar] [CrossRef]
  37. Gupta, S.K.; Gupta, I.C. Management of Saline Soils and Waters; Oxford and IBM: New Delhi, India, 1997. [Google Scholar]
  38. Ahmed, S.; Khurshid, S.; Sultan, W.; Shadab, M.B. Statistical analysis and water quality index development using GIS of Mathura City, Uttar Pradesh, India. Desalination Water Treat. 2020, 177, 152–166. [Google Scholar] [CrossRef]
  39. Akhtar, N.; Syakir, M.I.; Rai, S.P.; Saini, R.; Pant, N.; Anees, M.T.; Qadir, A.; Khan, U. Multivariate Investigation of Heavy Metals in the Groundwater for Irrigation and Drinking in Garautha Tehsil, Jhansi District, India. Anal. Lett. 2020, 53, 774–794. [Google Scholar] [CrossRef]
  40. Jeevanandam, M.; Kannan, R.; Srinivasalu, S.; Rammohan, V. Hydrogeochemistry and Groundwater Quality Assessment of Lower Part of the Ponnaiyar River Basin, Cuddalore District, South India. Environ. Monit. Assess. 2007, 132, 263–274. [Google Scholar] [CrossRef] [PubMed]
  41. Saha, P.; Paul, B. Assessment of heavy metal toxicity related with human health risk in the surface water of an industrialized area by a novel technique. Hum. Ecol. Risk Assess. 2019, 25, 966–987. [Google Scholar] [CrossRef]
  42. Varol, S.; Davraz, A. Evaluation of the groundwater quality with WQI (Water Quality Index) and multivariate analysis: A case study of the Tefenni plain (Burdur/Turkey). Environ. Earth Sci. 2015, 73, 1725–1744. [Google Scholar] [CrossRef]
  43. Sawyer, C.N.; McCarty, P.L. Chemistry for sanitary engineers. In Chemistry for Sanitary Engineers; McGraw-Hill: New York, NY, USA, 1967. [Google Scholar]
  44. Young, C.P.; Oakes, D.B.; Wilkinson, W.B. Prediction of future nitrate concentrations in ground water. Proc. Natl. Ground Water Qual. Symp. 1974, 1, 70. [Google Scholar]
  45. Yang, C.-Y.; Cheng, M.-F.; Tsai, S.-S.; Hsieh, Y.-L. Calcium, Magnesium, and Nitrate in Drinking Water and Gastric Cancer Mortality. Jpn. J. Cancer Res. 1998, 89, 124–130. [Google Scholar] [CrossRef]
  46. Walton, W.C. Groundwater Resource Evaluation; McGraw-Hill: New York, NY, USA, 1970; 664p. [Google Scholar]
  47. Piper, A.M. A graphic procedure in the geochemical interpretation of water-analyses. Eos Trans. Am. Geophys. Union 1944, 25, 914–928. [Google Scholar] [CrossRef]
  48. Durov, S.A. Natural waters and graphical representation of their composition. Dokl. Akad. Nauk. Union Sov. Social. Repub. 1948, 59, 87–90. [Google Scholar]
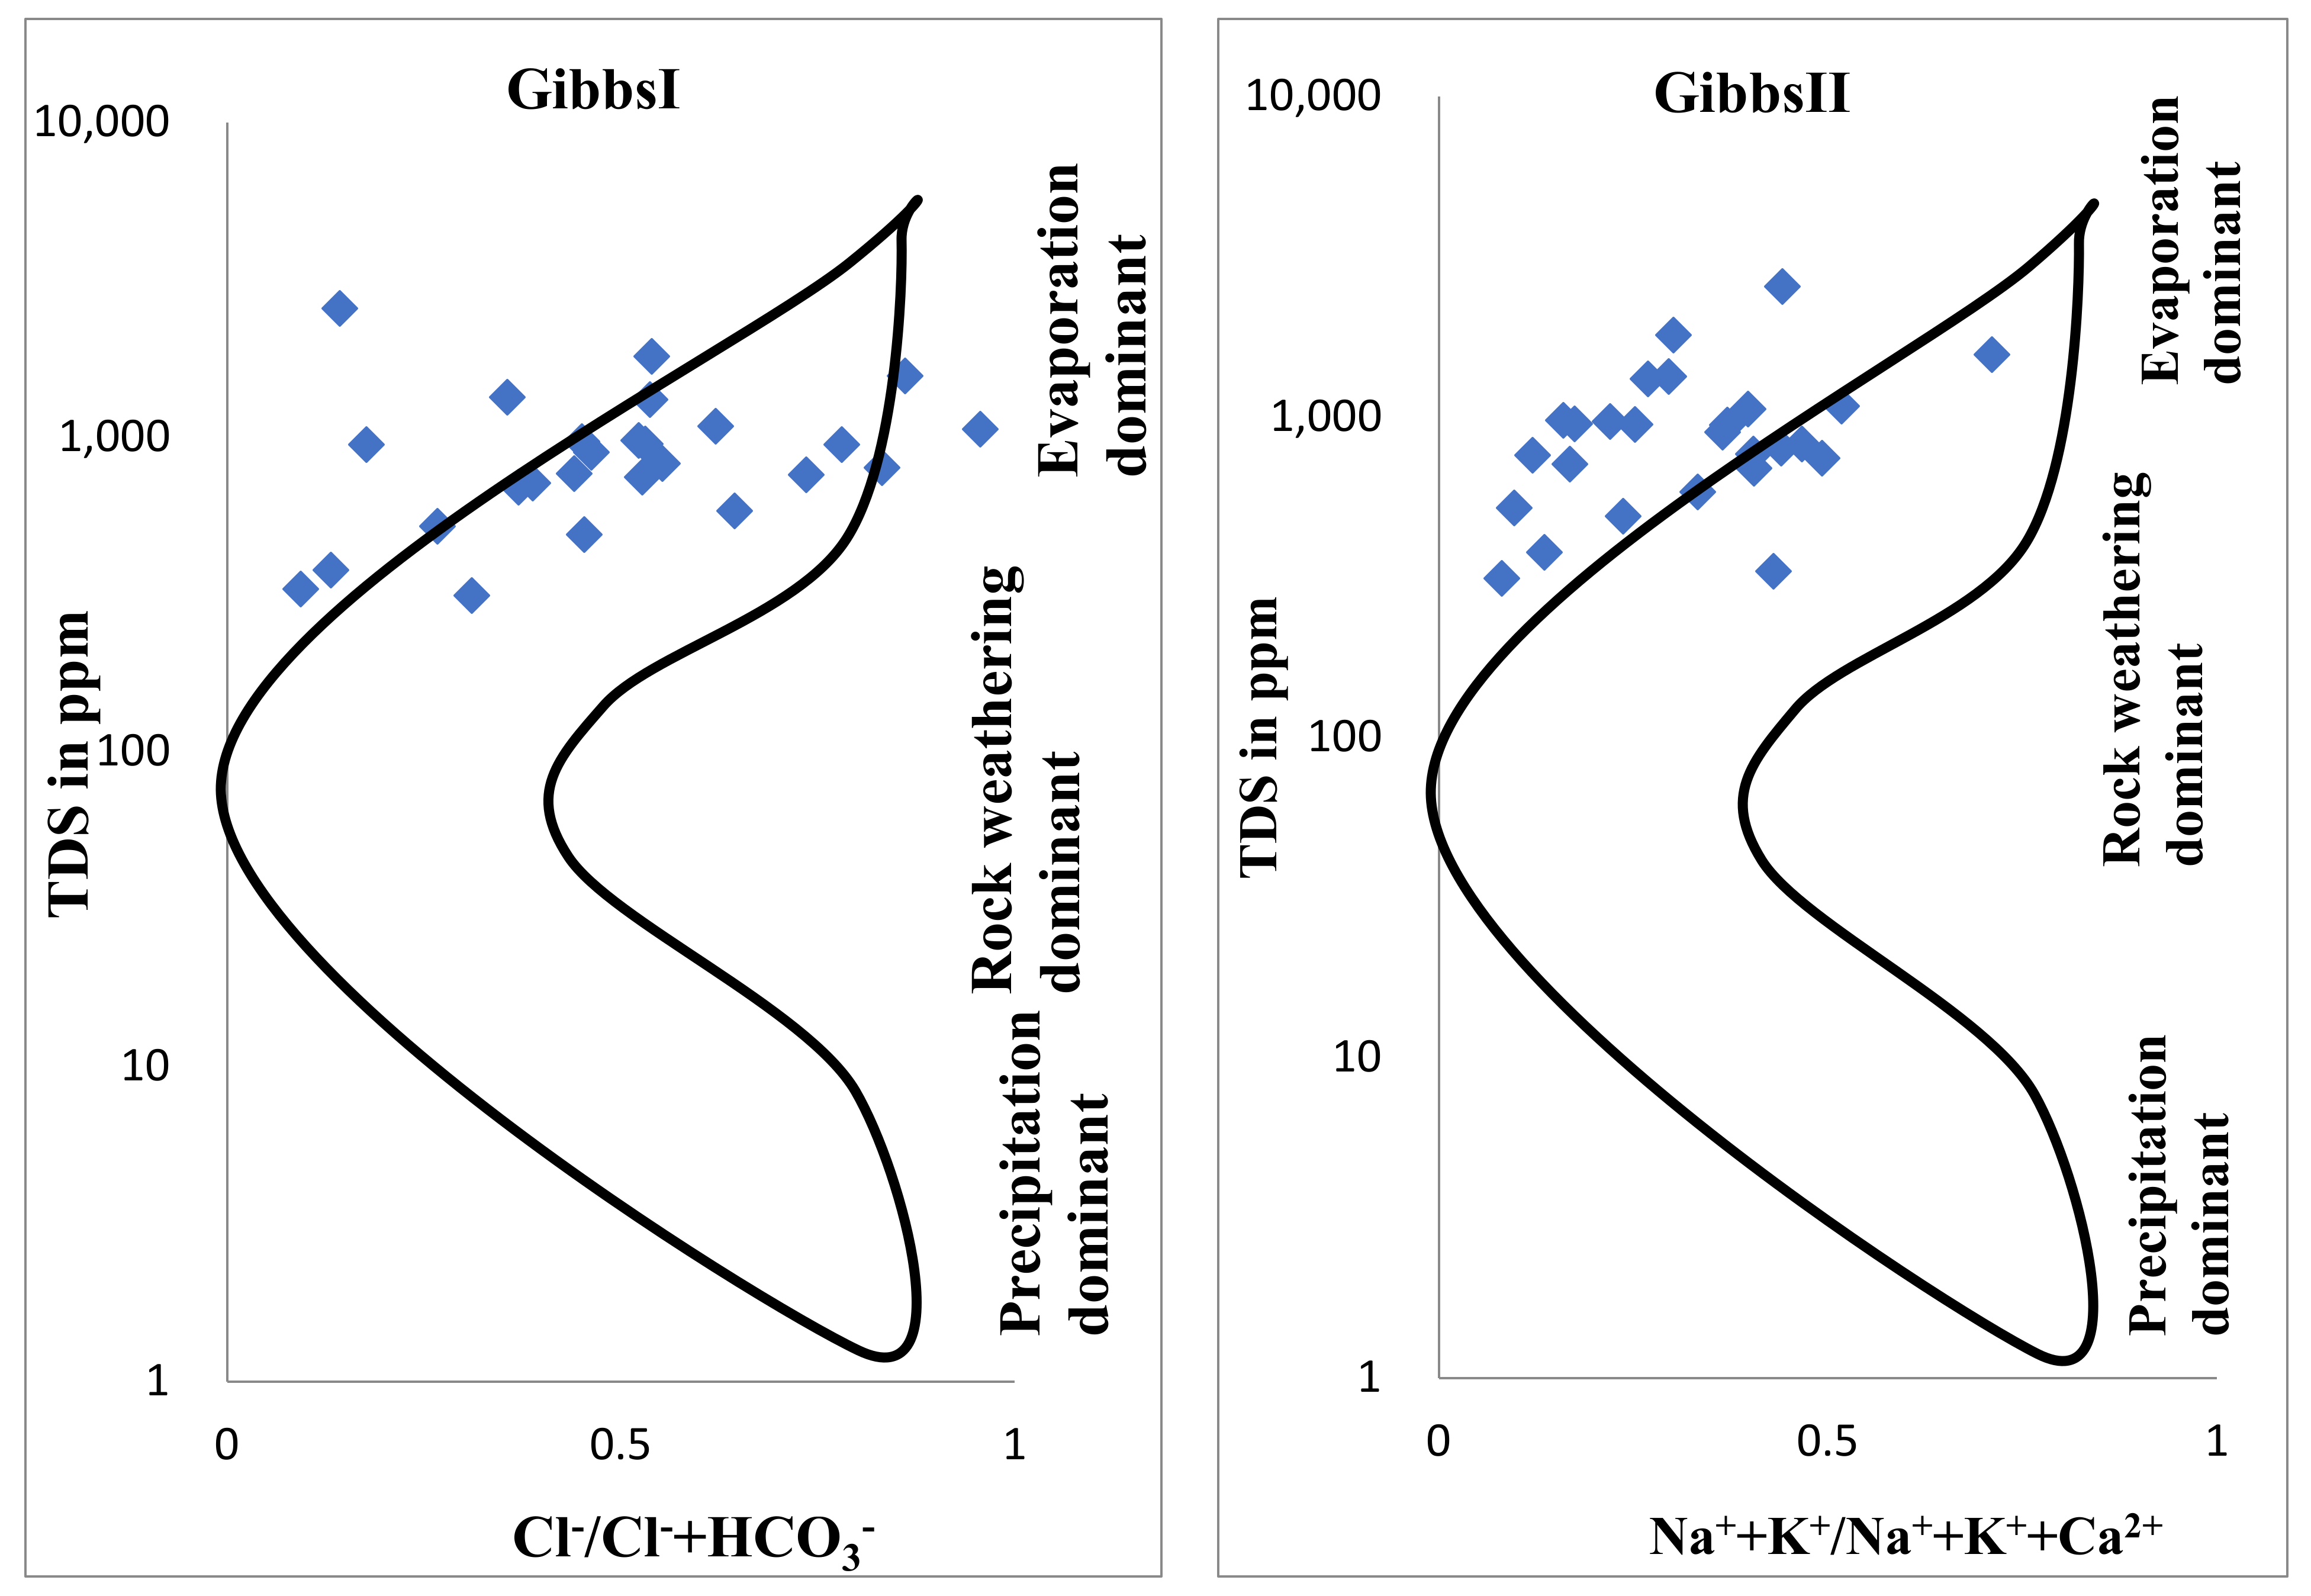
  49. Gibbs, R.J. Mechanisms Controlling World Water Chemistry. Science 1970, 170, 1088–1090. [Google Scholar] [CrossRef]
  50. Ali, M.M.; Khaty, N.T.; Pandey, D.; Patle, M.R. Assessment of Irrigation Suitability of Semi-Arid Region of Gondia District, Maharashta India. J. Environ. Sci. Toxicol. Food Technol. 2016, 10, 46–52. [Google Scholar] [CrossRef]
  51. Akhtar, N.; Rai, S.P. Physico-chemical Analysis of Ground Water for Irrigation and Drinking Purposes around Moth Block of Jhansi District, Uttar Pradesh, India. Indian J. Ecol. 2019, 46, 260–269. [Google Scholar]
  52. Kumar, S.K.; Rammohan, V.; Sahayam, J.D.; Jeevanandam, M. Assessment of groundwater quality and hydrogeochemistry of Manimuktha River basin, Tamil Nadu, India. Environ. Monit. Assess. 2009, 159, 341–351. [Google Scholar] [CrossRef] [PubMed]
  53. Karanth, K.R. Ground Water Assessment: Development and Management; Tata McGraw-Hill Education: New York, NY, USA, 1987. [Google Scholar]
  54. Eaton, F.M. Significance of carbonates in irrigation waters. Soil Sci. 1950, 69, 123–134. [Google Scholar] [CrossRef]
  55. Lloyd, J.W.; Heathcote, J.A.A. Natural Inorganic Hydrochemistry in Relation to Ground Water; U.S. Department of Energy Office of Scientific and Technical Information: Oak Ridge, TN, USA, 1985. [Google Scholar]
  56. Sunitha, V.; Reddy, Y.S. Hydrogeochemical evaluation of groundwater in and around Lakkireddipalli and Ramapuram, Y.S.R. District, Andhra Pradesh, India. Hydro. Res. 2019, 2, 85–96. [Google Scholar] [CrossRef]
  57. Cunningham, M.A.; Menking, K.M.; Gillikin, D.P.; Smith, K.C.; Freimuth, C.P.; Belli, S.L.; Pregnall, A.M.; Schlessman, M.A.; Batur, P. Influence of Open Space on Water Quality in an Urban Stream. Phys. Geogr. 2010, 31, 336–356. [Google Scholar] [CrossRef] [Green Version]
  58. Khan, T.A. Trace Elements in the Drinking Water and Their Possible Health Effects in Aligarh City, India. J. Water Resour. Prot. 2011, 3, 522–530. [Google Scholar] [CrossRef] [Green Version]
  59. Hsu, L.-C.; Chuang, Y.-H.; Chen, H.-W.; Chan, Y.-T.; Teah, H.Y.; Chen, T.-Y.; Chang, C.-F.; Liu, Y.-T.; Tzou, Y.-M. Accumulation of heavy metals and trace elements in fluvial sediments received effluents from traditional and semiconductor industries. Sci. Rep. 2016, 6, 34250. [Google Scholar] [CrossRef] [Green Version]
  60. Hou, D.; O’Connor, D.; Nathanail, P.; Tian, L.; Ma, Y. Integrated GIS and multivariate statistical analysis for regional scale assessment of heavy metal soil contamination: A critical review. Environ. Pollut. 2017, 231, 1188–1200. [Google Scholar] [CrossRef]
  61. Celestino, A.E.M.; Cruz, D.A.M.; Sánchez, E.M.O.; Reyes, F.G.; Soto, D.V. Groundwater Quality Assessment: An Improved Approach to K-Means Clustering, Principal Component Analysis and Spatial Analysis: A Case Study. Water 2018, 10, 437. [Google Scholar] [CrossRef] [Green Version]
  62. Egbueri, J.C. Groundwater quality assessment using pollution index of groundwater (PIG), ecological risk index (ERI) and hierarchical cluster analysis (HCA): A case study. Groundw. Sustain. Dev. 2020, 10, 100292. [Google Scholar] [CrossRef]
  63. Ahmed, S.; Khurshid, S.; Qureshi, F.; Hussain, A.; Bhattacharya, A. Heavy metals and geo-accumulation index development for groundwater of Mathura City, Uttar Pradesh. Desalination Water Treat. 2019, 138, 291–300. [Google Scholar] [CrossRef]
  64. Hong, Z.; Zhao, Q.; Chang, J.; Peng, L.; Wang, S.; Liu, G.; Ding, S. Evaluation of Water Quality and Heavy Metals in Wetlands along the Yellow River in Henan Province. Sustainability 2020, 12, 1300. [Google Scholar] [CrossRef]
Figure 1. The map of the study area with sample locations in Aligarh.
Pollutants 02 00032 g001
Figure 2. Spatial distribution of different physiochemical parameter (a) pH (b) Electrical Conductivity (c) Hardness (d) Total Dissolved solids (e) Sodium (f) Calcium (g) Potassium (h) Magnesium (i) Bicarbonate (j) Chloride (k) Suphate (l) Nitrate (m) Fluoride in the study area.
Pollutants 02 00032 g002aPollutants 02 00032 g002bPollutants 02 00032 g002c
Figure 3. Piper trilinear diagram showing different hydrochemical facies in groundwater.
Pollutants 02 00032 g003
Figure 4. Gibbs diagram showed the dominant process.
Pollutants 02 00032 g004
Figure 5. Durov diagram plotted for groundwater samples.
Pollutants 02 00032 g005
Figure 6. Scatter plot (a) Ca2+ vs. Na+ (b) Na+ vs. Cl (c) HCO3 vs. Tz+ (d) Ca2+ +Mg2+ vs. HCO3 + SO42− (units of ions in meq/l).
Pollutants 02 00032 g006aPollutants 02 00032 g006b
Figure 7. US salinity classification of groundwater for irrigation in the study area.
Pollutants 02 00032 g007
Figure 8. Wilcox diagram for percent sodium (Na%) against EC.
Pollutants 02 00032 g008
Figure 9. Doneen classification of irrigation water quality based on PI.
Pollutants 02 00032 g009
Figure 10. Water quality index of the study area in Aligarh District.
Pollutants 02 00032 g010
Figure 11. Cluster dendrogram from HCA for all observation wells.
Pollutants 02 00032 g011
Table 1. Different approaches to the assessment of hydrochemical parameters.
Index (References)ClassificationRangeFormula
Sodium Adsorption Ratio (SAR) [31]Excellent<10 S A R = N a + / ( C a 2 + + M g 2 + 2 )
Good10–18
Doubtful18–26
Unsuitable>26
Percentage Sodium (Na %) [32,33]Excellent<20 N a % = N a + C a 2 + + M g 2 + + N a + + K + 100
Good20–40
Permissible40–60
Doubtful60–80
Unsuitable>80
Permeability Index (PI) [34]Suitable<75 P I = N a + + H C O 3 C a 2 + + N a + + M g 2 + + K + 100
Permissible25–75
Unsuitable>25
Potential Salinity (PS) [35]Suitable<3 P S = C l + S O 4 2 2
Unsuitable>3
Kelley’s Index (KI) [36]Suitable<1 K I = N a + M g 2 + + C a 2 +
Unsuitable>1
Residual Sodium Carbonate (RSC) [37]Suitable<1.25 R S C = H C O 3 + C O 3 2 C a 2 + + M g 2 +
Doubtful1.25–2.5
Unsuitable>2.5
Table 2. Descriptive statistics of water quality parameters in groundwater.
Parameters (mg/L) MinimumMaximumMeanStd. DeviationBIS (2012)WHO (2011)Weight
(wi)
Relative Weight (Wi)
pH6.79.58.350.706.5–8.57.540.09
EC (µS/cm)2002300836.92441.915001500--
TDS3132554933485.950050050.11
TH59324139.3764.38200600--
Ca21.2601.2181.66117.207520030.07
Mg5.293.134.5622.49303030.07
Na2134316794.0120020040.09
K7832316.2920020040.09
HCO33511281705261.96-24410.02
CO301041730.26----
SO479.1731.7340.99183.5020020050.11
NO32.6105.726.3420.97454550.11
Cl34503191106.6325025050.11
F0.041.890.490.511.01.550.11
Table 3. Different index values for irrigation purposes in the study region.
Sample
No
LocationsCAI(I)CA(II)Na %SARGibbs IIGibbs IKRPIPSRSC
S1Delhi gate0.852.6644.222.970.460.240.7263.543.174.84
S2Kanwariganj5.195.3440.451.520.530.490.5982.915.762.46
S3Talaspur1.192.7255.654.080.650.331.2074.823.552.66
S4Shahjamal3.004.5578.108.490.830.443.3495.325.253.38
S5Bhojpura13.1513.5184.0311.210.860.714.7797.7114.212.99
S6Sarai Sultani6.927.4547.384.000.550.470.8560.828.25−1.79
S7Khair Road7.437.518.510.370.090.430.0730.917.70−2.26
S8Gonda Road6.536.9442.523.100.440.410.6960.627.821.06
S9Gudiya Bagh2.243.6046.023.390.540.300.8264.684.142.51
S10Ashok Nagar1.232.9439.202.590.450.220.5655.943.420.86
S11Shaktinagar6.196.3210.770.490.140.440.0927.186.61−5.85
S12Rasalganj0.162.5974.858.850.960.402.8887.353.941.07
S13Upper Fort7.938.7466.097.300.780.371.8382.449.768.19
S14Dubey ka Padao3.494.8046.373.110.540.270.6761.015.415.21
S15Sasni gate5.236.2741.193.700.460.370.6753.316.88−3.64
S16Madar gate8.308.8256.454.800.620.521.2372.629.401.11
S17Mahavirganj4.875.8528.932.190.360.300.3540.956.19−2.78
S18Railway road0.183.4848.725.240.520.160.9262.644.084.78
S19Exibition ground1.713.9343.974.060.530.170.7560.824.415.98
S20ITI road0.901.7810.750.600.130.140.1130.301.97−0.67
S21Ramnagar4.315.2114.701.370.180.250.1622.855.56−21.39
S22Sarai rahman−0.012.4634.032.620.390.170.4849.302.80−1.20
S23Nai basti7.517.9929.202.050.370.410.3845.158.27−2.30
S24Quarsi−1.061.7520.491.650.270.100.2534.751.99−4.62
S25SS nagar−2.750.8124.411.230.310.080.2644.041.02−0.21
S26Dhoerra−0.531.3564.723.010.740.121.68138.651.5110.84
Table 4. The results of Pearson correlation analysis.
pHECTDSTHCaMgNaKHCO3CO3SO4NO3ClF
pH1
EC0.3211
TDS0.240.947 **1
TH0.2620.2520.1691
Ca−0.016−0.088−0.0570.1771
Mg0.2270.0610.0940.3220.743 **1
Na0.240.1940.1540.338−0.117−0.0131
K0.3050.3220.2720.718 **−0.099−0.0340.3271
HCO3−0.032−0.143−0.1310.4360.595 *0.543 *0.2030.0821
CO3−0.2970.034−0.086−0.115−0.115−0.218−0.280.055−0.0821
SO40.137−0.148−0.094−0.1680.0290.0920.0980.0680.097−0.1961
NO30.1350.723 **0.793 **−0.0780.070.139−0.1760.057−0.125−0.044−0.2151
Cl0.1340.420 *0.3560.218−0.15−0.1670.3830.325−0.229−0.3830.0450.2481
F−0.189−0.235−0.29−0.026−0.32−0.267−0.186−0.042−0.237−0.008−0.252−0.309−0.0871
** Correlation is significant at the 0.01 level (2-tailed). * Correlation is significant at the 0.05 level (2-tailed).
Table 5. The findings of Principal Component Analysis (PCA).
Parameters12345
pH0.5030.1130.207−0.2340.020
EC0.858−0.320−0.2450.1120.047
TDS0.843−0.296−0.3300.0120.020
TH0.5160.4060.4510.519−0.081
Ca0.0900.795−0.3930.016−0.135
Mg0.2650.783−0.318−0.021−0.178
Na0.4110.1270.600−0.1570.075
K0.5530.0330.5230.3970.263
HCO30.0840.835−0.0030.1850.053
CO3−0.260−0.211−0.2610.5930.601
SO4−0.0280.2260.199−0.6430.490
NO30.640−0.276−0.625−0.016−0.090
Cl0.561−0.2810.344−0.260−0.240
F−0.407−0.3020.2940.318−0.530
Eigenvalues3.4842.6692.0081.4881.084
% Total variance24.88619.06214.3410.6317.746
% Cumulative variance24.88643.94858.28868.9276.666
Publisher’s Note: MDPI stays neutral with regard to jurisdictional claims in published maps and institutional affiliations.

