1. Introduction
A regulatory tool that has recently gained traction as an alternative to traditional forms of environmental regulation is information management tools that provide publicly available self-reported data from industry [
1]. These tools have been implemented successfully internationally. The United States (U.S.) Toxic Release Inventory (TRI) is arguably the most developed environmental pollutant reporting system and longest-running tool, beginning in 1986 [
2]. Australia also recently developed such a tool, the National Pollutant Inventory (NPI), in 1998, basing much of the guidelines on the TRI [
3]. Enacted under federal legislation, the National Pollutant Release Inventory (NPRI) is Canada’s version of the information management tool [
4,
5,
6,
7,
8]. The NPRI provides publicly accessible data regarding pollutant emissions and transfers from a variety of industries across the country. The NPRI was first established in 1993 and received legislative authority under the
Canadian Environmental Protection Act (
CEPA) in 1999 [
9]. The tool is managed solely by the federal agency, Environment and Climate Change Canada (ECCC) [
5,
7,
10].
Commercial facilities and industries that surpass reporting thresholds outlined under
CEPA are required, by law, to report emissions data to the inventory. Failing to report emissions is punishable under
CEPA 1999 guidelines [
9,
10]. It is the facility’s responsibility to gather their own data for reporting, which has been a point of discussion in the true accuracy of the tool. Reporting is aimed at gathering data on significant point-sources and contaminants of high quantities present in the environment. Currently, there are 343 listed substances tracked by NPRI and, in 2014, 7720 facilities reported to the database [
10]. Since its inception, substances have been added or removed based on their current use or environmental effects. ECCC may refer to other countries that have similar tools in place to guide the substance list. Similarly, advancements in science and technology may prompt the addition of new substances that had not been previously considered. Although reporting is required by law, reducing emissions is voluntary, making the tool an alternative to conventional policy and regulation [
10].
The data are organized and compiled into an online database, accessible to the public (
https://www.ec.gc.ca/inrp-npri/ (accessed on 6 May 2021). The NPRI intends to serve many functions. The inventory has five major goals, to: (1) assist in identifying pollution prevention priorities; (2) support the assessment and risk management of chemicals and air quality monitoring; (3) help develop regulations to reduce releases of air pollutants; (4) promote actions to reduce emissions; and (5) inform the public [
10]. In recent years, the NPRI has also worked to inform multilateral environmental agreements, such as the Clean Air Strategy [
11]. The tool provides communities with information that may inform their purchasing habits and attitudes towards certain industries. Interestingly, the government does not make explicit reference to the NPRI’s ability to give power to the public in a ‘right to know’ framework. It is the intention, however, that the NPRI tool acts as an incentive for industries to improve their environmental standards.
Overall, the NPRI programs had been viewed as successful in the early literature assessing the first few years of the NPRI being in effect [
5,
12]. It was estimated that the first three years of the NPRI brought a reduction of 38% in reported emissions. Similar results were seen in the U.S., prompting many observers to suggest self-reporting policies may be equally as effective as traditional regulatory measures [
12,
13].
However, there has been some evidence suggesting weaknesses in the programs. Issues, including lack of compliance, data inaccuracies, and the omission of substances from reporting, have been suggested for the US TRI [
14]. One such study identified under-reporting in the US TRI after comparing the self-reported data to air quality surveillance monitoring stations around emitting facilities [
15]. In a review of the current literature regarding Canada’s NPRI, very few studies were identified [
7,
16]. There were no identified empirical studies that examined NPRI data in comparison to measured ambient emissions.
In efforts to understand the potential weaknesses that may exist in the NPRI, self-reported data were compared to monitoring data from the National Air Pollutant Surveillance Network (NAPS) (
https://www.ec.gc.ca/rnspa-naps (accessed on 6 May 2021). NAPS data are collected, monitored, and analyzed by ECCC and have air quality monitoring stations across Canada. By using the NAPS as a reliable indication of pollutant concentrations in the atmosphere around Canadian facilities, comparisons were drawn between trends in both datasets. This study aims to (1) outline the current NPRI and NAPS programs; (2) understand the current theoretical framework governing pollution abatement incentives; (3) compare NPRI and NAPS data to inform the accuracy of reporting; (4) analyze NPRI data and trends; and (5) provide recommendations on improving the NPRI program.
1.1. National Pollutant Release Inventory
The NPRI was initially received as a success from many scholars and policymakers considering the initial few years of the program [
17]. Their positive outlook suggested the intention of the inventory, to publicize otherwise embarrassing data, had prompted consumer or environmental group pressure to influence industries. However, other factors may be driving decreasing emissions, such as regulations or economic factors. Harrison and Antweiler [
17] attempted to understand what was driving polluters to lower emissions by examining NPRI data. They assessed the percent change of NPRI data over a seven-year period between 1993 and 1999. However, the authors pointed out that, during the time that data were collected, many reporting changes had been occurring due to the relative infancy of the NPRI.
An interesting observation in the data is that a few facilities had exceptionally large emission reductions, which influenced the overall provincial and national reduction percentages [
12,
17]. The drastic reduction in a paint pigment facility was seen as an anomaly and prompted by federal and provincial regulatory enforcement actions [
12,
17]. Similarly, pulp and paper mills, which also contributed greatly to the overall emission reductions, were under the control of extensive provincial regulatory reforms in the 1990s and stricter federal enforcement measures [
18,
19]. Following an analysis on the introduction of guidelines for pollutant releases, it was found that the pulp and paper mills reduced emissions likely because of traditional forms of regulation, such as provincial industrial approval regulations [
16]. While the studies were not able to definitively conclude the sole reason for decreased emissions, presumably reductions may be attributable to a combination of factors, including traditional regulatory instruments [
19]. However, these early reports of emissions reductions in pulp and paper mills were not observed by Giacosa et al. [
8] who reported relatively high, but stable annual air emissions of carbon monoxide, nitrogen oxides, total particulate matter (TPM), PM
2.5, PM
10, sulfur dioxide, and volatile organic compounds from nine different pulp and/or paper mills across Atlantic Canada between 2002 and 2019.
Harrison and Antweiler [
12,
17] did, however, identify some fundamental weaknesses in the NPRI tool. The most evident is the self-reporting nature of the tool. The industries’ ability to report and recover their own data presents a clear bias, and, combined with minimal oversight from regulating bodies, industries are often left to estimate. These estimations are under no scrutiny for reliability, which can have the potential for hugely miscalculated values. Further, estimation methods may be altered over time, which can skew the data. For example, research on the U.S. TRI found that 50% of industries studied reported production-related waste reductions, and were recategorizing waste streams, rather than actual reduction in pollution levels [
20]. Lastly, the NPRI is focused on high-quantity emissions from toxic contaminants. Some toxic contaminants can pose human or ecological health problems at very low concentrations, which may be overlooked [
6,
12,
17]. The NPRI undergoes extensive changes each year. These changes may be the addition of substances, alterations in reporting methods, or recommendations for estimation methods, which poses problems when assessing the data over time (
Figure 1).
1.2. National Air Pollutant Surveillance Network
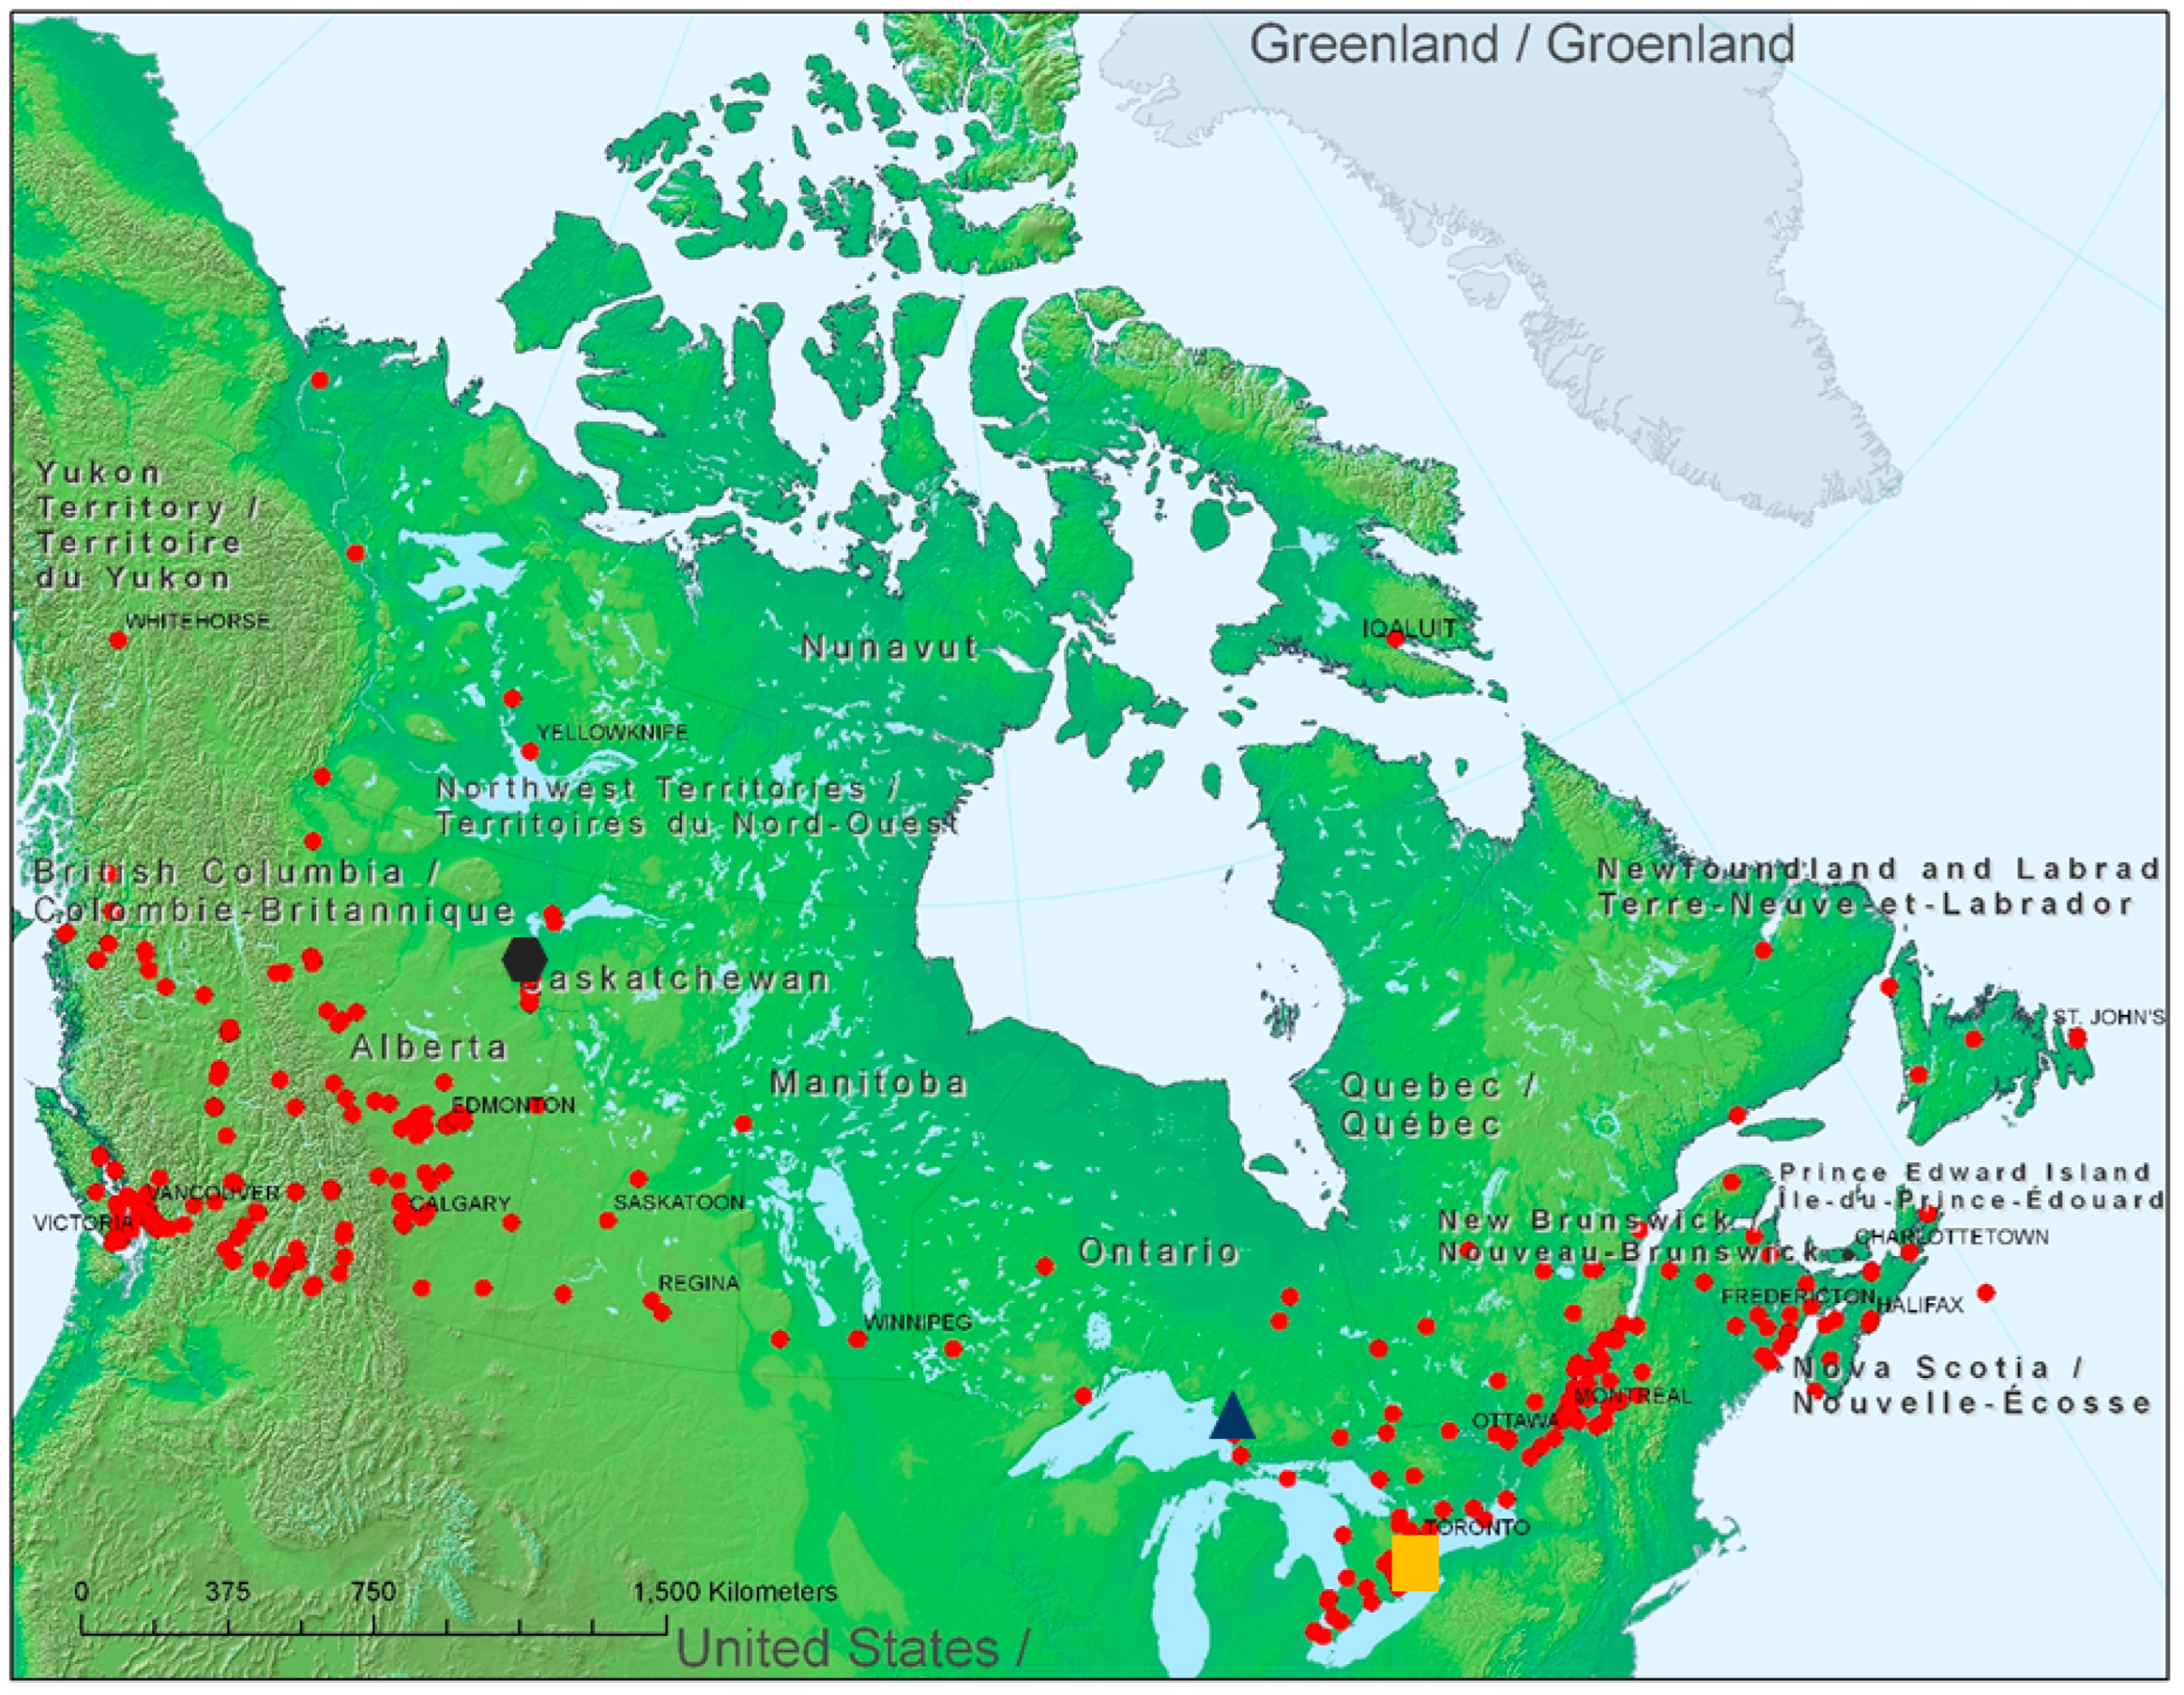
The NAPS network is another emissions monitoring tool managed by ECCC to gather long-term ambient air quality data, for public release, from 286 stations across Canada. The program is a collaboration between multiple provinces, territories, and municipalities (
Figure 2) [
21,
22]. Stations collect samples in air canisters that are then analyzed by ECCC for over 167 volatile organic compounds, including sulfur dioxide, carbon monoxide, and particulate matter. The program has been in effect since 1970, providing consistent data for >20 years [
21].
The NAPS network is arguably a more accurate environmental monitoring tool than NPRI (
Table 1). For example, NAPS data are collected and analyzed by ECCC. Meanwhile, NPRI data are voluntarily reported, introducing potential inaccuracies or under-reporting [
16]. Further, NAPS is a consistent monitoring tool, in which hourly, daily, and monthly data are produced [
21]. Data have been collected and analyzed using similar methods since inception. By comparison, NPRI is self-reported and self-estimated data. Substance releases have been based on thresholds determined by ECCC [
10], but thresholds have frequently changed year to year, making inter-annual emissions comparisons difficult. Moreover, NPRI self-reporting provides flexibility in the collection of emissions data. Emissions to land, water, and air are reported on-site. Recently, facilities were also required to report emissions off-site. ECCC [
10] recommends best practices for estimating emissions data; however, industries often alter methods used to calculate emissions. Facilities are also required to maintain their own records using their own methods, which introduce opportunities for inaccuracies in reported releases.
2. Incentives for Pollution Abatement
The NPRI works as a tool to inform the public, regulatory bodies, and industry about their emissions data. Several incentives exist that drive pollution abatement by industries. A combination of internal and external pressures work to effect change in a facility’s pollution control. Internal pressures include the number of employees working at a facility, which influences the scale of production, management, and production volume. According to Harrison and Antweiler [
12], external factors are categorized into five groups: consumers, workers, shareholders, community groups, and regulators.
In another study, Antweiler and Harrison [
17] assessed how industries respond to pressures from verified or anticipated green consumerism. They used economic modeling to predict the effect of green consumerism on companies. Results indicated a potential impact of green consumerism on companies with greater exposure to consumer markets. For example, companies that were more likely to be influenced by green consumerism made great progress in decreasing emissions. However, the impact of green consumerism identified in the model was still very small.
Another incentive to reduce emissions in response to programs like NPRI is benefits from public recognition. A company that adheres to these programs, reducing emissions, and publicizes their success in participating in voluntary programs may not only improve public perception of the company, but experience other benefits. These benefits allow firms to increase market shares or increase prices for their products because of participation in NPRI-like programs [
23]. Community groups and environmental watchdog organizations can pressure companies to participate in pollution abatement activities. Harrison and Antweiler [
12,
17], suggest, at the national and local levels, interest groups typically focus on facilities with the highest emissions. Larger facilities that receive more interest from interest groups are more likely to curb emissions.
Incentives to reduce emissions are not solely from community pressures, but also investor and market-based pressures. These pressures may be for a variety of reasons: whether investors have true concerns about the environment, receive community pressure, self-interest in negative effects from a community, or government pressures [
12,
17]. Similarly, with facilities that do exhibit poor environmental performance, investors may view this as a risk to exposing the company to liability, penalties, and the costs of compliance in the future. These influences may have the potential to alter the company’s stock prices [
24].
Traditional regulation and coercive pieces of legislation are arguably one of the greatest incentives for pollution abatement. Understandably, facilities will reduce emissions if required to do so by law. Therefore, traditional regulation may be the cause for decreases in emissions observed in NPRI and TRI programs. Several studies suggested that increasingly strict regulations were the most important determining factor for facilities to reduce emissions [
8,
25]. Harrison and Antweiler [
12,
17] found that traditional regulations, such as the
Fisheries Act and
Canadian Environmental Protection Act [
9], were the greatest causes for emission reductions reported in NPRI during the 1990s.
3. Methods
To understand accuracy of NPRI reporting, a comparison of emission trends between NPRI and NAPS data was conducted. Emission trends were compared at three facilities across Canada, including oil and gas, energy generation, and steel making. Multiple industry types were selected to compare trends across different sectors. When choosing facilities, the amount of available data was considered. Initial review of NPRI data yielded many gaps in reported emissions that would not provide sufficient data for analysis. Facilities with multiple data gaps were omitted. Further, consideration was given to the types of reported substances. To compare NPRI and NAPS data, substances that were reported consistently between 2002 and 2015 were required. Three reported substances overlapped between NAPS and NPRI, and were used for this study (sulfur dioxide, carbon monoxide, and nitrogen dioxide). Locations of facilities and location of NAPS stations were also considered. According to DeMarchi and Hamilton [
15], when comparing the TRI inventory to an air surveillance monitoring, a radius of 50 km was used between facilities and monitoring stations. For this study, facilities and monitoring stations were between 3.5 and 10 km away. Wind direction was not considered in this study.
None of the three reported substances used for this study (e.g., sulfur dioxide, carbon monoxide, and nitrogen dioxide) are reported under the Canadian Greenhouse Gas Reporting Program (GHGRP) [
26]. Therefore, this study only focused on the limitations of the NPRI tool. The GHGRP collects information on greenhouse gas (GHG) emissions annually from facilities across Canada. It is a mandatory program for those who meet the requirements. Facilities that emit 10 kT or more of GHGs, in carbon dioxide equivalent (eq.) units, per year must report their emissions to ECCC. Emissions data are available by gas (in tonnes and tonnes of carbon dioxide eq.) for each facility and each year of data collected (2004–present). The GHGs included in the GHGRP are: carbon dioxide, methane, nitrous oxide, hydrofluorocarbons, perfluorocarbons, and sulfur hexafluoride [
26].
Facilities included a steel plant in Hamilton, Ontario (ArcelorMittal Dofasco, 43°15′34.9″ N 79°48′40.0″ W), energy generation plant in Sault Ste. Marie in northern Ontario (Essar Power, 46°31′18.1″ N 84°21′49.3″ W), and an oil and gas facility in Fort McKay, Alberta (Suncor Power, 57°02’33.0″ N 111°54′18.0″ W). The NAPS and NPRI websites were used to collect all data. Yearly mean (ppb) emissions for each substance were recorded from 2002 to 2015. Data were imported into Microsoft Excel to create scatter plots and calculate correlations.
5. Discussion
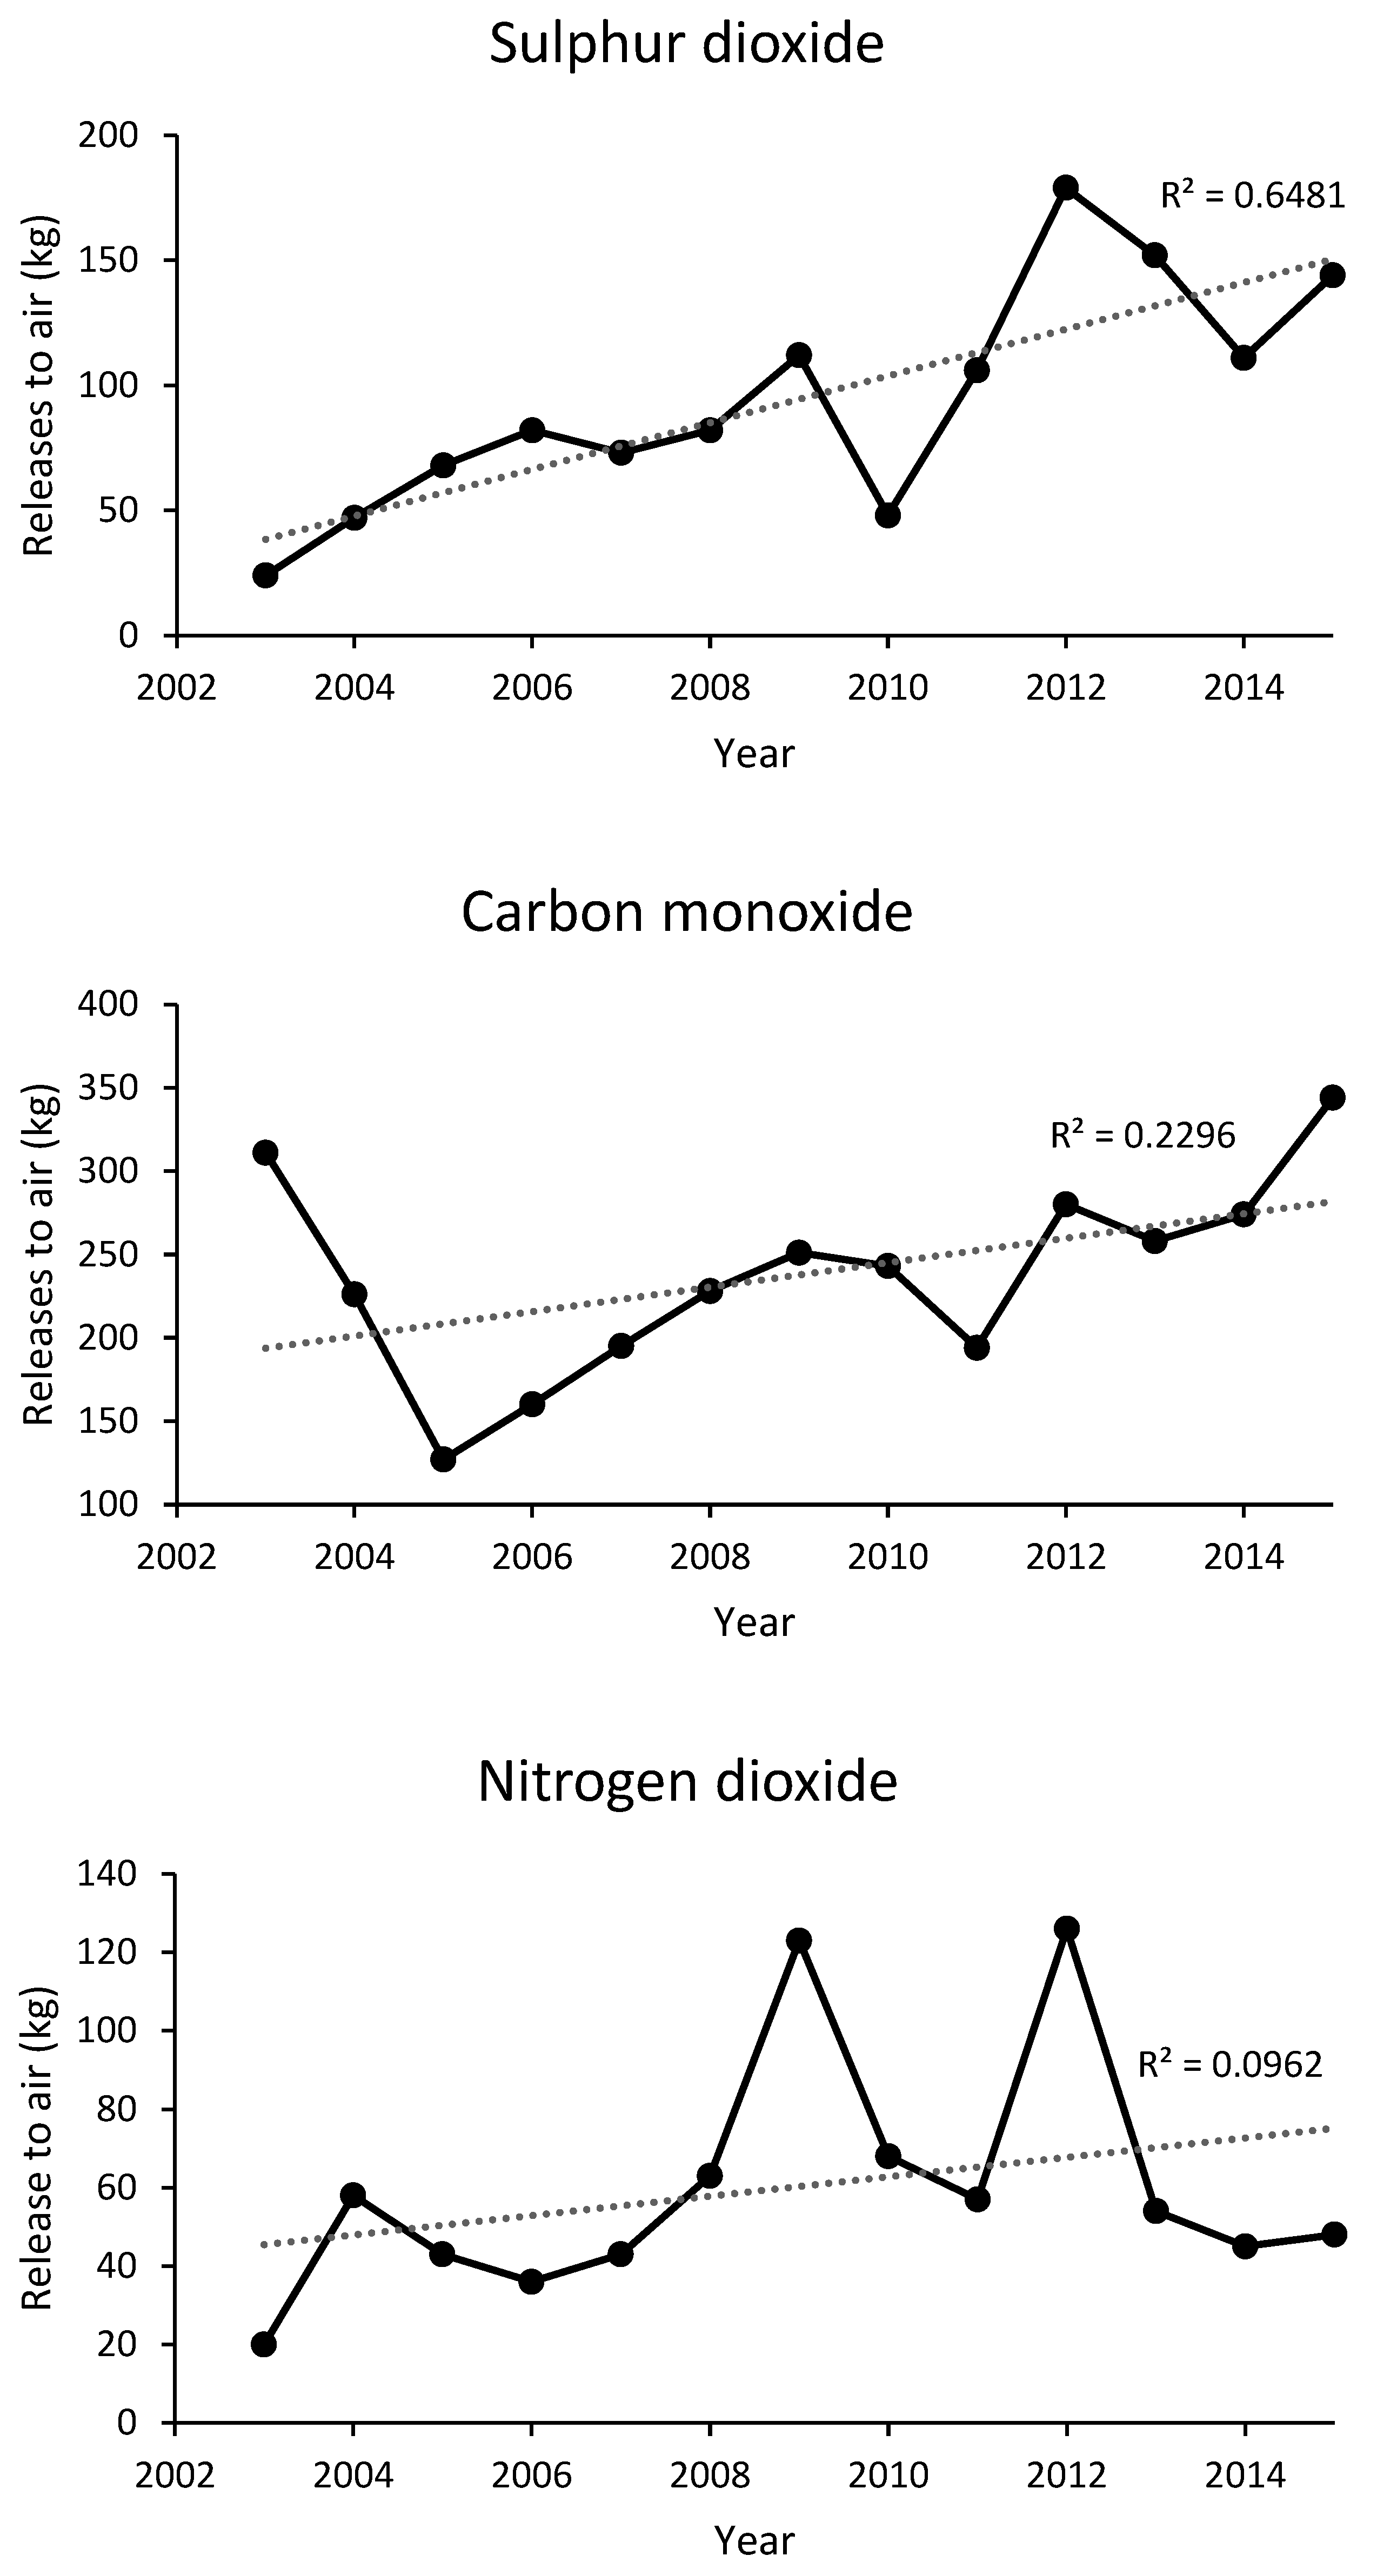
Decreasing emissions were not observed in the oil and gas, and steel industry cases. While only weak increasing substance releases were reported, it raises concerns, despite positive national outlooks from NPRI on emissions. Even slightly increasing emissions suggest that NPRI is failing to inspire the change it aims to promote, as are other environmental regulations that closely monitor criteria-classified air contaminants, such as carbon monoxide and sulfur monoxide. The power generation plant was the only example that yielded obvious decreases in emissions over 13 years. Interestingly, in 2009, the Essar power plant opened a cogeneration facility to reduce dependence on the provincial power grid by 50% and to reduce nitrous oxide emissions by 15% (400 T/year) [
27]. However, NPRI results did not indicate substantial decreases in any substances assessed. Nitrogen dioxide decreased the following year by approximately 220 kg, but emissions have steadily increased since.
Between 2012 and 2014, the steel-making facility faced 13 different environmental charges by the provincial Ministry of Environment. Charges were related to their coke-making facility and allowing air emissions that blocked light by more than 20% for six consecutive minutes. Permitting light to be blocked by air emissions for this amount of time is a violation of the
Environmental Protection Act. The company pled guilty to six of the charges and was fined CAD 350,000 [
28]. The lack of decreasing emissions was observed throughout this study despite having traditional regulatory tools (e.g.,
Environment Protection Act). At the steel-making facility, only the strictest of regulations may be able to induce change. For example, slight decreases in nitrogen dioxide and sulfur dioxide were observed following the
Environmental Protection Act violations.
It seems unlikely that NPRI has been responsible for positive changes in the steel-making facility emission practices, as increased emissions were observed for most years. In 2014, Dofasco announced it would be removing one of their coke ovens and upgrading two others [
29]. Although attributing reductions in emissions due to these upgrades remains to be seen.
The oil and gas facility also had increases in emissions, but the cyclical nature of the industry may be responsible [
30]. Suncor itself has also been charged with multiple environmentally related infractions over the past decade (e.g., CBC [
31]). Most of these violations require payment of a fine and activity can proceed as usual. Seeing as there were increases in emissions over the years it is highly unlikely that NPRI has been successful in informing citizens and igniting industry to act in reducing their emissions.
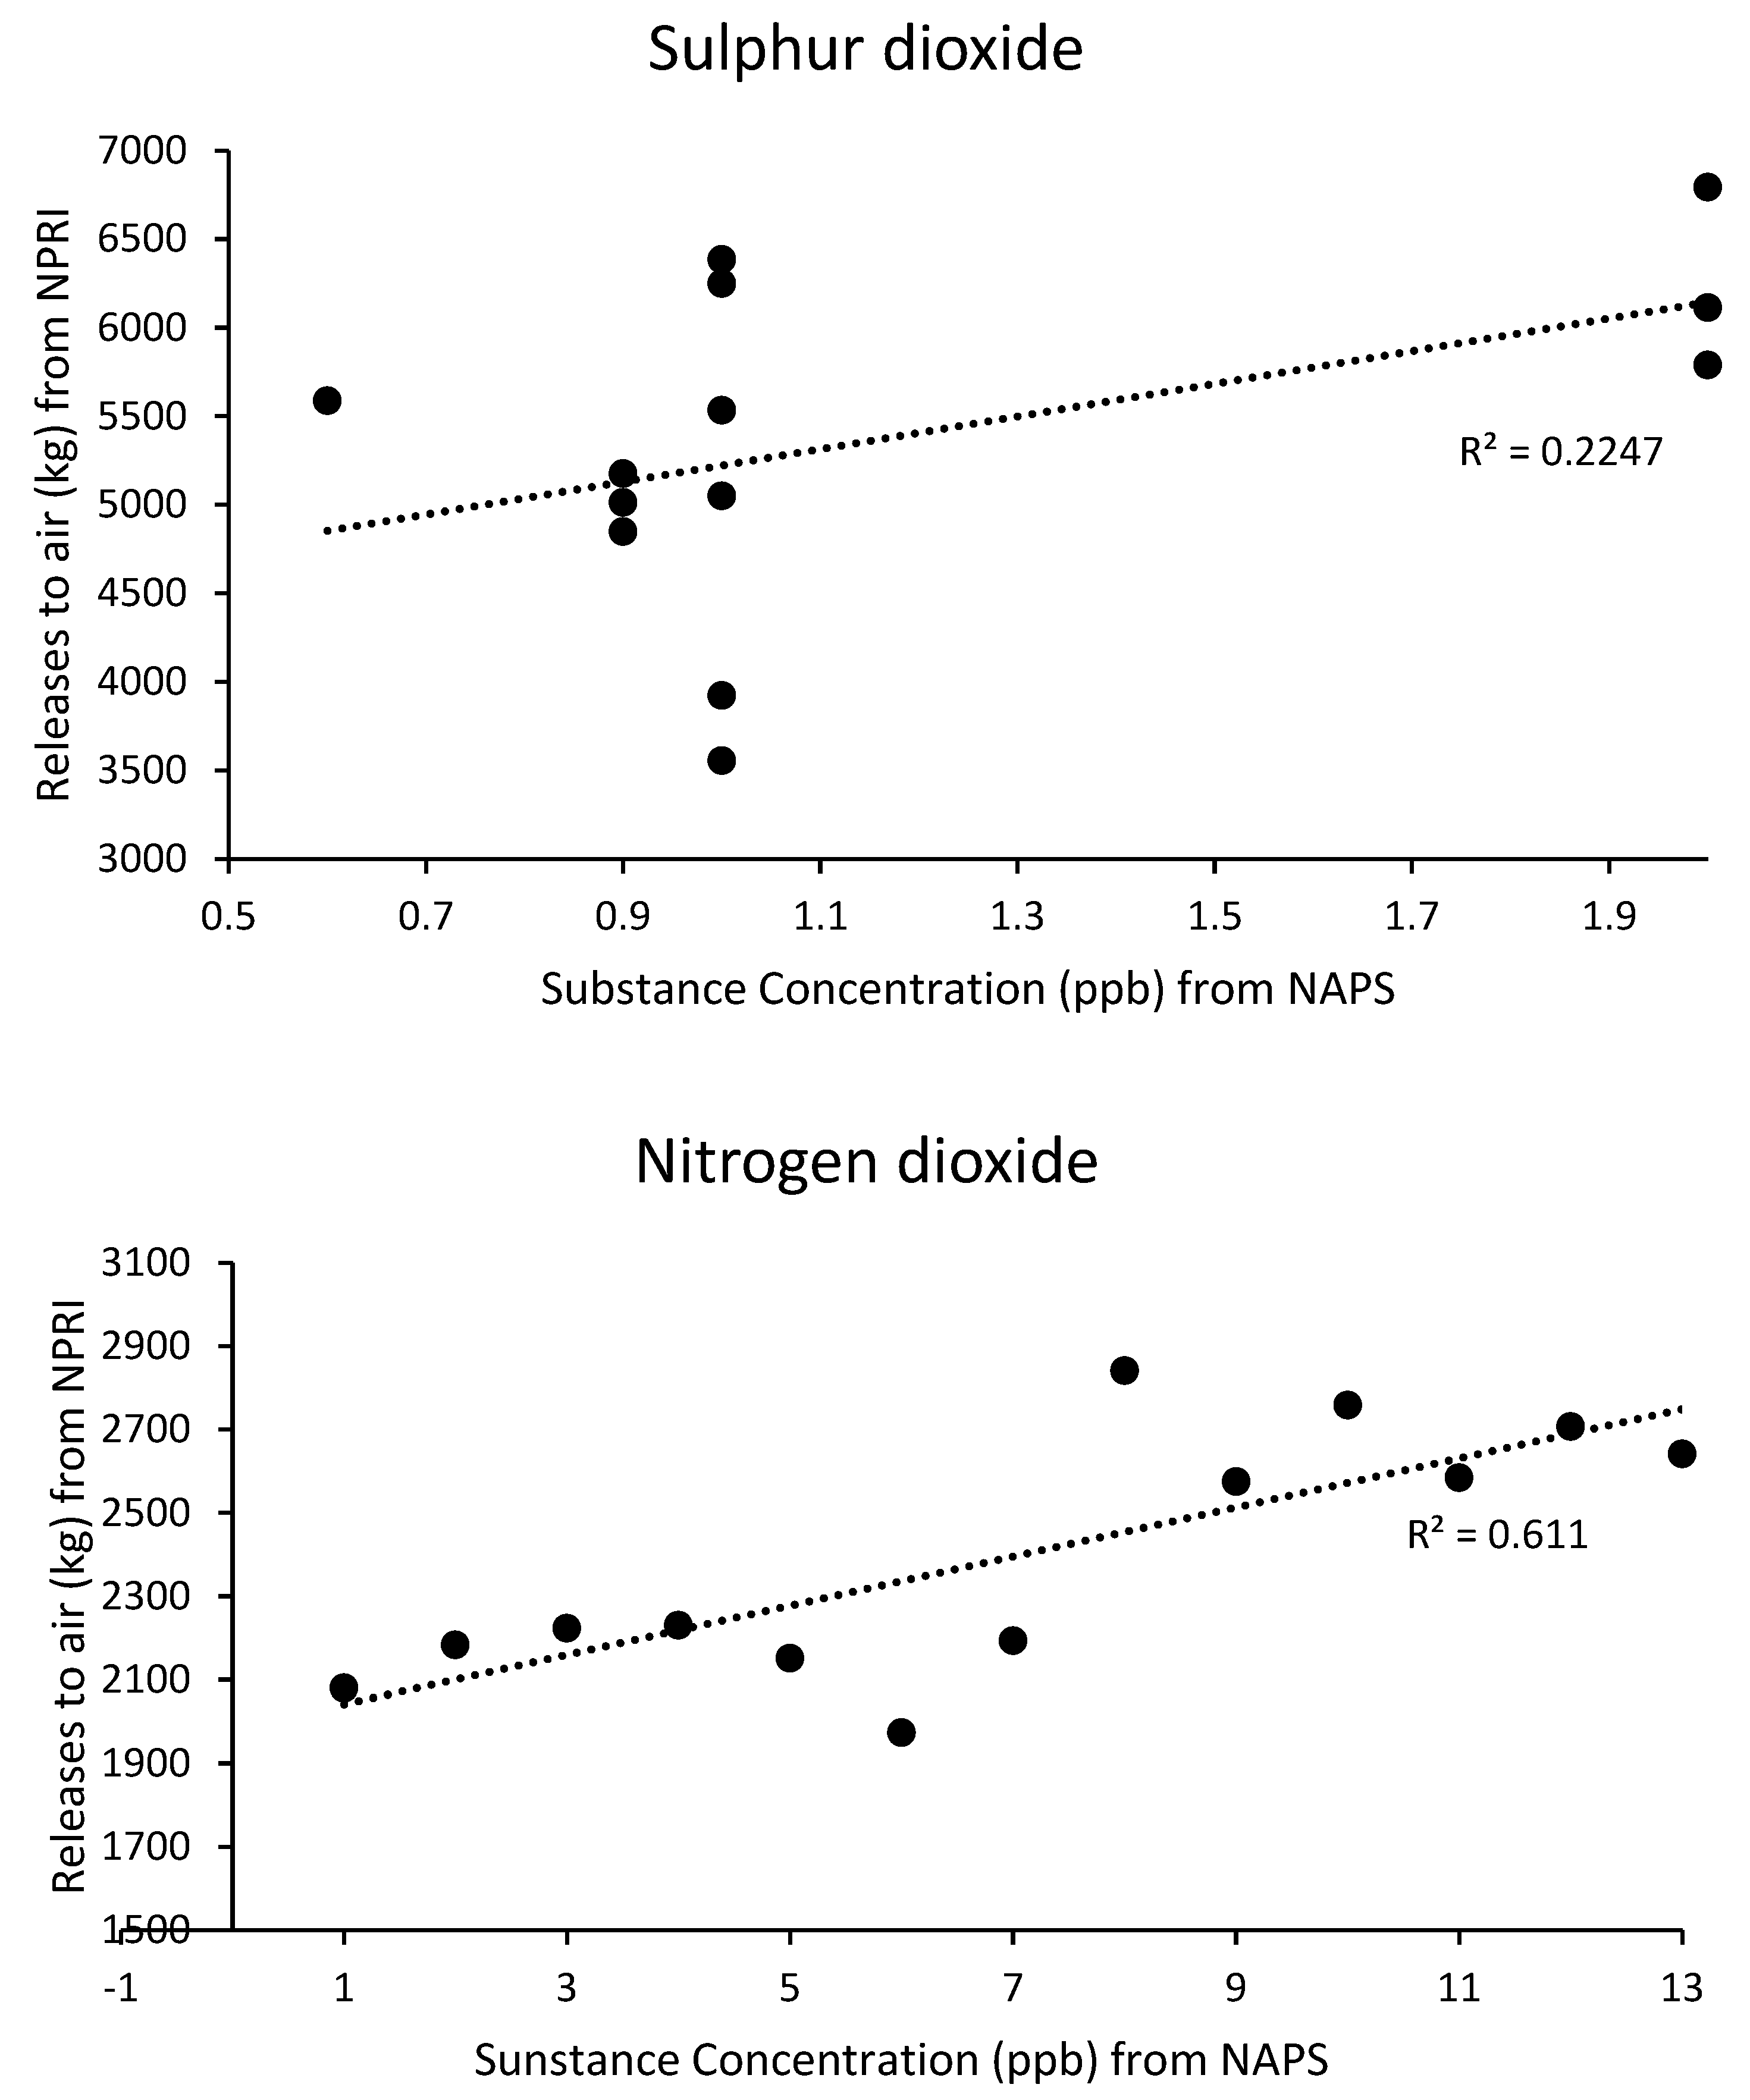
NAPS substance concentrations remained stable over 13 years. Similarly, previous literature found under-reporting was occurring in other jurisdictions (e.g., U.S. TRI) [
32]. It was assumed that NPRI emissions would be decreasing due to the NPRI website indicating successes in decreasing emissions across all sectors [
10]. However, NPRI and NAPS data were compared and there was no strong correlation found. Most NAPS data across all sectors indicated minor decreases in substance concentrations. However, NPRI data mostly indicated increasing in emissions. While under-reporting may responsible, this was not verified. However, increasing emissions in the oil and gas, and steel industry suggest there is no incentive to under-report or implement pollution abatement techniques.
Under-reporting of emissions may occur for several reasons. Reputation of the facility may be a reason to under-report emission levels, using a tool such as NPRI which aims to inform the public. Reporting lower emission levels to the NPRI database may also be advantageous for a facility if regulatory officers review the data. For example, it would likely reduce the likelihood of any ‘red flags’ in their emissions. While there may be incentives to under-report, facilities such as Dofasco do not seem to receive attention due to NPRI-derived data. Despite NPRI data indicating increases in emissions, Dofasco received penalties because of traditional forms of regulation (e.g., Environmental Protection Act violations). Presumably, NPRI data informed regulators, but changes in emissions may only result from hefty fines and penalties. Because the NPRI tool receives little attention from the media, community, and NGOs, incentives for companies to improve pollution abatement techniques to reduce emissions levels on the publicly accessible NPRI site remain low.
Although this study provided limited evidence of inaccurate NPRI reporting or a lack of correlation in NAPs and NPRI data, it helps highlight the lack of scholarly research conducted to assess the effectiveness of NPRI. Several studies by Harrison and Antweiler [
12,
17] were used to inform this study, but those were the few studies identified which specially addressed the Canadian environmental monitoring tool [
4]. Earlier studies conducted on NPRI were mostly published in the 1990s when the tool was first introduced, but there has been a lack of studies using NPRI data since. Conversely, the U.S. TRI has an extensive body of literature using the tool to assess effectiveness of TRI data to inform other areas of research, such as health [
33]. The TRI has been established five years longer than NPRI and is more robust (e.g., website accessibility, substance list, and funding). More research related to the NPRI tool is required, as it has the potential to provide information that can be readily accessed by the public, researchers, and regulators. For example, more research that critically analyzes the tool may assist in improving the NPRI’s functions [
5,
6].
Allowing the public to understand and to subsequently promote change in industry practices and their toxic releases is one of the main goals of information-based tools, such as NPRI. However, if data are difficult for the public to access, then the ability of the tool to inform communities may not succeed. A particular issue that creates a level of unawareness is the relationship between reported discharges and impacts to environmental or human health. Trends displayed in the data only provide the weight (mass) of discharged substances; however, these amounts must be compared to guidelines (i.e., CCME) to understand levels of toxicity. Reporting mass discharge does not indicate levels of toxicity or risks imposed [
6,
34]. If public understanding is to be increased, then individuals using NPRI data need to understand how toxic emission levels are to their community [
34]. Furthermore, improvements in website accessibility would assist public navigation of the site to find information related to facilities in their area [
5]. Substance information should be presented more clearly so that the public can understand what the substance is, where it is derived, and what the potential environmental and health impacts are.
Whilst the concept of the NPRI and similar programs are widely accepted, previous studies have criticized the NPRI tool for lacking mechanisms to account for toxicity or risk posed by chemicals released into the environment [
6,
34]. To help better understand the toxicity of chemicals released into the environment, programs such as TRACI—the tool for the reduction and assessment of chemical and other environmental impacts, a life-cycle analysis program created and maintained by the USEPA [
35], and USEtox
®—the United Nations Environment Program (UNEP)/Society of Environmental Toxicology and Chemistry (SETAC) have been developed for characterizing human and ecotoxicological impacts of chemical emissions [
36]. Similarly, tools such as Unmix Optimum (UnmixO) receptor modeling, have been used to attribute potential harmful sources of pollutants in the environment [
37]. Tools such as USEtox
® and TRACI have been proposed for incorporation into NPRI by Taylor et al. [
6] to better understand toxicity or risk associated with chemicals released into the environment.
While the self-reporting nature of NPRI creates an inherent weakness in the accuracy of data, particular issues arise when assessing temporal data over time. Facilities that report data may change estimation methods over time. Data are reported to an online system organized by ECCC [
5,
6]. Guiding documents on how estimations should be made are provided to organizations, but adopting these methods are not required by law. In previous studies (e.g., DeMarchi and Hamilton [
15], it was observed that changes in emissions were most likely due to
paper reductions, where facilities altered how they categorized emissions or substance releases. Considering facilities that meet the standard, by law, must report to NPRI, more stringent estimation measures would increase data accuracy. Over time, guidance documents prepared by ECCC may also alter the recommended estimation protocols used to measure substances. When using NPRI data, changes to reporting methodology should be considered when assessing temporal trends.
Similarly, thresholds should be developed to determine whether a substance should be reported, and thresholds should be enforceable [
8]. Although thresholds exist, they are merely used to trigger NPRI emission reporting and are not regulated or enforceable. These thresholds may also change over time, creating data gaps. Sectors required to report are also a changing variable in NPRI reporting, which further reduces the accuracy of data. Despite NPRI reporting being required under law, facilities are not required to conduct additional monitoring beyond what information is available and what is already required under the provisions of other legislation or bylaws. Because of this, there is not enough incentive for facilities to improve their quality of data reporting. Another weakness in NPRI is that facilities are not required to report to NPRI if they have less than 10 employees, despite producing NPRI-listed substances; small facilities may still cause large impacts on the environment depending on released substances but will not be reported on NPRI, reducing the number of reporting facilities. Improving the accuracy of data is not limited to reporting measures, but also quality assurance. Most quality checks to ensure data are properly reported is desk-based through the reporting computer system. Increasing on-site visits to ensure substance reporting is accurate may improve the overall accuracy and place pressure on facilities to always maintain accuracy of record keeping of their emissions. Improving our accuracy of NPRI data may not only improve analyses but may entice more attention from researchers and greater use by the public.
Study Limitations
Variation in emissions across the three industrial sectors were assumed to primarily be due to changes in operations or upgrades to emissions mitigations methods. However, production (for steel and oil and gas) or consumption (for power generation) were also likely important factors to consider for explaining emission variations. As the study period covered from 2002 to 2015, production and consumption varied annually. Although production and consumption data were not reported on the NPRI website, some production and consumption data are presented for context. Recent production at the steel facility was reported as 2700 thousand tonnes in 2020 and 2387 thousand tonnes of pig iron (hot metal) in 2019 [
38]. Essar Power in Sault Ste Marie is a cogen power plant and is a gas power plant with a design capacity of 85 MW [
39]. Production data were unavailable for the oil and gas facility for the period from 2002 to 2015 [
40].


