
Ecological–Health Risk Assessments of Copper in the Sediments: A Review and Synthesis

 , , , , ,
  ,
,  , , , , , and
Abstract
:1. Introduction
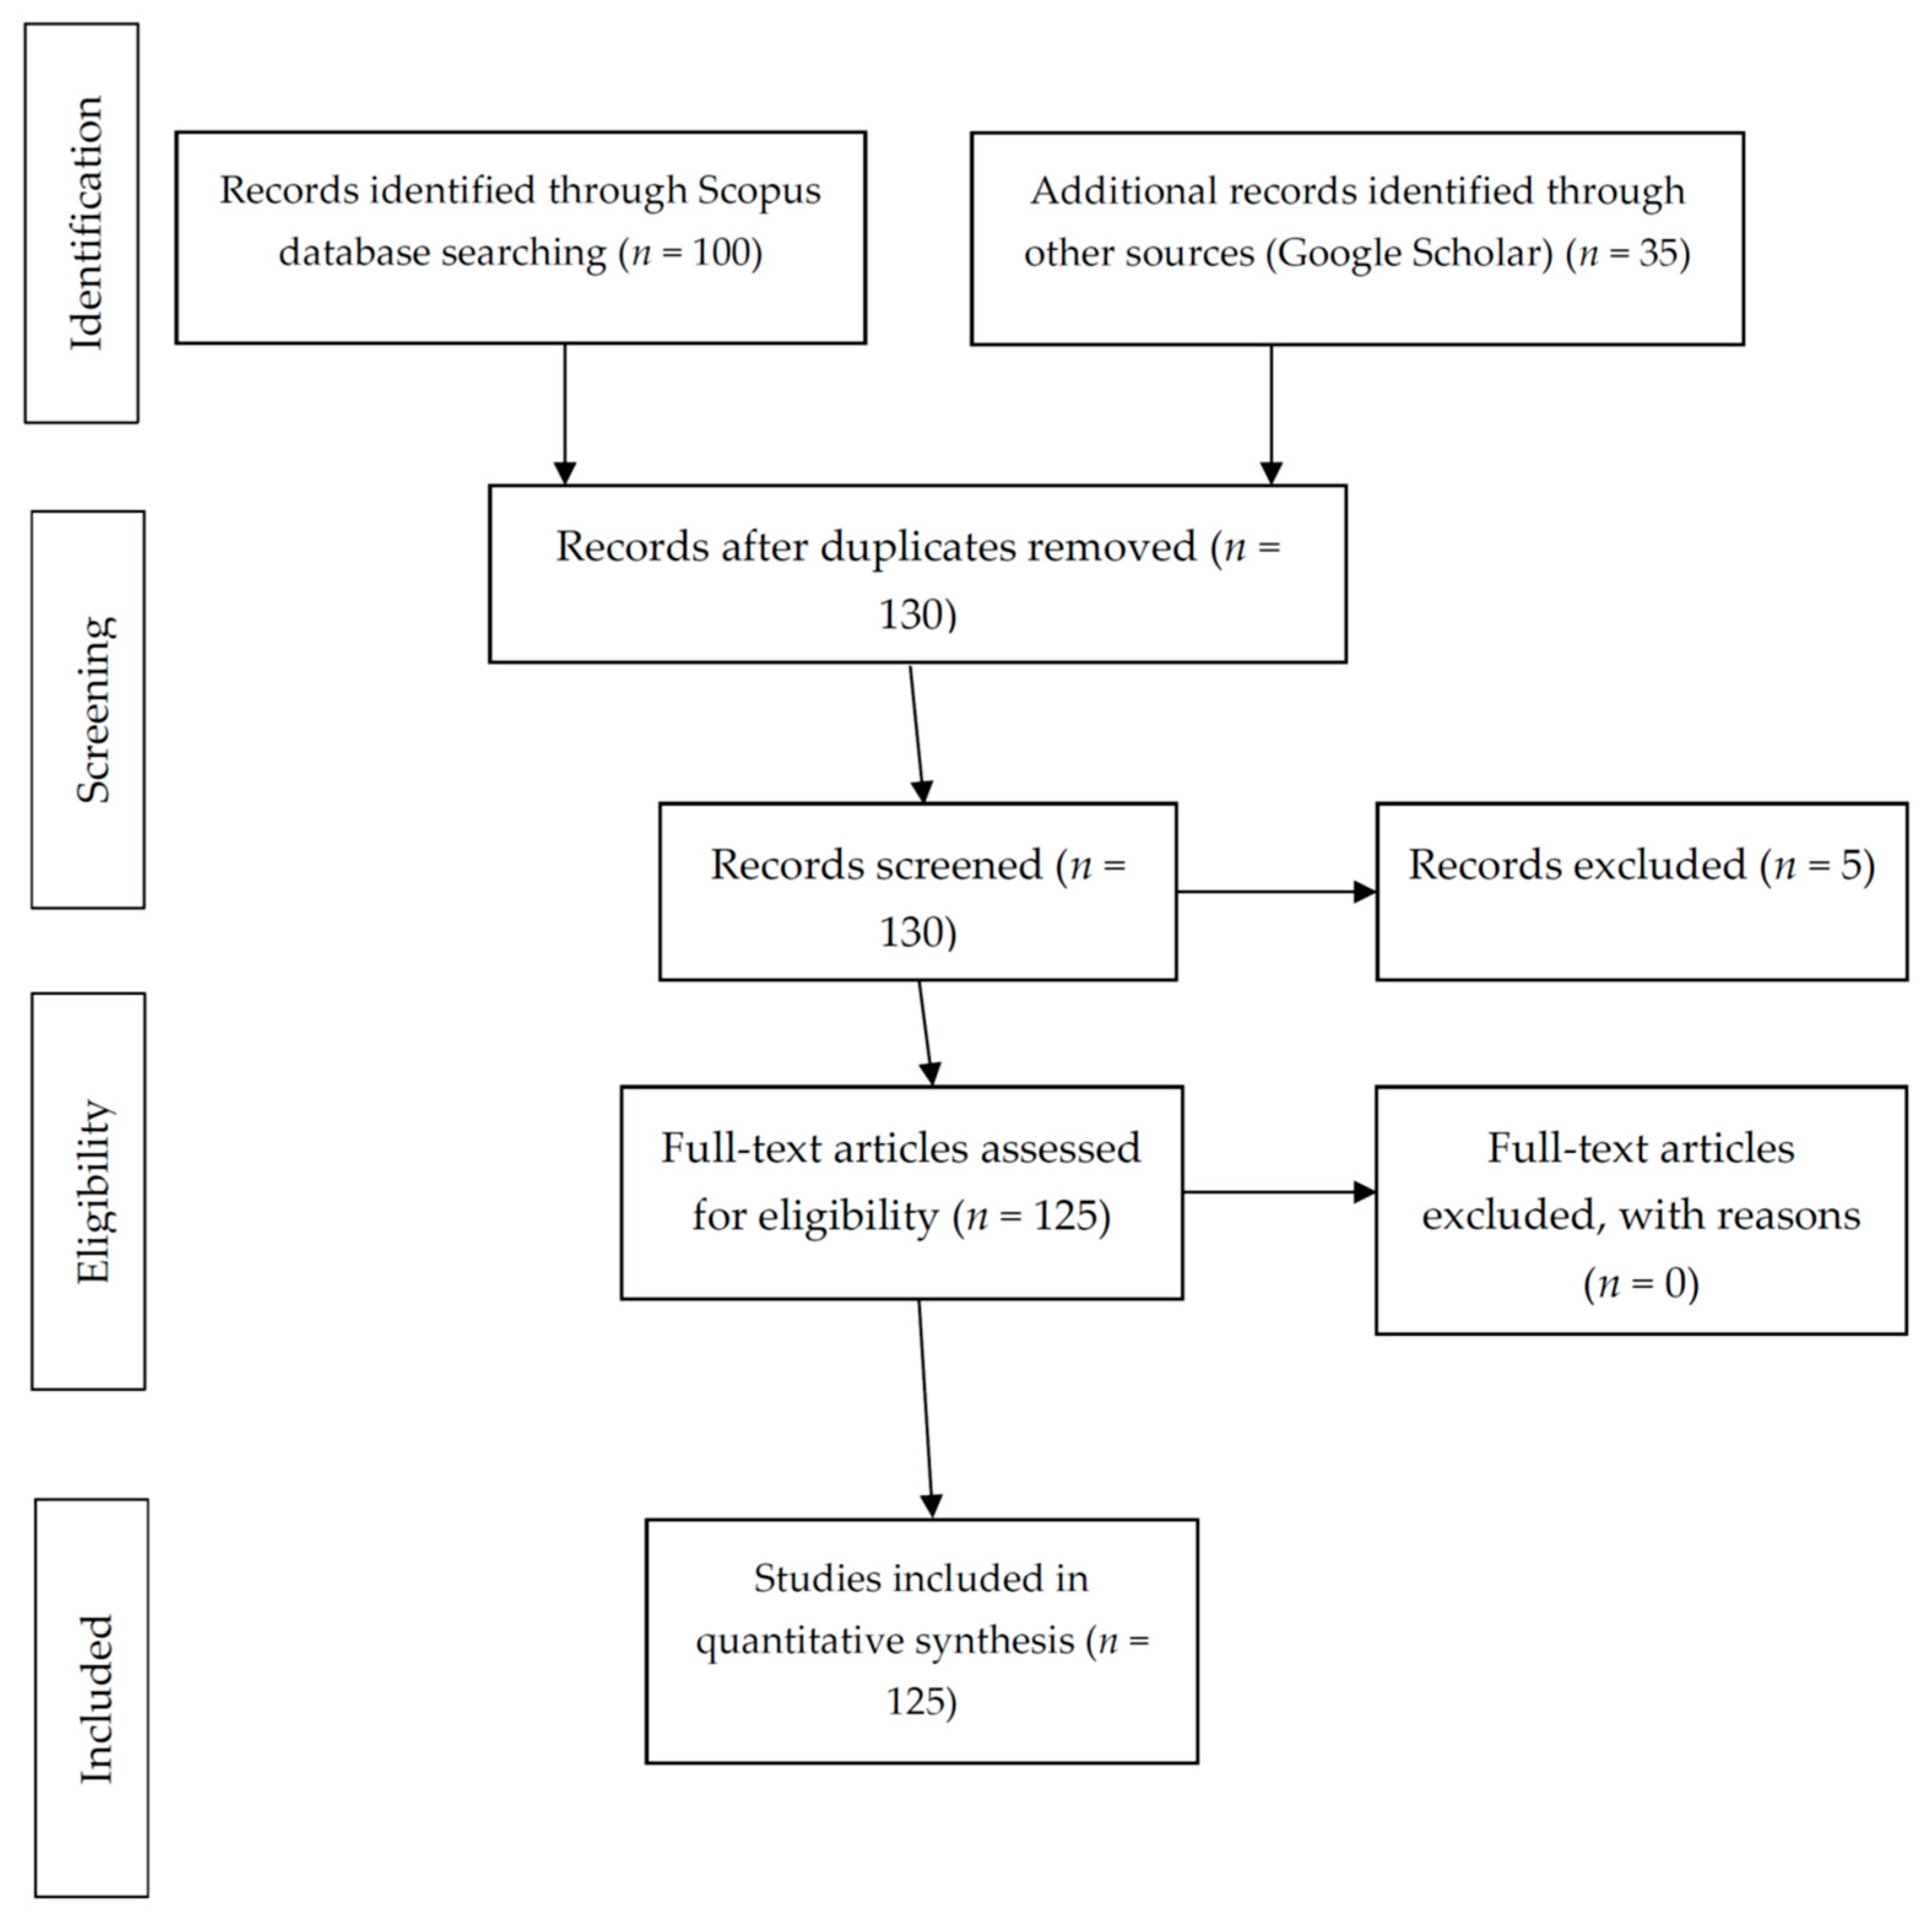
2. Materials and Methods
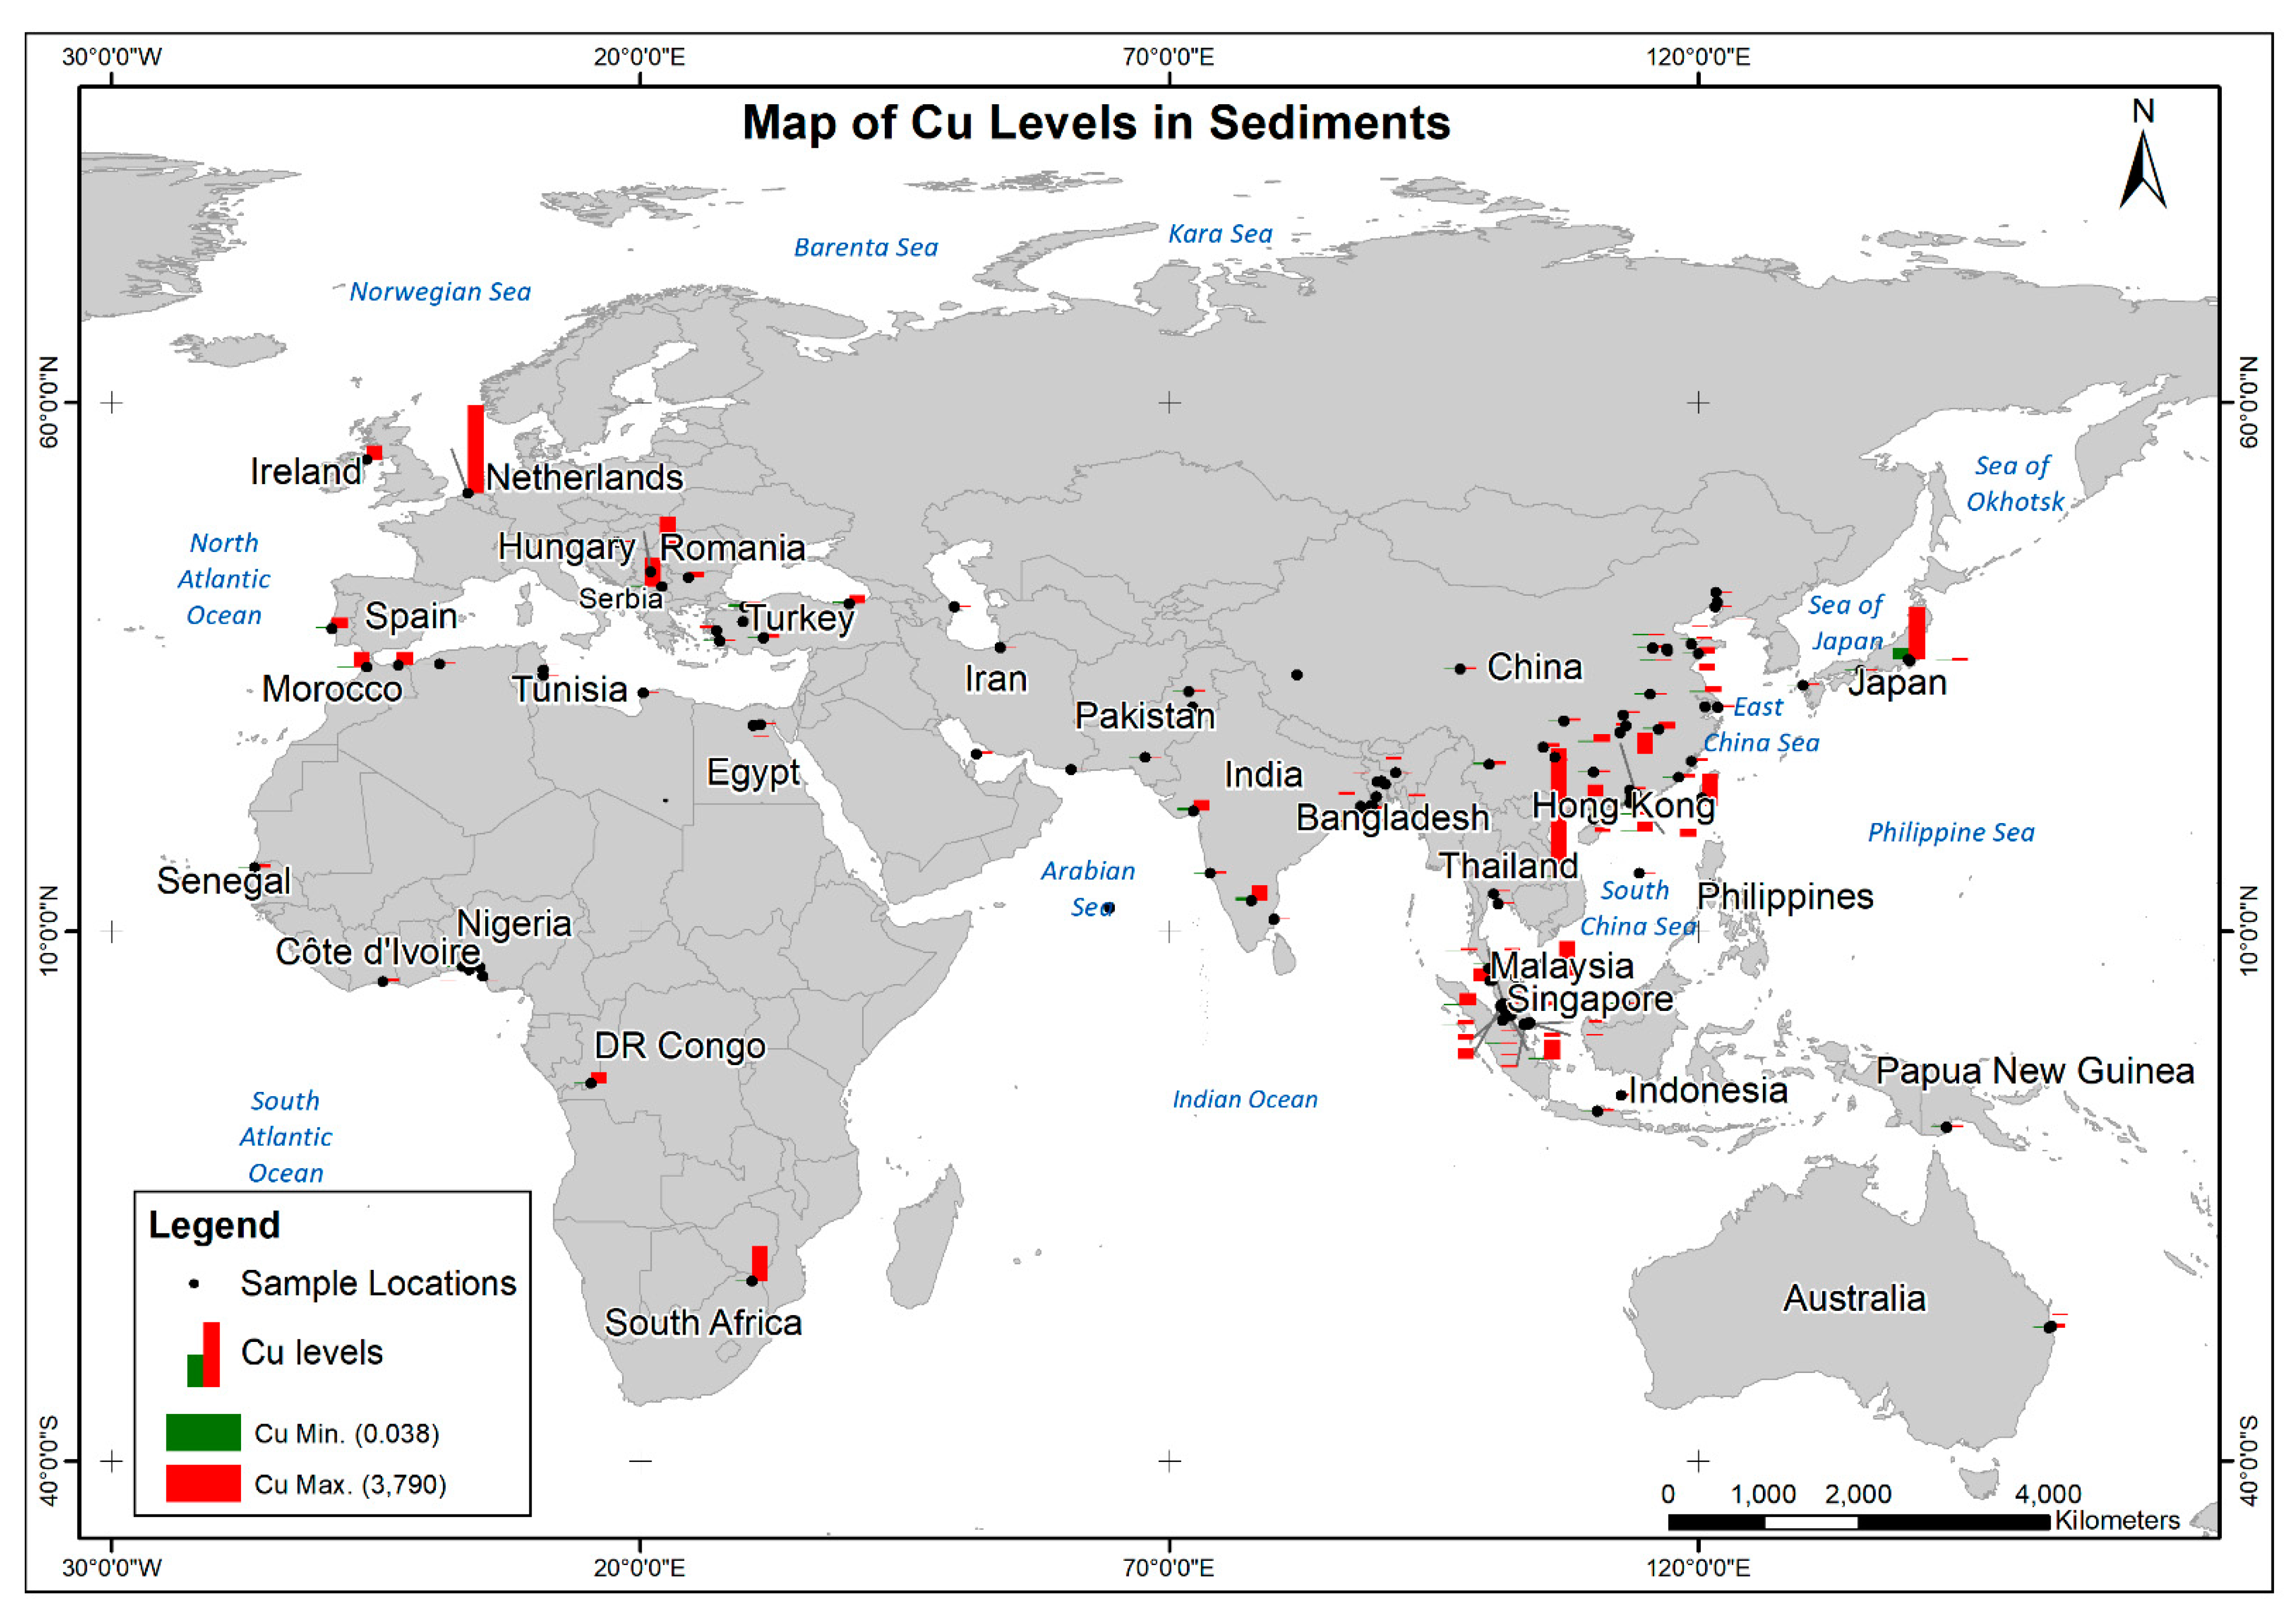
2.1. Data Collection
2.2. Data Treatment
2.2.1. Geoaccumulation Index
2.2.2. Ecological Risk Index
2.2.3. Human Health Risk Assessment
Data Analysis
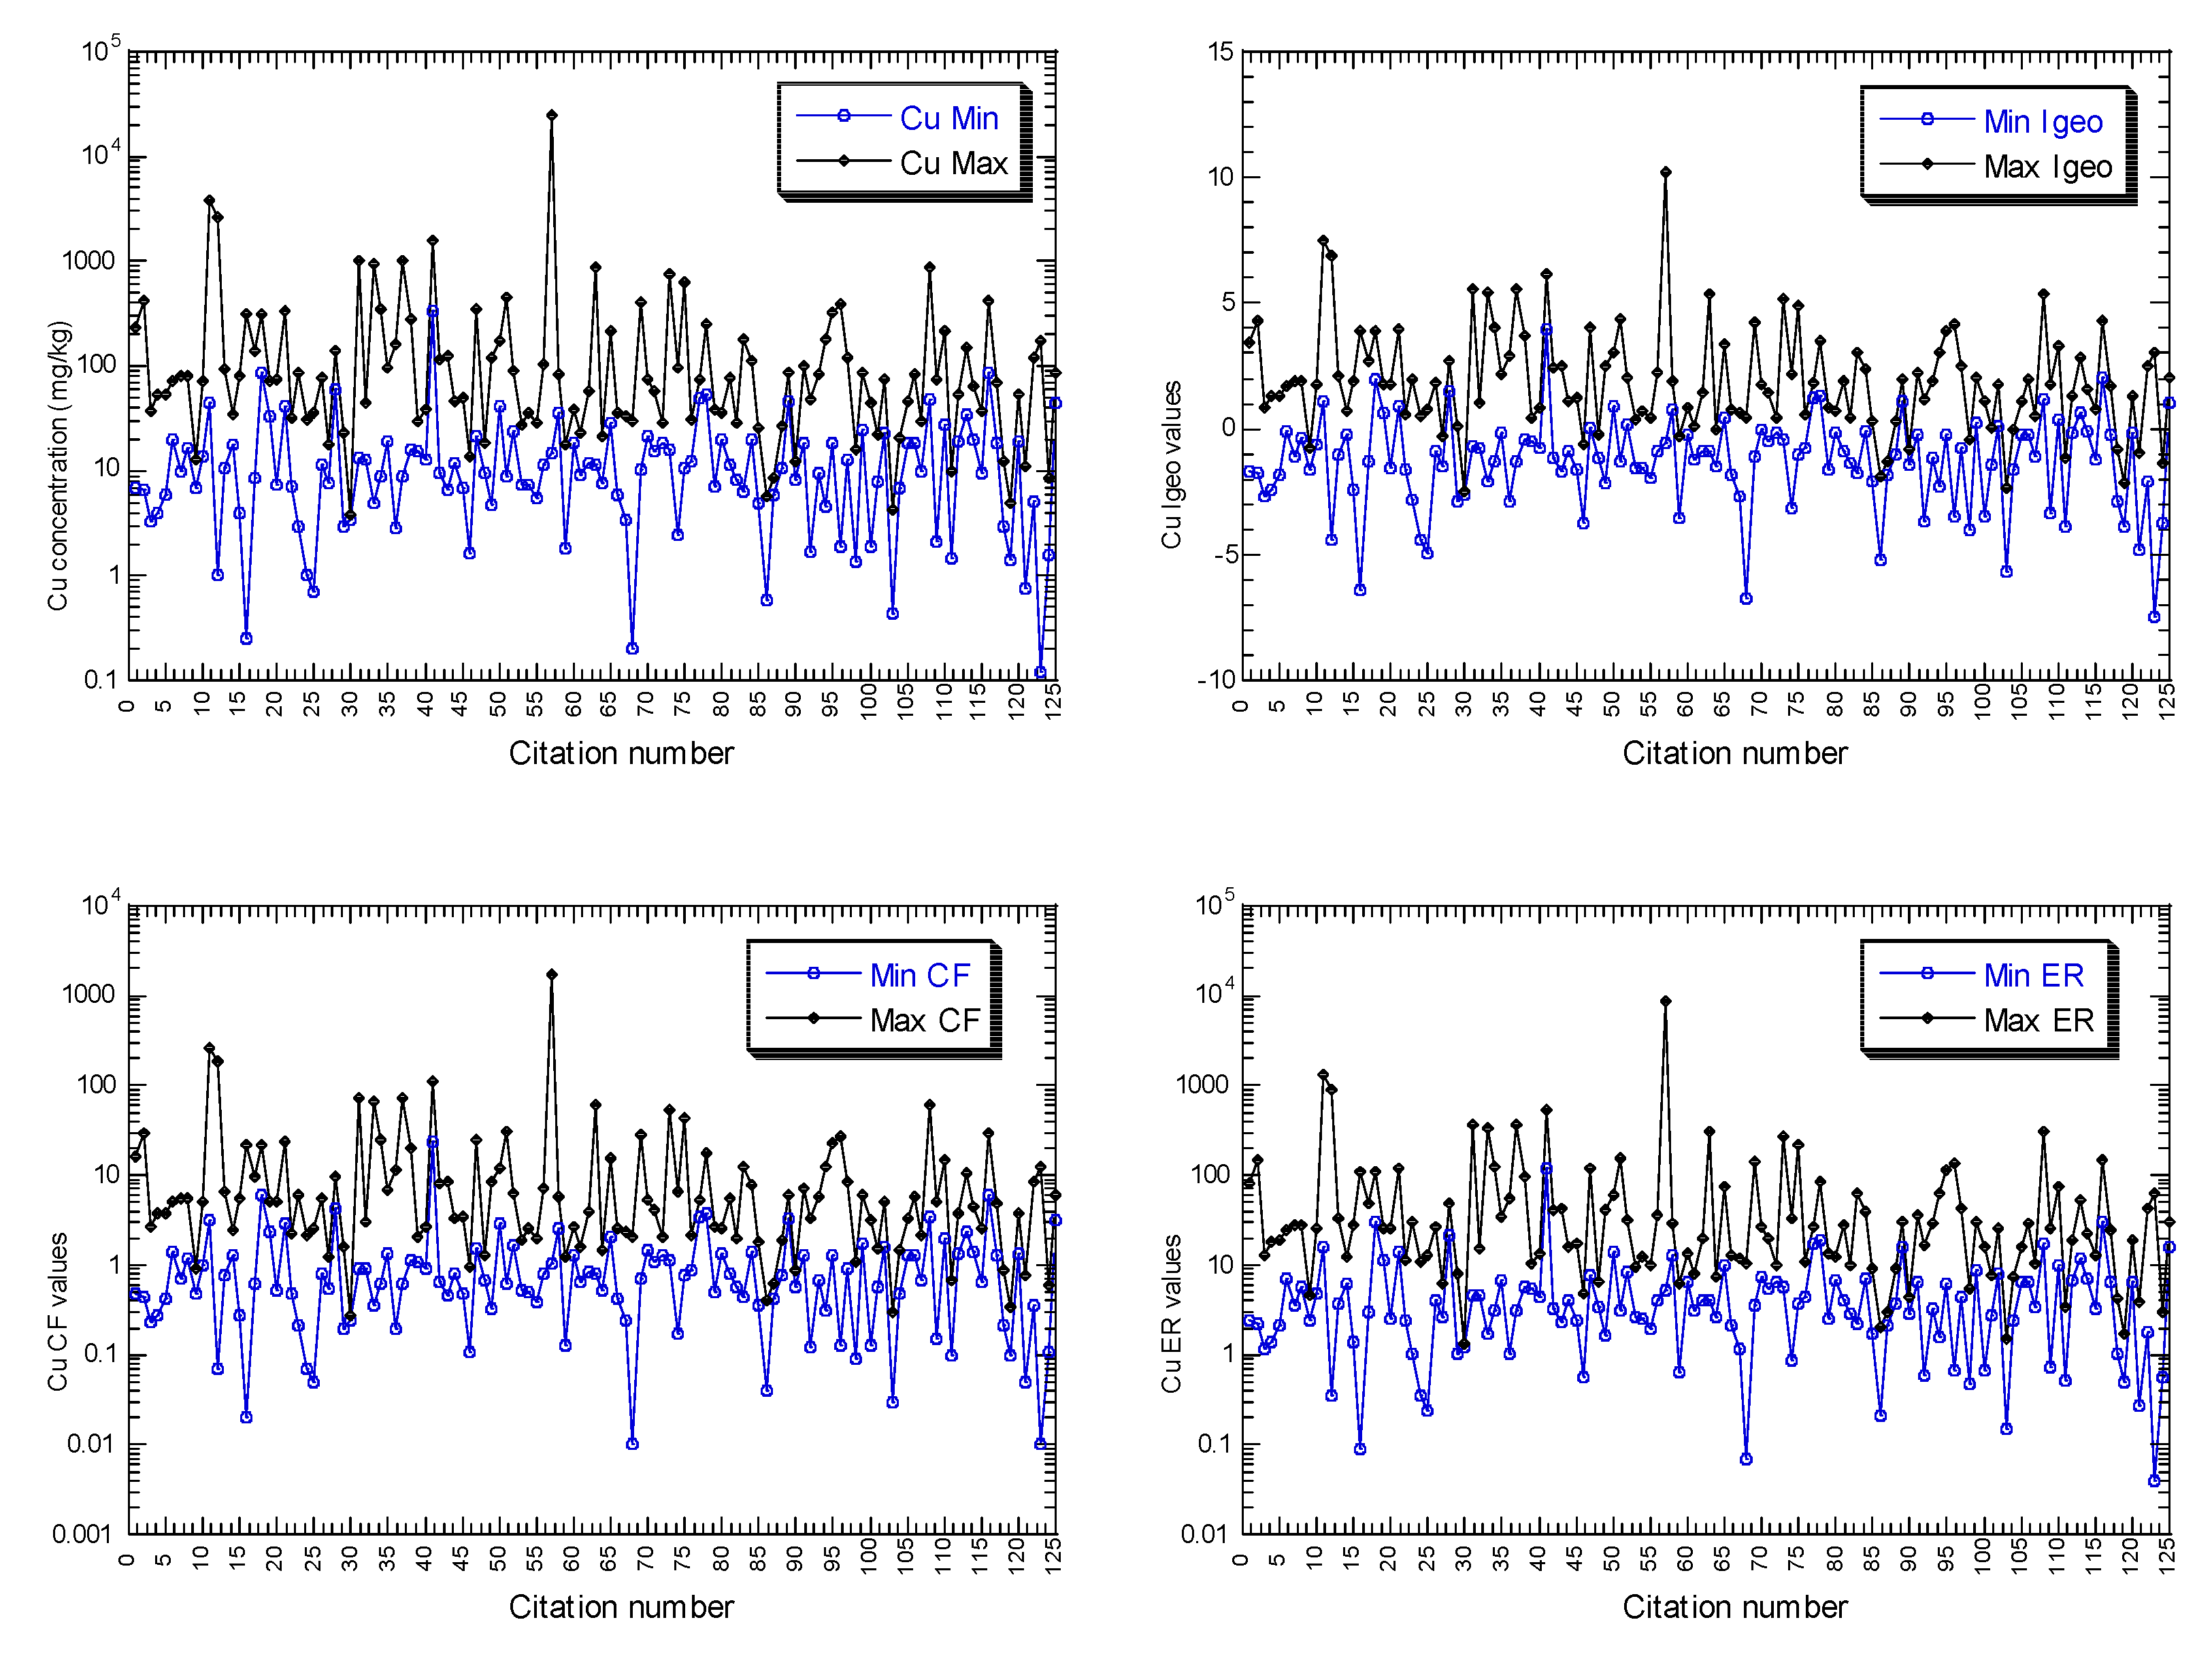
3. Results and Discussion
3.1. Ecological Risk Assessments
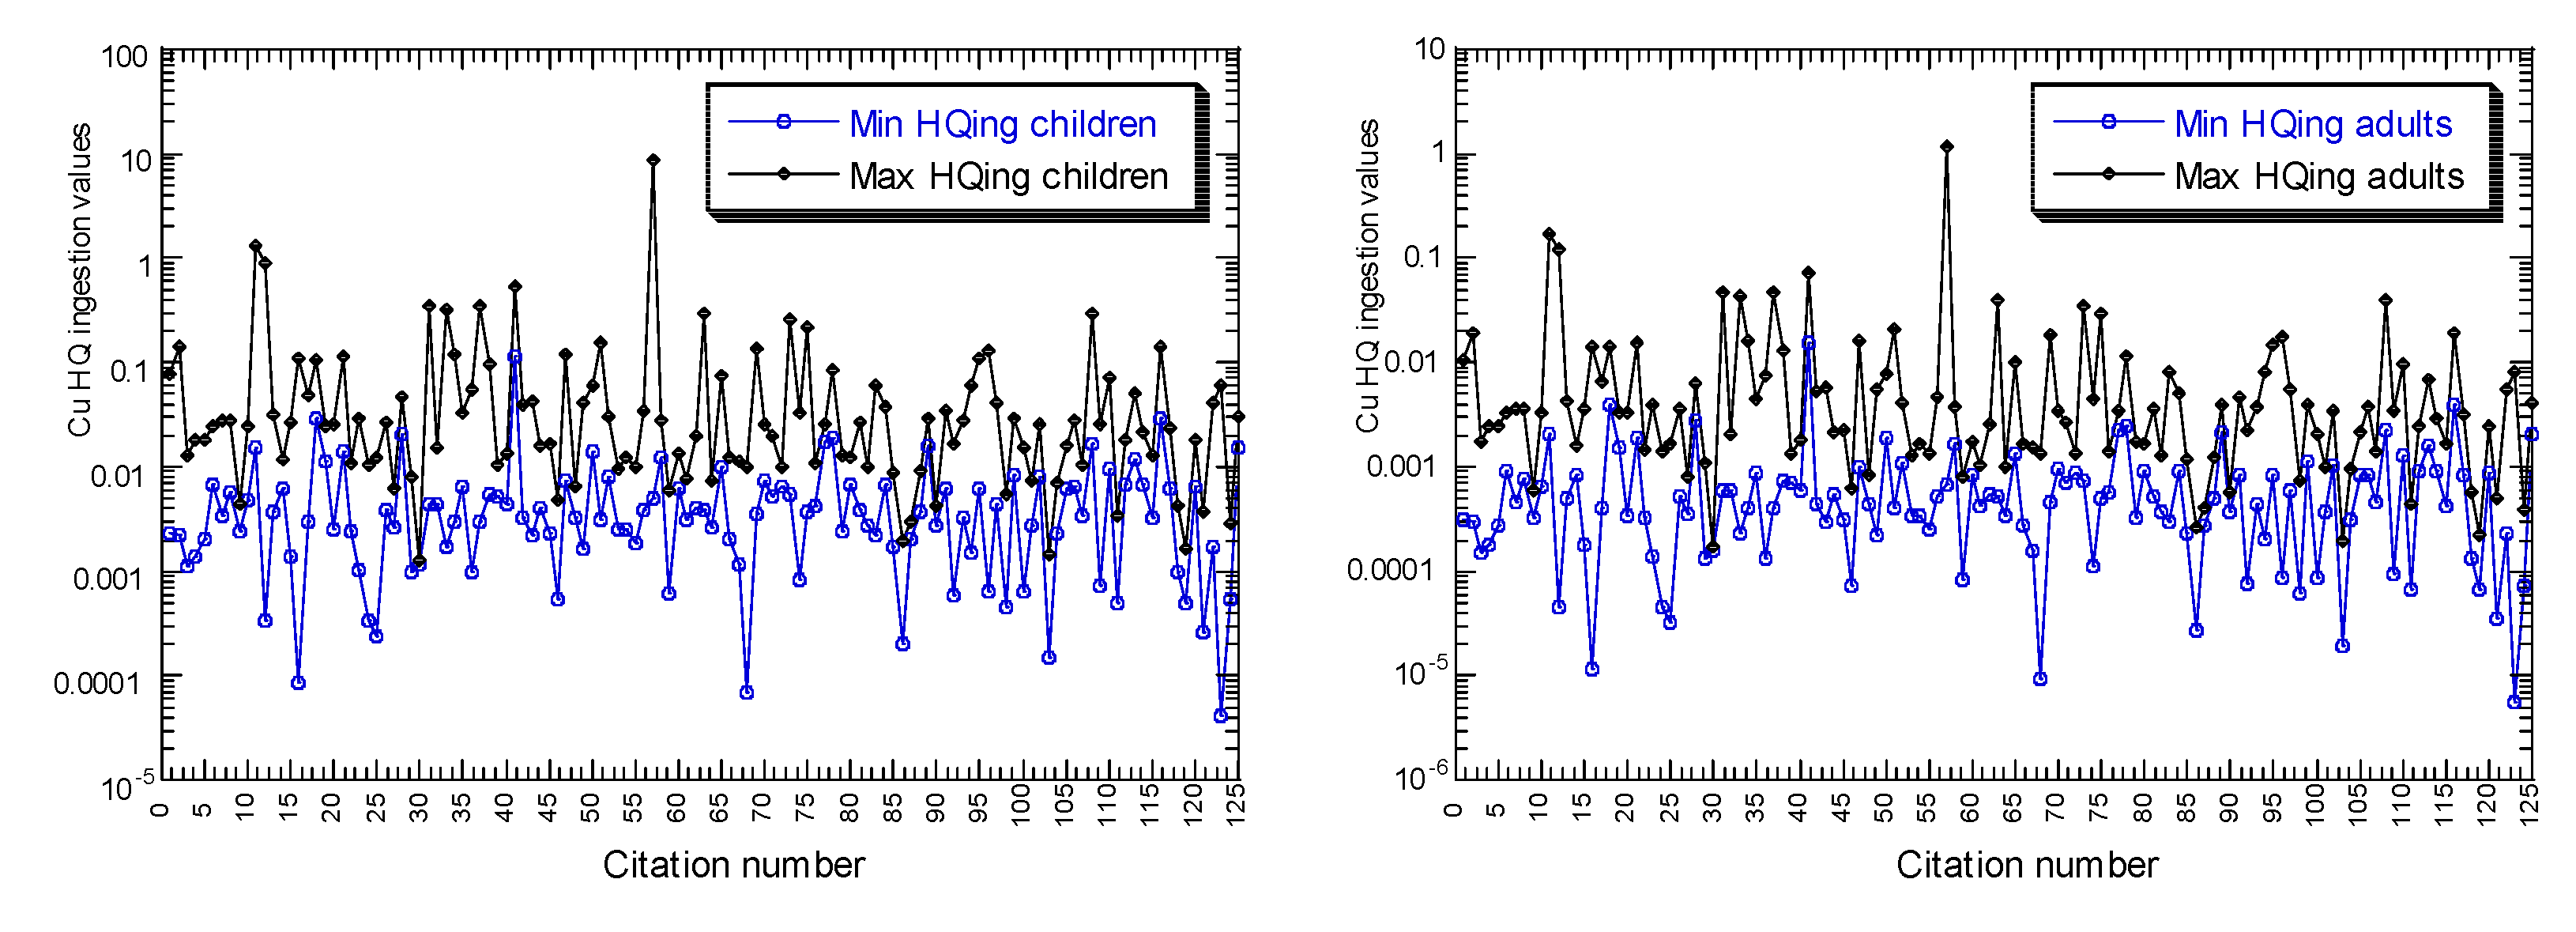
3.2. Health Risk Assessments
4. Comments on the Hazard Quotients of Children
5. Conclusions
Supplementary Materials
Author Contributions
Funding
Institutional Review Board Statement
Informed Consent Statement
Data Availability Statement
Conflicts of Interest
References
- Mudd, G.M.; Weng, Z.; Memary, R.; Northey, S.A.; Giurco, D.; Mohr, S.; Mason, L. Future Greenhouse Gas Emissions from Copper Mining: Assessing Clean Energy Scenarios. Prepared for CSIRO Minerals down under Flagship by Monash University and Institute for Sustainable Futures, UTS. 2012. Available online: https://opus.lib.uts.edu.au/bitstream/10453/32524/1/muddetal2012copperemissionscleanenergy.pdf (accessed on 1 June 2022).
- Memary, R.; Giurco, D.; Mudd, G.M.; Mason, L. Life Cycle Assessment: A Time-Series Analysis of Copper. J. Clean. Prod. 2012, 33, 97–108. [Google Scholar] [CrossRef]
- CCME (Canadian Council of Ministers of the Environment). Copper. In Canadian Soil Quality Guidelines for the Protection of Environmental and Human Health; Canadian Council of Ministers of the Environment: Winnipeg, MA, Canada, 1999. [Google Scholar]
- Costa-Böddeker, S.; Hoelzmann, P.; Thuyên, L.X.; Huy, H.D.; Nguyen, H.A.; Richter, O.; Schwalb, A. Ecological Risk Assessment of a Coastal Zone in Southern Vietnam: Spatial Distribution and Content of Heavy Metals in Water and Surface Sediments of the Thi Vai Estuary and Can Gio Mangrove Forest. Mar. Pollut. Bull. 2017, 114, 1141–1151. [Google Scholar] [CrossRef] [PubMed]
- Dung, T.T.T.; Linh, T.M.; Chau, T.B.; Hoang, T.M.; Swennen, R.; Cappuyns, V. Contamination Status and Potential Release of Trace Metals in a Mangrove Forest Sediment in Ho Chi Minh City, Vietnam. Environ. Sci. Pollut. Res. 2019, 26, 9536–9551. [Google Scholar] [CrossRef] [PubMed]
- Huong, N.T.L.; Masami, O.; Li, L.; Higashi, T.; Kanayama, M. Heavy Metal Contamination of River Sediments in Vietnam. Proc. Inst. Civ. Eng. Water Manag. 2010, 163, 111–121. [Google Scholar] [CrossRef]
- Phuong, N.M.; Kang, Y.; Sakurai, K.; Iwasaki, K.; Kien, C.N.; Van Noi, N.; Son, L.T. Levels and Chemical Forms of Heavy Metals in Soils from Red River Delta, Vietnam. Water. Air. Soil Pollut. 2010, 207, 319–332. [Google Scholar] [CrossRef]
- Yap, C.K. Sediment Watch: Monitoring, Ecological Risk Assessment and Environmental Management; Nova Science Publishers: New York, NY, USA, 2018. [Google Scholar]
- Sany, S.B.T.; Salleh, A.; Sulaiman, A.H.; Sasekumar, A.; Rezayi, M.; Monazami Tehrani, G. Heavy Metal Contamination in Water and Sediment of the Port Klang Coastal Area, Selangor, Malaysia. Environ. Earth Sci. 2012, 69, 2013–2025. [Google Scholar] [CrossRef]
- Yap, C.K.; Chew, W.; Al-Mutairi, K.A.; Nulit, R.; Ibrahim, M.H.; Wong, K.W.; Bakhtiari, A.R.; Sharifinia, M.; Ismail, M.S.; Leong, W.J.; et al. Assessments of the Ecological and Health Risks of Potentially Toxic Metals in the Topsoils of Different Land Uses: A Case Study in Peninsular Malaysia. Biology 2022, 11, 2. [Google Scholar] [CrossRef]
- Yap, C.K.; Al-Mutairi, K.A. Ecological-Health Risk Assessments of Heavy Metals (Cu, Pb, and Zn) in Aquatic Sediments from the ASEAN-5 Emerging Developing Countries: A Review and Synthesis. Biology 2022, 11, 7. [Google Scholar] [CrossRef]
- Luo, X.-S.; Ding, J.; Xu, B.; Wang, Y.-J.; Li, H.-B.; Yu, S. Incorporating Bioaccessibility into Human Health Risk Assessments of Heavy Metals in Urban Park Soils. Sci. Total Environ. 2012, 424, 88–96. [Google Scholar] [CrossRef]
- Xu, D.-M.; Fu, R.-B.; Liu, H.-Q.; Guo, X.-P. Current Knowledge from Heavy Metal Pollution in Chinese Smelter Contaminated Soils, Health Risk Implications and Associated Remediation Progress in Recent Decades: A Critical Review. J. Clean. Prod. 2020, 286, 124989. [Google Scholar] [CrossRef]
- Allen, J.R.L. Sedimentary Structures: Their Character and Physical Basis, Volume 1. Developments in Sedimentology; Elsevier: Amsterdam, The Netherlands, 1982; p. 593. [Google Scholar]
- Zhang, A.; Wang, L.; Zhao, S.; Yang, X.; Zhao, Q.; Zhang, X.; Yuan, X. Heavy metals in seawater and sediments from the northern Liaodong Bay of China: Levels, distribution and potential risks. Reg. Stud. Mar. Sci. 2017, 11, 32–42. [Google Scholar] [CrossRef]
- Zhu, Z.; Xue, J.; Deng, Y.; Chen, L.; Liu, J. Trace metal contamination in surface sediments of intertidal zone from Qinhuangdao, China, revealed by geochemical and magnetic approaches: Distribution, sources, and health risk assessment. Mar. Pollut. Bull. 2016, 105, 422–429. [Google Scholar] [CrossRef] [PubMed]
- Perrodin, Y.; Donguy, G.; Emmanuel, E.; Winiarski, T. Health risk assessment linked to filling coastal quarries with treated dredged seaport sediments. Sci. Total Environ. 2014, 485-486, 387–395. [Google Scholar] [CrossRef]
- Du, Y.; Gao, B.; Zhou, H.; Ju, X.; Hao, H.; Yin, S. Health risk assessment of heavy metals in road dusts in urban parks of Beijing, China. Procedia Environ. Sci. 2013, 18, 299–309. [Google Scholar] [CrossRef] [Green Version]
- Tepanosyan, G.; Maghakyan, N.; Sahakyan, L.; Saghatelyan, A. Heavy metals pollution levels and children health risk assessment of Yerevan kindergartens soils. Ecotoxicol. Environ. Saf. 2017, 142, 257–265. [Google Scholar] [CrossRef] [PubMed]
- Moher, D.; Liberati, A.; Tetzlaff, J.; Altman, D.G. PRISMA Group Preferred Reporting Items for Systematic Reviews and Meta-Analyses: The PRISMA Statement. PLoS Med. 2009, 6, e1000097. [Google Scholar] [CrossRef] [PubMed] [Green Version]
- Muller, G. Index of geoaccumulation in sediments of the Rhine River. Geojournal 1969, 2, 108–118. [Google Scholar]
- Wedepohl, K.H. The composition of the continental crust. Geochim. Cosmochim. Acta 1995, 59, 1217–1232. [Google Scholar] [CrossRef]
- Hakanson, L. An ecological risk index for aquatic pollution control. A sedimentary approach. Water Res. 1980, 14, 975–1001. [Google Scholar] [CrossRef]
- US EPA. Baseline Human Health Risk Assessment Vasquez Boulevard and I-70 Superfund Site Demver, Co; U.S. Environmental Protection Agency: Washington, DC, USA, 2001.
- US EPA. Exposure Factors Handbook (1997); EPA/600/P-95/002F; National Center for Environmental Assessment, US EPA Office of Research and Development: Washington, DC, USA, 1997.
- US EPA. Human Health Evaluation Manual. In Risk Assessment Guidance for Superfund; EPA/540/1-89/002; Office of Emergency and Remedial Response, U.S. Environmental Protection Agency: Washington, DC, USA, 1989; Volume 1. [Google Scholar]
- US EPA. Superfund Public Health Evaluation Manual; U.S. Environmental Protection Agency: Washington, DC, USA, 1986; pp. 1–86.
- Beijing Quality and Technology Supervision Bureau. Environmental Site Assessment Guideline; DB11/T 656-2009; Beijing Quality and Technology Supervision Bureau: Beijing, China, 2009.
- Barnes, D.G.; Dourson, M.; Dourson, M.; Preuss, P.; Barnes, D.G.; Bellin, J.; Derosa, C.; Engler, R.; Erdreich, L.; Farber, T.; et al. Reference Dose (RfD): Description and Use in Health Risk Assessments. Regul. Toxicol. Pharmacol. 1988, 8, 471–486. [Google Scholar] [CrossRef]
- Qing, X.; Yutong, Z.; Shenggao, L. Assessment of Heavy Metal Pollution and Human Health Risk in Urban Soils of Steel Industrial City (Anshan), Liaoning, Northeast China. Ecotoxicol. Environ. Saf. 2015, 120, 377–385. [Google Scholar] [CrossRef] [PubMed]
- Li, Z.; Ma, Z.; van der Kuijp, T.J.; Yuan, Z.; Huang, L. A Review of Soil Heavy Metal Pollution from Mines in China: Pollution and Health Risk Assessment. Sci. Total Environ. 2014, 468, 843–853. [Google Scholar] [CrossRef] [PubMed]
- Chabukdhara, M.; Nema, A.K. Heavy Metals Assessment in Urban Soil around Industrial Clusters in Ghaziabad, India: Probabilistic Health Risk Approach. Ecotoxicol. Environ. Saf. 2013, 87, 57–64. [Google Scholar] [CrossRef] [PubMed]
- Ferreira-Baptista, L.; De Miguel, E. Geochemistry and Risk Assessment of Street Dust in Luanda, Angola: A Tropical Urban Environment. Atmos. Environ. 2005, 39, 4501–4512. [Google Scholar] [CrossRef] [Green Version]
- Hu, X.; Zhang, Y.; Luo, J.; Wang, T.; Lian, H.; Ding, Z. Bioaccessibility and Health Risk of Arsenic, Mercury and Other Metals in Urban Street Dusts from a Mega-City, Nanjing, China. Environ. Pollut. 2011, 159, 1215–1221. [Google Scholar] [CrossRef]
- Kelepertzis, E. Investigating the Sources and Potential Health Risks of Environmental Contaminants in the Soils and Drinking Waters from the Rural Clusters in Thiva Area (Greece). Ecotoxicol. Environ. Saf. 2014, 100, 258–265. [Google Scholar] [CrossRef]
- Wong, M.H.; Ho, K.C.; Kwok, T.K. Degree of pollution of several major streams entering Tolo Harbour, Hong Kong. Mar. Pollut. Bull. 1980, 11, 36–40. [Google Scholar] [CrossRef]
- Manga, N.; Hanvey, W.; Byers, W.; Brown, J. Trace metal analysis of surficial sediments from Belfast Lough. Ir. Nat. J. 1982, 20, 425–429. [Google Scholar]
- Polprasert, C. Heavy metal pollution in the Chao Phraya River Estuary, Thailand. Water Res. 1982, 16, 775–784. [Google Scholar] [CrossRef]
- Subramanian, V.; Jha, P.K.; Van Grielen, R. Heavy metals in the Ganges Estuary. Mar. Pollut. Bull. 1988, 19, 290–293. [Google Scholar] [CrossRef]
- Everaarts, J.M. Heavy metals (Cu, Zn, Cd, Pb) in sediment of the Java Sea, estuarine and coastal areas of the East Java and some deep–sea areas. Neth. J Sea Res. 1989, 23, 403–413. [Google Scholar] [CrossRef]
- Baker, E.; Harris, P.T. Copper, lead and zinc distribution in the sediments of the Fly River Delta and Torres Straits. Mar. Pollut. Bull. 1991, 22, 614–618. [Google Scholar] [CrossRef]
- Sin, Y.M.; Wong, M.K.; Chou, L.M.; Normala, A. A study on heavy metal contents of the Singapore River. Environ. Monit. Assess. 1991, 19, 481–494. [Google Scholar] [CrossRef] [PubMed]
- Fukushima, K.; Saino, T.; Kodama, Y. Trace metal contamination in Tokyo Bay, Japan. Sci. Total Environ. 1992, 125, 373–389. [Google Scholar] [CrossRef]
- Ismail, A. Heavy metal concentration in sediment of Bintulu, Malaysia. Mar. Pollut. Bull. 1993, 26, 706–707. [Google Scholar] [CrossRef]
- Lim, P.E.; Kiu, M.Y. Determination and speciation of heavy metals in sediments of the Juru River, Penang, Malaysia. Environ. Monit. Assess. 1995, 35, 85–95. [Google Scholar] [CrossRef]
- Wong, Y.S.; Tam, N.F.Y.; Lau, P.S.; Xue, X.Z. The toxicity of marine sediment in Victoria Harbour, Hong Kong. Mar. Pollut. Bull. 1995, 31, 464–470. [Google Scholar] [CrossRef]
- Zwolsman, J.J.G.; Vaneck, G.T.M.; Burger, G. Spatial and temporal distribution of trace metals in sediments from the Scheldt estuarine, south–west Netherlands. Estuar. Coast. Shelf Sci. 1996, 43, 55–79. [Google Scholar] [CrossRef]
- Wood, A.K.; Ahmad, Z.; Shazili, N.A.; Yaakob, R.; Carpenter, R. Geochemistry of sediments in Johore Strait between Malaysia and Singapore. Continent. Shelf Res. 1997, 10, 1207–1228. [Google Scholar] [CrossRef]
- Fukue, M.; Nakamura, T.; Kato, Y.; Yamasaki, S. Degree of pollution for marine sediment. Eng. Geol. 1999, 53, 131–137. [Google Scholar] [CrossRef]
- Kucuksezgin, F. Distribution of trace metals in the surficial sediments of Izmir Bay (Turkey). Toxicol. Environ. Chem. 2001, 80, 203–207. [Google Scholar] [CrossRef]
- Yap, C.K.; Ismail, A.; Tan, S.G. Concentrations of Cu and Pb in the offshore and intertidal sediments of the west coast of Peninsular Malaysia. Environ. Int. 2002, 28, 467–479. [Google Scholar] [CrossRef]
- Cheung, K.C.; Poon, B.H.T.; Lan, C.Y.; Wong, M.H. Assessment of metal and nutrient concentrations in river water and sediment collected from the cities in the Pearl River Delta. South China. Chemosphere 2003, 52, 1431–1440. [Google Scholar] [CrossRef]
- Reddy, M.S.; Basha, S.; Kumar, V.G.S.; Joshi, H.V.; Ramachandraiah, G. Distribution, enrichment and accumulation of heavy metals in coastal sediments of Alang–Sosiya ship scrapping yard, India. Mar. Pollut. Bull. 2004, 48, 1055–1059. [Google Scholar] [CrossRef] [PubMed]
- Takarina, N.D.; David, R.B.; Micheal, J.R. Speciation of heavy metal in coastal sediments of Semarang, Indonesia. Mar. Pollut. Bull. 2004, 49, 854–874. [Google Scholar] [CrossRef]
- Ismail, A.; Yap, C.K.; Chan, F.F. Concentrations of Cd, Cu and Zn in sediments collected from urban lakes at Kelana Jaya, Peninsular Malaysia. Wetl. Sci. 2004, 2, 248–258. [Google Scholar]
- Morillo, J.; Usero, J.; Gracia, I. Heavy metal distribution in marine sediments from the southwest coast of Spain. Chemosphere 2004, 55, 431–442. [Google Scholar] [CrossRef]
- Cuong, D.T.; Bayen, S.; Wurl, O.; Subramanian, K.; Wong, K.K.S.; Sivasothi, N.; Obbard, J.P. Heavy metal contamination in mangrove habitats of Singapore. Mar. Pollut. Bull. 2005, 50, 1713–1744. [Google Scholar] [CrossRef]
- Kouadio, I.; Trefry, J.H. Sediment trace metal contamination in the Ivory Coast, West Africa. Water Air Soil Pollut. 1987, 32, 145–154. [Google Scholar] [CrossRef]
- Cox, M.E.; Preda, M. Trace metal distribution within marine and estuarine sediments of Western Moreton bay, Queensland, Australia: Relation to land use and setting. Geogr. Res. 2005, 43, 173–193. [Google Scholar] [CrossRef]
- Nguyen, H.L.; Leermakers, M.; Osán, J.; Török, S.; Baeyens, W. Heavy metals in Lake Balaton: Water column, suspended matter, sediment and biota. Sci. Total Environ. 2005, 340, 213–230. [Google Scholar] [CrossRef] [PubMed]
- Alagarsamy, R. Distribution and seasonal variation of trace metals in surface sediments of the Mandovi estuary west coast of India. Estuar. Coast. Shelf Sci. 2006, 67, 333–339. [Google Scholar] [CrossRef] [Green Version]
- Cuong, D.T.; Obbard, N. Metal speciation in coastal marine sediments from Singapore using a modified BCR sequential extraction procedure. Appl. Geochem. 2006, 21, 1335–1346. [Google Scholar] [CrossRef]
- Pekey, H. Heavy metal pollution assessment in sediments of Izmit Bay, Turkey. Environ. Monit. Assess. 2006, 123, 219–231. [Google Scholar] [CrossRef] [PubMed]
- Olubunnmi, F.E.; Olorunsola, O.E. Evaluation of the status of heavy metal pollution of sediment of Agbabu Bitumen Deposit Area, Nigeria. Eur. J. Sci. Res. 2010, 41, 373–382. [Google Scholar]
- Yap, C.K.; Choh, M.S.; Edward, F.B.; Ismail, A.; Tan, S.G. Comparison of heavy metal concentrations in surface sediment of Tanjung Piai wetland with other sites receiving anthropogenic inputs along the southwestern coast of Peninsular Malaysia. Wetl. Sci. 2006, 4, 48–57. [Google Scholar]
- Edokpayi, J.N.; Odiyo, J.O.; Popoola, O.E.; Msagati, T.A.M. Assessment of trace metals contamination of surface water and sediment: A case study of Mvudi River, South Africa. Sustanability 2016, 8, 135. [Google Scholar] [CrossRef] [Green Version]
- Bibi, M.H.; Ahmed, F.; Ishiga, H. Assessment of metal concentrations in lake sediments of southwest Japan based on sediment quality guidelines. Environ. Geol. 2007, 52, 625–639. [Google Scholar] [CrossRef]
- Chen, C.W.; Kao, C.M.; Chen, C.F.; Dong, C.D. Distribution and accumulation of heavy metals in sediments of Kaoshiung Harbor, Taiwan. Chemosphere 2007, 66, 1431–1440. [Google Scholar] [CrossRef]
- Li, Q.S.; Wu, Z.F.; Chu, B.; Zhang, N.; Czi, S.S.; Fang, J.H. Heavy metals in the coastal wetland sediments of the Pearl River Estuary, China. Environ. Pollut. 2007, 149, 158–164. [Google Scholar] [CrossRef]
- Zhang, L.; Ye, X.; Feng, H.; Jing, Y.; Ouyang, T.; Yu, X.; Liang, R.; Gao, C.; Chen, W. Heavy metal contamination in western Xiamen Bay sediments and its vicinity, China. Mar. Pollut. Bull. 2007, 54, 974–982. [Google Scholar] [CrossRef] [PubMed]
- Yap, C.K.; Ismail, A.; Low, C.H.; Tan, S.G. Interpretation of Cu and Zn contamination in the aquatic environment of Peninsular Malaysia with special reference to a polluted river, Sepang River. Wetl. Sci. 2007, 5, 311–321. [Google Scholar]
- Yap, C.K.; Pang, B.H.; Fairuz, M.S.; Hoo, Y.I.; Tan, S.G. Heavy metal (Cd, Cu, Ni, Pb and Zn) pollution in surface sediments collected from drainages receiving different anthropogenic sources from Peninsular Malaysia. Wetl. Sci. 2007, 5, 97–104. [Google Scholar]
- Chloe, W.Y.T.; Carman, C.I.; Zhang, G.; Paul, K.S.S.; Qian, P.; Xiang-dong, L. The spatial and temporal distribution of heavy metals in sediments of Victoria Harbour, Hong Kong. Mar. Pollut. Bull. 2008, 57, 816–825. [Google Scholar]
- Arain, M.B.; Kazi, T.G.; Jamali, M.K.; Jalbani, N.; Afridi, H.I.; Baig, J.A. Speciation of heavy metals in sediment by conventional, ultrasound and microwave assisted single extraction methods: A comparison with modified sequential extraction procedure. J. Hazard. Mater. 2008, 154, 998–1006. [Google Scholar] [CrossRef] [PubMed]
- Yap, C.K.; Cheng, W.H.; Tan, S.G. Comparative studies of concentrations of Cu and Zn in the surface intertidal sediments collected from east, south and west coasts of Peninsular Malaysia. Asian J. Water Environ. Pollut. 2008, 5, 23–29. [Google Scholar]
- Zakir, H.M.; Shikazono, N.; Otomo, K. Geochemical distribution of trace metals and assessment of anthropogenic pollution in sediments of Old Nakagawa River, Tokyo, Japan. Am. J. Environ. Sci. 2008, 4, 654–665. [Google Scholar] [CrossRef]
- Yap, C.K.; Wong, C.H. Assessment Cu, Ni and Zn pollution in the surface sediments in the southern Peninsular Malaysia using cluster analysis, ratios of geochemical nonresistant to resistant fractions, and geochemical indices. Environ. Asia 2011, 4, 53–61. [Google Scholar]
- Yap, C.K.; Fairuz, M.S.; Cheng, W.H. How elevated of Cd, Cu and Pb levels in the surface sediments collected from drainage receiving metal industrial effluents? Comparison with metal industrial drainage and intertidal sediments in Selangor, Malaysia. Asian J. Microbiol. Biotechnol. Environ. Sci. 2008, 10, 385–391. [Google Scholar]
- An, Q.; Wu, Y.; Wang, J.; Li, Z. Heavy metals and polychlorinated biphenyls in sediments of the Yangtze river estuary, China. Environ. Earth Sci. 2009, 59, 363–370. [Google Scholar] [CrossRef]
- Zhang, W.; Feng, H.; Chang, J.; Qu, J.; Xie, H.; Yu, X. Heavy metal contamination in surface sediments of Yangtze River intertidal zone: An assessment from different indexes. Environ. Pollut. 2009, 157, 1533–1543. [Google Scholar] [CrossRef] [PubMed]
- Amin, B.; Ismail, A.; Arshad, A.; Yap, C.K.; Kamarudin, M.S. Anthropogenic impacts on heavy metal concentrations in the coastal sediments of Dumai, Indonesia. Environ. Monit. Assess. 2009, 148, 291–305. [Google Scholar] [CrossRef] [PubMed]
- Yap, C.K.; Yazdani, M.; Tan, S.G. The importance of the identification of point sources in a river receiving industrial metal effluents at the Serdang Industrial Area, Selangor. J. Sustain. Sci. Manag. 2009, 4, 18–26. [Google Scholar]
- Pradit, S.; Wattayakorn, G.; Angsupanich, S.; Leemaker, M.; Baeyens, W. Distribution of trace elements in sediments and biota of Songkhla Lake, southern Thailand. Water Air Soil Pollut. 2010, 206, 155–174. [Google Scholar] [CrossRef]
- Yap, C.K.; Pang, B.H. Assessment of Cu, Pb and Zn contamination in sediment of north western Peninsular Malaysia by using sediment quality values and different geochemical indices. Environ. Monit. Assess. 2011, 183, 23–39. [Google Scholar] [CrossRef]
- Mei, J.; Li, Z.; Sun, L.; Gui, H.; Wang, X. Assessment of heavy metals in the urban river sediments in Suzhou city, northern Anhui Province, China. Procedia Environ. Sci. 2011, 10, 547–2553. [Google Scholar] [CrossRef] [Green Version]
- Sahli, L.; Afri–Mehennaoui, F.Z.; El Okki, M.E.H.; Blaise, C.; Mehennaoui, S. Spatial and seasonal variations and ecotoxicological significance of sediment trace metal concentrations in Kebir–Rhumel basin (Northeast of Algeria). Water Sci. Technol. 2011, 64, 1759–1766. [Google Scholar] [CrossRef] [Green Version]
- Aktumsek, A.; Gezgin, S. Seasonal variations of metal concentrations in muscle tissue of tench (Tinca tinca), water and sediment in Beysehir Lake (Turkey). Environ. Tech. 2011, 32, 1479–1485. [Google Scholar] [CrossRef]
- Sany, B.T.; Sulaiman, A.; Monazami, G.; Salleh, A. Assessment of sediment quality according to heavy metal status in the West Port of Malaysia. World Acad. Sci. Eng. Technol. 2011, 74, 639–643. [Google Scholar]
- Jamil, T.; Lias, K.; Hanif, H.; Norsila, D.; Aeisyah, A.; Kamaruzzaman, B. The spatial variability of heavy metals concentrations and sedimentary organicmatter in estuary sediment of Sungai Perlis, Perlis, Malaysia. Sci. Postprint 2014, 1, e00016. [Google Scholar]
- Cheng, W.H.; Yap, C.K. Potential human health risks from toxic metals via mangrove snail consumption and their ecological risk assessments in the habitat sediment from Peninsular Malaysia. Chemosphere 2015, 135, 156–165. [Google Scholar] [CrossRef] [PubMed]
- Antizar–Ladislao, B.; Mondal, P.; Mitra, S.; Sarkar, S.K. Assessment of trace metal contamination level and toxicity in sediments from coastal regions of West Bengal, eastern part of India. Mar. Pollut. Bull. 2015, 101, 886–894. [Google Scholar] [CrossRef] [PubMed]
- Ioannides, K.; Stamoulis, K.; Papachristodoulou, C.; Tziamou, E.; Markantonaki, C.; Tsodoulos, I. Distribution of heavy metals in sediment cores of Lake Pamvotis (Greece): A pollution and potential risk assessment. Environ. Monit. Assess. 2015, 187, 4209. [Google Scholar] [CrossRef] [PubMed]
- Kumar, A.; Ramanathan, A.L. Speciation of selected trace metals (Fe, Mn, Cu and Zn) with depth in the sediments of Sundarban mangroves: India and Bangladesh. J. Soils Sed. 2015, 15, 2476–2486. [Google Scholar] [CrossRef]
- Li, C.; Song, C.; Yin, Y.; Sun, M.; Tao, P.; Shao, M. Spatial distribution and risk assessment of heavy metals in sediments of Shuangtaizi estuary, China. Mar. Pollut. Bull. 2015, 98, 358–364. [Google Scholar] [CrossRef]
- Liu, H.; Liu, G.; Da, C.; Yuan, Z.; Wang, J. Concentration and fractionation of heavy metals in the old Yellow River Estuary, China. J. Environ. Qual. 2015, 44, 174–182. [Google Scholar] [CrossRef]
- Nasr, S.M.; Okbah, M.A.; El Haddad, H.S.; Soliman, N.F. Fractionation profile and mobility pattern of metals in sediments from the Mediterranean Coast, Libya. Environ. Monit. Assess. 2015, 187, 8. [Google Scholar] [CrossRef]
- Ren, J.; Shang, Z.; Tao, L.; Wang, X. Multivariate analysis and heavy metals pollution evaluation in Yellow river surface sediments. Polish J. Environ. Stud. 2015, 24, 1041–1048. [Google Scholar]
- Sakan, S.M.; Sakan, N.M.; Dordevic, D.S. Pollution characteristics and potential ecological risk assessment of heavy metals in river sediments based on calculation of pollution indices. Adv. Environ. Res. 2015, 41, 63–84. [Google Scholar]
- Zhang, J.; Gao, X. Heavy metals in surface sediments of the intertidal Laizhou Bay, Bohai Sea, China: Distributions, sources and contamination assessment. Mar. Pollut. Bull. 2015, 98, 320–327. [Google Scholar] [CrossRef]
- Zhang, G.; Xie, Y.; Mo, Y. Spatial distribution characteristics and potential ecological risk assessment of heavy metals in typical water surface sediments of Dongting Lake. Res. Environ. Sci. 2015, 28, 1545–1552. [Google Scholar]
- Qiao, S.; Shi, X.; Fang, X.; Liu, S.; Kornkanitnan, N.; Gao, J.; Zhu, A.; Hu, L.; Yu, Y. Heavy metal and clay mineral analyses in the sediments of Upper Gulf of Thailand and their implications on sedimentary provenance and dispersion pattern. J. Asian Earth Sci. 2015, 114, 488–496. [Google Scholar] [CrossRef]
- Liu, J.; Ma, K.; Qu, L. Ecological risk assessments and context–dependence analysis of heavy metal contamination in the sediments of mangrove swamp in Leizhou Peninsula, China. Mar. Pollut. Bull. 2015, 100, 224–230. [Google Scholar] [CrossRef] [PubMed]
- Mahu, E.; Nyarko, E.; Hulme, S.; Coale, K.H. Distribution and enrichment of trace metals in marine sediments from the Eastern equatorial Atlantic, off the coast of Ghana in the Gulf of Guinea. Mar. Pollut. Bull. 2015, 98, 301–307. [Google Scholar] [CrossRef]
- Maanan, M.; Saddik, M.; Maanan, M.; Chaibi, M.; Assobhei, O.; Zourarah, B. Environmental and ecological risk assessment of heavy metals in sediments of Nador lagoon, Morocco. Ecol. Ind. 2015, 48, 616–626. [Google Scholar] [CrossRef]
- Liang, A.; Wang, Y.; Guo, H.; Bo, L.; Zhang, S.; Bai, Y. Assessment of pollution and identification of sources of heavy metals in the sediments of Changshou Lake in a branch of the Three Gorges Reservoir. Environ. Sci. Pollut. Res. 2015, 22, 16067–16076. [Google Scholar] [CrossRef]
- Shang, Z.; Ren, J.; Tao, L.; Wang, X. Assessment of heavy metals in surface sediments from Gansu section of Yellow River, China. Environ. Monit. Assess. 2015, 187, 79. [Google Scholar] [CrossRef]
- Shang, Z.; Ren, J.; Zhao, Y.; Hao, J.; Guo, Y. Distribution, fraction and pollution assessment of metals in surface sediments from Yinchuan section of Yellow River, China. Fresenius Environ. Bull. 2015, 24, 4485–4491. [Google Scholar]
- Chen, C.F.; Ju, Y.R.; Chen, C.W.; Dong, C.D. Vertical profile, contamination assessment, and source apportionment of heavy metals in sediment cores of Kaohsiung Harbor, Taiwan. Chemosphere 2016, 165, 67–79. [Google Scholar] [CrossRef]
- Fang, H.; Chen, X.; Zhang, X.; Li, J.; Yang, H. Heavy metal pollution in the surface sediments from Minjiang River (Fuzhou Section) and urban rivers. Acta Sci. Circumstantiae 2016, 36, 1160–1168. [Google Scholar]
- Gao, L.; Wang, Z.; Shan, J.; Chen, J.; Tang, C.; Yi, M.; Zhao, X. Distribution characteristics and sources of trace metals in sediment cores from a trans–boundary watercourse: An example from the Shima River, Pearl River Delta. Ecotoxicol. Environ. Saf. 2016, 134, 186–195. [Google Scholar] [CrossRef] [PubMed]
- Kouidri, M.; Dali Youcef, N.; Benabdellah, I.; Ghoubali, R.; Bernoussi, A.; Lagha, A. Enrichment and geoaccumulation of heavy metals and risk assessment of sediments from coast of Ain Temouchent (Algeria). Arab. J. Geosci. 2016, 9, 354. [Google Scholar] [CrossRef]
- Li, R.; Xu, H.; Chai, M.; Qiu, G.Y. Distribution and accumulation of mercury and copper in mangrove sediments in Shenzhen, the world’s most rapid urbanized city. Environ. Monit. Assess. 2016, 188, 87. [Google Scholar] [CrossRef] [PubMed]
- Ozseker, K.; Seyhan, K.; Eruz, C. Ecological risk assessment and spatial distribution of heavy metals in sediment and pore water around Trabzon harbor, Turkey. Fresenius Environ. Bull. 2016, 25, 3125–3133. [Google Scholar]
- Xu, F.; Tian, X.; Yin, F.; Zhao, Y.; Yin, X. Heavy metals in the surface sediments of the northern portion of the South China Sea shelf: Distribution, contamination, and sources. Environ. Sci. Pollut. Res. 2016, 23, 8940–8950. [Google Scholar] [CrossRef]
- Yuan, H.; An, S.; Zhu, Z.; Pan, W. Speciation and bioavailability of heavy metals in sediments taken from wetland in the Huaihe River Basin. J. Environ. Eng. 2016, 142, C5015001. [Google Scholar] [CrossRef]
- Zhao, G.; Lu, Q.; Ye, S.; Yuan, H.; Ding, X.; Wang, J. Assessment of heavy metal contamination in surface sediments of the west Guangdong coastal region, China. Mar. Pollut. Bull. 2016, 108, 268–274. [Google Scholar] [CrossRef]
- Zohra, B.S.; Habib, A. Assessment of heavy metal contamination levels and toxicity in sediments and fishes from the Mediterranean Sea (southern coast of Sfax, Tunisia). Environ. Sci. Pollut. Res. 2016, 23, 13954–13963. [Google Scholar] [CrossRef]
- Liu, J.; Yang, T.; Chen, Q.; Liu, F.; Wang, B. Distribution and potential ecological risk of heavy metals in the typical eco-units of Haihe River Basin. Front. Environ. Sci. Eng. 2016, 10, 103–113. [Google Scholar] [CrossRef]
- Duodu, G.O.; Goonetilleke, A.; Ayoko, G.A. Comparison of pollution indices for the assessment of heavy metal in Brisbane River sediment. Environ. Pollut. 2016, 219, 1077–1091. [Google Scholar] [CrossRef]
- Agah, H.; Saleh, A.; Bastami, K.D.; Fumani, N.S. Ecological risk, source and preliminary assessment of metals in the surface sediments of Chabahar Bay, Oman Sea. Mar. Pollut. Bull. 2016, 107, 383–388. [Google Scholar] [CrossRef] [PubMed]
- El Zrelli, R.; Courjault–Radé, P.; Rabaoui, L.; Castet, S.; Michel, S.; Bejaoui, N. Heavy metal contamination and ecological risk assessment in the surface sediments of the coastal area surrounding the industrial complex of Gabes city, Gulf of Gabes, SE Tunisia. Mar. Pollut. Bull. 2016, 101, 922–929. [Google Scholar] [CrossRef] [PubMed]
- Hanif, N.; Shah Eqani, S.A.M.A.; Ali, S.M.; Cincinelli, A.; Ali, N.; Katsoyiannis, I.A.; Tanveer, Z.A.; Bokhari, H. Geo–accumulation and enrichment of trace metals in sediments and their associated risks in the Chenab River, Pakistan. J. Geochem. Explor. 2016, 165, 62–70. [Google Scholar] [CrossRef]
- Wang, J.; Du, H.; Xu, Y.; Chen, K.; Liang, J.; Ke, H.; Cheng, S.Y.; Liu, M.; Deng, H.; He, T.; et al. Environmental and ecological risk assessment of trace metal contamination in mangrove ecosystems: A case from Zhangjiangkou Mangrove National Nature Reserve, China. BioMed Res. Int. 2016, 2016, 2167053. [Google Scholar] [CrossRef] [PubMed] [Green Version]
- Zhuo, H.H.; Sun, Z.W.; Tan, L.Z.; Wu, Y.L.; Lan, J. Temporal and spatial variation characteristics of the heavy metals content in the surface sediment and the potential ecological risk trends in the Three Gorges Reservoir area. Environ. Sci. 2016, 37, 4633–4643. [Google Scholar]
- Ghorbanzadeh, Z.S.; Machinchian, M.A.; Mousavi, N.R.; Sari, A.R.; Fatemi, S.M.R. Distribution pattern of heavy metals in the surficial sediment of Gorgan Bay (South Caspian Sea, Iran). Iran. J. Fish. Sci. 2016, 15, 1144–1166. [Google Scholar]
- Hossen, M.Z.; Islam, M.M.; Hossain, M.S. Heavy Metal Contents in Sediments of an Urban Industrialized Area—A Case Study of Tongi Canal, Bangladesh. Asian J. Water Environ. Pollut. 2017, 14, 59–68. [Google Scholar] [CrossRef]
- Li, H.; Ye, S.; Ye, J.; Fan, J.; Gao, M.; Guo, H. Baseline survey of sediments and marine organisms in Liaohe Estuary: Heavy metals, polychlorinated biphenyls and organochlorine pesticides. Mar. Pollut. Bull. 2017, 114, 555–563. [Google Scholar] [CrossRef]
- Liu, J.; Xu, Y.; Cheng, Y.; Zhao, Y.; Pan, Y.; Fu, G.; Dai, Y. Occurrence and risk assessment of heavy metals in sediments of the Xiangjiang River, China. Environ. Sci. Pollut. Res. 2017, 24, 2711–2723. [Google Scholar] [CrossRef]
- Xu, F.; Liu, Z.; Cao, Y.; Qiu, L.; Feng, J.; Xu, F.; Tian, X. Assessment of heavy metal contamination in urban river sediments in the Jiaozhou Bay catchment, Qingdao, China. Catena 2017, 150, 9–16. [Google Scholar] [CrossRef]
- Kilunga, P.I.; Sivalingam, P.; Laffite, A.; Grandjean, D.; Mulaji, C.K.; de Alencastro, L.F.; Mpiana, P.T.; Pot, J. Accumulation of toxic metals and organic micro–pollutants in sediments from tropical urban rivers, Kinshasa, Democratic Republic of the Congo. Chemosphere 2017, 179, 37–48. [Google Scholar] [CrossRef] [PubMed] [Green Version]
- Khodami, S.; Surif, M.; Wan Maznah, W.O.; Daryanabard, R. Assessment of heavy metal pollution in surface sediments of the Bayan Lepas area, Penang, Malaysia. Mar. Pollut. Bull. 2017, 114, 615–622. [Google Scholar] [CrossRef] [PubMed]
- Diop, C.; Dewaele, D.; Cazier, F.; Diouf, A.; Ouddane, B. Assessment of trace metals contamination level, bioavailability and toxicity in sediments from Dakar coast and Saint Louis estuary in Senegal, West Africa. Chemosphere 2015, 138, 980–987. [Google Scholar] [CrossRef] [PubMed]
- Kumar, S.B.; Padhi, R.K.; Mohanty, A.K.; Satpathy, K.K. Elemental distribution and trace metal contamination in the surface sediment of south east coast of India. Mar. Pollut. Bull. 2017, 114, 1164–1170. [Google Scholar] [CrossRef]
- Pourkerman, M.; Amjadi, S.; Beni, A.N.; Lahijani, H.; Mehdinia, A. Evaluation of metal contamination in the Mand River delta, Persian Gulf. Mar. Pollut. Bull. 2017, 119, 261–267. [Google Scholar] [CrossRef]
- Kusin, F.M.; Azani, N.N.M.; Hasan, S.N.M.S.; Sulong, N.A. Distribution of heavy metals and metalloid in surface sediments of heavily-mined area for bauxite ore in Pengerang, Malaysia and associated risk assessment. Catena 2018, 165, 454–464. [Google Scholar] [CrossRef]
- Gholizadeh, M.; Patimar, R. Ecological risk assessment of heavy metals in surface sediments from the Gorgan Bay, Caspian Sea. Mar. Pollut. Bull. 2018, 137, 662–667. [Google Scholar] [CrossRef]
- Wang, G.; Hu, X.; Zhu, Y.; Jiang, H.; Wang, H. Historical accumulation and ecological risk assessment of heavy metals in sediments of a drinking water lake. Environ. Sci. Pollut. Res. 2018, 25, 24882–24894. [Google Scholar] [CrossRef]
- Proshad, R.; Islam, M.S.; Kormoker, T.; Masud, M.E.M.; Ali, M.M. Assessment of toxic metals contamination with ecological risk of surface water and sediment of Korotoa River in Bangladesh. Int. J. Adv. Geosci. 2018, 6, 214–221. [Google Scholar] [CrossRef]
- Enuneku, A.; Omoruyi, O.; Tongo, I.; Ogbomida, E.; Ogbeide, O.; Ezemonye, L. Evaluating the potential health risks of heavy metal pollution in sediment and selected benthic fauna of Benin River, Southern Nigeria. Appl. Water Sci. 2018, 8, 224. [Google Scholar] [CrossRef] [Green Version]
- Javed, T.; Ahmad, N.; Mashiatullah, A. Heavy Metals Contamination and Ecological Risk Assessment in Surface Sediments of Namal Lake, Pakistan. Pol. J. Environ. Stud. 2018, 27, 675–688. [Google Scholar] [CrossRef]
- Proshad, R.; Kormoker, T.; Islam, S. Distribution, source identification, ecological and health risks of heavy metals in surface sediments of the Rupsa River, Bangladesh. Toxin Rev. 2019, 40, 1135–1154. [Google Scholar] [CrossRef]
- Kormoker, T.; Proshad, R.; Islam, M.S. Ecological risk assessment of heavy metals in sediment of the Louhajang River, Bangladesh. SF J. Environ. Earth Sci. 2019, 2, 1030. [Google Scholar]
- Živković, N.; Takić, L.; Djordjević, L.; Djordjević, A.; Mladenović-Ranisavljević, I.; Golubović, T.; Božilov, A. Concentrations of heavy metal cations and a health risk assessment of sediments and river surface water: A case study from a Serbian mine. Pol. J. Environ. Stud. 2019, 28, 2009–2020. [Google Scholar] [CrossRef]
- Siddiqui, E.; Pandey, J. Assessment of heavy metal pollution in water and surface sediment and evaluation of ecological risks associated with sediment contamination in the Ganga River: A basin-scale study. Environ. Sci. Pollut. Res. 2019, 26, 10926–10940. [Google Scholar] [CrossRef] [PubMed]
- Wang, M.; Liu, J.; Lai, J. Metals pollution and ecological risk assessment of sediments in the Poyang Lake, China. Bull. Environ. Contam. Toxicol. 2019, 102, 511–518. [Google Scholar] [CrossRef] [PubMed]
- El-Kady, A.A.; Wade, T.L.; Sweet, S.T.; Klein, A.G. Spatial distribution and ecological risk assessment of trace metals in surface sediments of Lake Qaroun, Egypt. Environ. Monit. Assess. 2019, 191, 413. [Google Scholar] [CrossRef]
- Xiao, H.; Shahab, A.; Li, J.; Xi, B.; Sun, X.; He, H.; Yu, G. Distribution, ecological risk assessment and source identification of heavy metals in surface sediments of Huixian karst wetland, China. Ecotoxicol. Environ. Saf. 2019, 185, 109700. [Google Scholar] [CrossRef]
- Emenike, P.C.; Tenebe, I.T.; Neris, J.B.; Omole, D.O.; Afolayan, O.; Okeke, C.U.; Emenike, I.K. An integrated assessment of land-use change impact, seasonal variation of pollution indices and human health risk of selected toxic elements in sediments of River Atuwara, Nigeria. Environ. Pollut. 2020, 265, 114795. [Google Scholar] [CrossRef]
- Zerizghi, T.; Yang, Y.; Wang, W.; Zhou, Y.; Zhang, J.; Yi, Y. Ecological risk assessment of heavy metal concentrations in sediment and fish of a shallow lake: A case study of Baiyangdian Lake, North China. Environ. Monit. Assess. 2020, 192, 154. [Google Scholar] [CrossRef]
- Algül, F.; Beyhan, M. Concentrations and sources of heavy metals in shallow sediments in Lake Bafa, Turkey. Sci. Rep. 2020, 10, 11782. [Google Scholar] [CrossRef] [PubMed]
- Sudarshan, P.; Mahesh, M.K.; Ramachandra, T.V. Dynamics of metal pollution in sediment and macrophytes of Varthur Lake, Bangalore. Bull. Environ. Contam. Toxicol. 2020, 104, 411–417. [Google Scholar] [CrossRef] [PubMed]
- Ahamad, M.I.; Song, J.; Sun, H.; Wang, X.; Mehmood, M.S.; Sajid, M.; Su, P.; Khan, A.J. Contamination level, ecological risk, and source identification of heavy metals in the hyporheic zone of the Weihe River, China. Int. J. Environ. Res. Public Health 2020, 17, 1070. [Google Scholar] [CrossRef] [Green Version]
- Ustaoğlu, F. Ecotoxicological risk assessment and source identification of heavy metals in the surface sediments of Çömlekci stream, Giresun, Turkey. Environ. Forensics 2021, 22, 130–142. [Google Scholar] [CrossRef]
- Sadeghi, P.; Loghmani, M.; Yousuf, D.J.; Abadi, Z.T.R. Ecological and human health risk assessment of trace element pollution in sediments and five important commercial fishes of the Oman Sea. Mar. Pollut. Bull. 2021, 173, 112962. [Google Scholar] [CrossRef]
- Goher, M.E.; Mangood, A.H.; Mousa, I.E.; Salem, S.G.; Hussein, M.M. Ecological risk assessment of heavy metal pollution in sediments of Nile River, Egypt. Environ. Monit. Assess. 2021, 193, 703. [Google Scholar] [CrossRef]
- Talukder, R.; Rabbi, M.H.; Baharim, N.B.; Carnicelli, S. Source identification and ecological risk assessment of heavy metal pollution in sediments of Setiu Wetland, Malaysia. Environ. Forensics 2022, 23, 241–254. [Google Scholar] [CrossRef]
- Li, F.; Yu, X.; Lv, J.; Wu, Q.; An, Y. Assessment of heavy metal pollution in surface sediments of the Chishui River Basin, China. PLoS ONE 2022, 17, e0260901. [Google Scholar] [CrossRef]
- Iordache, A.M.; Nechita, C.; Zgavarogea, R.; Voica, C.; Varlam, M.; Ionete, R.E. Accumulation and ecotoxicological risk assessment of heavy metals in surface sediments of the Olt River, Romania. Sci. Rep. 2022, 12, 880. [Google Scholar] [CrossRef]
- Acharjee, A.; Ahmed, Z.; Kumar, P.; Alam, R.; Rahman, M.S.; Simal-Gandara, J. Assessment of the Ecological Risk from Heavy Metals in the Surface Sediment of River Surma, Bangladesh: Coupled Approach of Monte Carlo Simulation and Multi-Component Statistical Analysis. Water 2022, 14, 180. [Google Scholar] [CrossRef]
- Liu, H.; Liu, E.; Yu, Z.; Lin, Q.; Zhang, E.; Shen, J. Spatio-temporal accumulation patterns of trace metals in sediments of a large plateau lake (Erhai) in Southwest China and their relationship with human activities over the past century. J. Geochem. Explor. 2022, 234, 106943. [Google Scholar] [CrossRef]
- Hair, J.F.; Black, W.C.; Babin, B.J. Multivariate Data Analysis: A Global Perspective; Pearson Education: London, UK, 2010. [Google Scholar]
- Byrne, B.M. Structural Equation Modeling with AMOS: Basic Concepts, Applications, and Programming, 2nd ed.; Routledge: New York, NY, USA, 2010. [Google Scholar]
- Garson, G.D. Partial Least Squares: Regression and Structural Equation Models; Statistical Associates Publishers: Asheboro, NC, USA, 2016; ISBN 13 978-1-62638-039-4. [Google Scholar]
- Taylor, S.R.; McLennan, S.M. The geochemical evolution of the continental crust. Rev. Geophys. 1995, 33, 241–265. [Google Scholar] [CrossRef]
- Rudnick, R.L.; Gao, S. Composition of the continental crust. In The Crust; Rudnick, R.L., Ed.; Elsevier: Amsterdam, The Netherlands, 2003; Volume 3, pp. 1–64. [Google Scholar]
- Long, E.R.; MacDonald, D.D.; Smith, S.L.; Calder, F.D. Incidence of adverse biological effects within ranges of chemical concentrations in marine and estuarine sediments. Environ. Manag. 1995, 19, 81–97. [Google Scholar] [CrossRef]
- Chapman, P.M.; Patrick, J.A.; Vigers, G.A. Development of sediment quality values for Hong Kong special administrative region: A possible model for other jurisdictions. Mar. Pollut. Bull. 1999, 38, 161–169. [Google Scholar] [CrossRef]
- MacDonald, D.D.; Carr, R.S.; Calder, F.D.; Long, E.R.; Ingersoll, C.G. Development and evaluation of sediment quality guidelines for Florida coastal waters. Ecotoxicology 1996, 5, 253–278. [Google Scholar] [CrossRef]


| Factor | Definition | Unit | Values | References | |
|---|---|---|---|---|---|
| Children | Adults | ||||
| IngR | Ingestion rate of sediment | mg/day | 200 | 100 | [24] |
| ED | Exposure duration | Years | 6.0 | 24 | [24] |
| PEF | Particle emission factor | m3/kg | 1.36 × 10⁹ | 1.36 × 10⁹ | [24] |
| AT | Average time | Days | 365 × ED | 365 × ED | [25] |
| BW | Bodyweight of the exposed individual | kg | 15 | 55.9 | [28] |
| EF | Exposure frequency | days/year | 365 | 365 | - |
| SA | Exposed skin surface area | cm2 | 1600 | 4350 | [28] |
| AF | Skin adherence factor | mg/cm day | 0.20 | 0.70 | [29] |
| Cu RfDing | Reference dose for ingestion | mg/kg day | 4.00 × 10⁻² | 4.00 × 10⁻² | [30] |
| Cu RfDinh | Reference dose for inhalation | mg/kg day | 4.02 × 10⁻² | 4.02 × 10⁻² | [30] |
| Cu RfDder | Reference dose for dermal contact | mg/kg day | 1.20 × 10⁻² | 1.20 × 10⁻² | [30] |
| InhR | Inhalation rate of sediment | m3/day | 7.63 | 12.8 | [31] |
| ABF | Dermal absorption factor | Unitless | 1.00 × 10⁻³ | 1.00 × 10⁻³ | [32] |
| No. | Country | NP | No. | Country | NP |
|---|---|---|---|---|---|
| 1 | China | 33 | 20 | Netherlands | 1 |
| 2 | Malaysia | 19 | 21 | Ghana | 1 |
| 3 | India | 7 | 22 | Greece | 1 |
| 4 | Tunisia | 7 | 23 | Hungary | 1 |
| 5 | Bangladesh | 6 | 24 | Ivory Coast | 1 |
| 6 | Japan | 4 | 25 | Libya | 1 |
| 7 | Hong Kong | 3 | 26 | Morocco | 1 |
| 8 | Indonesia | 3 | 27 | Netherlands | 1 |
| 9 | Singapore | 3 | 28 | Nigeria | 1 |
| 10 | Iran | 3 | 29 | Oman | 1 |
| 11 | Pakistan | 3 | 30 | Papua New Guinea | 1 |
| 12 | Algeria | 2 | 31 | Philippines | 1 |
| 13 | Australia | 2 | 32 | Senegal | 1 |
| 14 | Taiwan | 2 | 33 | USA | 1 |
| 15 | Thailand | 2 | 34 | South Africa | 1 |
| 16 | Nigeria | 2 | 35 | Oman | 1 |
| 17 | Turkey | 2 | 36 | Spain | 1 |
| 18 | Egypt | 2 | 37 | Romania | 1 |
| 19 | Serbia | 2 |
| Cu | Igeo | CF | ER | A HQing | A HQinh | A HQder | A HI | C HQing | C HQinh | C HQder | C HI | Reference | |
|---|---|---|---|---|---|---|---|---|---|---|---|---|---|
| Minimum | 0.12 | −7.48 | 0.01 | 0.04 | 5.50 × 10⁻⁶ | 5.03 × 10⁻¹⁰ | 5.58 × 10⁻⁷ | 6.06 × 10⁻⁶ | 4.10 × 10⁻⁵ | 1.12 × 10⁻⁹ | 2.19 × 10⁻⁷ | 4.12 × 10⁻⁵ | This study |
| Maximum | 24,985 | 10.19 | 1747 | 8736 | 1.15 | 1.05 × 10⁻⁴ | 1.16 × 10⁻¹ | 1.26 | 8.54 | 2.32 × 10⁻⁴ | 4.55 × 10⁻² | 8.58 | |
| Mean | 209 | 0.25 | 14.65 | 73.23 | 9.62 × 10⁻³ | 8.79 × 10⁻⁷ | 9.73 × 10⁻⁴ | 1.06 × 10⁻² | 7.16 × 10⁻² | 1.95 × 10⁻⁶ | 3.82 × 10⁻⁴ | 7.19 × 10⁻² | |
| Median | 22.95 | 0.09 | 1.61 | 8.02 | 1.05 × 10⁻³ | 9.62 × 10⁻⁸ | 1.07 × 10⁻⁴ | 1.16 × 10⁻³ | 7.85 × 10⁻³ | 2.14 × 10⁻⁷ | 4.18 × 10⁻⁵ | 7.88E × 10−3 | |
| SD | 1609 | 2.52 | 113 | 563 | 7.41 × 10⁻² | 6.76 × 10⁻⁶ | 7.47 × 10⁻³ | 8.12 × 10⁻² | 5.50 × 10⁻¹ | 1.49 × 10⁻⁵ | 2.93 × 10⁻³ | 5.53 × 10⁻¹ | |
| SE | 102 | 0.16 | 7.12 | 35.6 | 4.68 × 10⁻³ | 4.28 × 10⁻⁷ | 4.73 × 10⁻⁴ | 5.13 × 10⁻³ | 3.48 × 10⁻² | 9.45 × 10⁻⁷ | 1.85 × 10⁻⁴ | 3.50 × 10⁻² | |
| Skewness | 14.8 | 0.21 | 14.8 | 14.8 | 1.48 × 10 | 1.47 × 10 | 1.47 × 10 | 1.47 × 10 | 1.47 × 10 | 1.47 × 10 | 1.47 × 10 | 1.47 × 10 | |
| Kurtosis | 224 | 1.06 | 224 | 224 | 2.24 × 10² | 2.24 × 10² | 2.24 × 10² | 2.24 × 10² | 2.24 × 10² | 2.24 × 10² | 2.24 × 10² | 2.24 × 10² | |
| Guidelines | Cu | Igeo | CF | ER | A HQing | A HQinh | A HQder | A HI | C HQing | C HQinh | C HQder | C HI | Reference |
| ERL | 34.0 | 0.66 | 2.38 | 11.89 | 1.56 × 10⁻³ | 1.42 × 10⁻⁷ | 1.58 × 10⁻⁴ | 1.72 × 10⁻³ | 1.16 × 10⁻² | 3.16 × 10⁻⁷ | 6.20 × 10⁻⁵ | 1.17 × 10⁻² | [166] |
| ERM | 270 | 3.65 | 18.88 | 94.41 | 1.24 × 10⁻² | 1.13 × 10⁻⁶ | 1.26 × 10⁻³ | 1.36 × 10⁻² | 9.23 × 10⁻² | 2.51 × 10⁻⁶ | 4.92 × 10⁻⁴ | 9.28 × 10⁻² | [166] |
| ISQV-low | 65.0 | 1.60 | 4.55 | 22.73 | 2.98 × 10⁻³ | 2.72× 10⁻⁷ | 3.03 × 10⁻⁴ | 3.28 × 10⁻³ | 2.22 × 10⁻² | 6.05 × 10⁻⁷ | 1.18 × 10⁻⁴ | 2.23 × 10⁻² | [167] |
| ISQV-high | 270 | 3.65 | 18.88 | 94.41 | 1.24 × 10⁻² | 1.13 × 10⁻⁶ | 1.26 × 10⁻³ | 1.36 × 10⁻² | 9.23 × 10⁻² | 2.51 × 10⁻⁶ | 4.92 × 10⁻⁴ | 9.28 × 10⁻² | [167] |
| TEL | 18.7 | −0.20 | 1.31 | 6.54 | 8.57 × 10⁻⁴ | 7.83 × 10⁻⁸ | 8.70 × 10⁻⁵ | 9.45 × 10⁻⁴ | 6.39 × 10⁻³ | 1.74 × 10⁻⁷ | 3.41 × 10⁻⁵ | 6.43 × 10⁻³ | [168] |
| PEL | 108.2 | 2.33 | 7.57 | 37.83 | 4.96 × 10⁻³ | 4.53 × 10⁻⁷ | 5.04 × 10⁻⁴ | 5.47 × 10⁻³ | 3.70 × 10⁻² | 1.01 × 10⁻⁶ | 1.97 × 10⁻⁴ | 3.72 × 10⁻² | [168] |
| PRL | 50.0 | 1.22 | 3.50 | 17.48 | 2.29 × 10⁻³ | 2.09 × 10⁻⁷ | 2.33 × 10⁻⁴ | 2.53 × 10⁻³ | 1.71 × 10⁻² | 4.65 × 10⁻⁷ | 9.11 × 10⁻⁵ | 1.72 × 10⁻² | [23] |
| UCC | 25.0 | 0.22 | 1.75 | 8.74 | 1.15 × 10⁻³ | 1.05 × 10⁻⁷ | 1.16 × 10⁻⁴ | 1.26 × 10⁻³ | 8.54 × 10⁻³ | 2.33 × 10⁻⁷ | 4.56 × 10⁻⁵ | 8.59 × 10⁻³ | [164] |
| UCC | 14.3 | −0.58 | 1.00 | 5.00 | 6.56 × 10⁻⁴ | 5.99 × 10⁻⁸ | 6.66 × 10⁻⁵ | 7.22 × 10⁻⁴ | 4.89 × 10⁻³ | 1.33 × 10⁻⁷ | 2.61 × 10⁻⁵ | 4.91 × 10⁻³ | [22] |
| UCC | 28.0 | 0.38 | 1.96 | 9.79 | 1.28 × 10⁻³ | 1.17 × 10⁻⁷ | 1.30 × 10⁻⁴ | 1.41 × 10⁻³ | 9.57 × 10⁻³ | 2.61 × 10⁻⁷ | 5.10 × 10⁻⁵ | 9.62 × 10⁻³ | [165] |
| No. | Locations | Cu > 1000 | Sources | Comment | Reference |
|---|---|---|---|---|---|
| 1 | Lake Pamvotis, Greece | 24,985 | Industrial activities; urban stormwater runoff; agriculture, livestock, and domestic sewage. | The report offered baseline data for future research on the anthropogenic influences on the protection and management of Lake Pamvotis, which have been a concern of city officials for decades. Cu must be continuously monitored for ecological and health risks. | [92] |
| 2 | Victoria Harbor, Hong Kong | 3790 | Traffic due to its vicinity to the airport runway and the industrialized area. | Evidently, the increasing levels of toxic Cu in Hong Kong were attributable to the escalating population density, rapid industrialization, and land reclamation. This study can therefore offer a significant source of information about Cu mitigation and pollution management in Victoria Harbor. | [46] |
| 3 | Scheldt Estuarine, Netherlands | 2600 | Industrial discharges. | According to the study, the Cu load in the Scheldt estuary has decreased dramatically for three decades (1960–1990). The extent to which these alterations represent a shift in manufacturing strategies, or a purification of industrial waste is unknown. Cu must be regularly evaluated for environmental and health hazards. | [47] |
| 4 | Old Nakagawa River, Japan | 1565 | Industrialization, urbanization, deposition of industrial wastes and others. | The paper stated that, in order to monitor the trend of Cu contamination, industrial establishments, the municipal council, and/or the government of Japan should reevaluate the current waste treatment and disposal methods for urban sediments or introduce more effective ones. | [76] |
| 5 | Mvudi River, South Africa | 1027 | Release of partially treated wastewater effluents from the Thohoyandou wastewater treatment plant, runoffs from agricultural soil, landfill sites very close to the river and other non-point sources, such as atmospheric deposition | The paper emphasized that higher Cu concentrations in river sediments could potentially have deleterious impacts on aquatic life. Cu must be continuously monitored for ecological and health risks. | [66] |
| 6 | Polluted drainage sediments from Peninsular Malaysia | 1019 | Untreated urban wastes; industrial effluents. | The paper highlighted the importance of treating effluents in this drainage basin. In order to limit unlawful discharges and dumping into drainages, it is necessary to increase public awareness. Cu must be continuously monitored for ecological and health risks. | [72] |
| 7 | Kaoshiung Harbor, Taiwan | 946 | Industrial and municipal wastewaters were discharged from the neighboring industrial parks and river basins. The Cu area was severely affected by untreated or partially treated industrial effluents and municipal sewages. | The paper shed light on the properties and mechanisms of metal distributions in Kaohsiung Harbor sediments. The data would aid in the creation of more effective watershed and harbor management methods to minimize metal discharges into the harbor, as well as a strategy for the cleanup of polluted sediments. | [68] |
| 8 | Serbia | 870 | Not specifically mentioned. | The study indicated that the river sediments examined were highly polluted with Cu. Cu must be continuously monitored for ecological and health risks. | [98] |
| 9 | Korbevačka River, Serbia | 859.9 | Mining and processing of metal ore/ smelting. | The paper stressed the need for a human exposure risk assessment of Cu for screening purposes in order to identify significant exposure pathways and establish the urgency of sediment cleanup measures. | [143] |
| 10 | Kaohsiung Harbor, Taiwan. | 760 | Derived from the polluted Canon River and the Love River, Salt River, and Jen-Gen River. | The paper provided harbor management departments with a great deal of important information, particularly on the Cu derived from the four major contamination sources, allowing for the future control of Cu according to the severity of contamination in sediments. | [108] |
| 11 | Shima River, China. | 630 | Industrial effluents; receiving discharges from Huizhou City. | The paper showed that the Cu bound to sedimentary particles may be resuspended and migrate from the upper and medium reaches to the lower reaches, endangering the safety of the local water supply. Therefore, improving sediment quality necessitates the control of pesticide application, the reduction in industrial wastewater discharge, and the implementation of a river channel dredging project. | [110] |
Publisher’s Note: MDPI stays neutral with regard to jurisdictional claims in published maps and institutional affiliations. |
© 2022 by the authors. Licensee MDPI, Basel, Switzerland. This article is an open access article distributed under the terms and conditions of the Creative Commons Attribution (CC BY) license (https://creativecommons.org/licenses/by/4.0/).
Share and Cite
Yap, C.K.; Saleem, M.; Tan, W.S.; Syazwan, W.M.; Azrizal-Wahid, N.; Nulit, R.; Ibrahim, M.H.; Mustafa, M.; Rahman, M.A.A.; Edward, F.B.; et al. Ecological–Health Risk Assessments of Copper in the Sediments: A Review and Synthesis. Pollutants 2022, 2, 269-288. https://doi.org/10.3390/pollutants2030018
Yap CK, Saleem M, Tan WS, Syazwan WM, Azrizal-Wahid N, Nulit R, Ibrahim MH, Mustafa M, Rahman MAA, Edward FB, et al. Ecological–Health Risk Assessments of Copper in the Sediments: A Review and Synthesis. Pollutants. 2022; 2(3):269-288. https://doi.org/10.3390/pollutants2030018
Chicago/Turabian StyleYap, Chee Kong, Muhammad Saleem, Wen Siang Tan, Wan Mohd Syazwan, Noor Azrizal-Wahid, Rosimah Nulit, Mohd. Hafiz Ibrahim, Muskhazli Mustafa, Mohd Amiruddin Abd Rahman, Franklin Berandah Edward, and et al. 2022. "Ecological–Health Risk Assessments of Copper in the Sediments: A Review and Synthesis" Pollutants 2, no. 3: 269-288. https://doi.org/10.3390/pollutants2030018