
SERS Detection of Methylene Blue and Crystal Violet Using Silver Nanostars †
 , ,
, , 
Abstract
:1. Introduction
2. Materials and Methods
2.1. Materials
2.2. Fabrication of Silver Nanostars
2.3. Fabrication of Ag NS-Based SERS Substrates
2.4. Characterization
3. Results and Discussion
4. Conclusions
Author Contributions
Funding
Institutional Review Board Statement
Informed Consent Statement
Data Availability Statement
Acknowledgments
Conflicts of Interest
References
- Oliveira, M.J.; Quaresma, P.; de Almeida, M.P.; Araújo, A.; Pereira, E.; Fortunato, E.; Martins, R.; Franco, R.; Águas, H. Office paper decorated with silver nanostars—An alternative cost effective platform for trace analyte detection by SERS. Sci. Rep. 2017, 7, 2480. [Google Scholar] [CrossRef] [PubMed]
- Garcia-Leis, A.; Rivera-Arreba, I.; Sanchez-Cortes, S. Morphological tuning of plasmonic silver nanostars by controlling the nanoparticle growth mechanism: Application in the SERS detection of the amyloid marker Congo Red. Colloids Surf. A Physicochem. Eng. Asp. 2017, 535, 49–60. [Google Scholar] [CrossRef]
- Zalaffi, M.S.; Agostinelli, I.; Karimian, N.; Ugo, P. Ag-nanostars for the sensitive SERS detection of dyes in artistic cross-sections—Madonna della Misericordia of the National Gallery of Parma: A case study. Heritage 2020, 3, 1344–1359. [Google Scholar] [CrossRef]
- Verma, A.K.; Soni, R.K. Silver nanodendrites for ultralow detection of thiram based on surface-enhanced Raman spectroscopy. Nanotechnology 2019, 30, 385502. [Google Scholar] [CrossRef] [PubMed]
- Sitjar, J.; Liao, J.-D.; Lee, H.; Pan, L.P.; Liu, B.H.; Fu, W.-E.; Chen, G.D. Ag Nanostructures with spikes on adhesive tape as a flexible SERS-active substrate for in situ trace detection of pesticides on fruit skin. Nanomaterials 2019, 9, 1750. [Google Scholar] [CrossRef] [PubMed]
- Revnic, R.N.; Știufiuc, G.F.; Toma, V.; Onaciu, A.; Moldovan, A.; Țigu, A.B.; Fischer-Fodor, E.; Tetean, R.; Burzo, E.; Știufiuc, R.I. Facile microwave assisted synthesis of silver nanostars for ultrasensitive detection of biological analytes by SERS. Int. J. Mol. Sci. 2022, 23, 8830. [Google Scholar] [CrossRef] [PubMed]
- Garcia-Leis, A.; Garcia-Ramos, J.V.; Sanchez-Cortes, S. Silver nanostars with high SERS performance. J. Phys. Chem. C 2013, 117, 7791–7795. [Google Scholar] [CrossRef]
- Mosier-Boss, P.A. Review of SERS substrates for chemical sensing. Nanomaterials 2017, 7, 142. [Google Scholar] [CrossRef] [PubMed]
- Zalaffi, M.S.; Litti, L.; Canton, P.; Meneghetti, M.; Moretto, L.M.; Ugo, P. Preparation and characterization of Ag-nanostars@Au-nanowires hierarchical nanostructures for highly sensitive surface enhanced Raman spectroscopy. Nano Express 2020, 1, 020006. [Google Scholar] [CrossRef]
- Liu, Y.; Lyu, N.; Rajendran, V.K.; Piper, J.; Rodger, A.; Wang, Y. Sensitive and direct DNA mutation detection by surface-enhanced Raman spectroscopy using rational designed and tunable plasmonic nanostructures. Anal. Chem. 2020, 92, 5708–5716. [Google Scholar] [CrossRef] [PubMed]
- Rubira, R.J.G.; Camacho, S.A.; Martin, C.S.; Mejía-Salazar, J.R.; Gómez, F.R.; da Silva, R.R.; Junior, O.N.D.O.; Alessio, P.; Constantino, C.J.L. Designing silver nanoparticles for detecting Levodopa (3,4-Dihydroxyphenylalanine, L-Dopa) using surface-enhanced Raman scattering (SERS). Sensors 2020, 20, 15. [Google Scholar] [CrossRef] [PubMed]
- Zhao, J.; Wu, C.; Zhai, L.P.; Shi, X.F.; Li, X.; Weng, G.J.; Zhu, J.; Li, J.J.; Zhao, J.-W. A SERS-based immunoassay for the detection of α-fetoprotein using AuNS@Ag@SiO2 core–shell nanostars. J. Mater. Chem. C 2019, 7, 8432–8441. [Google Scholar] [CrossRef]
- Verma, A.K.; Soni, R.K. Multi-spiked silver stars for ultrasensitive and multiplexed SERS detection of analytes. J. Phys. D Appl. Phys. 2021, 54, 15. [Google Scholar] [CrossRef]
- Qin, Y.; Ji, X.; Jing, J.; Liu, H.; Wu, H.; Yang, W. Size control over spherical silver nanoparticles by ascorbic acid reduction. Colloids Surf. A Physicochem. Eng. Asp. 2010, 372, 172–176. [Google Scholar] [CrossRef]
- Chen, Z.; Chang, J.W.; Balasanthiran, C.; Milner, S.T.; Rioux, R.M. Anisotropic growth of silver nanoparticles is kinetically controlled by polyvinylpyrrolidone binding. J. Am. Chem. Soc. 2019, 141, 4328–4337. [Google Scholar] [CrossRef] [PubMed]
- Li, C.; Huang, Y.; Lai, K.; Rasco, B.A.; Fan, Y. Analysis of trace methylene blue in fish muscles using ultra-sensitive surface-enhanced Raman spectroscopy. Food Control 2016, 65, 99–105. [Google Scholar] [CrossRef]
- Nardo, V.M.; Renda, V.; Trusso, S.; Ponterio, R. Role of pH on nanostructured SERS active substrates for detection of organic dyes. Molecules 2021, 26, 2360. [Google Scholar] [CrossRef]
- Shi, G.; Wang, M.; Zhu, Y.; Wang, Y.; Xu, H. A novel natural SERS system for crystal violet detection based on graphene oxide wrapped Ag micro-islands substrate fabricated from Lotus leaf as a template. Appl. Surf. Sci. 2018, 459, 802–811. [Google Scholar] [CrossRef]
- Esenturk, E.N.; Walker, A.R.H. Surface-enhanced Raman scattering spectroscopy via gold nanostars. J. Raman Spectrosc. 2009, 40, 86–91. [Google Scholar] [CrossRef]


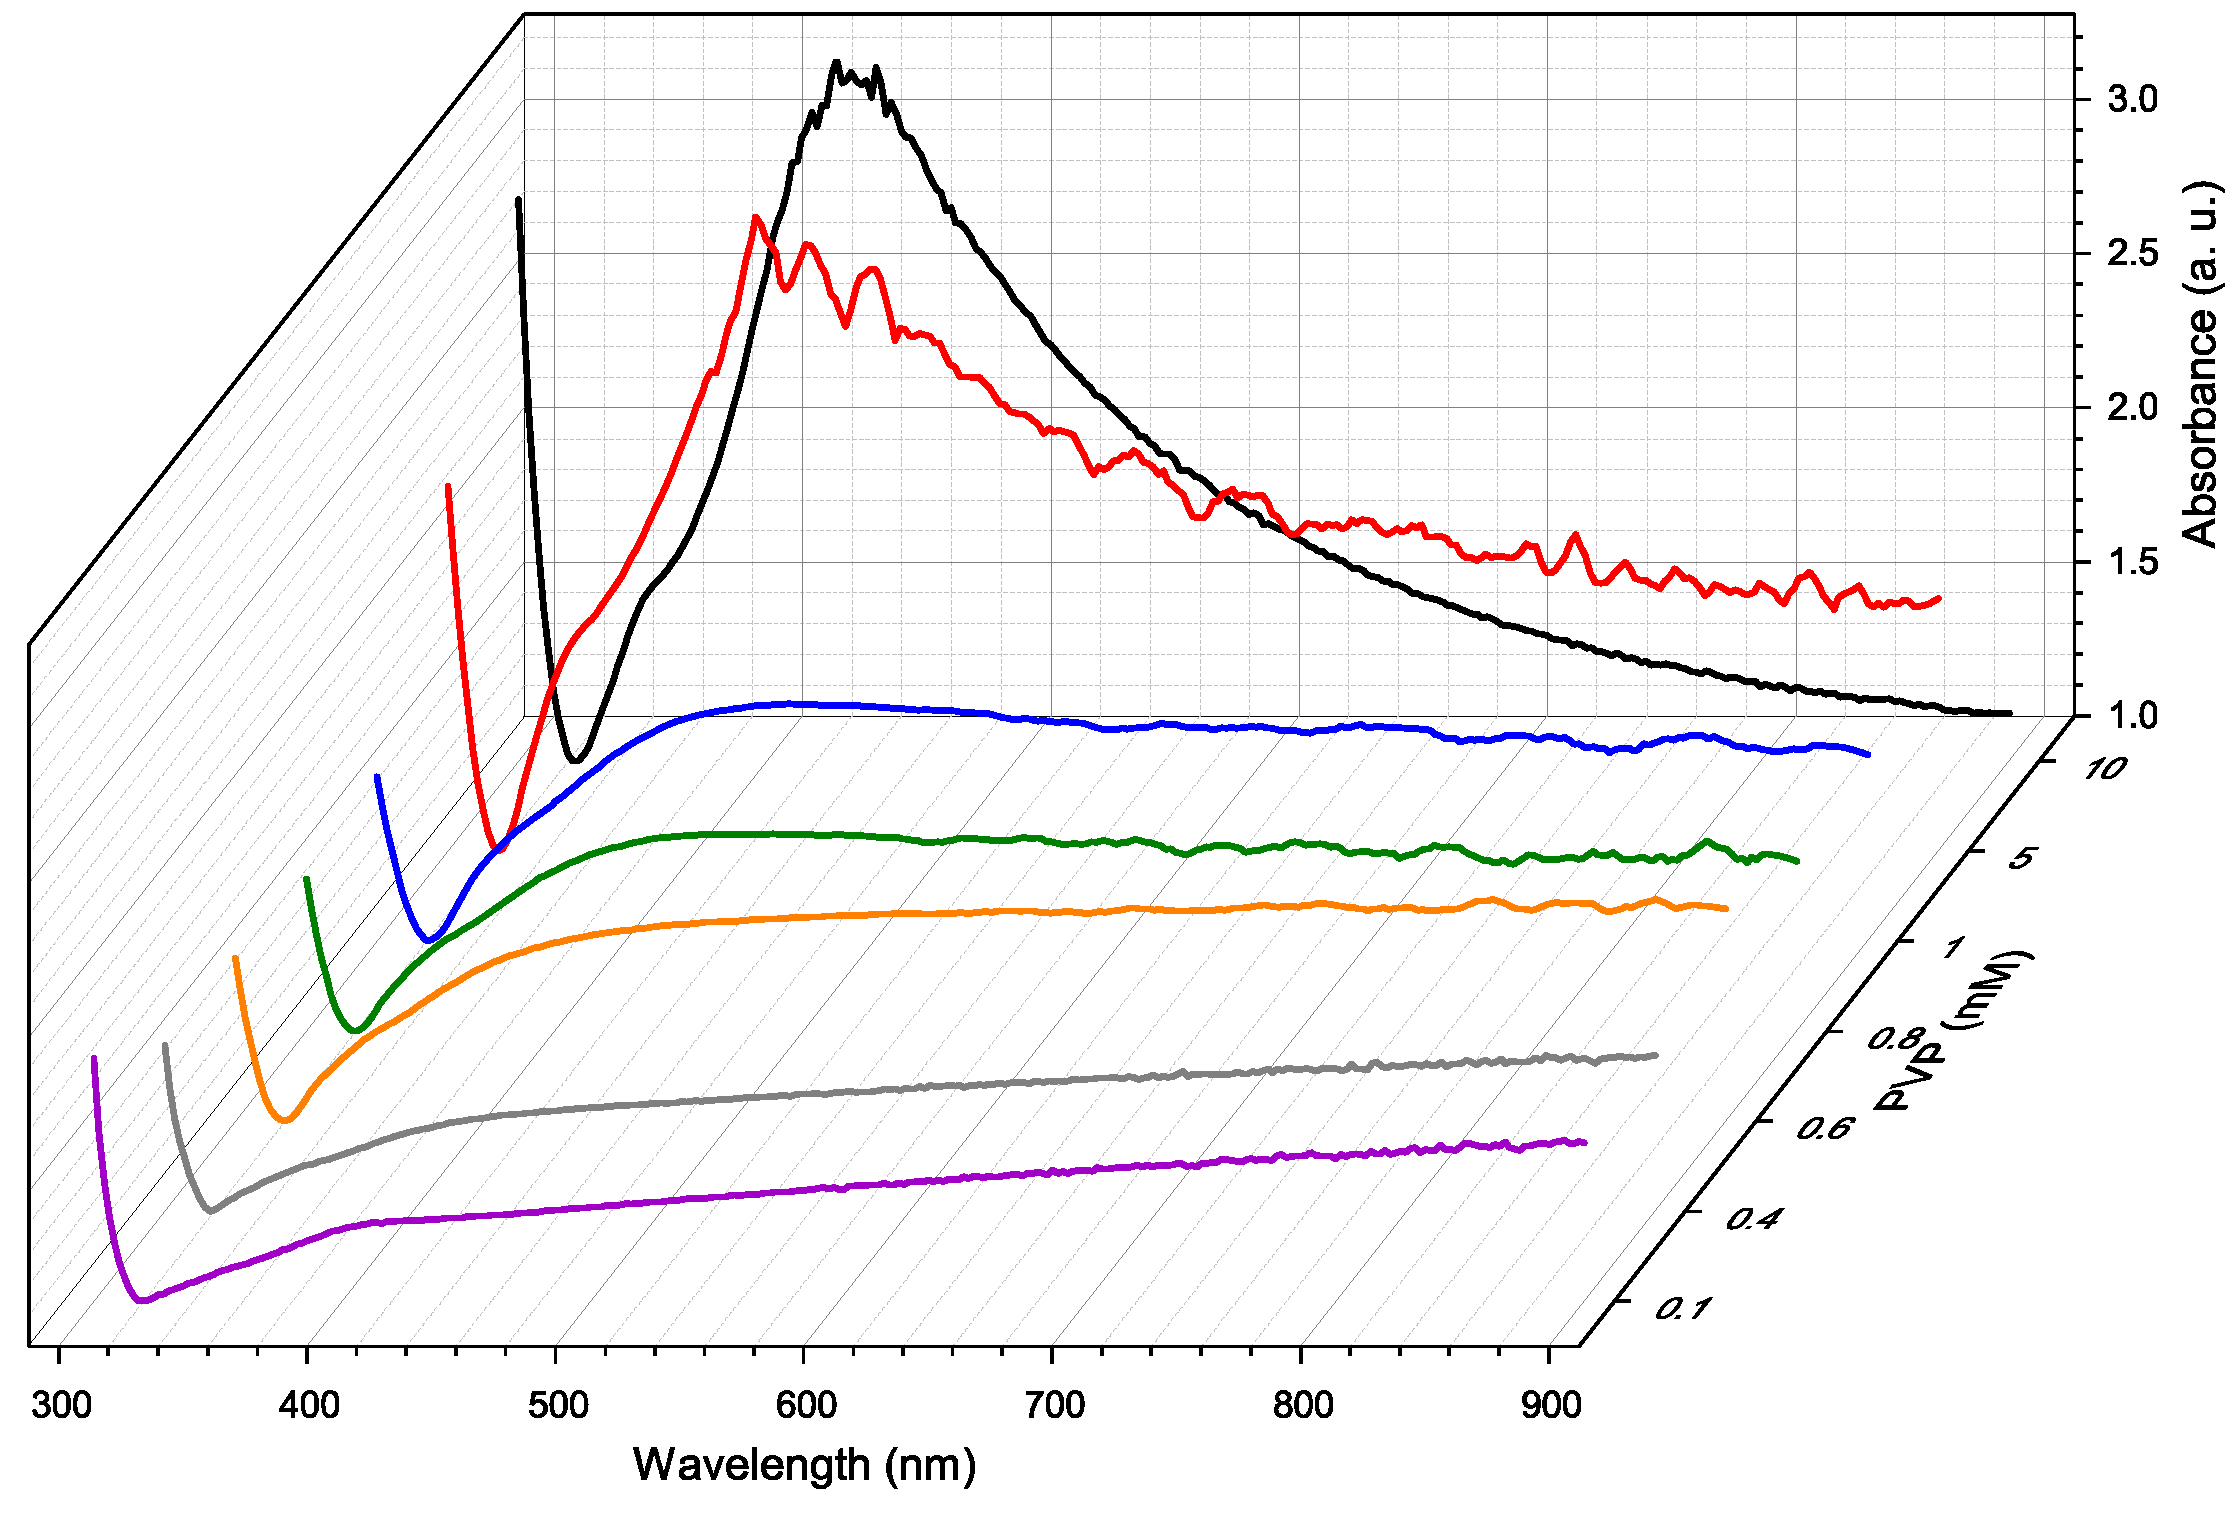
| AgNO3 [mM] | L-AA [mM] | PVP [mM] | R1 [AgNO3]/[L-AA] | R2 [AgNO3]/[PVP] | Size [μm] | Morphology |
|---|---|---|---|---|---|---|
| 3.6 | 71.5 | 10 | 0.05 | 0.36 | 0.43 | SP |
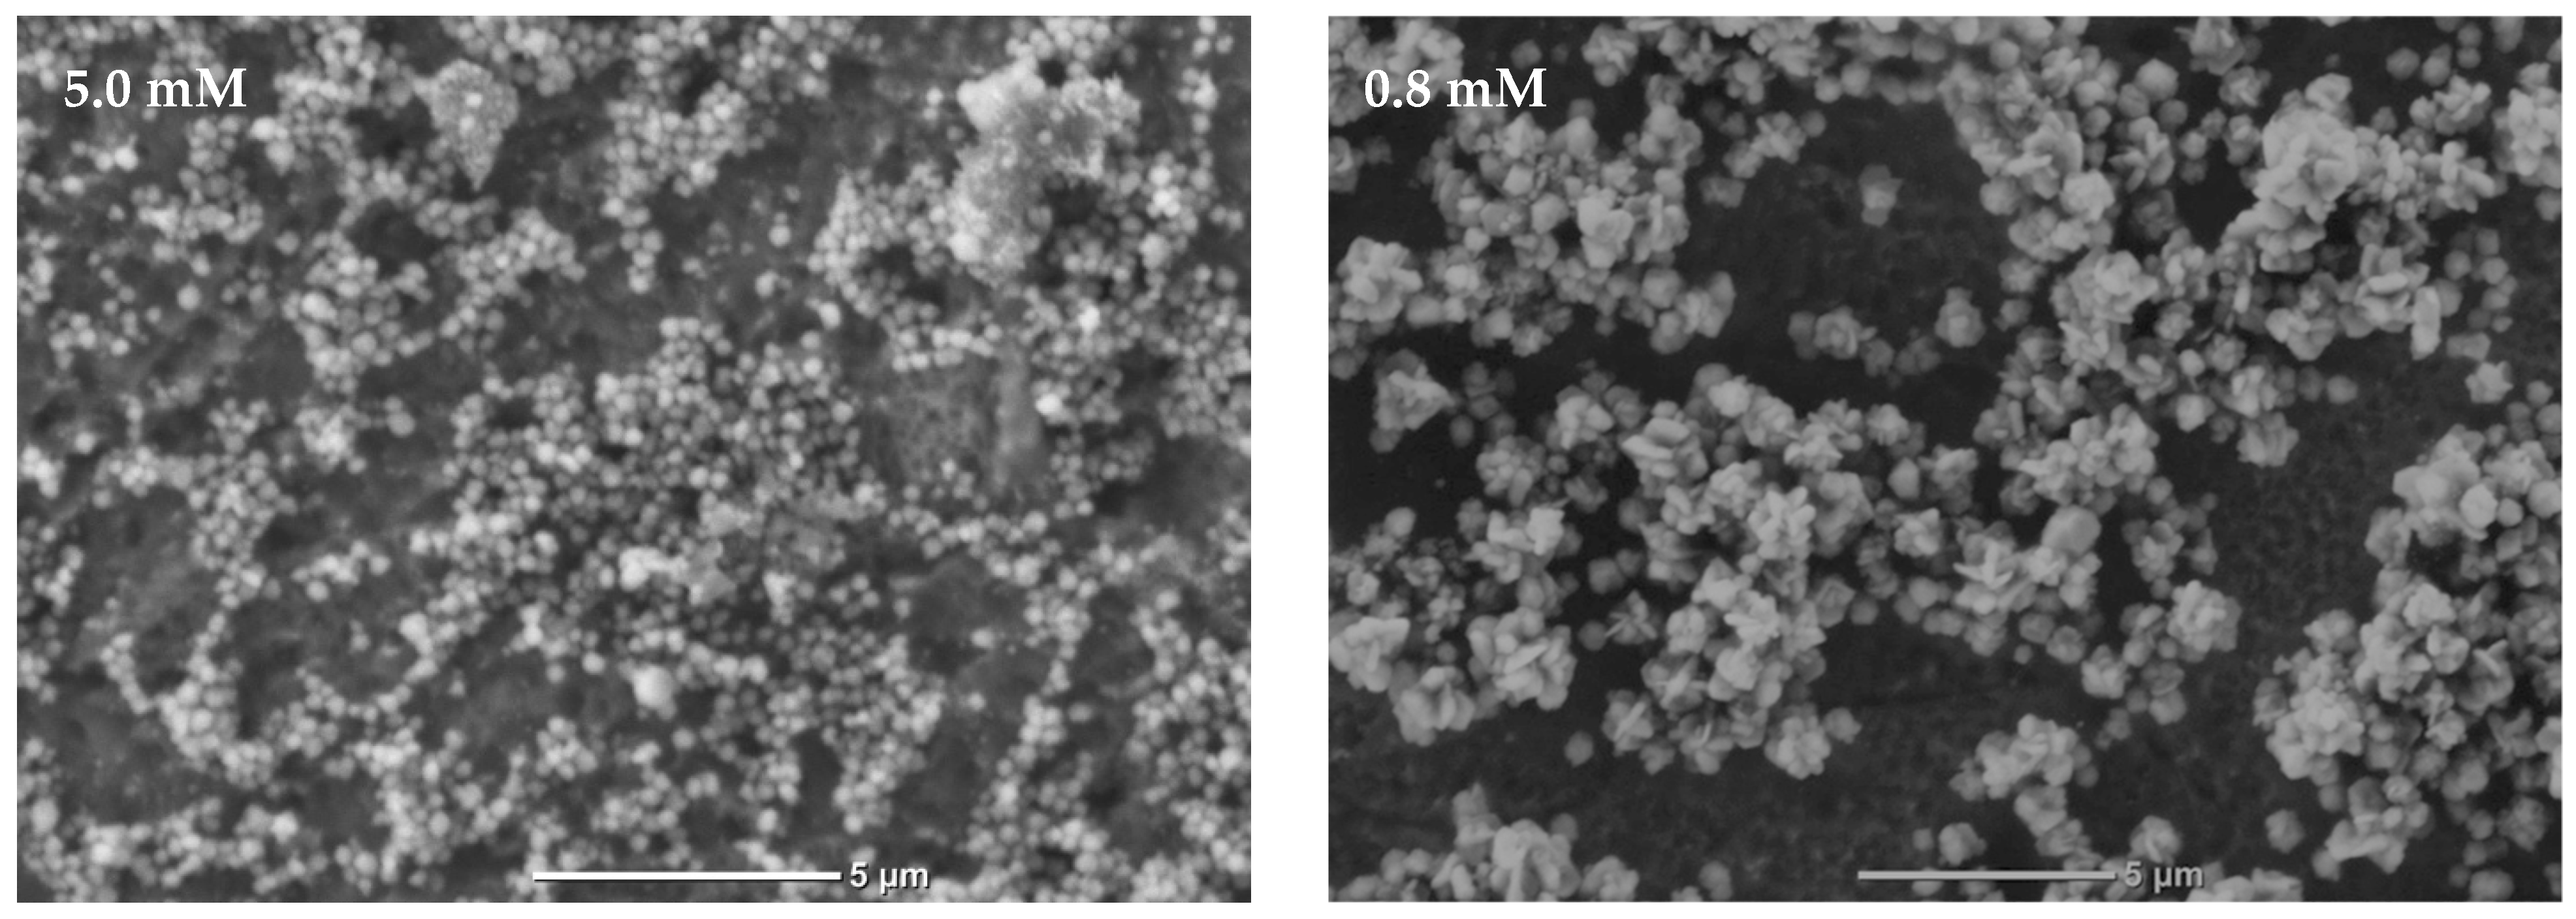
| 3.6 | 71.5 | 5 | 0.05 | 0.72 | 0.36 | SP |
| 3.6 | 71.5 | 1 | 0.05 | 3.60 | 1.21 | ST |
| 3.6 | 71.5 | 0.8 | 0.05 | 4.50 | 1.07 | ST |
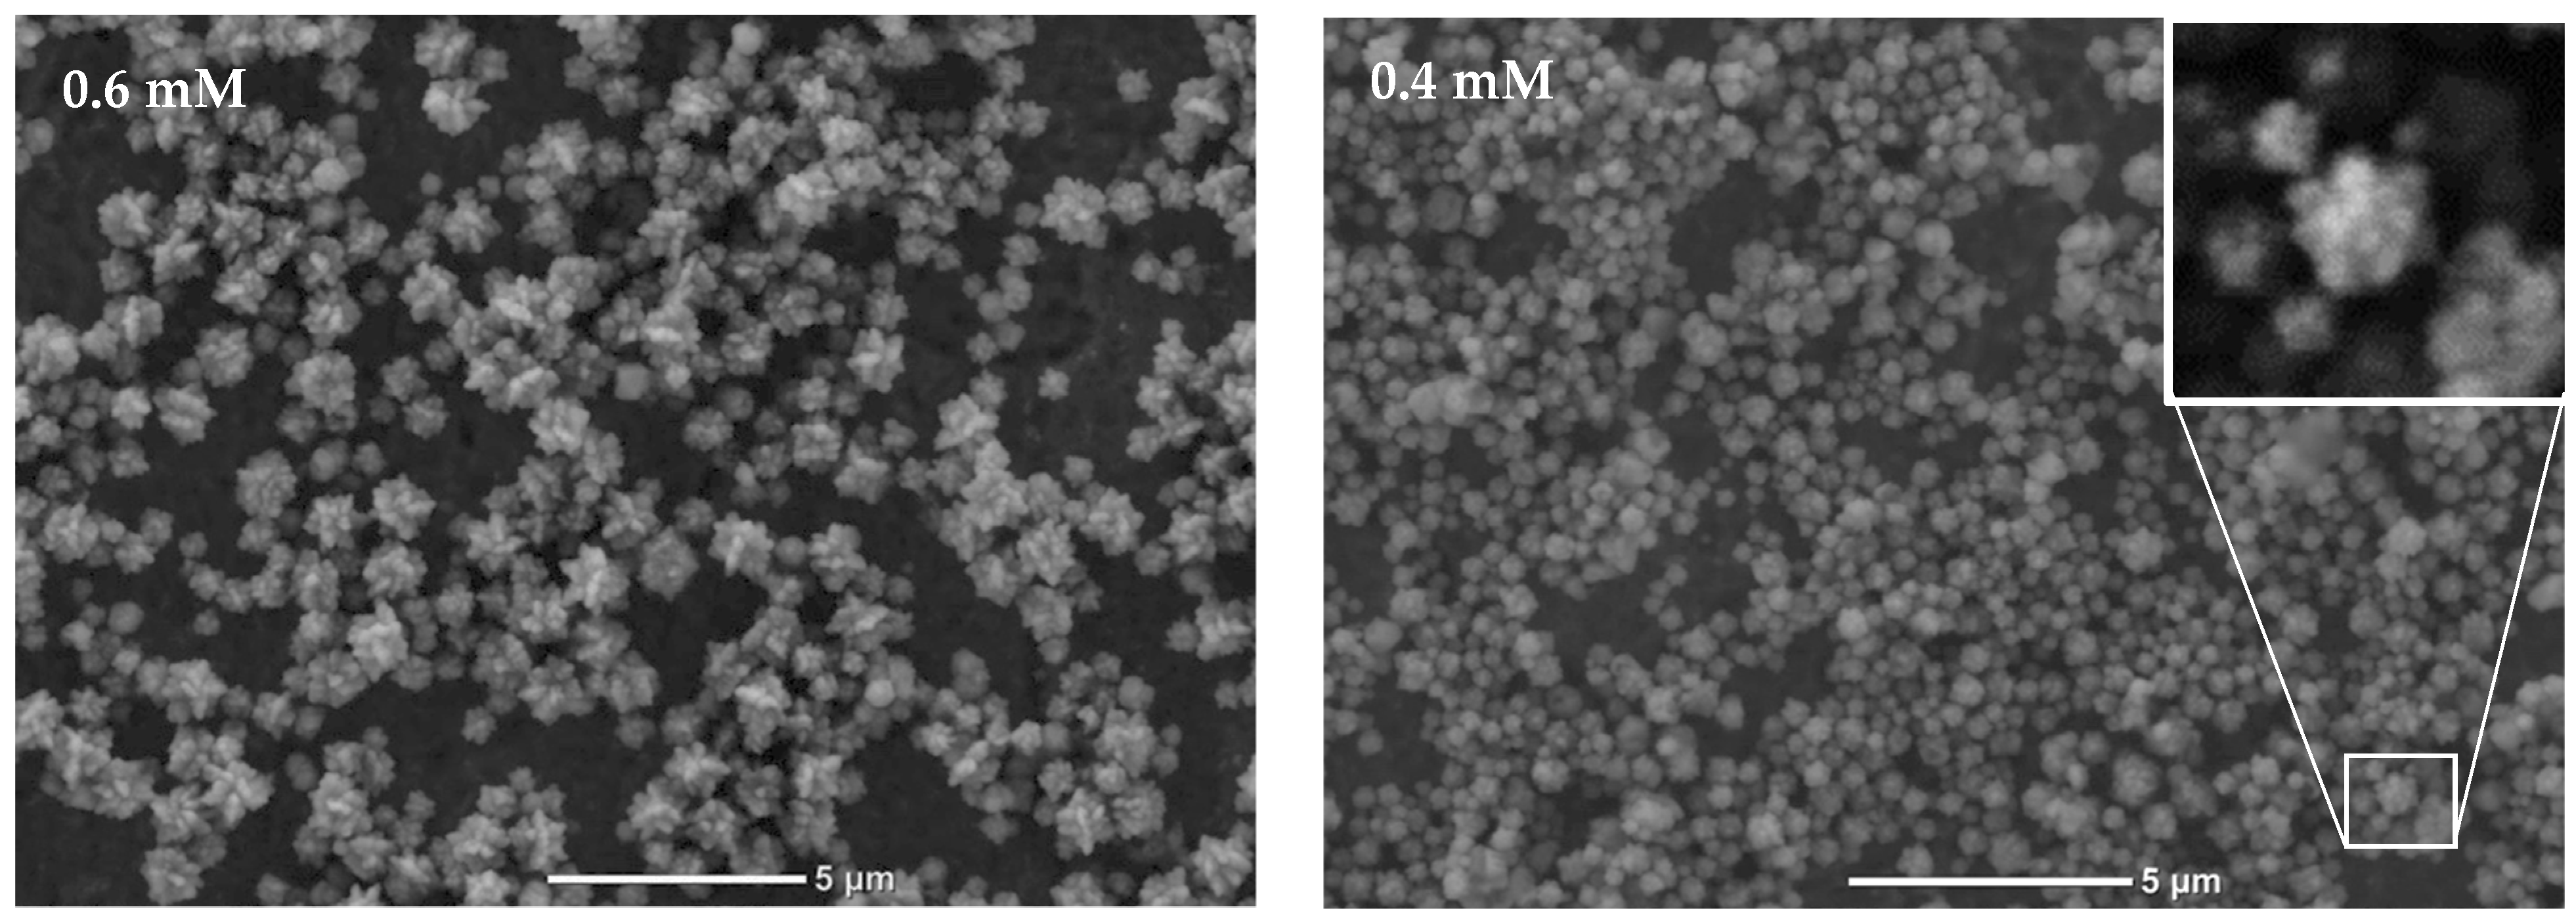
| 3.6 | 71.5 | 0.6 | 0.05 | 6.00 | 1.00 | ST |
| 3.6 | 71.5 | 0.4 | 0.05 | 9.00 | 0.62 | ST |
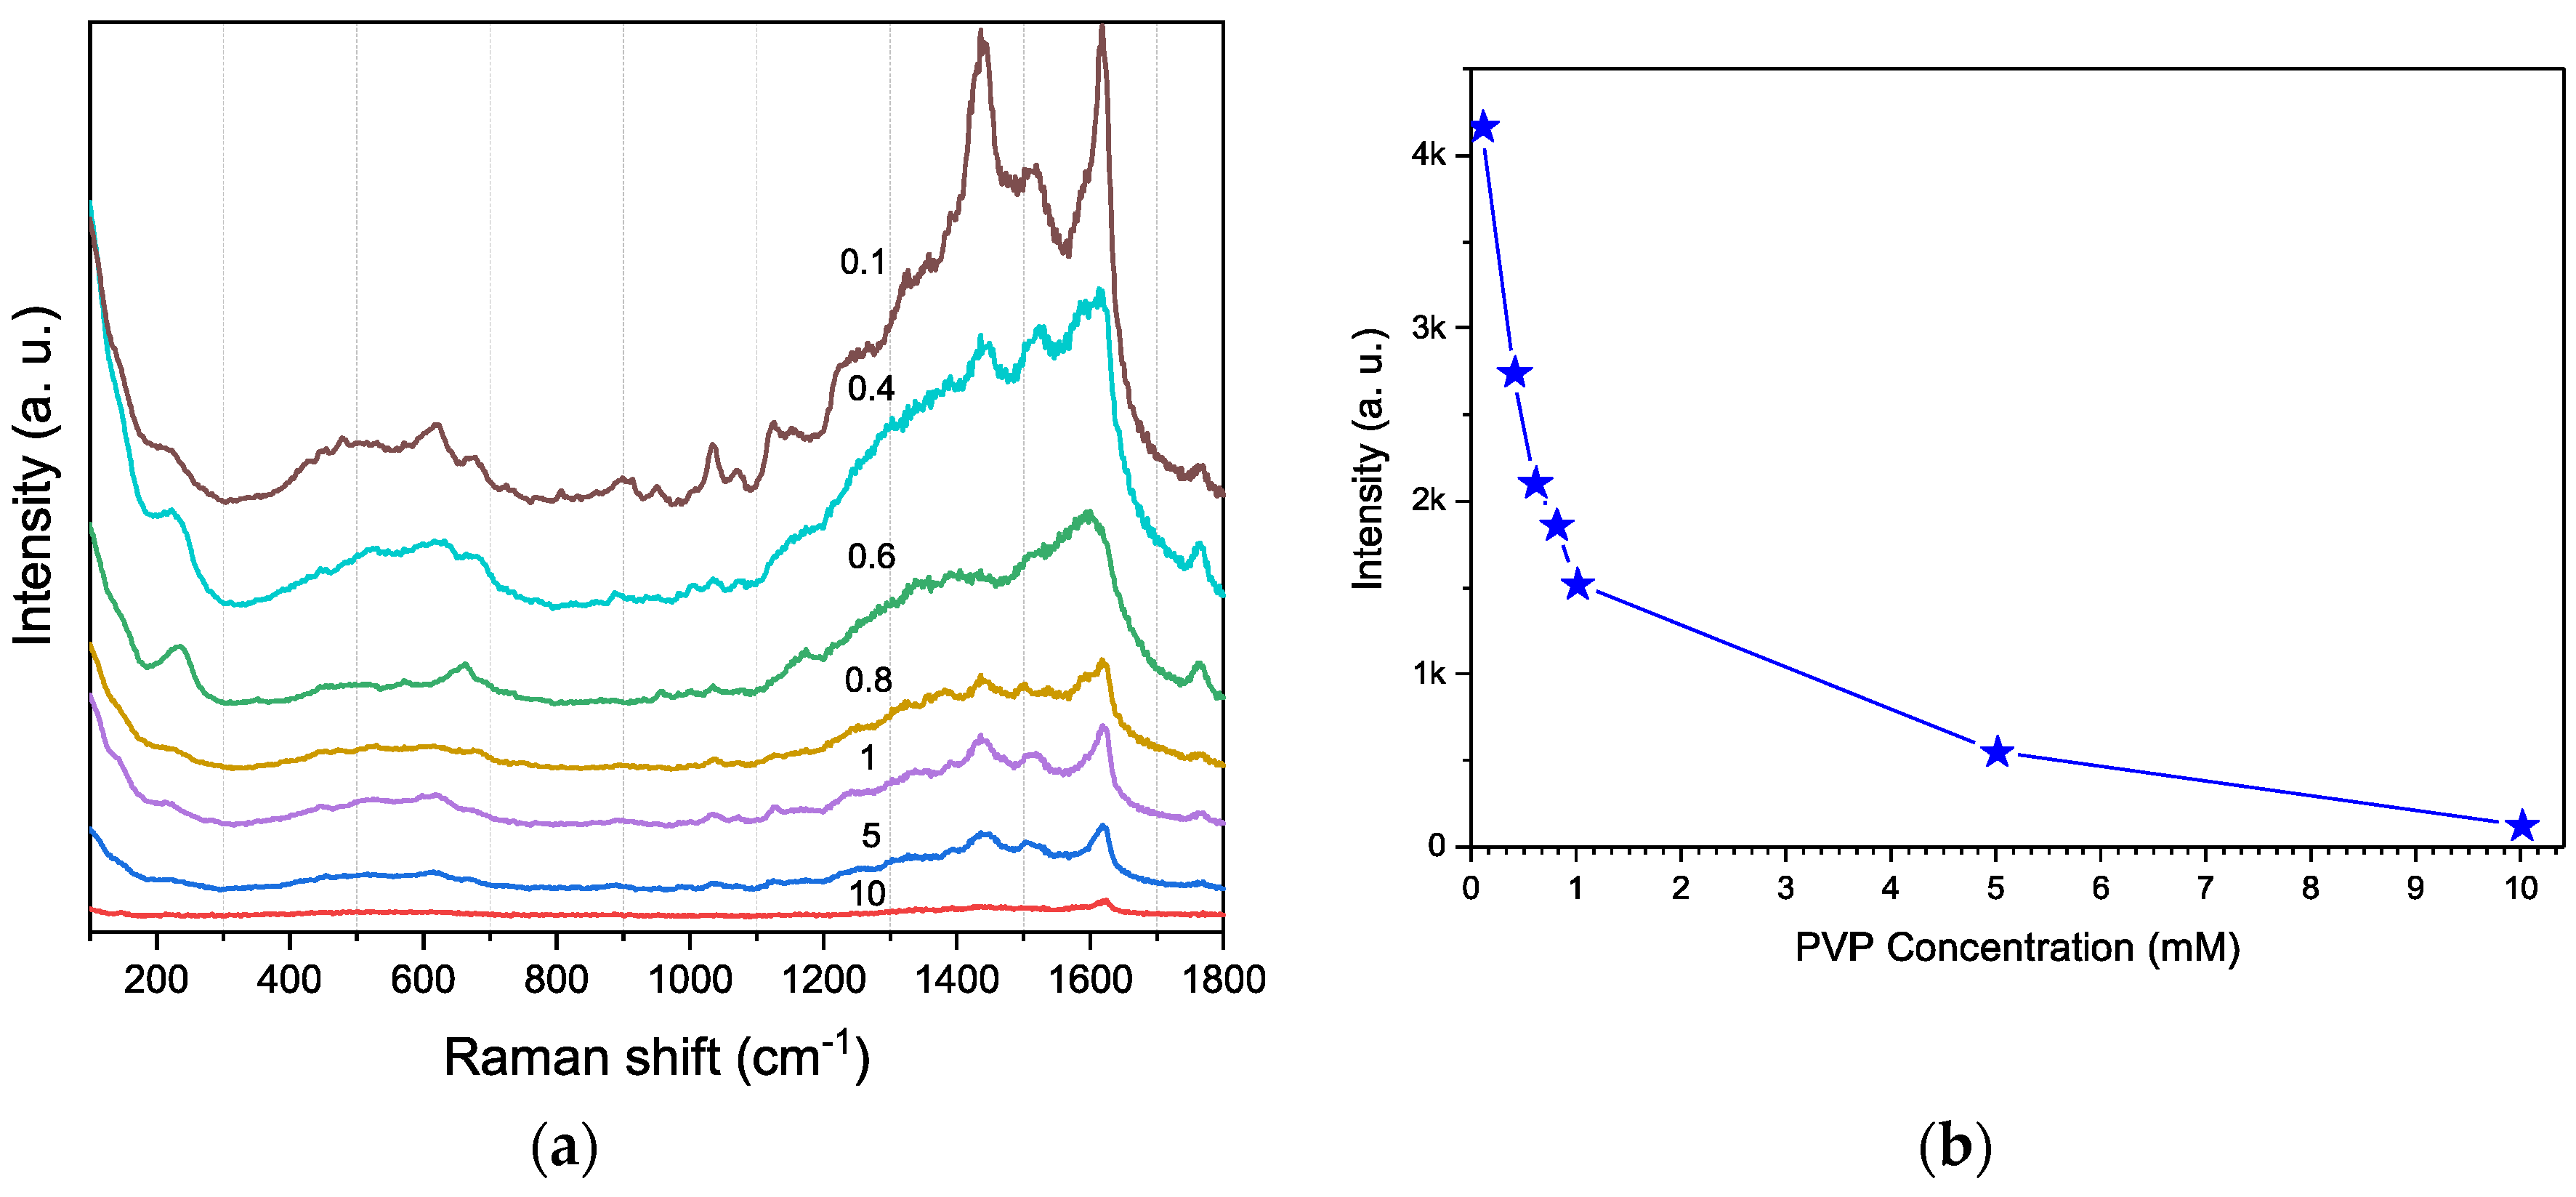
| 3.6 | 71.5 | 0.1 | 0.05 | 36.00 | 0.39 | ST |
Publisher’s Note: MDPI stays neutral with regard to jurisdictional claims in published maps and institutional affiliations. |
© 2022 by the authors. Licensee MDPI, Basel, Switzerland. This article is an open access article distributed under the terms and conditions of the Creative Commons Attribution (CC BY) license (https://creativecommons.org/licenses/by/4.0/).
Share and Cite
Zamora-Navarro, J.L.; González-Zárate, D.; Díaz-Solís, M.A.; Soriano-Rosales, M.G.; Okolodkov, Y.B.; Zamora-Peredo, L. SERS Detection of Methylene Blue and Crystal Violet Using Silver Nanostars. Mater. Proc. 2022, 9, 27. https://doi.org/10.3390/materproc2022009027
Zamora-Navarro JL, González-Zárate D, Díaz-Solís MA, Soriano-Rosales MG, Okolodkov YB, Zamora-Peredo L. SERS Detection of Methylene Blue and Crystal Violet Using Silver Nanostars. Materials Proceedings. 2022; 9(1):27. https://doi.org/10.3390/materproc2022009027
Chicago/Turabian StyleZamora-Navarro, José Luis, Daniela González-Zárate, Mario A. Díaz-Solís, María Guadalupe Soriano-Rosales, Yuri B. Okolodkov, and Luis Zamora-Peredo. 2022. "SERS Detection of Methylene Blue and Crystal Violet Using Silver Nanostars" Materials Proceedings 9, no. 1: 27. https://doi.org/10.3390/materproc2022009027