1. Introduction
Surface-enhanced Raman scattering (SERS) spectroscopy is a vibrational technique that enhances the Raman signal of vestigial molecules of interest adsorbed on rough metal surfaces or metallic nanostructures [
1,
2]. There are two mechanisms underlying the SERS effect: the electromagnetic mechanism (EM), which is the main contributor, and the chemical mechanism (CM) [
1,
2]. The CM involves charge transfers between the molecules and the metallic nanostructure by forming an analyte–metal complex [
1]. The EM occurs due to the metallic nanostructure’s localized surface plasmon resonance (LSPR), which significantly increases the electromagnetic field on the particle’s surface when irradiated with an excitation light source [
2]. This causes a drastic enhancement of the Raman modes of the molecule adsorbed at the metal surface. Since EM is hugely dependent on the metallic nanostructure, the fabrication of highly active SERS substrates is a hot topic among the scientific community.
Graphene-based materials, namely graphene, graphene oxide (GO), and reduced GO (rGO), have gained special attention due to their electrical conductivity, mechanical strength, chemical and thermal stability, and, more recently, as SERS sensors [
3]. Indeed, graphene has been proven to be a relevant SERS active substrate due to its capability of detecting analytes with high sensitivity, giving rise to a new modality defined as graphene-enhanced Raman scattering (GERS) [
3,
4]. The signal enhancement in graphene-based materials is based on the CM, occurring through charge transfer between the graphene and analyte molecules [
5,
6]. However, CM provides a limited contribution to SERS by itself compared to EM. Meanwhile, research has been carried out on fabricating hybrid materials containing graphene-based materials and metallic nanostructures, combining the CM effect of the 2D material with the EM of the plasmonic particles, thus, achieving high sensitivity [
6]. For example, the authors already reported in situ surface modification of GO with Au nanoparticles for highly efficient SERS detection of rhodamine 6G at low concentrations [
7].
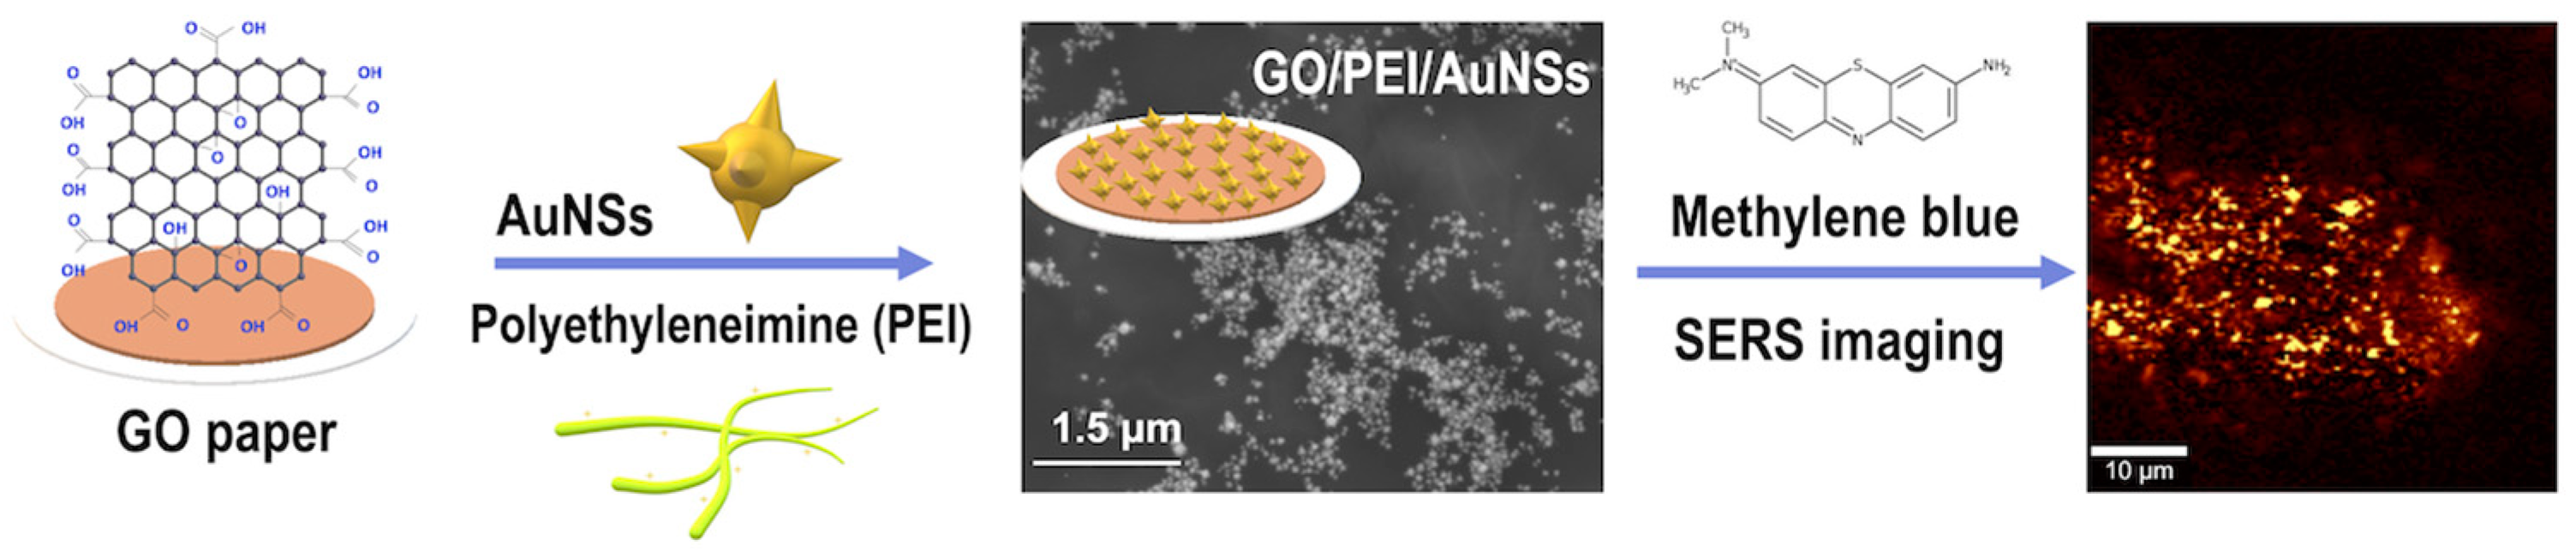
Nevertheless, fewer studies have been conducted on hybrid sensors containing GO paper for SERS applications [
8,
9]. This work uses chemical strategies to fabricate hybrid sensors based on GO paper decorated with Au nanostars (AuNSs). The AuNSs/GO papers were used as SERS substrates to detect trace levels of organic dyes in water, namely methylene blue (MB) (
Figure 1). Several strategies were employed to evaluate the SERS performance of the hybrid material, namely adding polyelectrolytes to the GO surface, using GO and rGO, and the deposition method of the AuNSs. We demonstrate that the AuNSs/GO papers are efficient SERS platforms for detecting vestigial amounts of MB, but, in principle, the methodology can be extended to other analytes.
2. Materials and Methods
2.1. Materials
The following chemicals were used as purchased: chloroauric acid trihydrate (HAuCl4·3H2O; 99.9%, Sigma-Aldrich, St. Louis, MO, USA), ascorbic acid (C6H8O6, J. M. Vaz Pereira, Lisbon, Portugal), silver nitrate (AgNO3, 99.9%, Sigma-Aldrich), acid chloride (HCl, 37%, AnaloR Normapur, VWR International, Radnor, PA, USA), branched polyethyleneimine (PEI, Mw = 750 k, Sigma-Aldrich), and methylene blue (MB, C16H18N3SCl, Riedel-De Haën, Seelze, Germany). All the solutions were freshly prepared using ultrapure water (18.2 MΩ·cm, 25 °C). GO was supplied by Graphenea (San Sebastian, Spain) with a concentration of 4 mg/mL.
2.2. GO Paper Preparation
GO paper was prepared using a method used by Gonçalves et al. [
10], consisting of the filtration under reduced pressure of 10 mL of GO aqueous colloidal solution (2 mg/mL) through a polyamide membrane filter (Whatman, diameter: 47 mm; pore size: 0.22 mm) placed into a filter membrane holder, until completely dry. Usually, GO sheets are assembled horizontally into a thin layer at the interface with the PA filter membrane. This thin GO layer can be easily removed after drying. A GO paper was then heat-treated at 200 °C in a Vacutherm vacuum oven for 12 h to achieve rGO paper.
2.3. Au Nanostars (AuNSs) Preparation
The AuNSs were prepared by a seed-mediated growth method [
11]. First, an Au seed colloidal solution was prepared by adding 10 mL of trisodium citrate (38.8 mM) all at once into a refluxed (90 °C) aqueous solution of HAuCl
4 (1 mM, 100 mL). The colloidal Au seeds were kept in the dark at a temperature of 5 °C before use. Then, the as-prepared Au seeds (100 μL) were added to 10 mL of a HAuCl
4 solution (0.25 mM), followed by 5 μL HCl (1 M) at room temperature; the solution was vigorously stirred for 5 s. Then, 100 μL of silver nitrate (8 mM) and 50 μL of ascorbic acid (100 mM) were added simultaneously. The solution was stirred for 30 s as its colour rapidly turned from light red to greenish-black.
2.4. AuNSs/GO Hybrid Sensors Preparation
A positively charged polyelectrolyte, namely PEI (2 mg/mL), was added to GO paper by soaking it in the PEI aqueous solution for 1 min. Then, the GO paper was immersed into the AuNSs colloidal solution (AuNSs/PEI/GO_1). In a second approach, drops of AuNSs colloidal solution were added to the GO paper already coated with PEI. This process was repeated at least 3 times (AuNSs/PEI/GO_1drop, AuNSs/PEI/GO_2drop and AuNSs/PEI/GO_3drop).
2.5. SERS Measurements
For the SERS measurements, MB was used as an analyte model to evaluate the SERS sensitivity of the substrates. An aliquot (10 μL) of an aqueous solution of MB (100 μM) was dropped on the hybrid substrates and allowed to dry at room temperature. A total of 10 spectra were acquired (10 acquisitions, 5 s each) on each substrate, and an average Raman spectrum was obtained using WITec software (Project 5.3+). Pure GO paper was used as the control sample. SERS measurements were performed in 3 replicas in different substrate areas to evaluate reproducibility. The same procedure was used to detect crystal violet (CV) and rhodamine B (RhB), both with a concentration of 100 μM. Raman imaging took 22,500 Raman spectra in a uniform 50 × 50 μm grid. A 100× objective was used, and the integration time for each spectrum was 0.05 s. Raman image was constructed by integrating the absolute area underneath the MB Raman band at 1620 cm−1 using Project 5.3+.
2.6. Instrumentation
Scanning electron microscopy (SEM) images were obtained with a SU-70 Hitachi instrument. FTIR measurements were performed with a Bruker Optics Tensor 27 spectrometer, using 256 scans at a 4 cm−1 resolution. Raman studies were carried out on a Raman–AFM–SNOM WITec alpha 300RAS+. A He:Ne laser operating at 633 nm and a Nd:YAG laser operating at 532 nm were used as the excitation source with the power set at 0.1 mW. The zeta potential measurements were performed in a ZetaSizer Nano ZS model Zen3500.
3. Results and Discussion
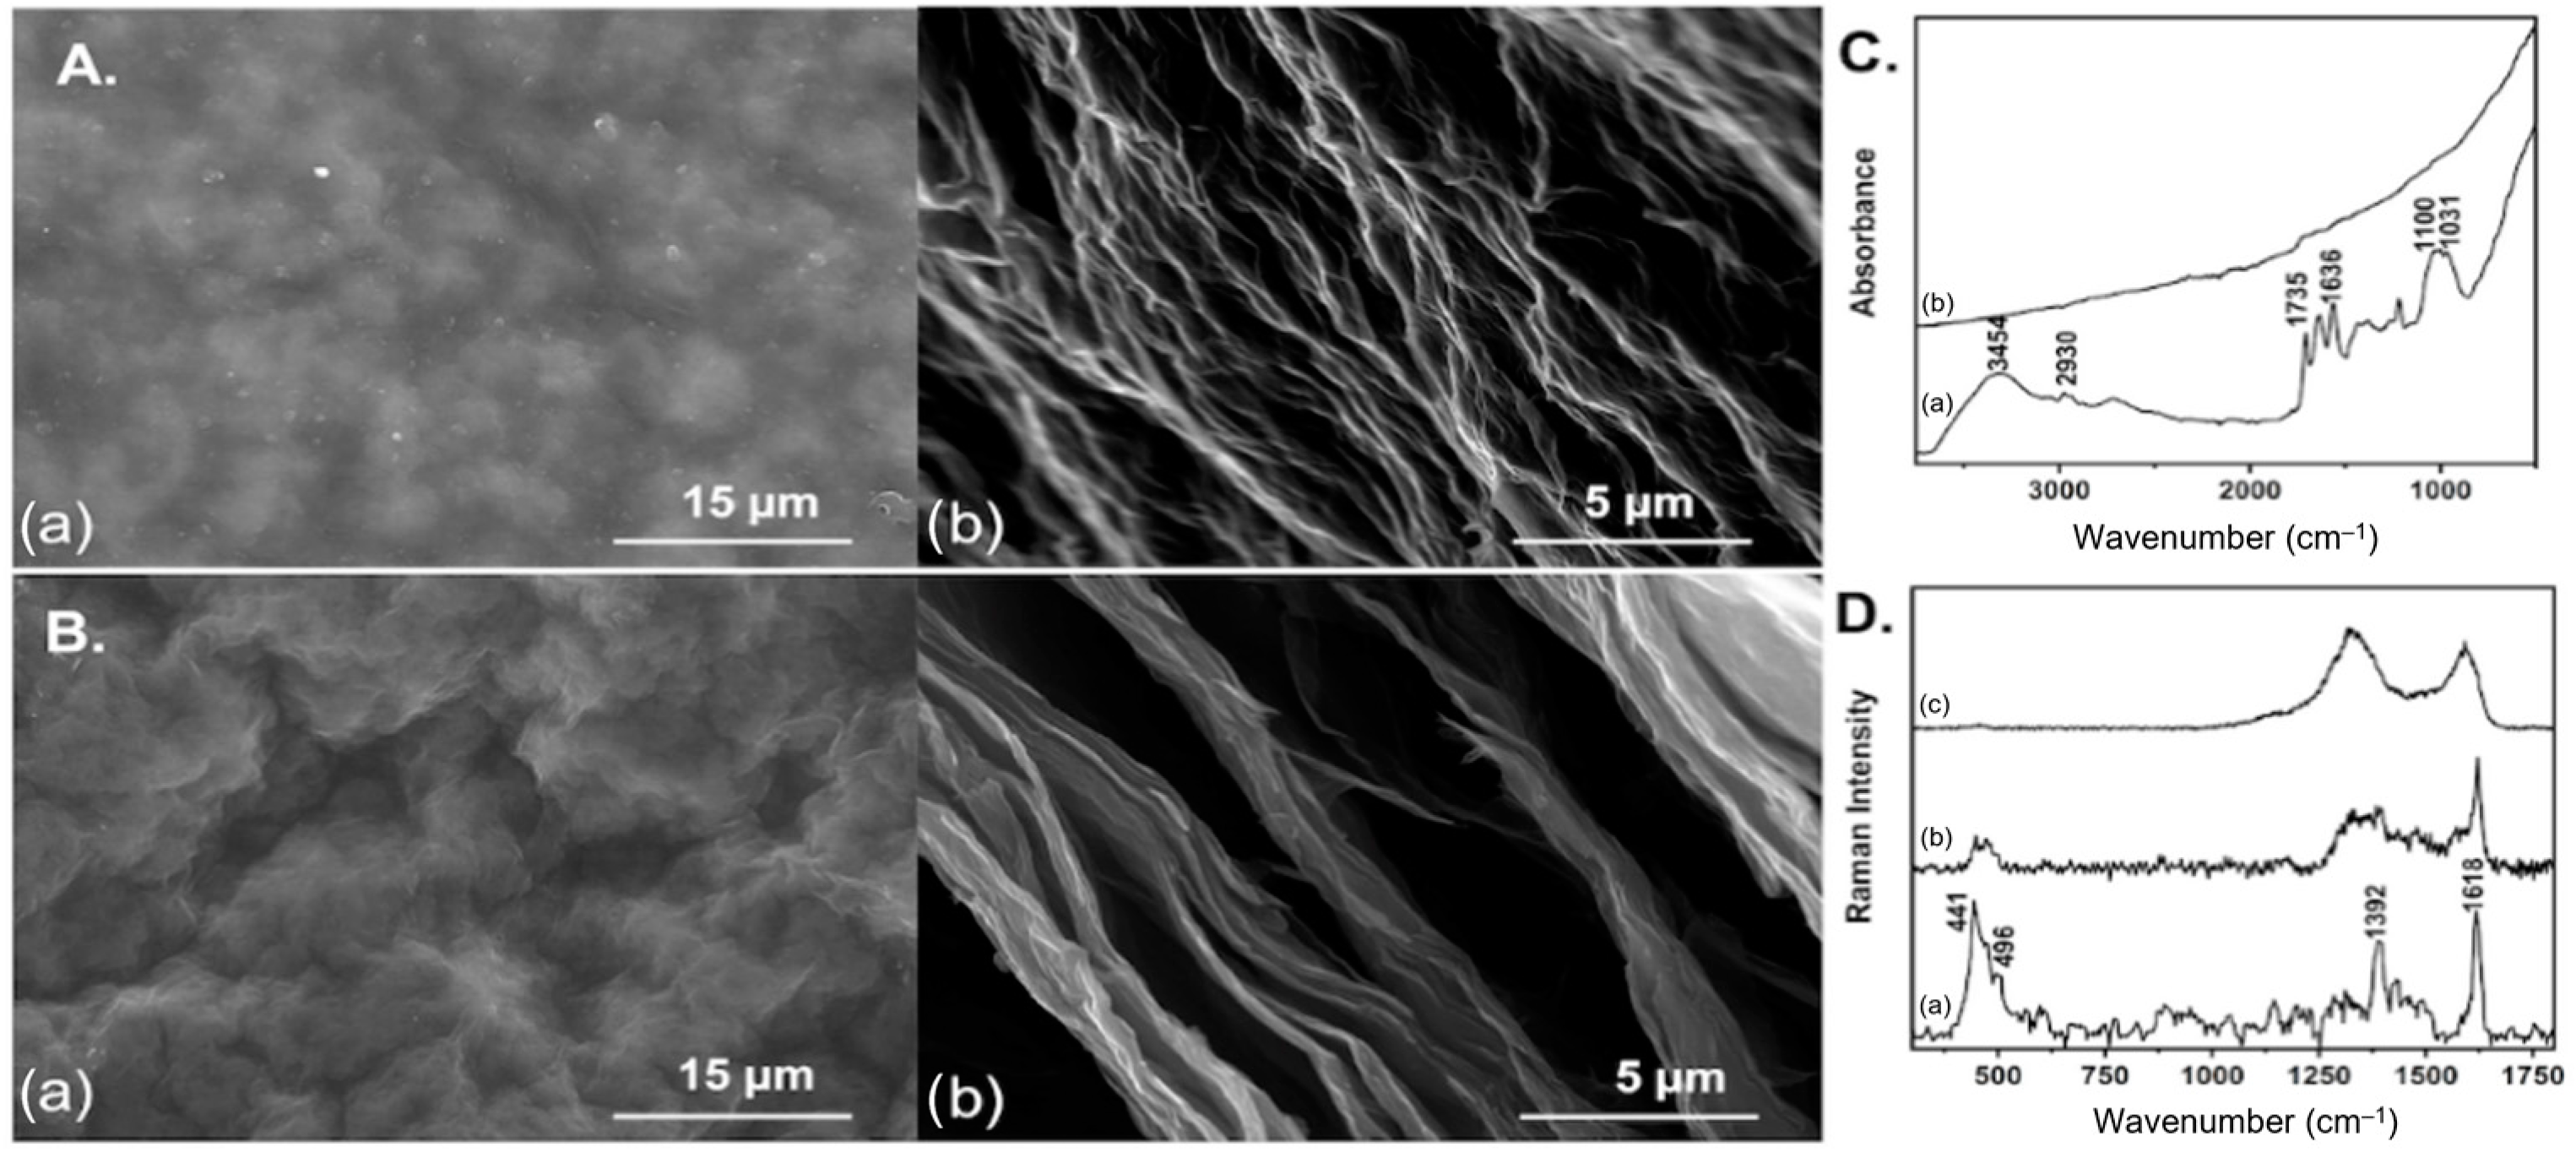
GO and rGO membranes thermally reduced at 200 °C were characterized using SEM and FTIR. The SEM analysis revealed a rough membrane with well-packed layers through the cross-section of the GO paper (
Figure 2A(a,b)). At the same time, the side view of rGO demonstrates a less packed layer due to the heat treatment (
Figure 2B). This effect can be attributed to the thermal expansion between the GO nanosheets caused by the increasing pressure of the adsorbed water and the reduction of the oxygen functional groups [
10]. In
Figure 2C(a), the FTIR spectrum of GO paper shows the characteristic vibrational modes for GO powder, including υ(C-O) from epoxy groups at 1031 cm
−1, υ(C-OH) at 1100 cm
−1, skeletal C=C bond vibrations of the graphitic domains at 1636 cm
−1, and υ(C=O) from carbonyl and carboxylic groups at 1735 cm
−1 [
12,
13,
14]. In the case of rGO, the FTIR spectrum is very different (
Figure 2C(b)). The disappearance or decrease of the bands in the FTIR spectrum indicates the removal of oxygen-containing functional groups (carboxyl, hydroxyl, and epoxy) from the GO surface to a certain degree [
14]. This result demonstrates that 12 h is enough to reduce the GO membrane.
The GO and rGO membranes were used as SERS platforms to detect MB, a cationic dye commonly used in the textile industry that can produce potentially carcinogenic aromatic amines (benzidine and methylene) [
15,
16].
Figure 2D shows the average Raman spectra of MB (100 μM) adsorbed on the GO and rGO paper. The conventional Raman spectrum of MB (0.1 M,
Figure 2D(a)) is compared. In both GO samples, the characteristic Raman features for carbon materials can be observed: the D band (disorder band) at 1345 cm
−1 and the G band (graphite band) at 1568 cm
−1. These results agree with reports in the literature for GO samples [
17,
18]. Then, while the Raman analysis on rGO did not show the Raman signal for MB molecules (
Figure 2D(c)), the Raman spectrum of MB adsorbed on GO shows the characteristic Raman bands of the MB (
Figure 2D(b)), including the skeletal deformation (CN, CS, and CH
3) at 441 cm
−1, δ
in-plane(thiazine ring) at 496 cm
−1 and υ(CC), δ
in-plane(CH) from the ring, and υ(CN) at 1618 cm
−1 [
15,
19]. One possible explanation for this result is the formation of π–π interaction between the aromatic rings from MB and the carbons of the hexagonal lattice and through electrostatic interactions between the functional groups present in the GO surface that are negatively charged and the positive charge of the MB molecules [
20]. This result indicates that the functional groups of GO play an important role in the adsorption of MB; thus, the fabrication of hybrid materials containing AuNSs was performed using GO papers.
Due to functional groups, GO has a negatively charged surface in aqueous solutions (−35.2 ± 2.7 mV; pH 6.8) [
13]. Because the AuNSs also displayed a negative zeta potential (−26.0 ± 5 mV, pH = 2.6), attaching AuNSs onto the GO paper will not be favorable due to electrostatic repulsion. Therefore, the AuNSs/GO hybrid sensors were obtained by attaching the AuNSs onto GO previously modified with a positive polyelectrolyte (PEI) by dip coating and drop casting. The presence of AuNSs on the GO paper was confirmed by SEM analysis, as illustrated in
Figure 3A,B. Due to the preparation method, the AuNSs/PEI/GO_1 paper (
Figure 3A) presents fewer AuNSs than the AuNSs/PEI/GO_1drop paper (
Figure 3B). However, in both methods, the AuNSs retained their star-shaped morphology.
The influence of the hybrid substrates’ preparation method on MB’s SERS detection was investigated and compared with the SERS signal obtained for GO paper (without AuNSs).
Figure 3D plots the average intensity of the MB band at 1620 cm
−1 for GO, AuNSs/PEI/GO_1 and AuNSs/PEI/GO_1drop hybrid sensors. An enhancement of MB Raman signal is observed for the substrates with AuNSs (466 ± 125 ccd counts for AuNSs/PEI/GO_1 and 754 ± 208 for AuNSs/PEI/GO_1drop) compared to the pure GO paper (223 ± 66 ccd counts), with the AuNSS/PEI/GO substrates prepared by drop casting being more sensitive. The detection limit for MB using both substrates was also evaluated, being 1 μM for AuNSs/PEI/GO_1 and 100 nM for AuNSs/PEI/GO_1drop. This result can be explained by the higher amount of AuNSs added to the GO paper surface using the drop casting approach, promoting the formation of more active regions or the so-called “hot spots”.
Because the AuNSs/PEI/GO_1drop sensor presents the best SERS performance, more AuNSs drops were added to the GO papers to evaluate their sensitivity to detecting MB. The SERS analysis demonstrates an increase in the Raman signal of MB from one drop to three drops of AuNSs, as illustrated in
Figure 3D. This result shows that not only the increase of the AuNSs amount on the GO paper surface increases the Raman signal of MB, which is in line with the SEM image for AuNSs/PEI/GO_3drop (
Figure 3C), but also that the AuNSs play an essential role for the SERS detection of MB. Considering this, three drops of AuNSs were added to a polyamide filter membrane (PA) and used as a SERS substrate to detect MB. The Raman signal of MB adsorbed on the PA/AuNSs_3drops was lower than the Raman signal obtained using AuNSs/PEI/GO_3drop. This result can be explained by the conjugation of the electromagnetic mechanism from the AuNSs and the chemical mechanism of GO materials, which can interact with the MB through electrostatic interactions and π–π interaction [
20]. The distribution of the MB molecules was monitored by SERS imaging using AuNSs/PEI/GO_3drop (
Figure 3E). The SERS image was obtained by integrating the area of the MB Raman band at 1620 cm
−1. The yellow/orange areas match the zones with stronger Raman signals for MB molecules adsorbed on the AuNSs distributed over the GO surface. The AuNSs/PEI/GO_3drop paper was also used as a SERS sensor to detect other organic dyes, namely CV and RhB (
Figure 3F), showing the Raman signal of both organic dyes. This result opens a new field of research for developing hybrid sensors containing GO for optical sensing applications to detect a variety of molecular probes.


