
Synthesis and Characterization of Cellulose Nanomaterials from Waste Newspapers †


Abstract
:1. Introduction
2. Materials and Methods
2.1. Materials Used
2.2. Methodology
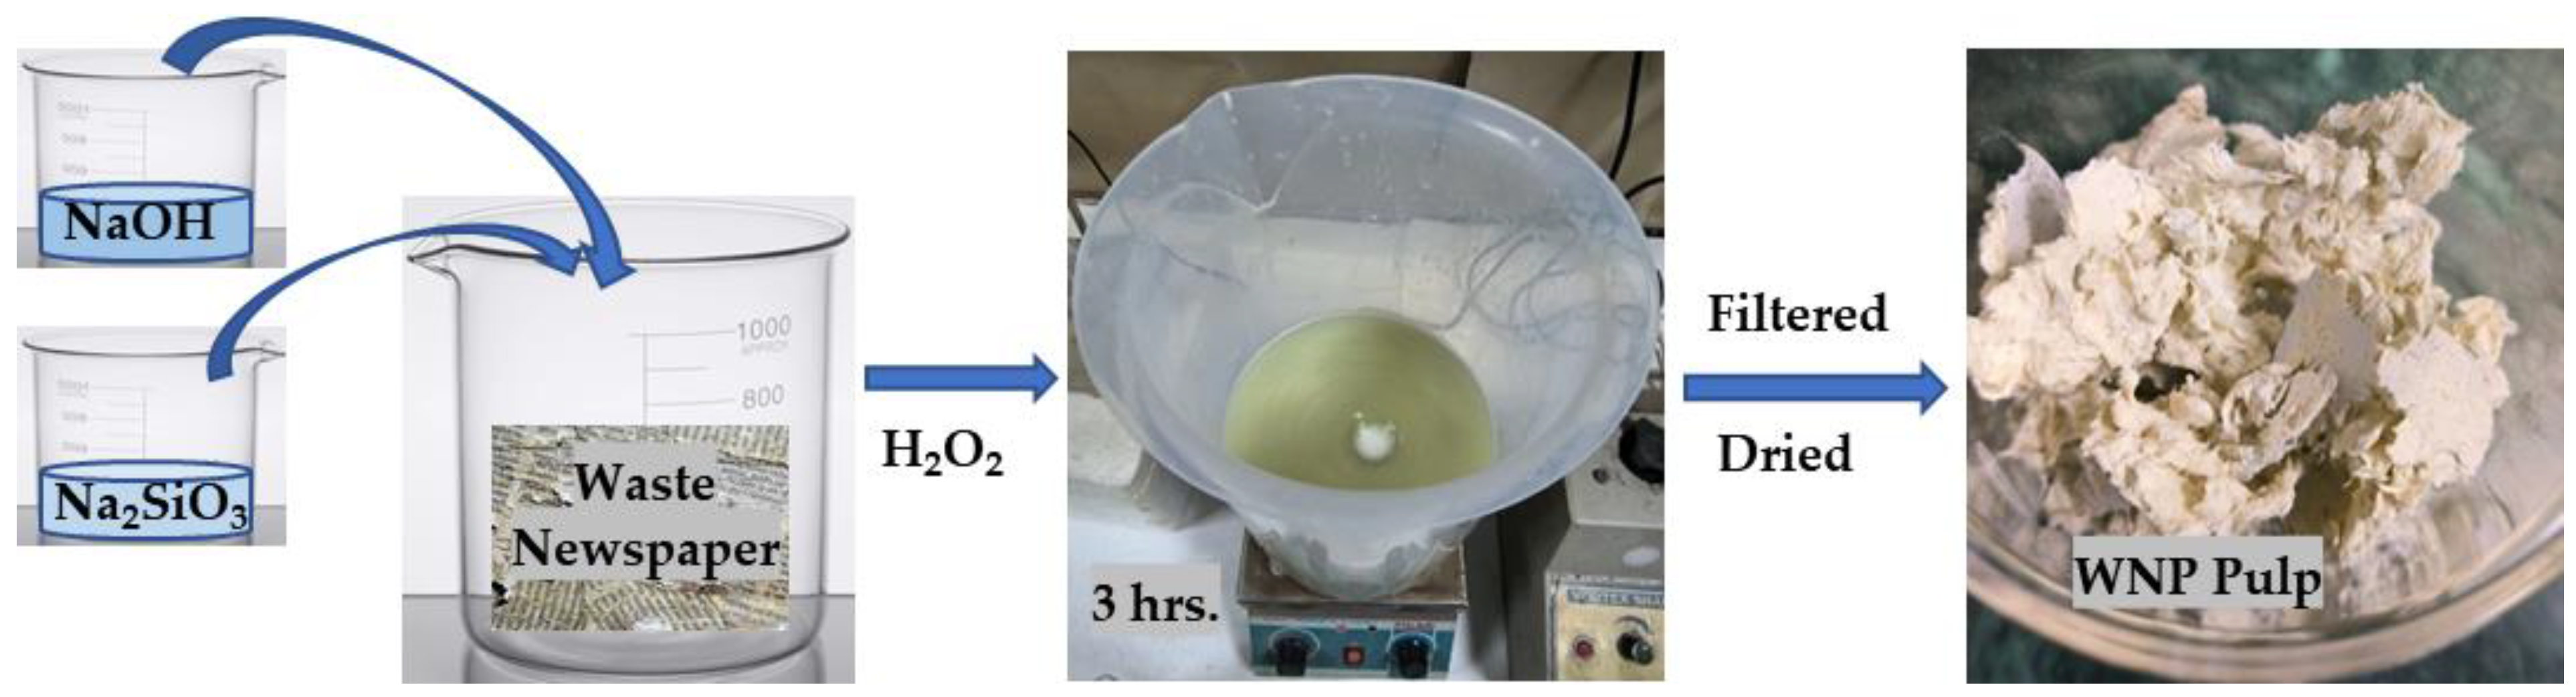
2.2.1. Deinking of WNPs
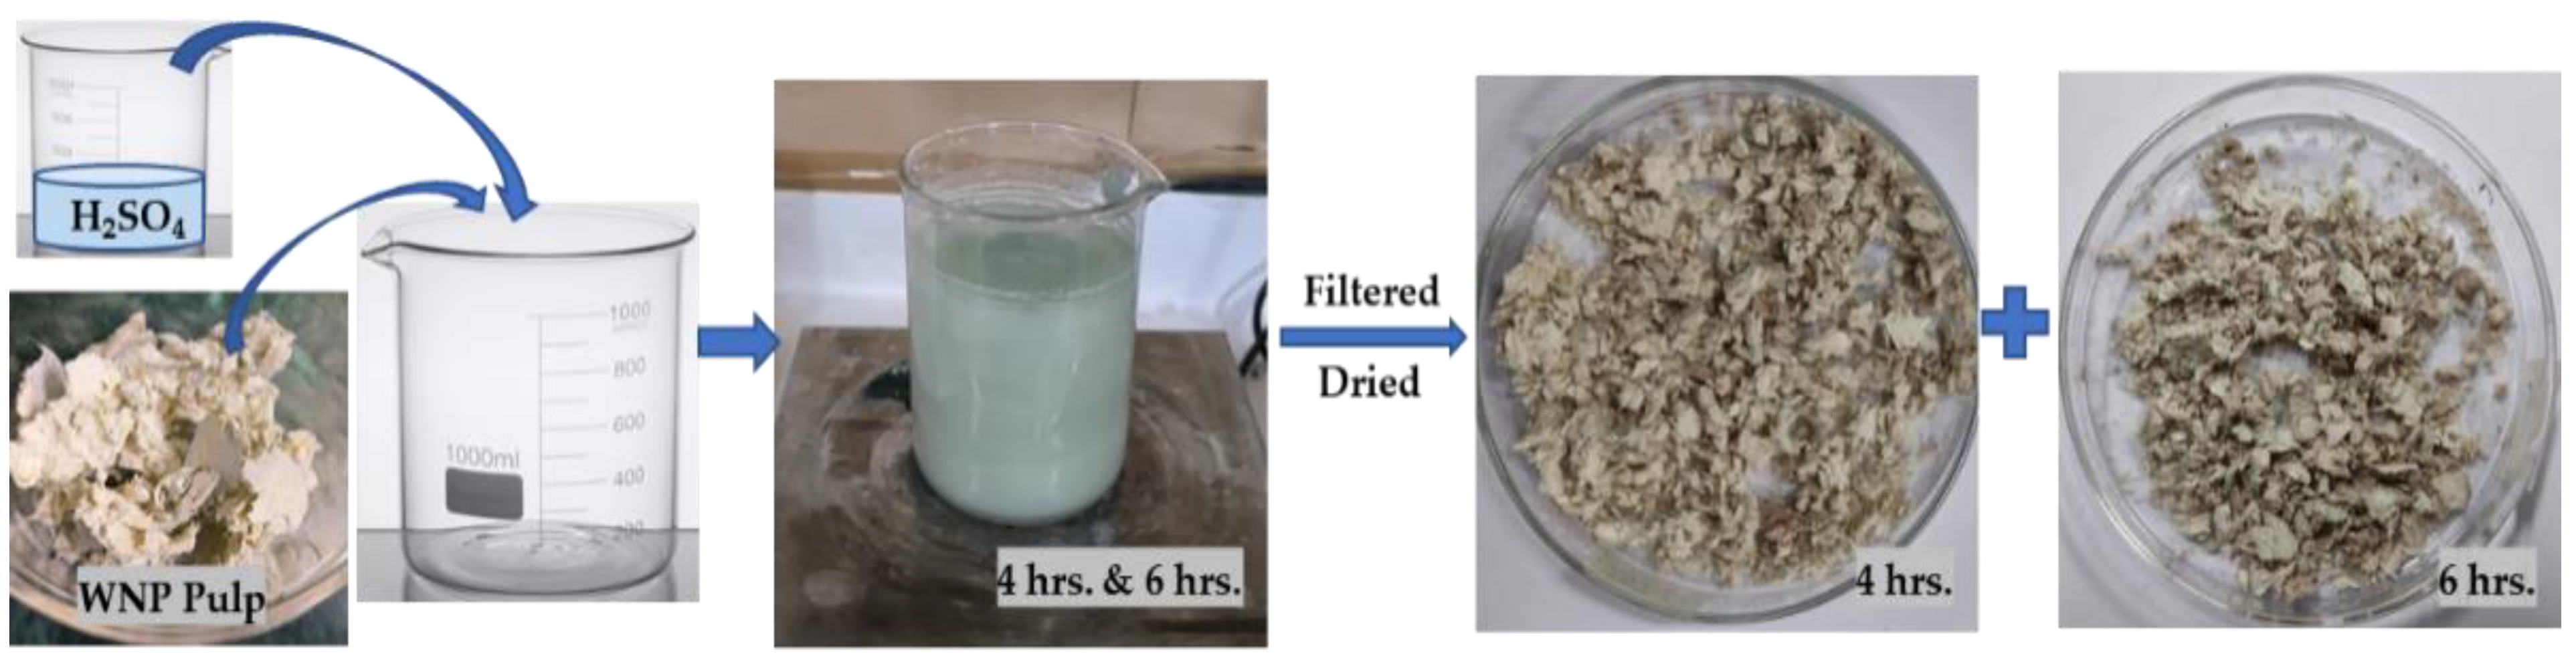
2.2.2. Preparation of CNCs
CNCs by Chemical Hydrolysis
CNC by Mechanical Grinding
2.2.3. CNC Characterizations
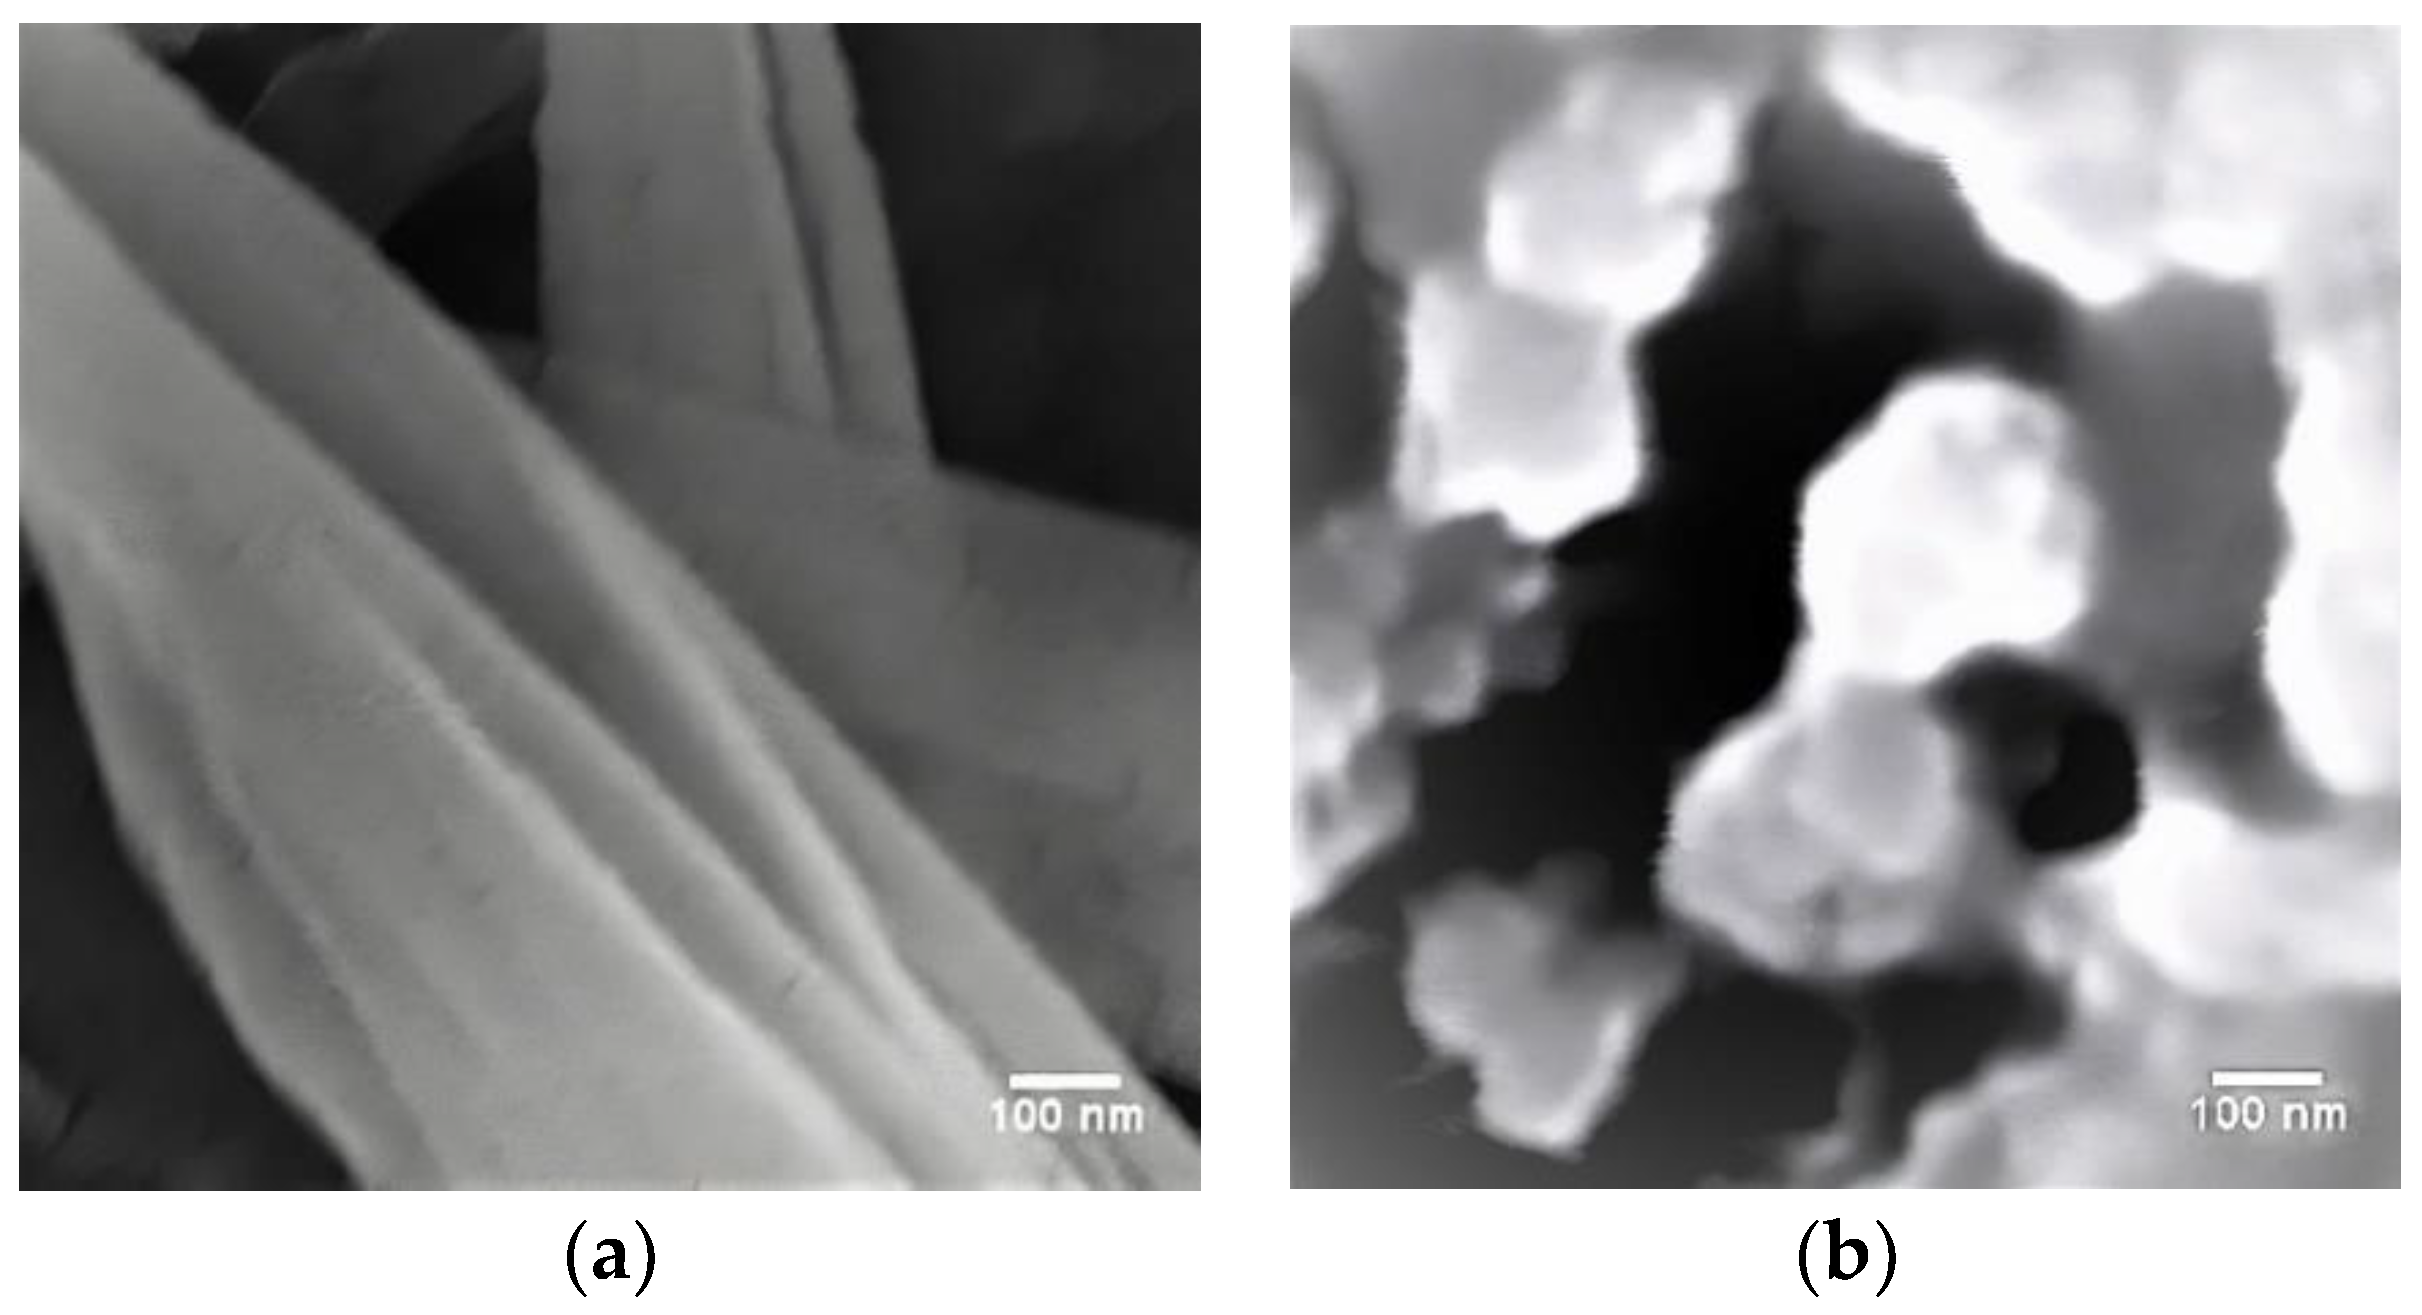
Scanning Electron Microscopy (SEM)
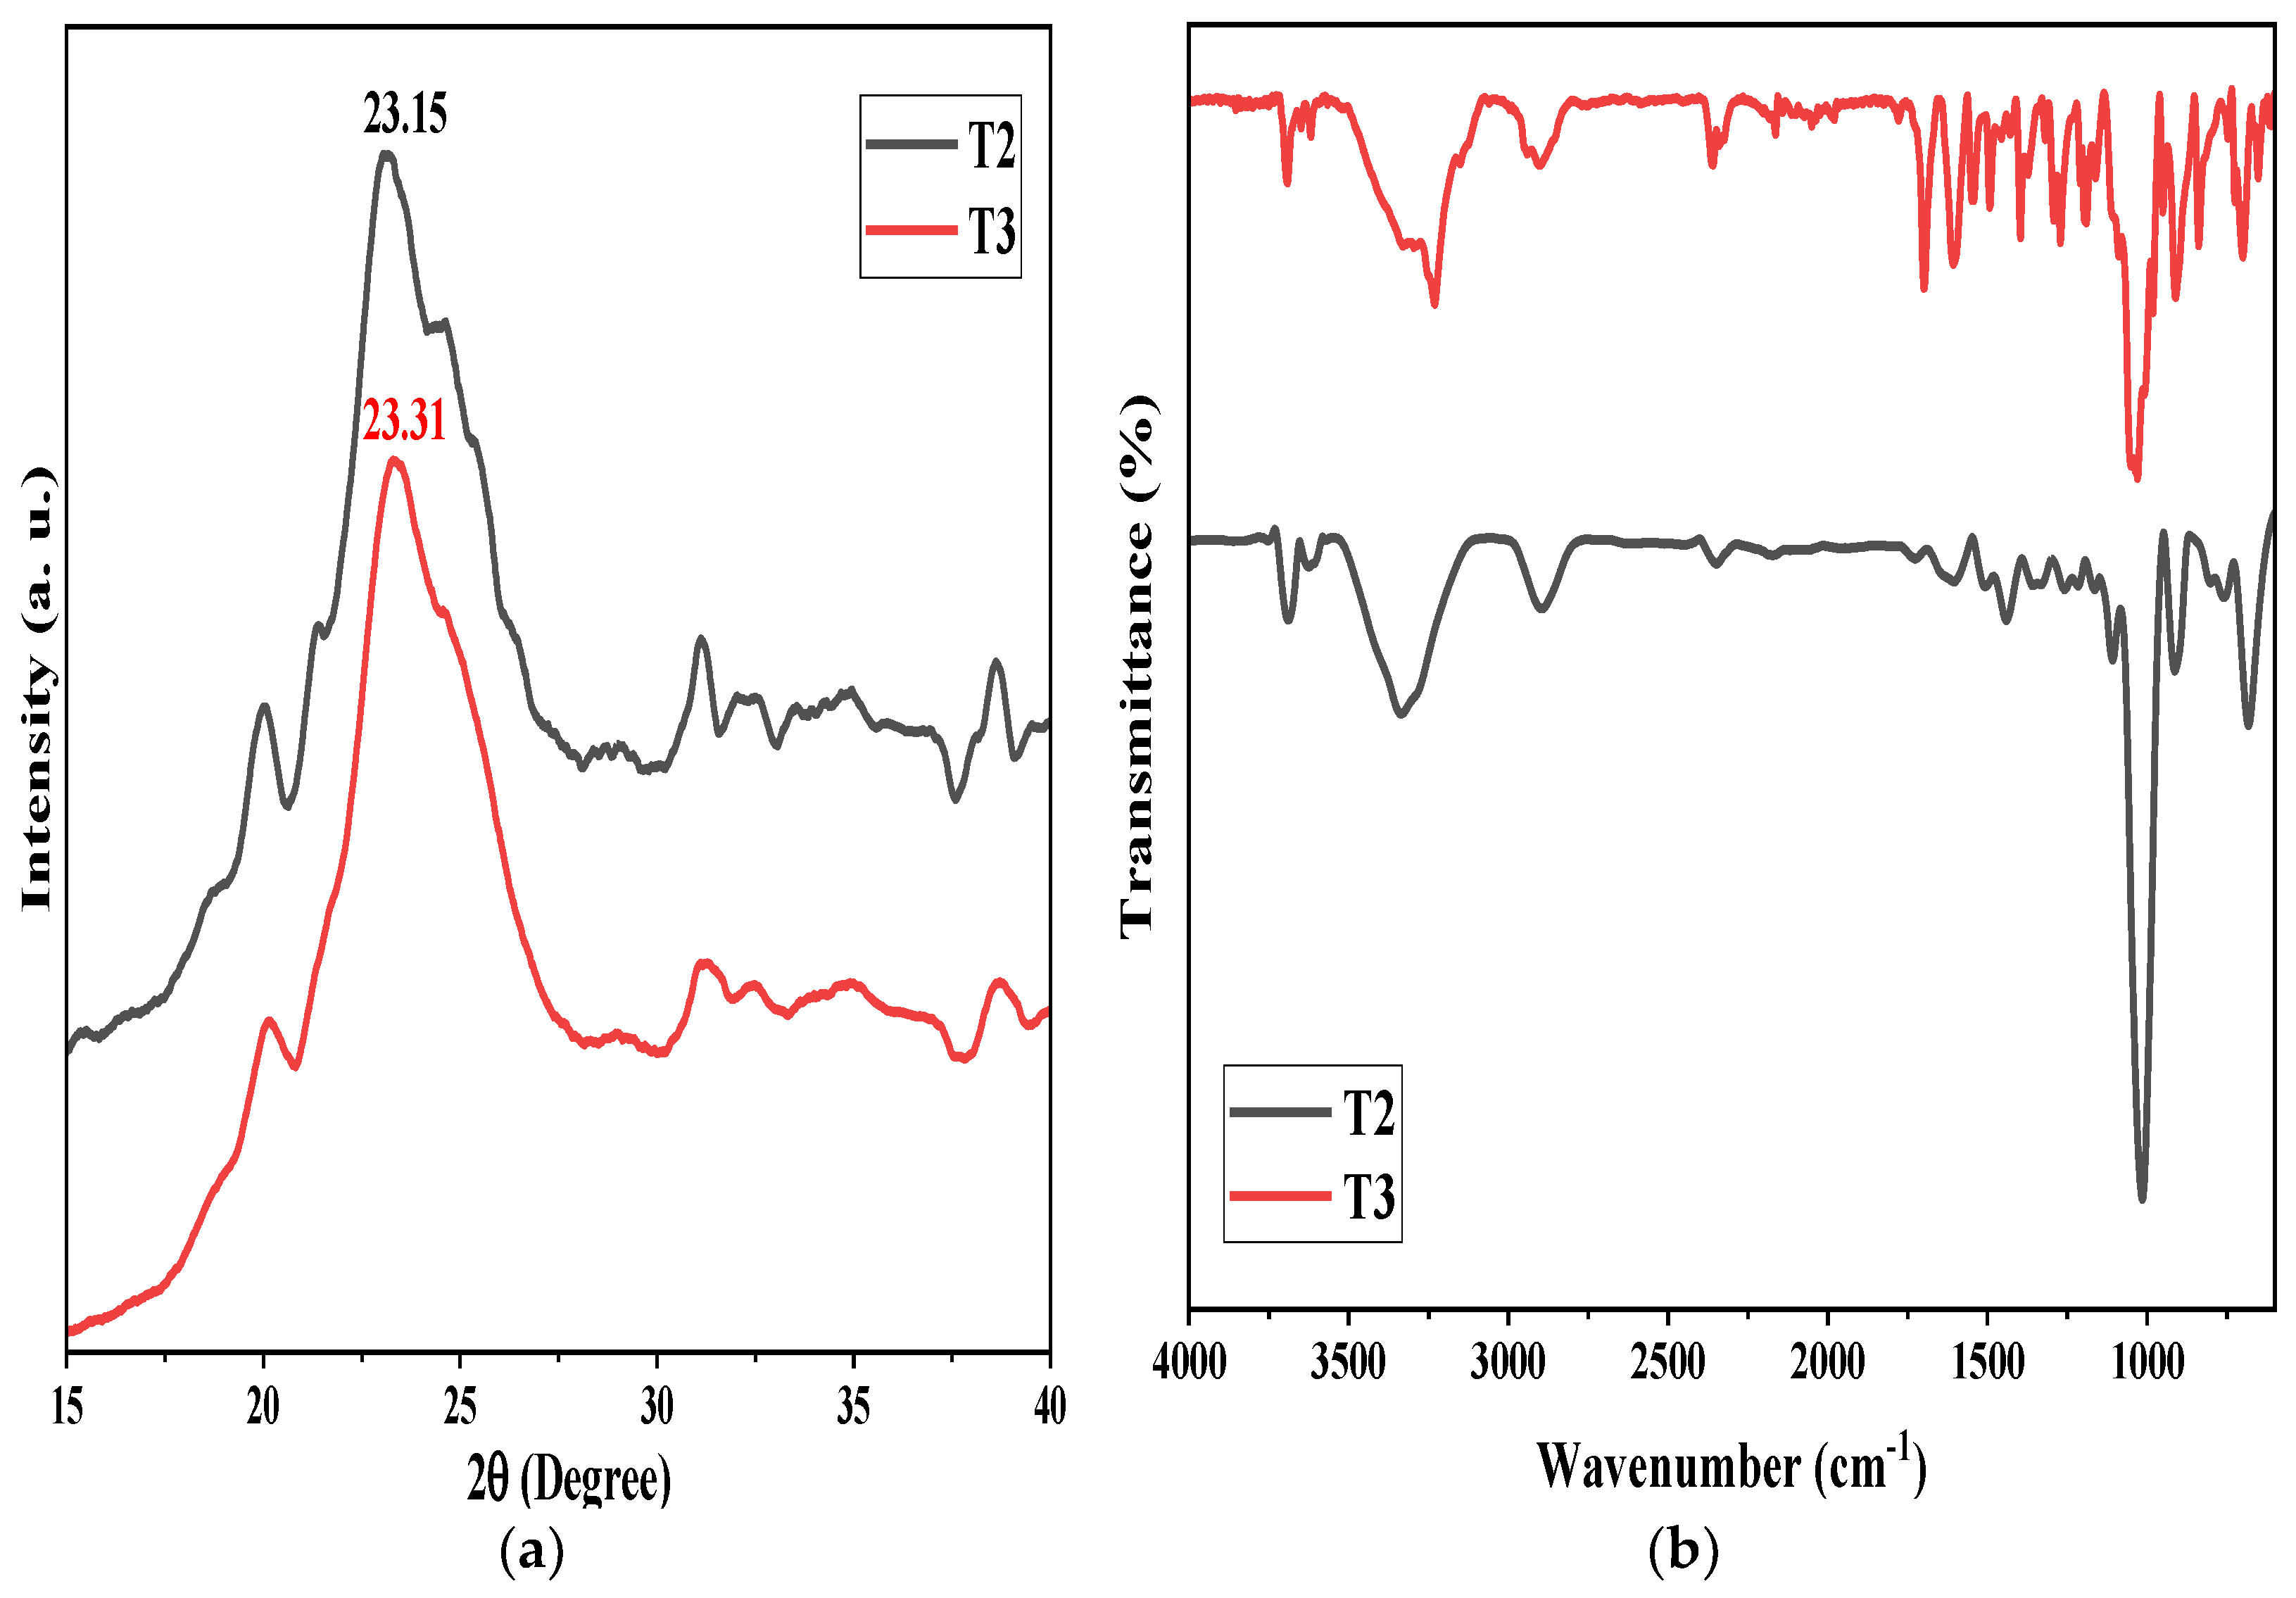
X-ray Diffraction (XRD)
Fourier Transforms Infrared Spectroscopy (FTIR)
Dynamic Light Scattering (DLS) and Zeta Potentials Measurements
UV-Visible Spectroscopic
3. Results and Discussion
3.1. Scanning Electron Microscopy (SEM)
3.2. X-ray Diffraction (XRD)
3.3. Fourier Transform Infrared Spectroscopy (FTIR)
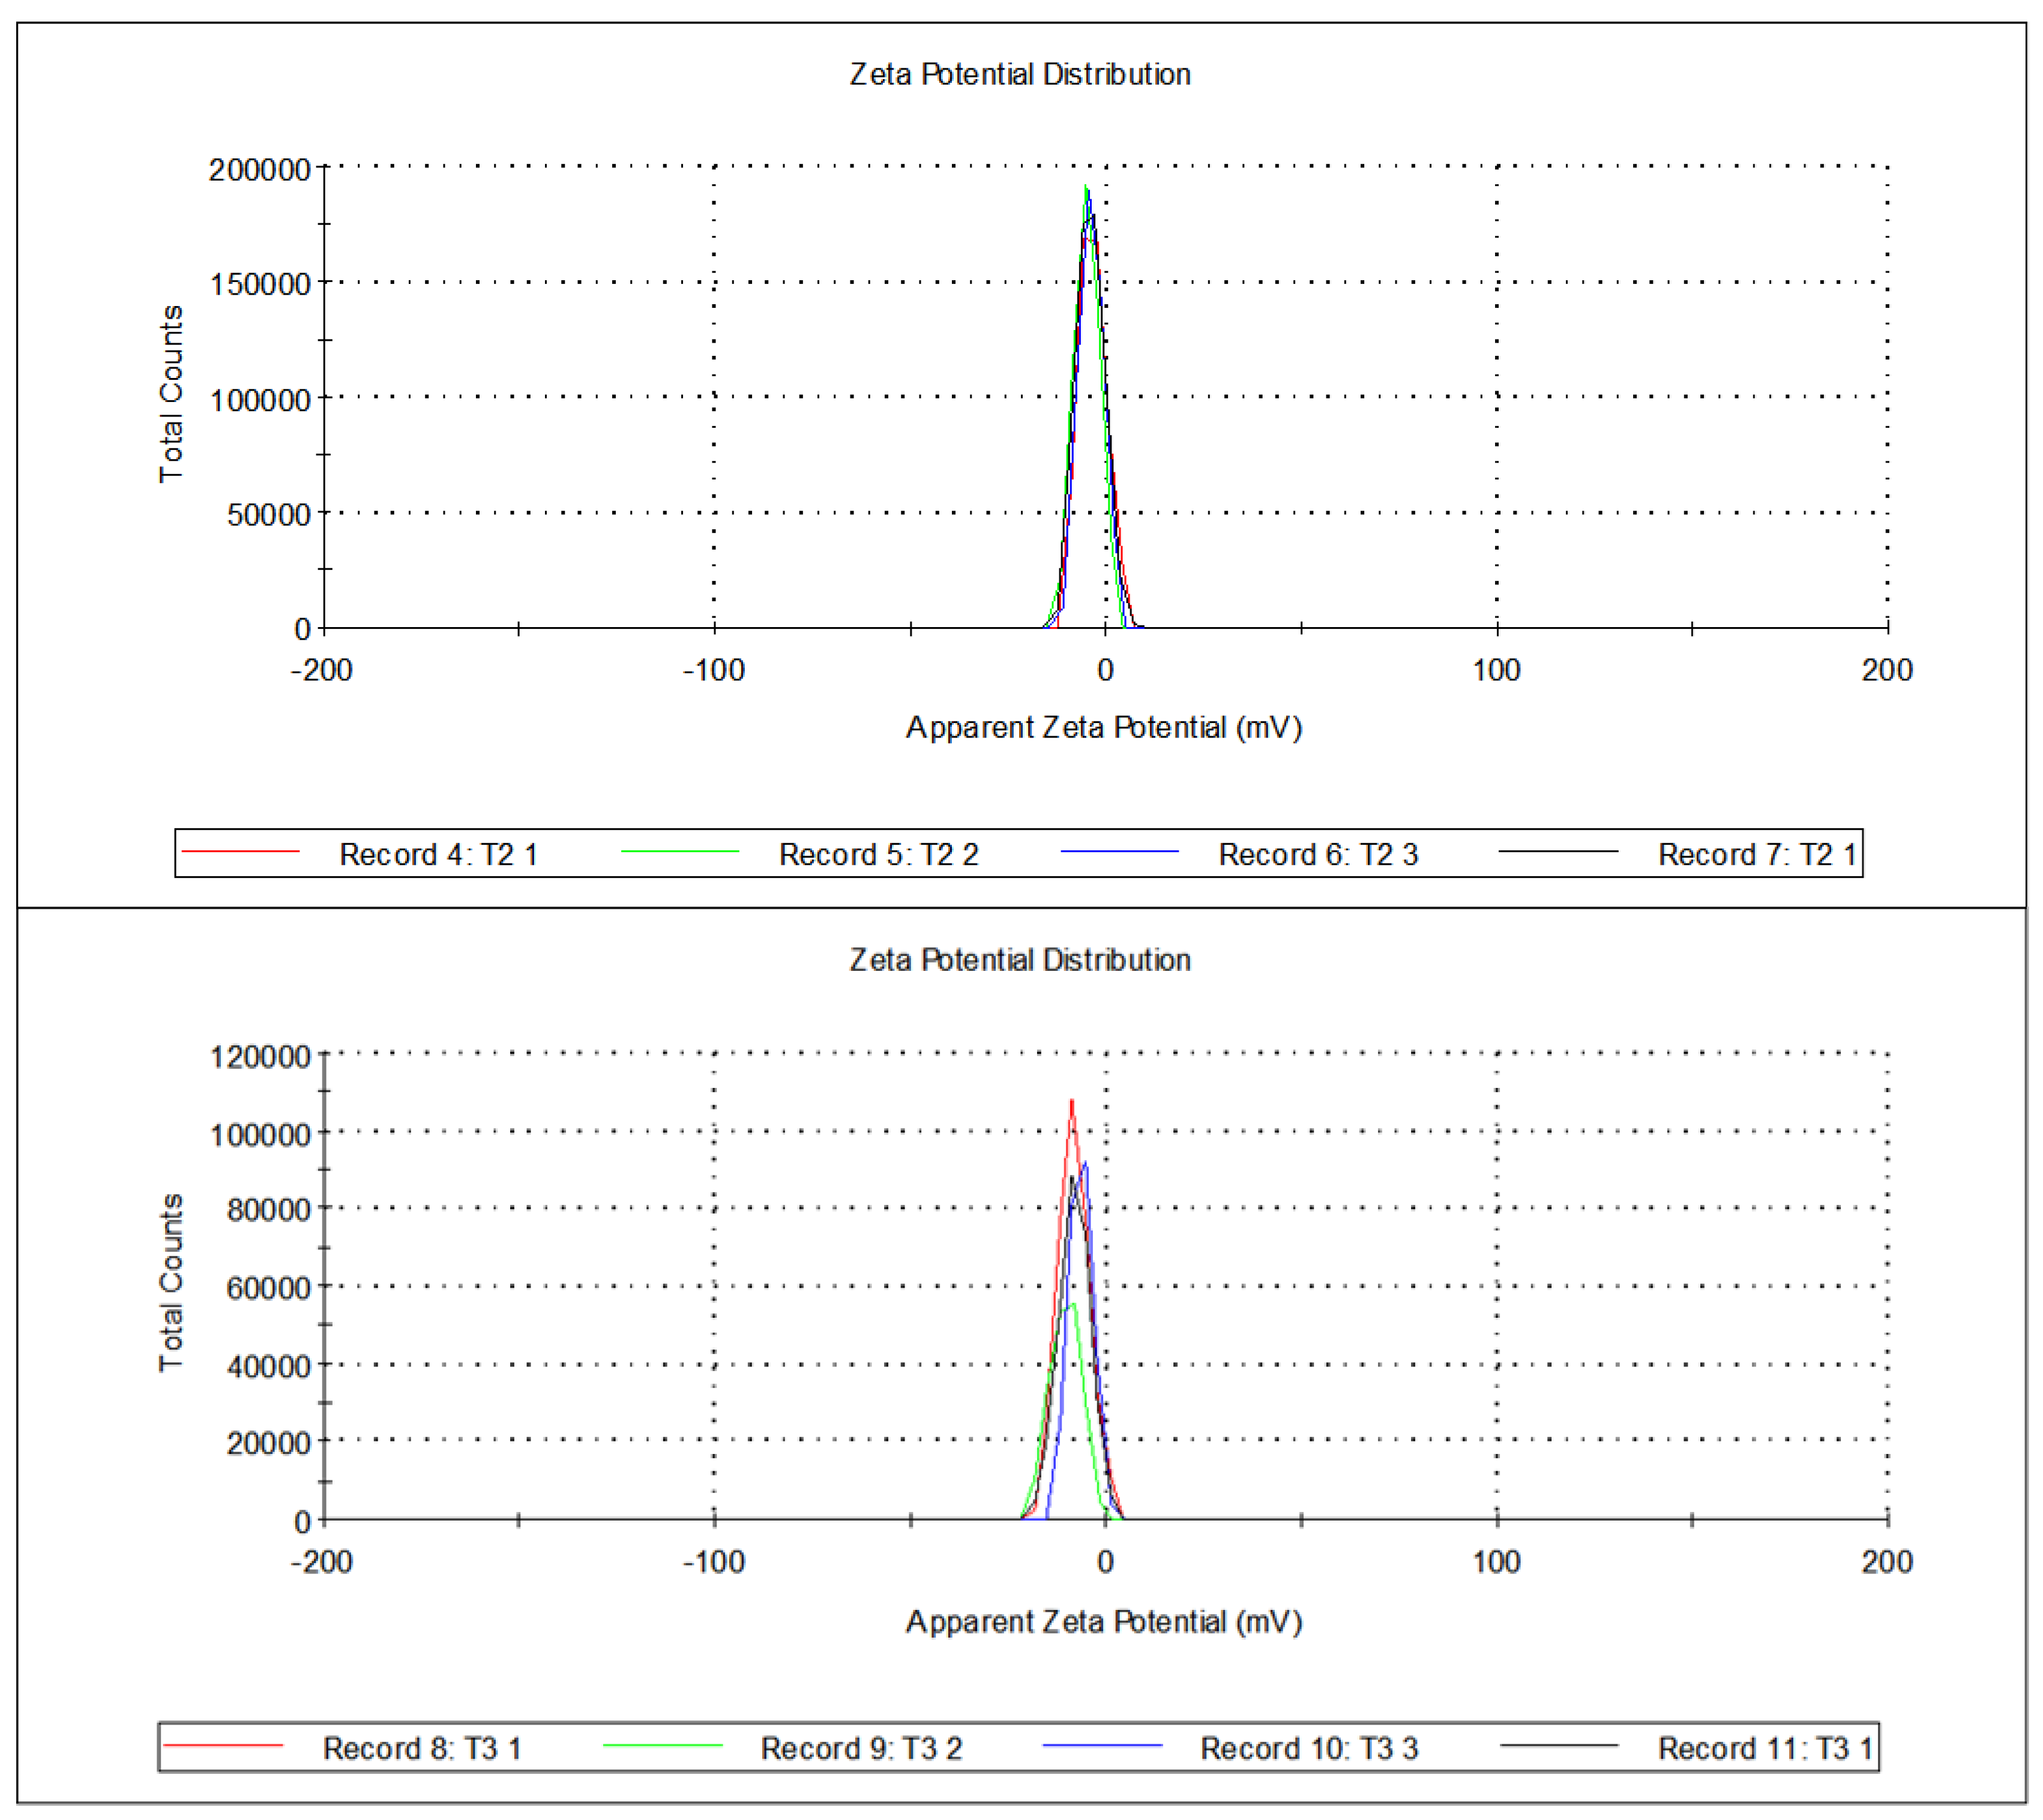
3.4. Dynamic Light Scattering (DLS) and Zeta Potentials Measurements
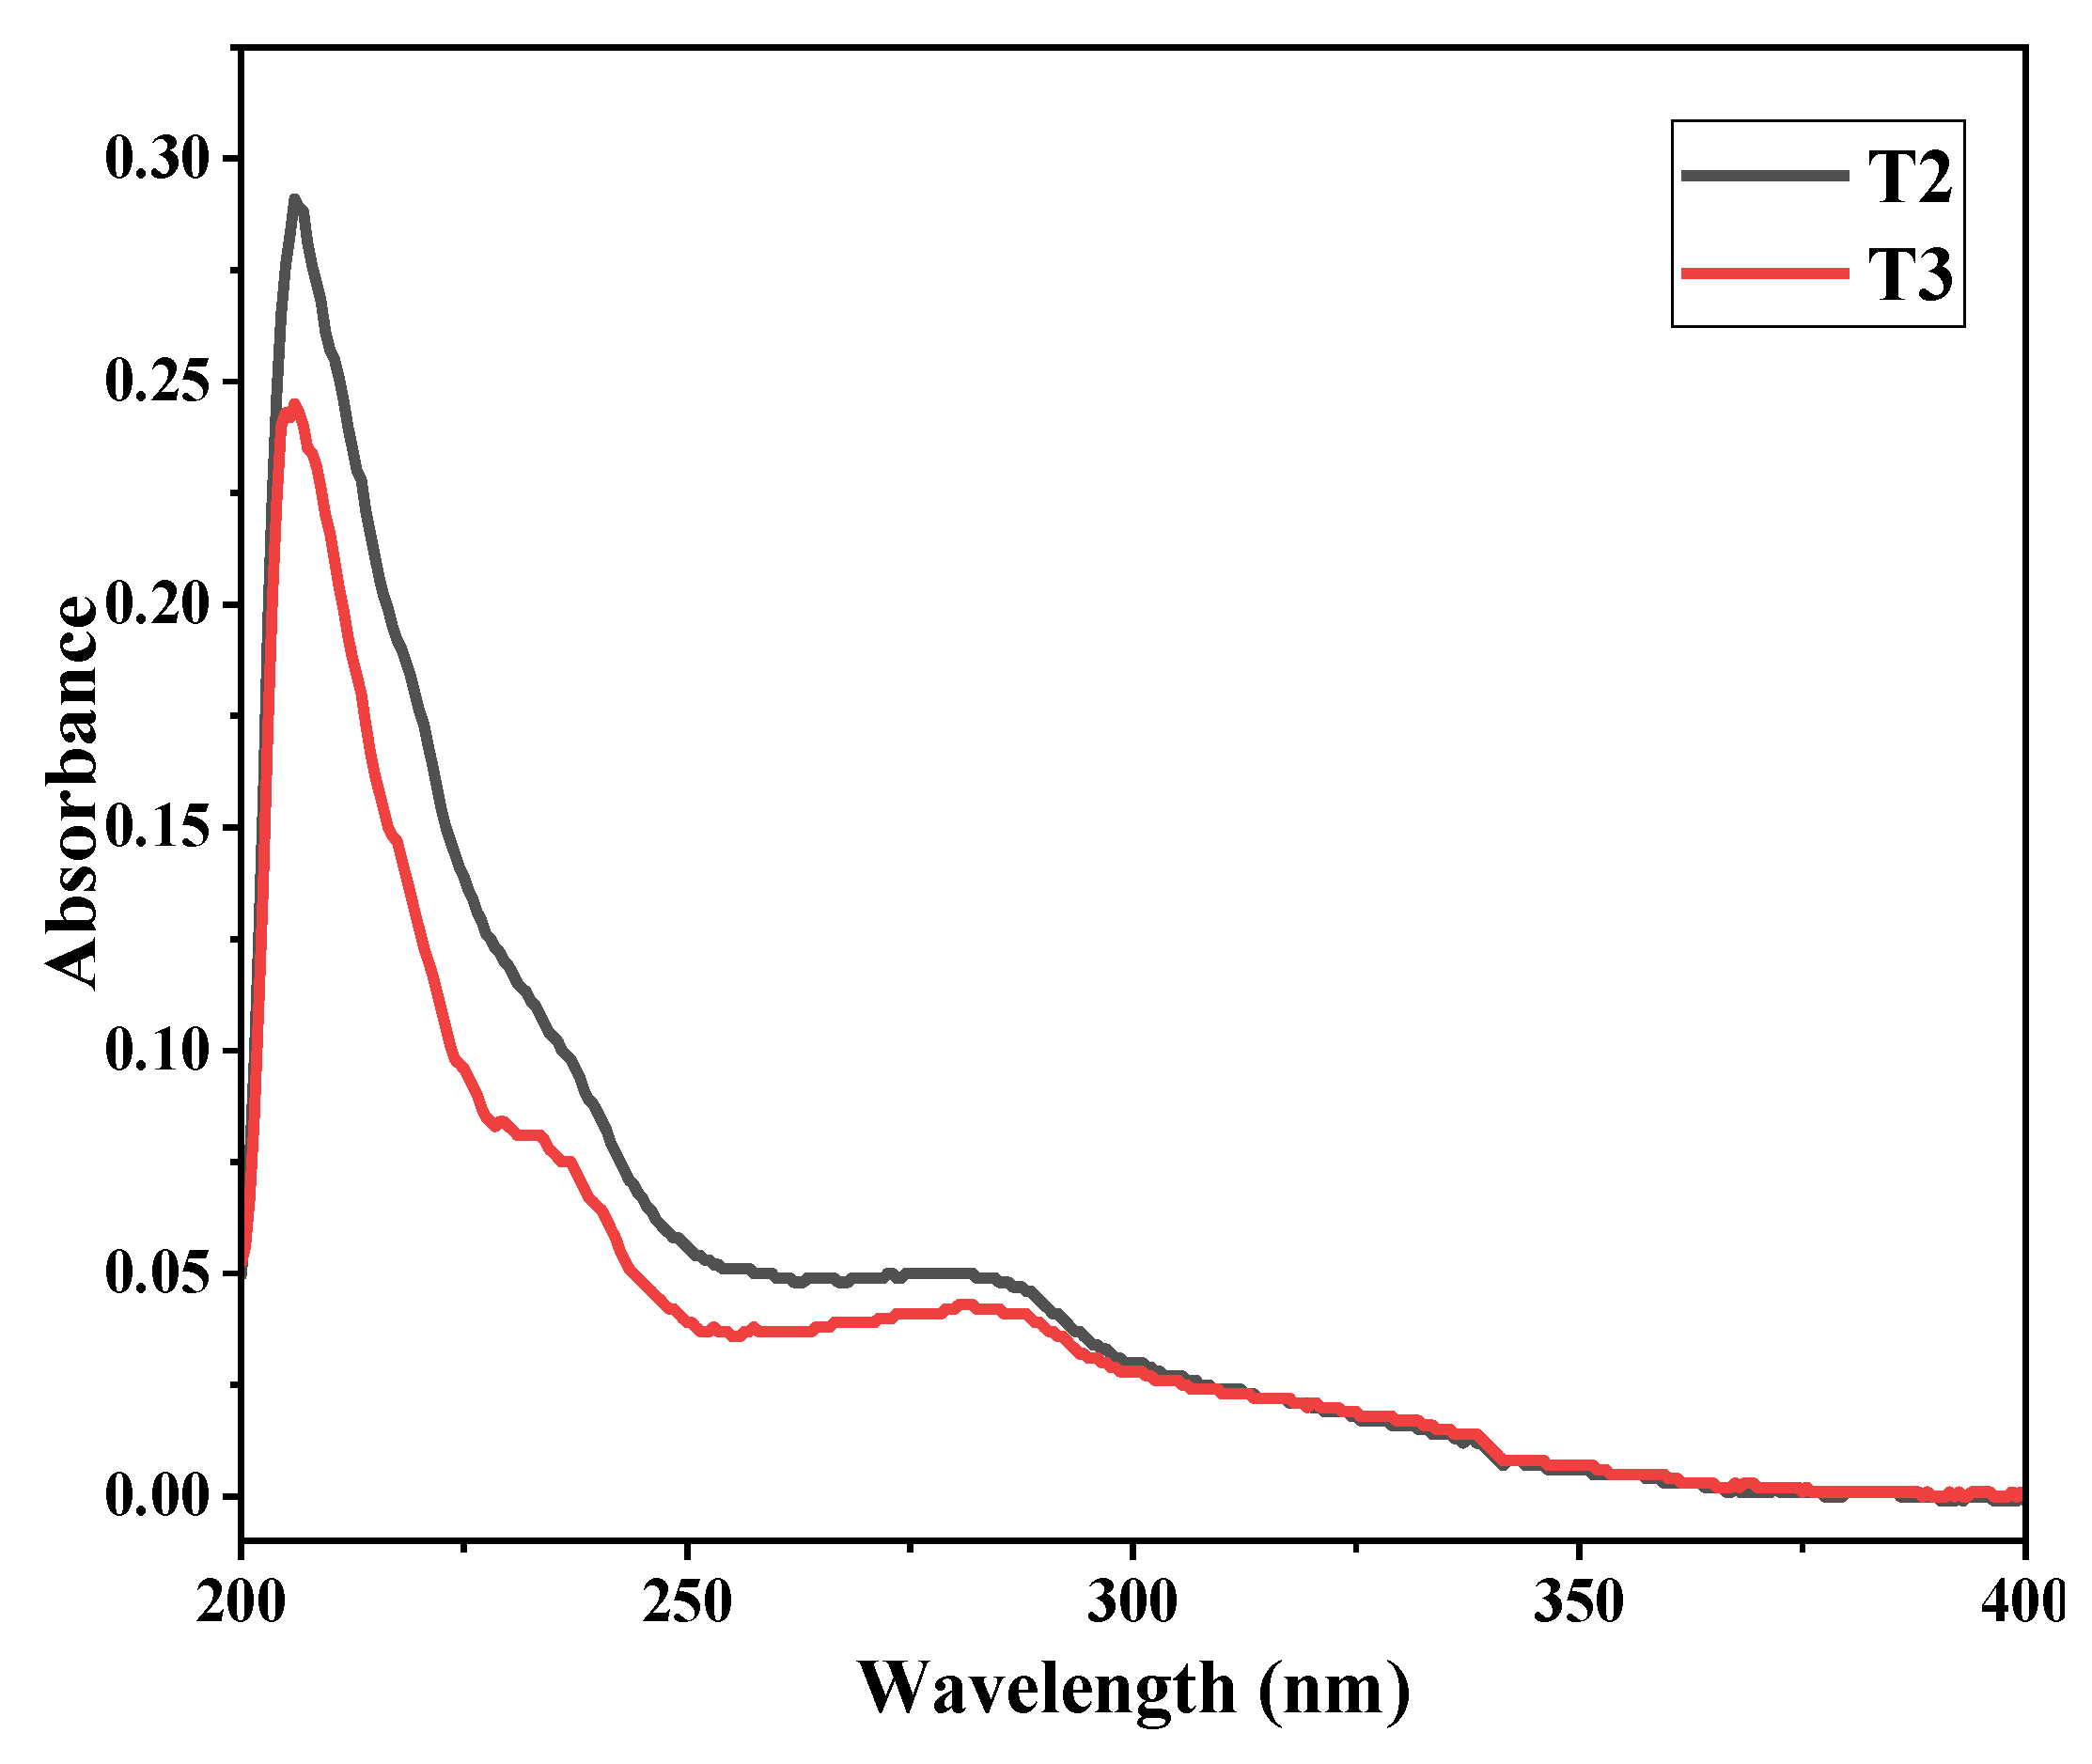
3.5. UV-Vis Spectroscopic Analysis
4. Conclusions
Author Contributions
Funding
Institutional Review Board Statement
Informed Consent Statement
Data Availability Statement
Acknowledgments
Conflicts of Interest
References
- Mohamed, M.A.; Salleh, W.N.W.; Jaafar, J.; Ismail, A.F.; Abd Mutalib, M.; Mohamad, A.B.; Zain, M.F.M.; Awang, N.A.; Hir, Z.A.M. Physicochemical characterization of cellulose nanocrystal and nanoporous self-assembled CNC membrane derived from Ceiba pentandra. Carbohydr. Polym. 2017, 157, 1892–1902. [Google Scholar] [CrossRef] [PubMed]
- Morais, J.P.S.; Rosa, M.F.; Filho, M.M.S.; Nascimento, L.D.; Nascimento, D.M.; Cassales, A.R. Extraction and characterization of nanocellulose structures from raw cotton linter. Carbohydr. Polym. 2013, 91, 229–235. [Google Scholar] [CrossRef] [PubMed]
- Kallel, F.; Bettaieb, F.; Khiari, R.; García, A.; Bras, J.; Chaabouni, S.E. Isolation and structural characterization of cellulose nanocrystals extracted from garlic straw residues. Ind. Crop. Prod. 2016, 87, 287–296. [Google Scholar] [CrossRef]
- Campano, C.; Merayo, N.; Balea, A.; Tarrés, Q.; Delgado-Aguilar, M.; Mutjé, P.; Negro, C.; Blanco, Á. Mechanical and chemical dispersion of nanocelluloses to improve their reinforcing effect on recycled paper. Cellulose 2018, 25, 269–280. [Google Scholar] [CrossRef]
- Campano, C.; Miranda, R.; Merayo, N.; Negro, C.; Blanco, A. Direct production of cellulose nanocrystals from old newspapers and recycled newsprint. Carbohydr. Polym. 2017, 173, 489–496. [Google Scholar] [CrossRef] [PubMed]
- Afra, E.; Yousefi, H.; Hadilam, M.M.; Nishino, T. Comparative effect of mechanical beating and nanofibrillation of cellulose on paper properties made from bagasse and softwood pulps. Carbohydr. Polym. 2013, 97, 725–730. [Google Scholar] [CrossRef] [PubMed]
- Rånby, B.G. Fibrous macromolecular systems. Cellulose and muscle. The colloidal properties of cellulose micelles. Discuss. Faraday Soc. 1951, 11, 158–164. [Google Scholar] [CrossRef]
- Habibi, Y. Key advances in the chemical modification of nanocelluloses. Chem. Soc. Rev. 2014, 43, 1519–1542. [Google Scholar] [CrossRef] [PubMed]
- Habibi, Y.; Lucia, L.A.; Rojas, O.J. Cellulose nanocrystals: Chemistry, self-assembly, and applications. Chem. Rev. 2010, 110, 3479–3500. [Google Scholar] [CrossRef] [PubMed]
- Ng, H.-M.; Sin, L.T.; Tee, T.-T.; Bee, S.-T.; Hui, D.; Low, C.-Y.; Rahmat, A. Extraction of cellulose nanocrystals from plant sources for application as reinforcing agent in polymers. Compos. Part B Eng. 2015, 75, 176–200. [Google Scholar] [CrossRef]
- Sun, B.; Hou, Q.; Liu, Z.; Ni, Y. Sodium periodate oxidation of cellulose nanocrystal and its application as a paper wet strength additive. Cellulose 2015, 22, 1135–1146. [Google Scholar] [CrossRef]
- Dong, H.; Strawhecker, K.E.; Snyder, J.F.; Orlicki, J.A.; Reiner, R.S.; Rudie, A.W. Cellulose nanocrystals as a reinforcing material for electrospun poly(methyl methacrylate) fibers: Formation, properties and nanomechanical characterization. Carbohydr. Polym. 2012, 87, 2488–2495. [Google Scholar] [CrossRef]
- Abraham, E.; Deepa, B.; Pothen, L.; Cintil, J.; Thomas, S.; John, M.; Anandjiwala, R.; Narine, S. Environmental friendly method for the extraction of coir fibre and isolation of nanofibre. Carbohydr. Polym. 2013, 92, 1477–1483. [Google Scholar] [CrossRef] [PubMed]
- Nuruddin, M.; Hosur, M.; Uddin, M.J.; Baah, D.; Jeelani, S. A novel approach for extracting cellulose nanofibers from lignocellulosic biomass by ball milling combined with chemical treatment. J. Appl. Polym. Sci. 2016, 133, 42990. [Google Scholar] [CrossRef]
- Zhang, H.; Ning, Z.; Khalid, H.; Zhang, R.; Liu, G.; Chen, C. Enhancement of methane production from Cotton Stalk using different pretreatment techniques. Sci. Rep. 2018, 8, 3463. [Google Scholar] [CrossRef] [PubMed]
- Lani, N.S.; Ngadi, N.; Johari, A.; Jusoh, M. Isolation, Characterization, and Application of Nanocellulose from Oil Palm Empty Fruit Bunch Fiber as Nanocomposites. J. Nanomater. 2014, 2014, 702538. [Google Scholar] [CrossRef]
- Bellamy, W.D. Single cell proteins from cellulosic wastes. Biotechnol. Bioeng. 1974, 16, 869–880. [Google Scholar] [CrossRef] [PubMed]
- Chandra, C.S.J.; George, N.; Narayanankutty, S.K. Isolation and characterization of cellulose nanofibrils from arecanut husk fibre. Carbohydr. Polym. 2016, 142, 158–166. [Google Scholar]
- Chen, Y.W.; Lee, H.V.; Juan, J.C.; Phang, S.-M. Production of new cellulose nanomaterial from red algae marine biomass Gelidium elegans. Carbohydr. Polym. 2016, 151, 1210–1219. [Google Scholar] [CrossRef] [PubMed]
- Azadi, P.; Inderwildi, O.R.; Farnood, R.; King, D.A. Liquid fuels, hydrogen and chemicals from lignin: A critical review. Renew. Sustain. Energy Rev. 2013, 21, 506–523. [Google Scholar] [CrossRef]


| Samples | Zeta Potential (mV) | Conductivity (mS/cm) |
|---|---|---|
| T2 | −3.95 | 0.388 |
| T3 | −8.25 | 0.586 |
Disclaimer/Publisher’s Note: The statements, opinions and data contained in all publications are solely those of the individual author(s) and contributor(s) and not of MDPI and/or the editor(s). MDPI and/or the editor(s) disclaim responsibility for any injury to people or property resulting from any ideas, methods, instructions or products referred to in the content. |
© 2023 by the authors. Licensee MDPI, Basel, Switzerland. This article is an open access article distributed under the terms and conditions of the Creative Commons Attribution (CC BY) license (https://creativecommons.org/licenses/by/4.0/).
Share and Cite
Hasan, Z.; Zubair, M.O.; Hassan, T. Synthesis and Characterization of Cellulose Nanomaterials from Waste Newspapers. Mater. Proc. 2023, 14, 74. https://doi.org/10.3390/IOCN2023-14731
Hasan Z, Zubair MO, Hassan T. Synthesis and Characterization of Cellulose Nanomaterials from Waste Newspapers. Materials Proceedings. 2023; 14(1):74. https://doi.org/10.3390/IOCN2023-14731
Chicago/Turabian StyleHasan, Ziaul, Md Osama Zubair, and Tauseef Hassan. 2023. "Synthesis and Characterization of Cellulose Nanomaterials from Waste Newspapers" Materials Proceedings 14, no. 1: 74. https://doi.org/10.3390/IOCN2023-14731