1. Introduction
One of the growing areas of research interest is the development of eco-friendly alternatives to the OPC system. These low-lime calcium silicate cements harden and gain strength by carbonation (carbon mineralization), and thus store CO2 permanently. The objective of the study presented in this paper was to evaluate the sulfate resistance of low-lime carbonated calcium silicate (CCS) pastes. The experimental plan involved exposing paste powders made out of different carbonated CCSs (wollastonite, amorphous CS, and two types of commercially produced low-calcium binders (SolidiaTM cements)) to sodium sulfate and magnesium sulfate solutions for a period of up to 120 days. At various times during the exposure period (0.5, 1, 5, 10, 20, 60, 90 and 120 days), the paste + sulfate solution slurries were filtrated and separated into solids and leachates. The solids were subjected to thermogravimetric analysis (TGA) in order to quantify the amount of gypsum formed. The leachates were analyzed by the ion-chromatography (IC) and by the inductively coupled plasma optical emission spectroscopy (ICP-OES) techniques, to determine changes in the concentrations of the Ca, Mg, Na, Si and sulfate species.
2. Description of the Analytical Methods
2.1. Thermogravimetric (TGA) Analysis
The thermogravimetric analysis of the pastes was conducted using the Q50 (TA Instruments) apparatus. The test involved placing a 15–20 mg powdered paste (passed through sieve #200) in an open platinum pan and heating it at a rate of 10 °C/min up to 900 °C in a nitrogen gas atmosphere (flow rate 60 mL/min).
2.2. Chemical Analysis of the Soak Solution
The collected soak solutions were first filtered using a 0.2 µm cellulose acetate filter to separate solids from the fluids. The resulting fluids were then analyzed using inductively coupled plasma, optical emission spectroscopy (ICP-OES, Thermo-Scientific iCAP 7400 spectrometer) and ion chromatography (IC, DIONEX ICS-900) techniques.
3. Materials
This study was conducted on pastes prepared from four different low-lime calcium silicate cements, referred to as #1, #2, #3 and #4 cements, respectively. The cements were characterized by an X-ray Fluorescence (XRF) technique and the results are shown in
Table 1.
Comparing the oxide compositions of the cements, it can be seen that while they contained similar quantities of CaO (in the range of 43–46%), their SiO2 content varied from 51.5% for cement #1, to 43% for cement #4. Regarding other minor oxides (Al2O3, Fe2O3, MgO, K2O), the lowest amount was found in cement #1, whereas the highest amount was found in cement #4. All cements have similar values of LOI, except cement #2, which had an LOI about twice as high as the LOI values of other cements. The lowest alkali content was found in cement #1, and the highest was present in cement #3.
Carbonated cement paste samples were prepared by hand, mixing small amounts of cement powders with de-ionized water at water-to-cement ratio of 0.35. Once mixed, the pastes were placed in a thin (1.0–1.5 mm) layer in the VWR sterile polystyrene Petri dishes with diameter of 60 mm and the height of 1.5 mm. Immediately after completion of casting, the paste-containing Petri dishes were placed in VWR Symphony 1.4A CO
2 incubator, where they were carbonated for 5 days. The environmental conditions within the incubator were as follows: temperature 23 °C 90–100% relative humidity and 20% concentration of carbon dioxide. After the completion of carbonation, the paste samples were pulverized with mortar and pestle, and stored sealed in glass vials before being used for testing. Prior to being subjected to sulfate solution exposure, the powdered carbonated paste samples were characterized using thermal (TGA), XRD and FT-IR techniques. The results of these analyses are presented elsewhere [
1].
4. Sulfate Exposure Experiment
4.1. Experimental Setup
In the current study, three different types of sulfate solutions were used: 0.35 M of sodium sulfate, magnesium sulfate and aluminum sulfate solutions. The pH values of the original sulfate solutions (i.e., before they contacted the paste powders) were in the range of 6–7 for sodium and magnesium sulfate solutions. On the other hand, the aluminum sulfate solution was rather acidic, with a pH level between 3 and 4.
All four carbonated paste powder samples were pulverized using mortar and pestle, passed through #200 (75 μm) sieve and submerged in sulfate solutions using a solid-to-liquid ratio of 1:4. The slurry samples were kept sealed in plastic centrifuge tubes with 50 mL capacity, and stored at room temperature (23 ± 5 °C). They were agitated periodically twice a week by hand. Due to its acidic nature, the mixing of the aluminum sulfate solution with paste powders resulted in the release of CO2 gas bubbles from the decomposition of calcium carbonates. For this reason, the tubes containing aluminum sulfate solution were sealed only after the bubbling of CO2 has ceased. In addition to the sulfate solutions, paste powder samples were also submerged in de-ionized water. Ultimately, the exposure test was held for 120 days. At different time periods (0.5, 1, 5, 10, 20, 60, 90 and 120 days) of exposure, 16 samples in total (four different paste sample slurries per each solution type) were taken from the set for further analysis.
4.2. Post-Exposure Analysis
After reaching the pre-designated period of exposure, the slurry samples were centrifuged and filtered using a 0.2 µm cellulose acetate filter to separate solids from the soak solutions. The solids were then oven-dried at 35 ± 5 °C for three days, pulverized using mortar and pestle and stored in sealed glass vials with a plastic cap. Afterwards, the powdered solids were subjected to thermogravimetric analysis. The filtered solutions were kept sealed in 15 mL plastic centrifuge tubes and stored in the laboratory refrigerator at ~4–5 °C, until they were removed for ICP and IC analyses.
5. Results and Discussion
5.1. Soak Solution Chemistry
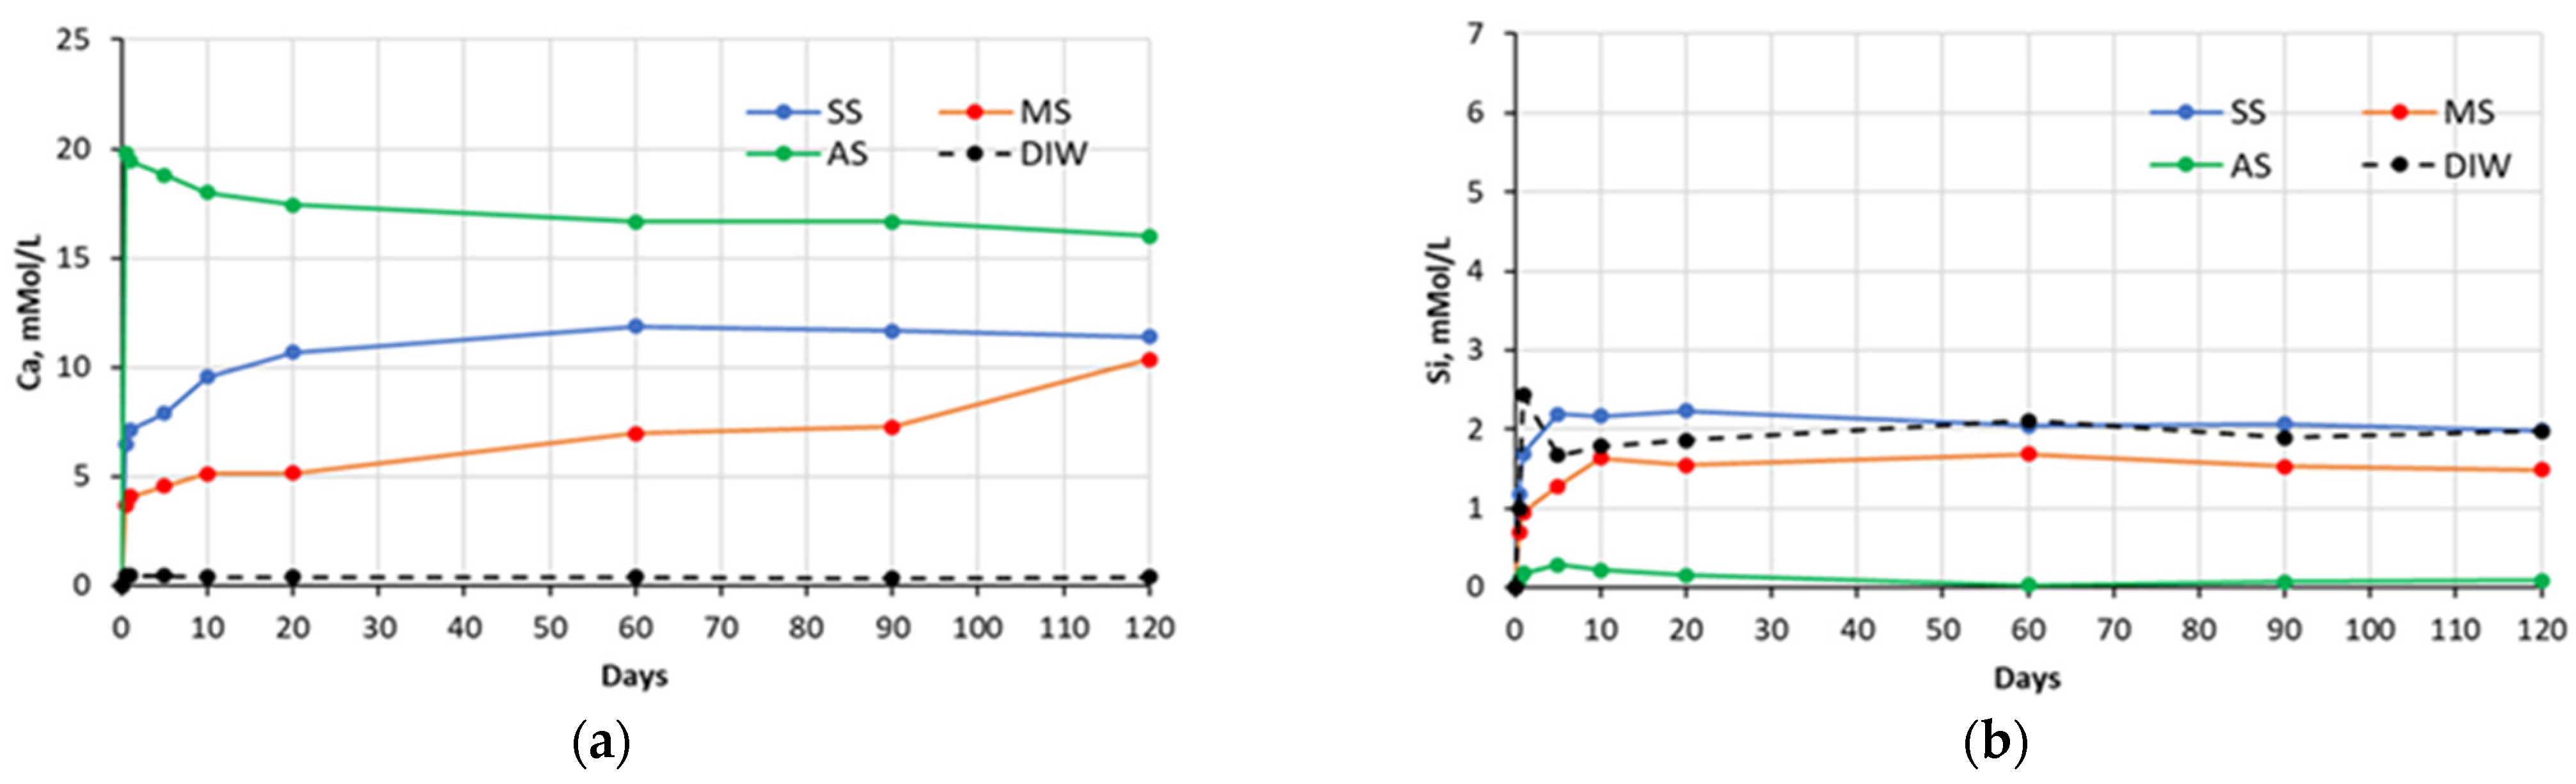
The chemical analysis of the sulfate soak solutions indicated that the sulfate-rich environment significantly influences the amount of calcium and silica ions leached out from the CCS matrices. As shown in the graphs presented in the
Figure 1,
Figure 2,
Figure 3 and
Figure 4, all sulfate solutions triggered a substantial increase (compared to deionized water soak solution) in the amount of calcium ions leached out from the CCS matrices. Depending on the solution, the observed increases were in the range of 10–15 times. There is also a noticeable trend of decay in Ca ion concentration with time, for all pastes exposed to aluminum sulfate, as well as cement #2 pastes exposed to sodium sulfate, and cement #3 and #4 pastes exposed to the magnesium sulfate solution. This might be due to the consumption of calcium ions during precipitation of new compounds, such as gypsum (see
Section 5.2). With respect to the leaching of the silica species, the effect of sulfate solutions, especially aluminum and magnesium sulfates, appears to be quite opposite to that observed for the calcium species. As an example, for all four types of pastes, the exposure to aluminum sulfate resulted in only minimal levels of silica in the soak solution, indicating that this sulfate solution stabilizes silica species present in the specimens. Similarly, it also appears that magnesium sulfate stabilized silica in all paste samples, except that of the carbonated wollastonite paste (cement #1). However, the effect of sodium sulfate seems to be rather selective: it stabilized the leaching of silica compared to immersion in deionized water only for the cement #2 paste samples.
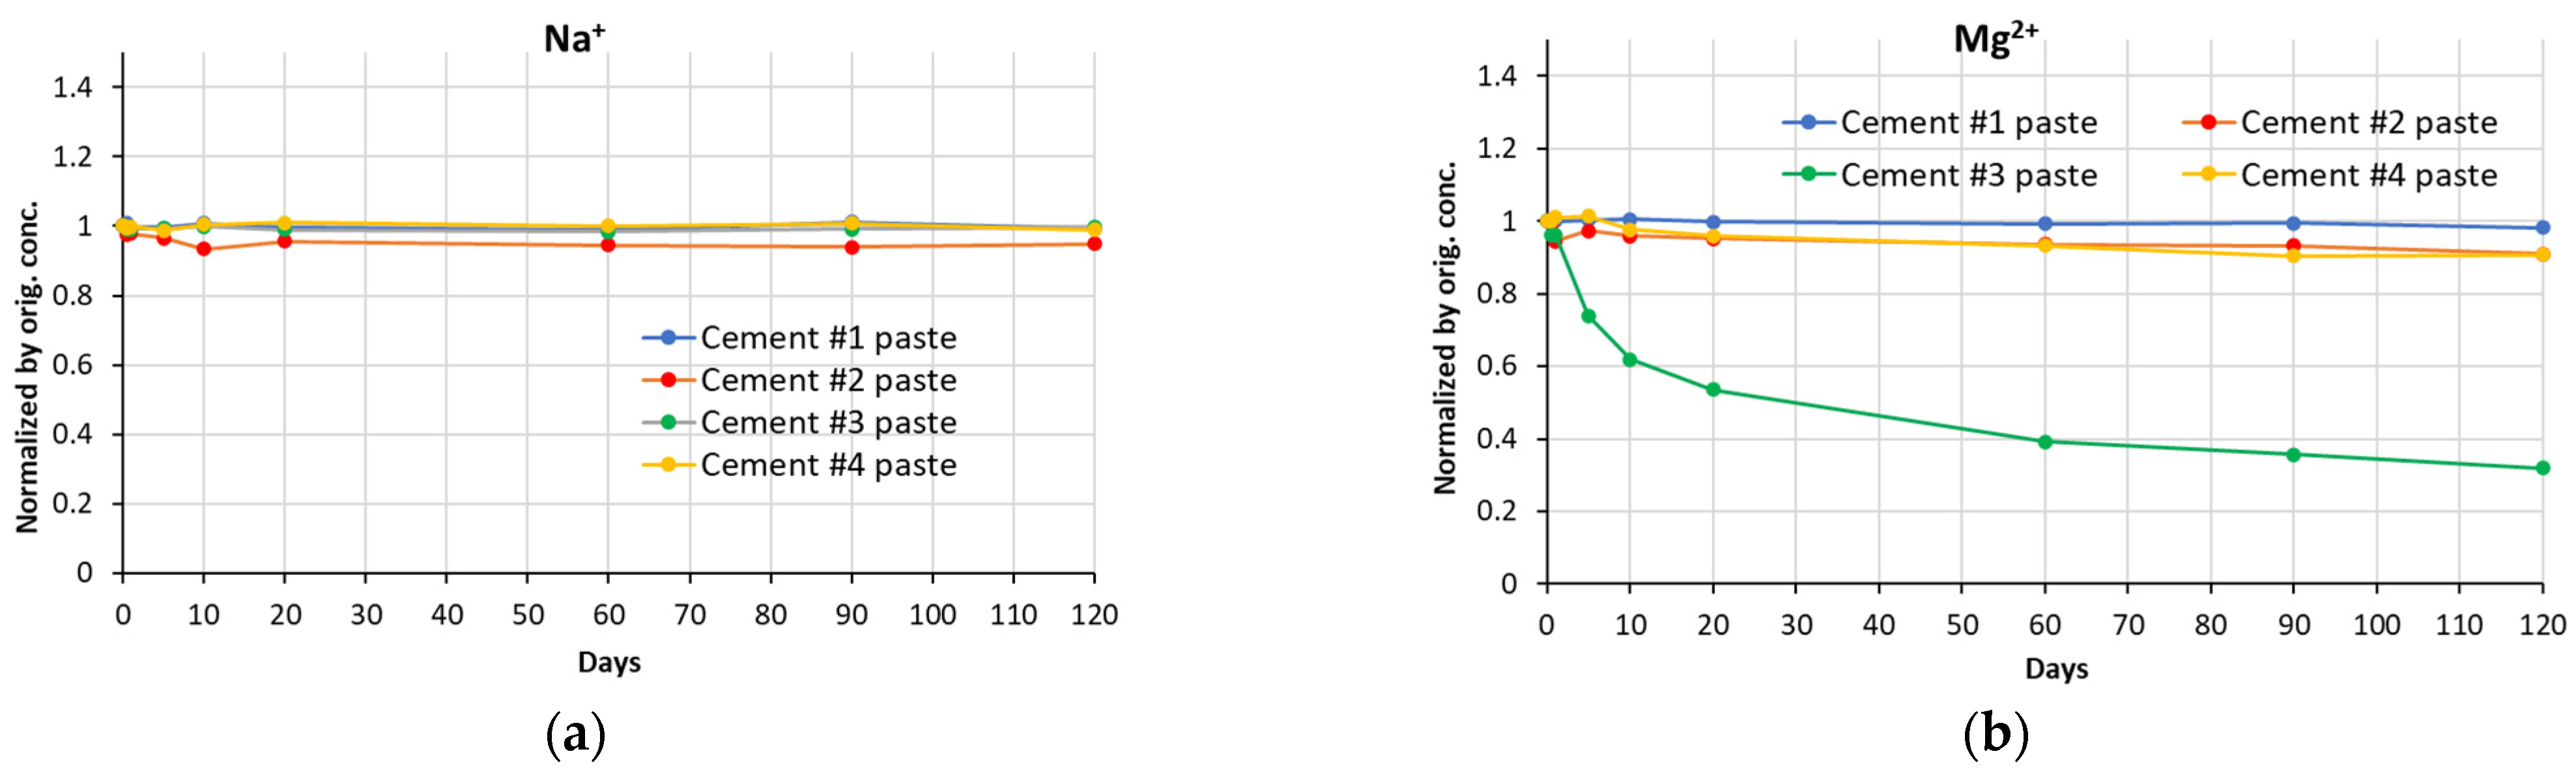
The change in concentrations of sodium and magnesium ions over the entire test period is presented in
Figure 5. The concentrations of aluminum cations are not presented, as they are negligibly small. The concentrations of sodium ions remain essentially constant, except for a slight reduction in the case of cement #2 paste. In contrast, one can observe that over time, the concentration of magnesium ions reduced by as much as ~68% for the cement #3 paste sample. In the case of cement #2 and #4 paste samples, the reduction was about ~10%; whereas for cement #1 paste samples, that reduction was very small (~2%) and it was only detected after 120 days of exposure.
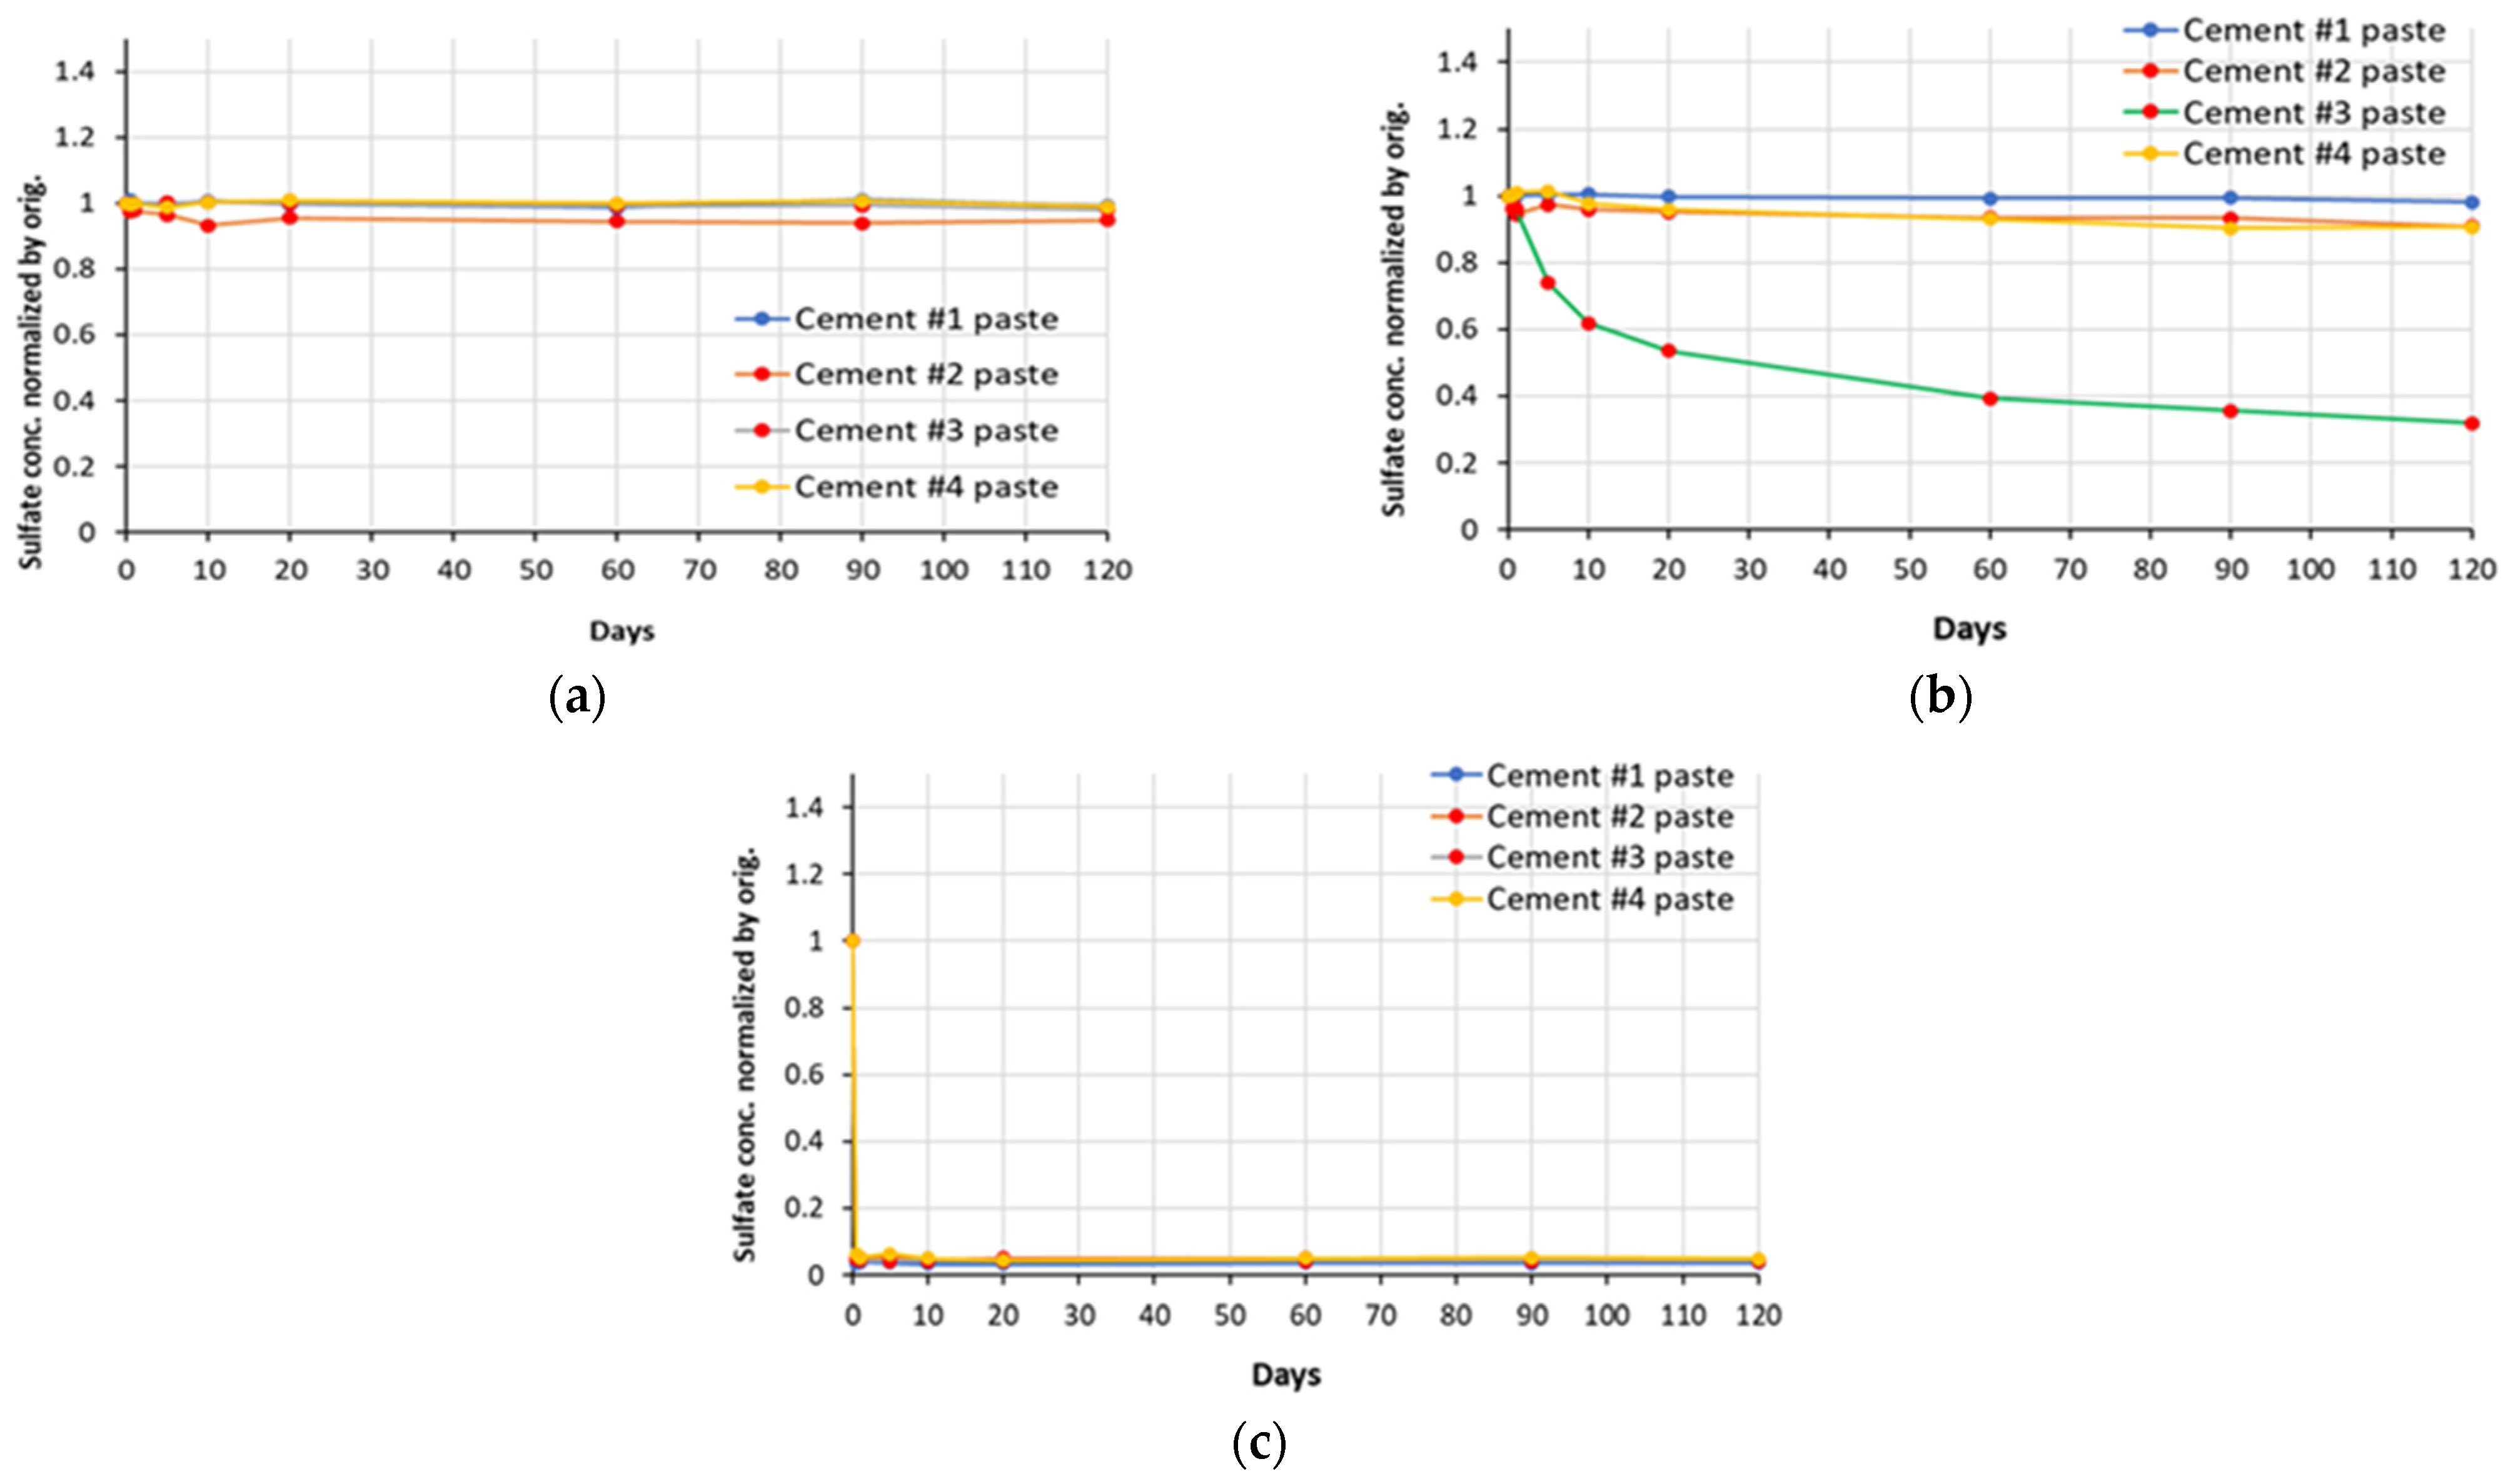
The plots of normalized changes in concentration of sulfate ions (for sodium, magnesium and aluminum sulfate solutions) for soak solutions in contact with all cement paste samples used in this study are presented in
Figure 6. The trends illustrated by the sulfate ion curves seem to be quite similar to those observed for the corresponding sodium and magnesium cations. In the case of the aluminum sulfate solution, the concentration of the sulfate ions in the soak solution after exposure of the paste samples (even at early days) was observed to be negligibly low as the concentration of Al
3+ species.
5.2. Thermal Analysis Results
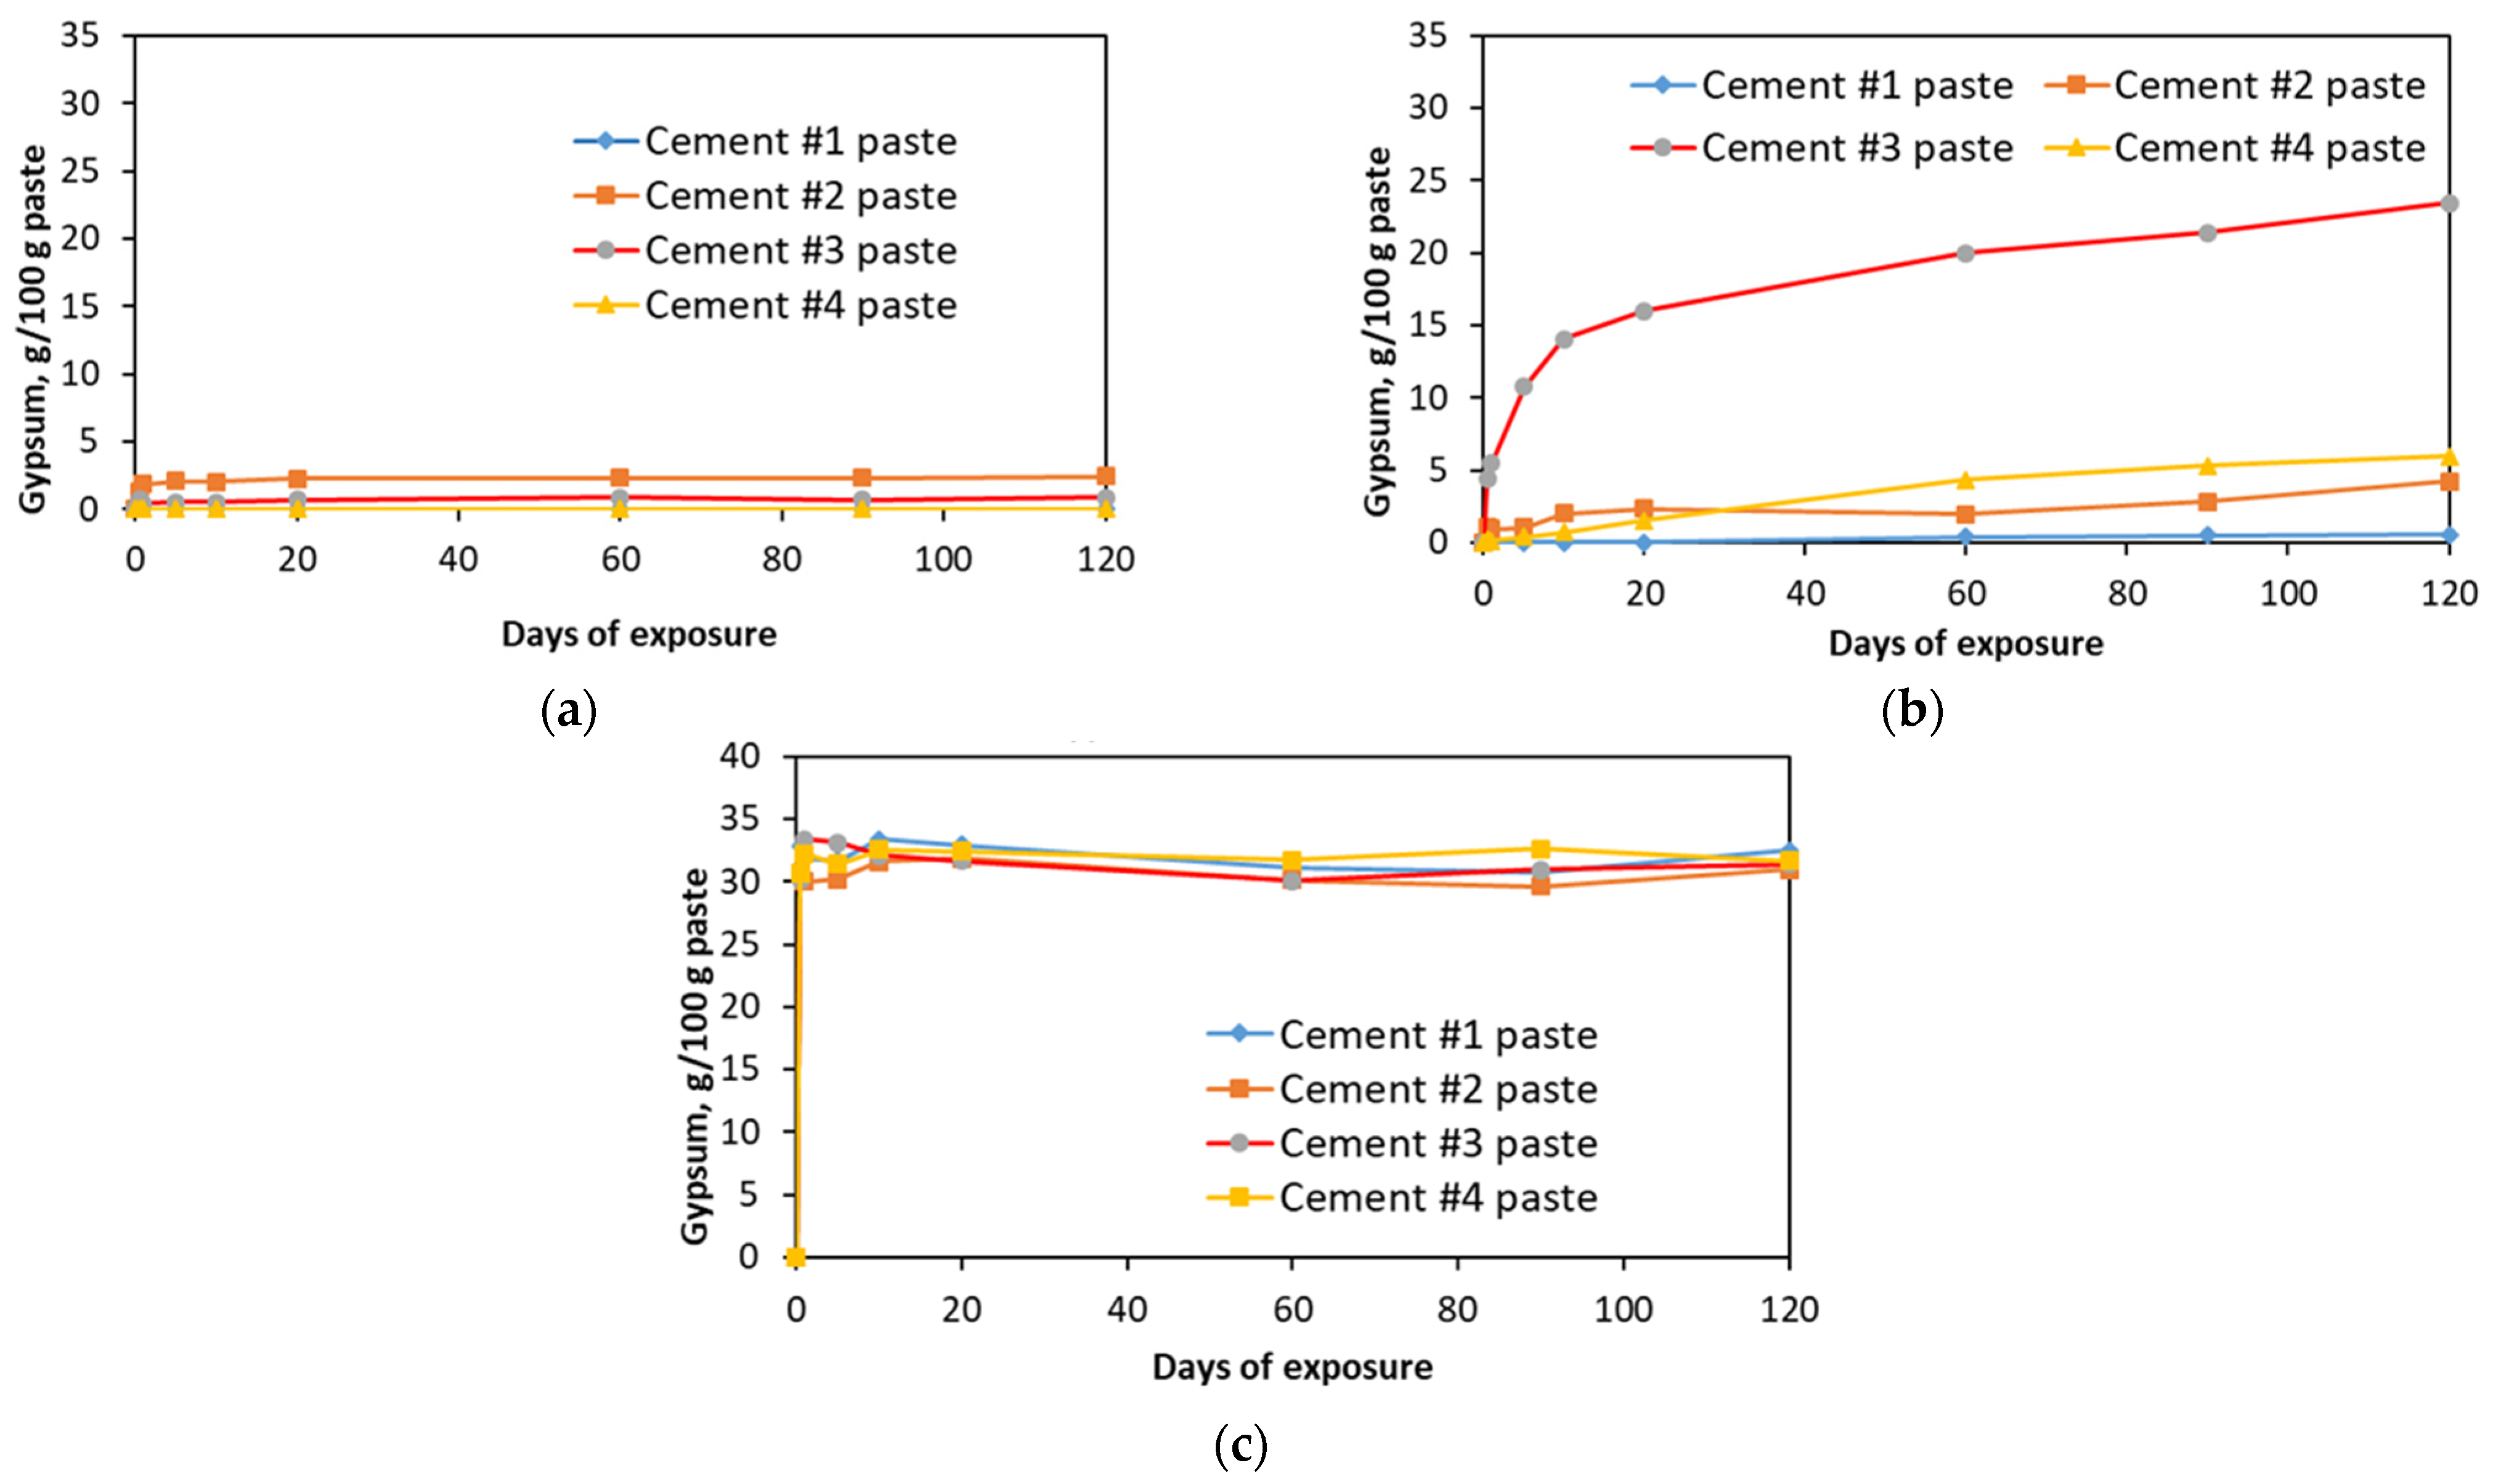
The amounts of gypsum formed during the sulfate exposure period were quantified by TGA. To avoid an overestimation of the quantities of gypsum formed (due to the continuous dehydration of the amorphous silica gel in the temperature range of ~90–150 °C), the methodology, originally developed by Kim and Olek (2012) [
2] for the estimation of the calcium hydroxide, was implemented. The results of the quantitative evaluation of the gypsum formed during the exposure test are presented in the graphs shown in
Figure 7.
As it can be seen from these graphs, exposure to the sodium sulfate solution did not result in the formation of any significant amounts of gypsum compared to other sulfate solutions. Specifically, at the end of the exposure period, only a small amount (about 2.5 g of gypsum per 100 g of paste) was observed in cement #2 paste samples. In contrast, exposure to magnesium sulfate solution resulted in the formation of much more significant amounts of gypsum in all paste samples, except in the case of carbonated wollastonite, i.e., cement #1 samples (only about 0.5 g/100 g of paste was formed in this case). By the end of the 120 day exposure period, ~24 g of gypsum per 100 g of paste formed in cement #3 samples, and ~4–6 g of gypsum per 100 g of paste formed in cement #2 and #3 samples. In the case of the aluminum sulfate solution, about 30–32% (wt.) of gypsum formed in all paste samples within the first 12 h of exposure. This was due to the high acidity of the solution (pH ≈ 3–4). Consequently, this resulted in the quick decomposition (“digestion”) of the calcium carbonate phase, pH stabilizing at around 6–7, binding of released calcium ions by sulfate ions and precipitation of gypsum. That amount of gypsum remained more-or-less constant throughout the entire exposure period.
6. Conclusions
The main findings of the study can be summarized as follows:
- -
The resistance of CCS systems to sulfate attack was found to be influenced by both the type of cations present in the sulfate solution, and the composition of the low-lime calcium silicate cements itself. In particular, CCS showed a higher resistance to Na2SO4 solution than to MgSO4, due to the absence of reactive phases, such as, e.g., Ca(OH)2 and/or calcium aluminates. Nevertheless, interaction of some of the CCS samples with sodium sulfates resulted in the formation of gypsum (even though in negligible amounts). Regarding the aluminum sulfate solution, no resistance was observed in the case of all paste samples due to the acidic environment of the solution.
- -
Lower resistance to MgSO4 was observed in CCS made of the cement containing more hydraulic calcium silicates (cement #3). In this case, the hydrated silica gel might be extensively modified with Ca. This can lead to a chemical reaction resulting in the formation of gypsum. Additionally, the consumption of magnesium ions and stabilization of silica indicate the interaction between hydrated silica gel and magnesium cations. This interaction, especially, might be due to cation exchange between calcium and magnesium ions. This, in turn, emphasizes the importance of the calcium ions and silica during the carbonation process and the level of pureness of the hydrated silica gel, with respect to sulfate resistance.
- -
The best resistance to sulfate attack was observed in CCS samples based on carbonated wollastonite, which contained higher amounts of crystalline calcium carbonate polymorph (calcite) and more highly polymerized silica gel.
Author Contributions
Conceptualization, R.T. and J.O.; methodology, R.T.; formal analysis, R.T. and J.O.; investigation, R.T.; writing—original draft preparation, R.T., writing—review and editing, J.O. and S.S., funding acquisition, J.O. All authors have read and agreed to the published version of the manuscript.
Funding
This research received no external funding.
Institutional Review Board Statement
Not applicable.
Informed Consent Statement
Not applicable.
Data Availability Statement
Not applicable.
Acknowledgments
SOLIDIA TECHNOLOGIES Inc. is acknowledged for providing the cement materials for the study. The publication cost of this paper was covered with funds from the Polish National Agency for Academic Exchange (NAWA): “MATBUD’2023—Developing international scientific cooperation in the field of building materials engineering” BPI/WTP/2021/1/00002, MATBUD’2023.
Conflicts of Interest
The authors declare no conflict of interest.
References
- Tokpatayeva, R. Study of Sulfate Attack Resistance of Carbonated Low-Lime Calcium Silicate Systems. Ph.D. Thesis, Purdue University, West Lafayette, IN, USA, December 2020. [Google Scholar]
- Kim, T.; Olek, J. Effects of Sample Preparation and Interpretation of Thermogravimetric Curves on Calcium Hydroxide in Hydrated Pastes and Mortars. Transp. Res. Rec. 2012, 2290, 10–18. [Google Scholar] [CrossRef]
Figure 1.
Changes in concentrations of: (a) Ca and (b) Si species present in sulfate solutions with time, in contact with cement #1 paste specimens (SS—sodium sulfate, MS—magnesium sulfate, AS—aluminum sulfate, DIW—de-ionized water).
Figure 1.
Changes in concentrations of: (a) Ca and (b) Si species present in sulfate solutions with time, in contact with cement #1 paste specimens (SS—sodium sulfate, MS—magnesium sulfate, AS—aluminum sulfate, DIW—de-ionized water).
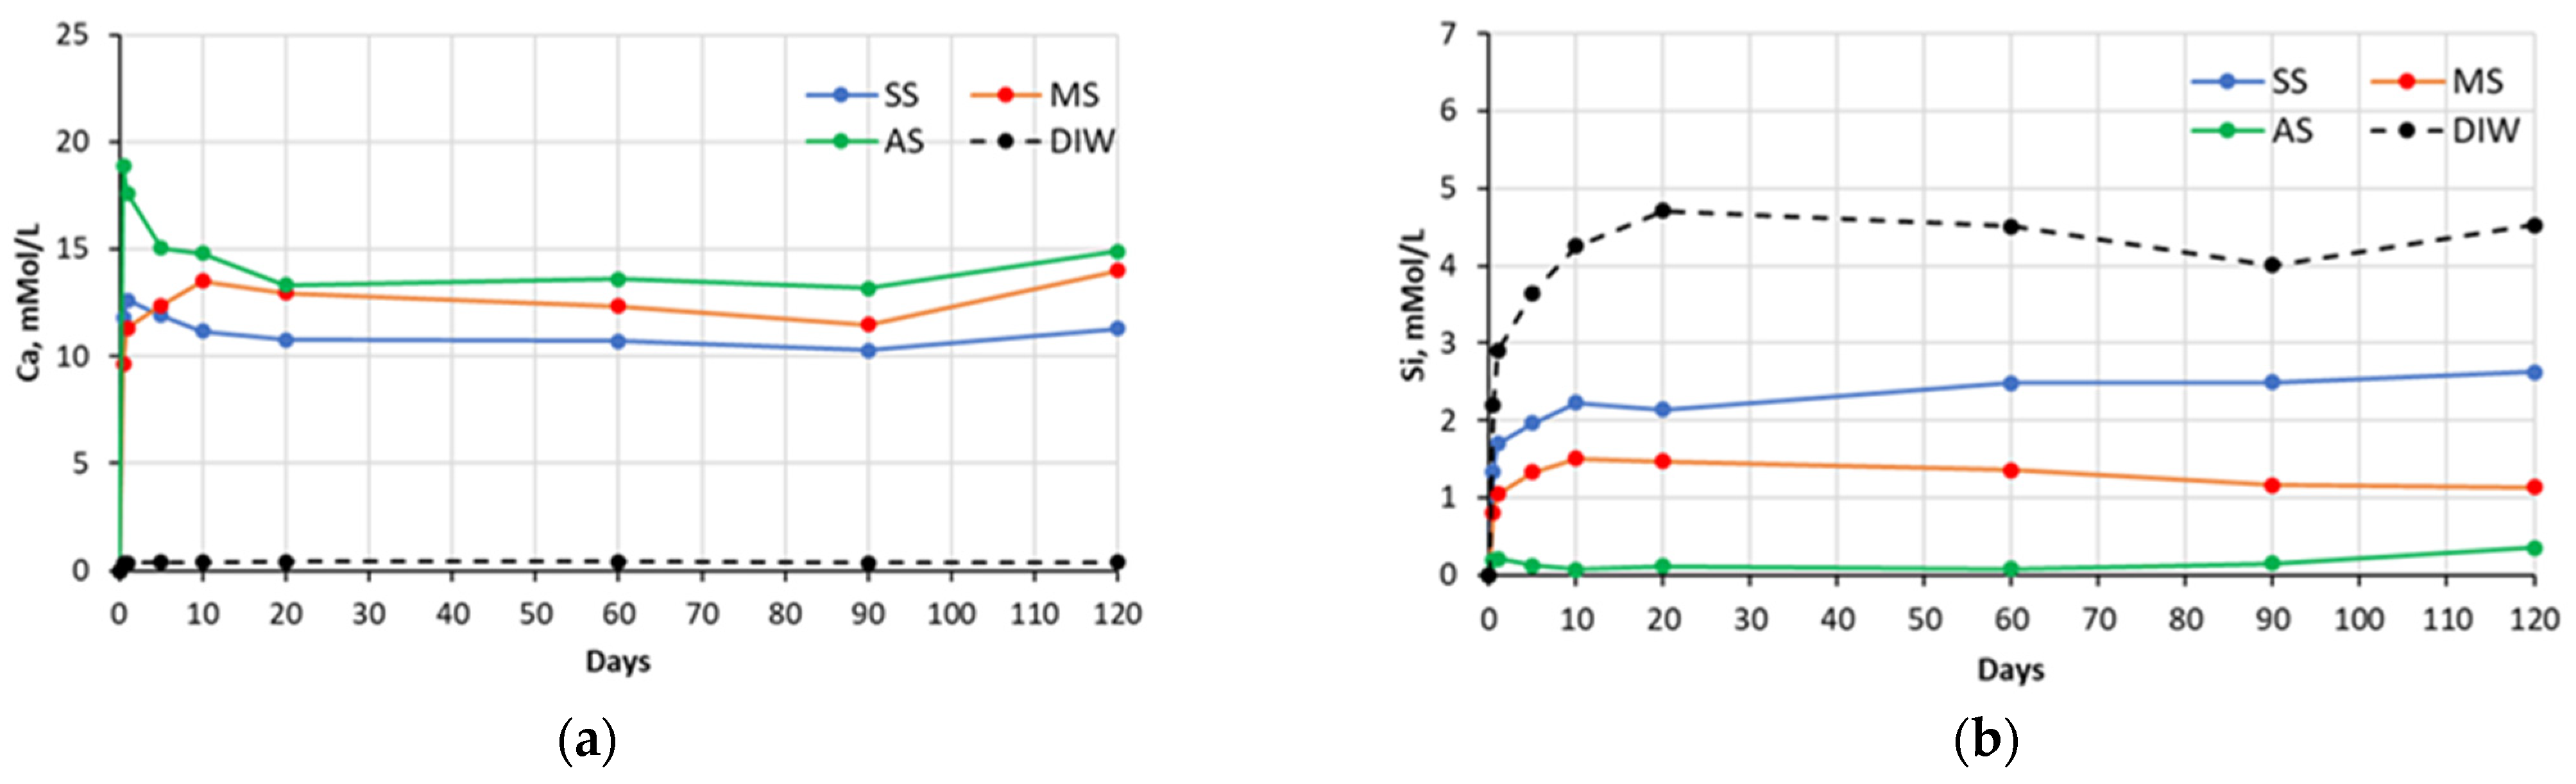
Figure 2.
Changes in concentrations of: (a) Ca and (b) Si species present in sulfate solutions with time, in contact with cement #2 paste specimens (SS—sodium sulfate, MS—magnesium sulfate, AS—aluminum sulfate, DIW—de-ionized water).
Figure 2.
Changes in concentrations of: (a) Ca and (b) Si species present in sulfate solutions with time, in contact with cement #2 paste specimens (SS—sodium sulfate, MS—magnesium sulfate, AS—aluminum sulfate, DIW—de-ionized water).
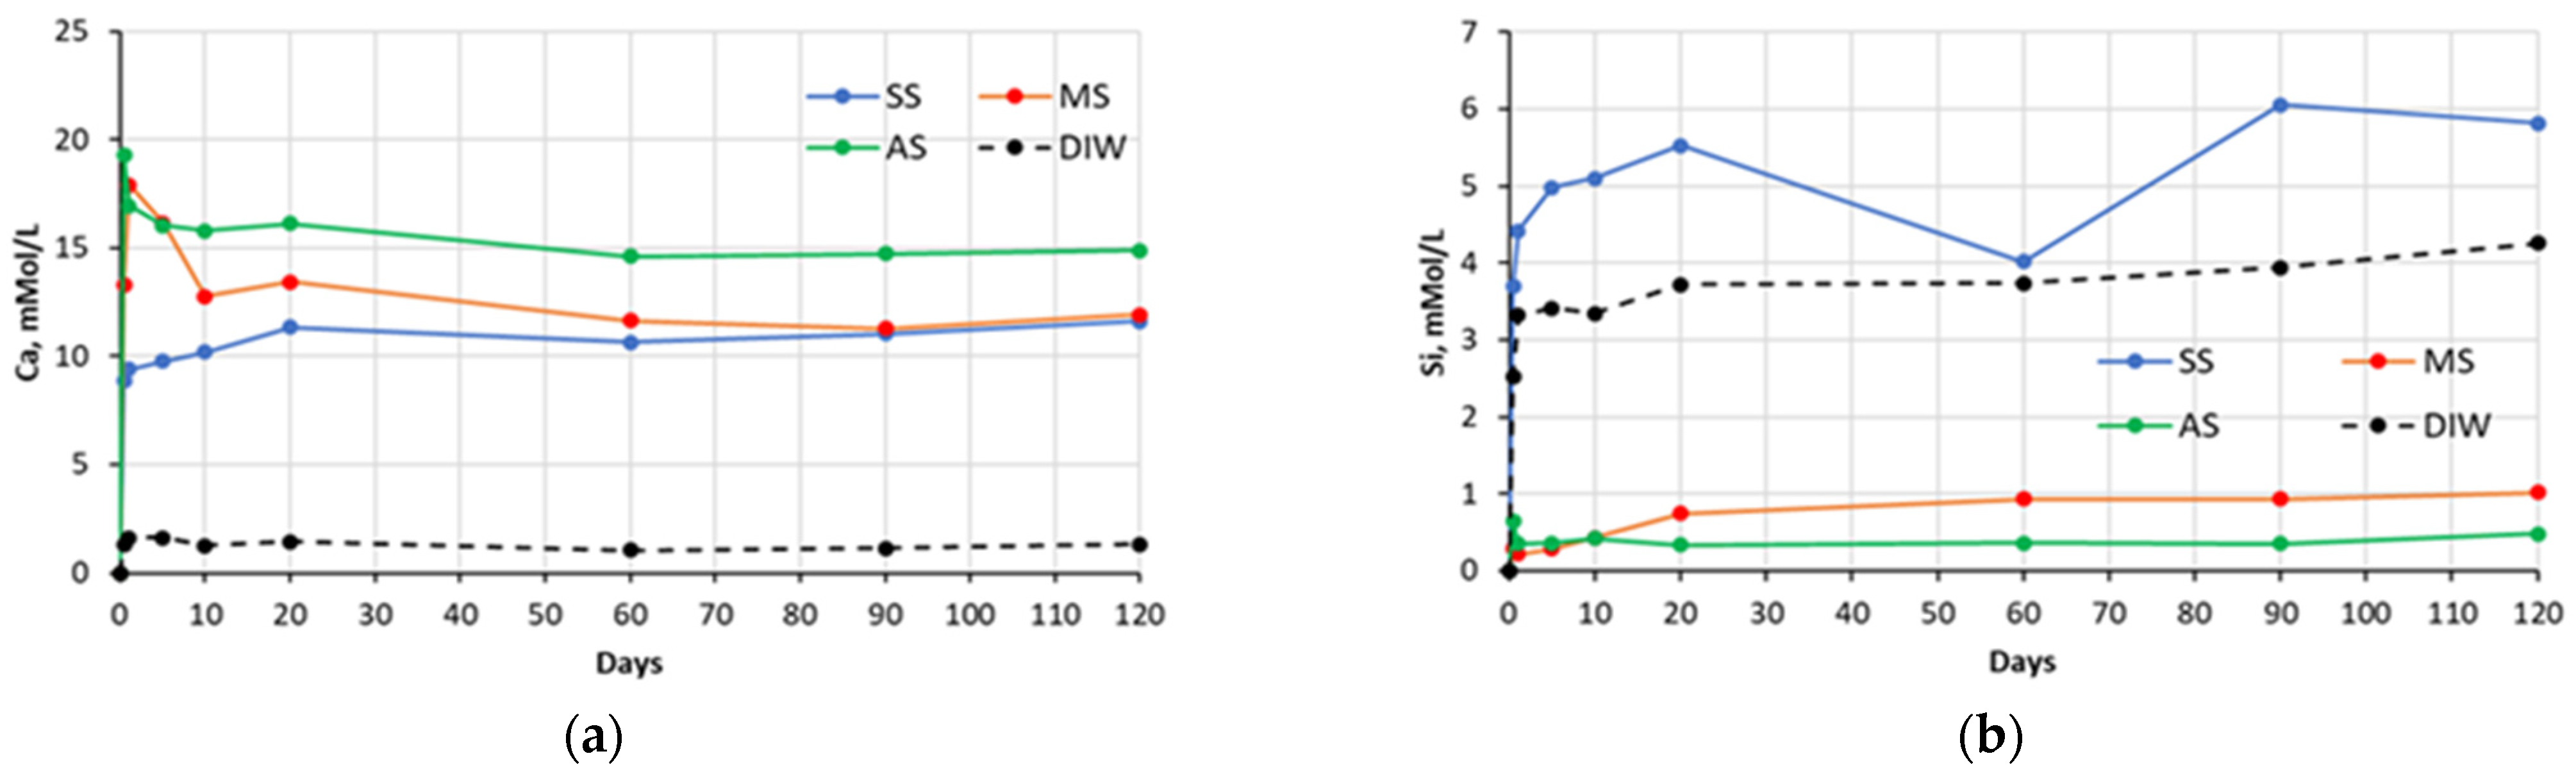
Figure 3.
Changes in concentrations of: (a) Ca and (b) Si species present in sulfate solutions with time, in contact with cement #3 paste specimens (SS—sodium sulfate, MS—magnesium sulfate, AS—aluminum sulfate, DIW—de-ionized water).
Figure 3.
Changes in concentrations of: (a) Ca and (b) Si species present in sulfate solutions with time, in contact with cement #3 paste specimens (SS—sodium sulfate, MS—magnesium sulfate, AS—aluminum sulfate, DIW—de-ionized water).
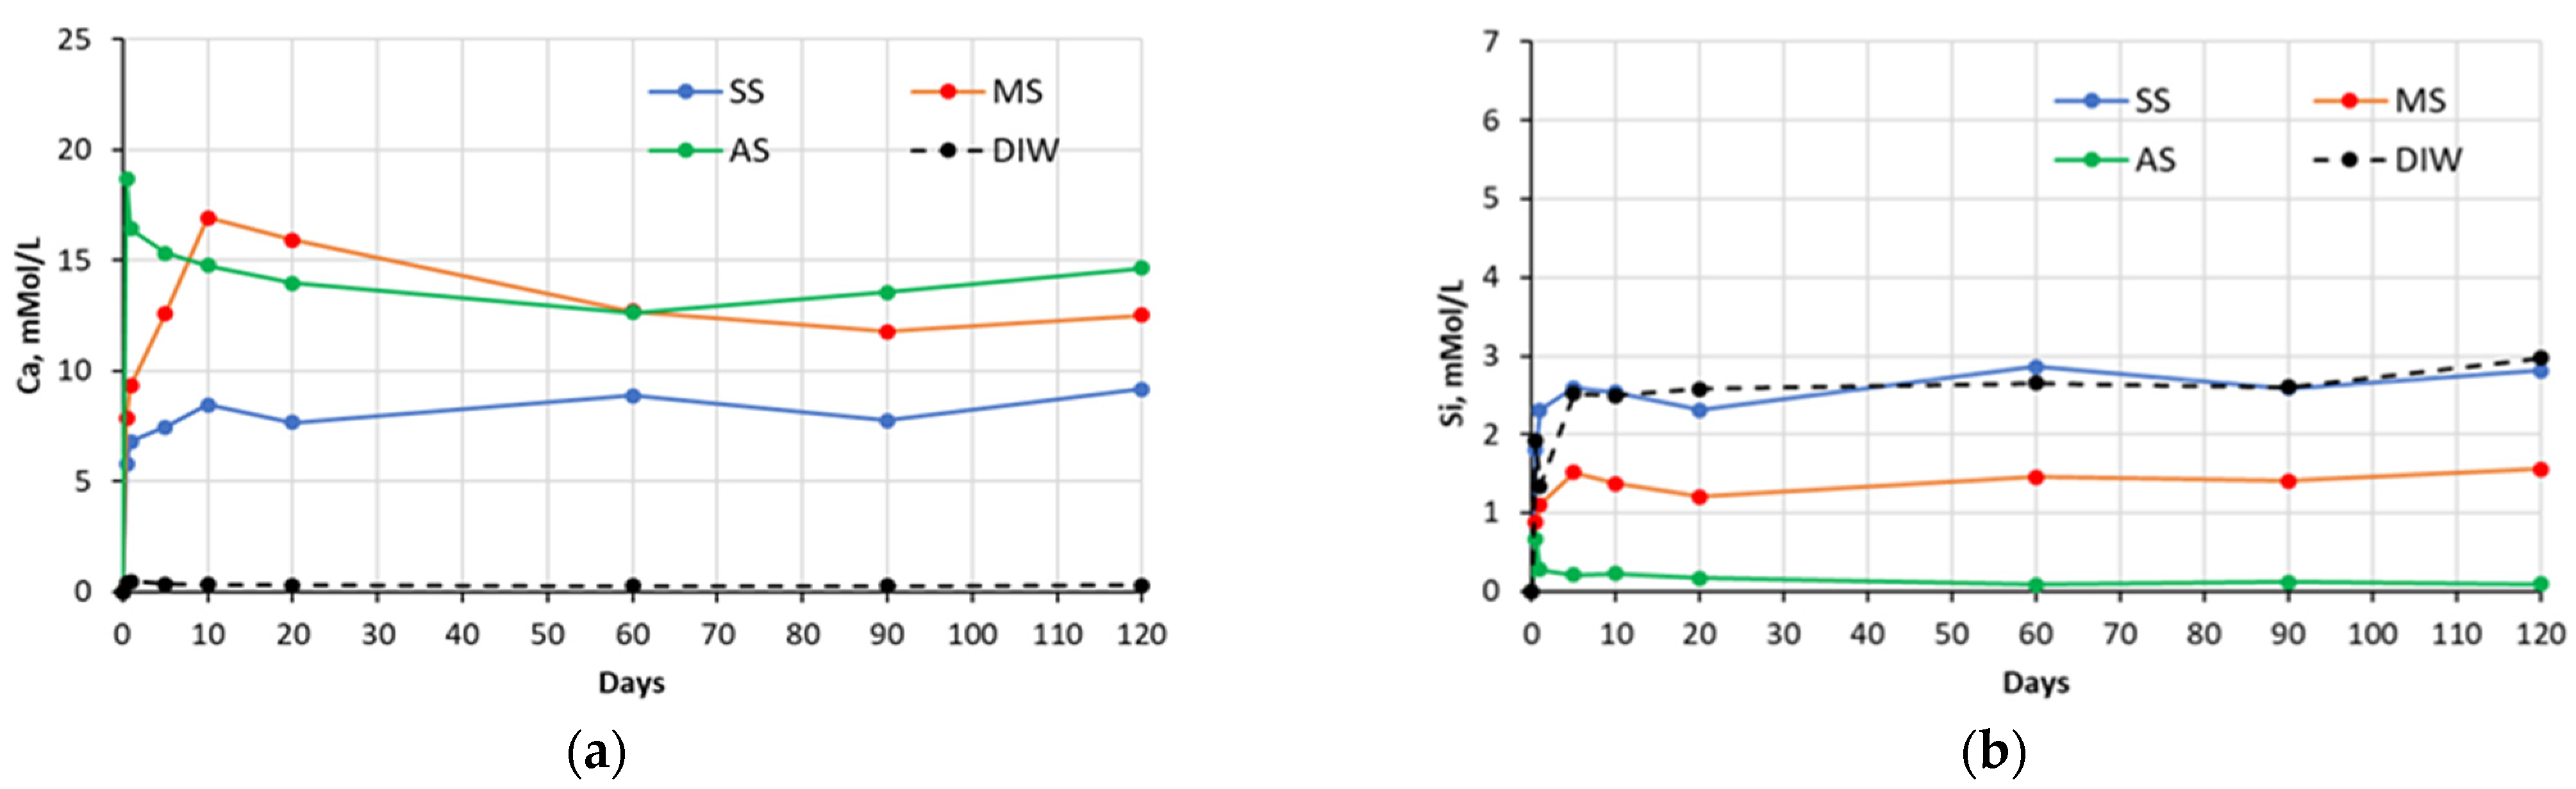
Figure 4.
Changes in concentrations of: (a) Ca and (b) Si species present in sulfate solutions with time, in contact with cement #4 paste specimens (SS—sodium sulfate, MS—magnesium sulfate, AS—aluminum sulfate, DIW—de-ionized water).
Figure 4.
Changes in concentrations of: (a) Ca and (b) Si species present in sulfate solutions with time, in contact with cement #4 paste specimens (SS—sodium sulfate, MS—magnesium sulfate, AS—aluminum sulfate, DIW—de-ionized water).
Figure 5.
Normalized concentrations of Na+ (a) and Mg2+ (b) ions in soak solutions of all cement paste samples, over a period of exposure.
Figure 5.
Normalized concentrations of Na+ (a) and Mg2+ (b) ions in soak solutions of all cement paste samples, over a period of exposure.
Figure 6.
Normalized concentrations of sulfate ions in sulfate soak solutions ((a)—sodium sulfate, (b)—magnesium sulfate, (c)—aluminum sulfate) of all cement paste samples, over a period of exposure.
Figure 6.
Normalized concentrations of sulfate ions in sulfate soak solutions ((a)—sodium sulfate, (b)—magnesium sulfate, (c)—aluminum sulfate) of all cement paste samples, over a period of exposure.
Figure 7.
Amount of gypsum formed during exposure to (a) sodium, (b) magnesium and (c) aluminum sulfate solutions.
Figure 7.
Amount of gypsum formed during exposure to (a) sodium, (b) magnesium and (c) aluminum sulfate solutions.
Table 1.
XRF oxide composition of the cements.
Table 1.
XRF oxide composition of the cements.
| Cement | Oxides, wt.% |
|---|
| CaO | SiO2 | Fe2O3 | Al2O3 | MgO | SO3 | Na2O | K2O | LOI | Total Alkalis |
|---|
| #1 | 46.01 | 51.47 | 0.77 | 0.87 | 0.08 | 0.01 | 0.16 | 0.04 | 0.72 | 0.18 |
| #2 | 46.08 | 45.66 | 0.22 | 2.50 | 1.11 | 0.41 | 0.21 | 0.37 | 1.61 | 0.45 |
| #3 | 43.64 | 44.0 | 1.79 | 5.13 | 1.15 | 0.16 | 0.33 | 1.94 | 0.71 | 1.61 |
| #4 | 42.58 | 42.67 | 2.50 | 6.19 | 2.17 | 0.99 | 0.21 | 1.07 | 0.79 | 0.91 |
| Disclaimer/Publisher’s Note: The statements, opinions and data contained in all publications are solely those of the individual author(s) and contributor(s) and not of MDPI and/or the editor(s). MDPI and/or the editor(s) disclaim responsibility for any injury to people or property resulting from any ideas, methods, instructions or products referred to in the content. |
© 2023 by the authors. Licensee MDPI, Basel, Switzerland. This article is an open access article distributed under the terms and conditions of the Creative Commons Attribution (CC BY) license (https://creativecommons.org/licenses/by/4.0/).


