1. Background
Japan is suffering from depopulation, and Shizuoka Prefecture is not an exception to this tendency. For the last 30 years, the total number of elementary schools in Shizuoka Prefecture has decreased by approximately 10%. The loss of a school causes significant damage to the community. However, the reorganization or the relocation of schools is underway in many local municipalities. This has led to an inevitable metamorphosis in urban structure.
Here, the distribution of school districts is chosen as a case study. A school district is designated by the municipality, and all school children in that zone commute to that school. And the cluster of the school district fills up the entire land space of the municipality. In this configuration, a school can be seen as an attracter in each territory.
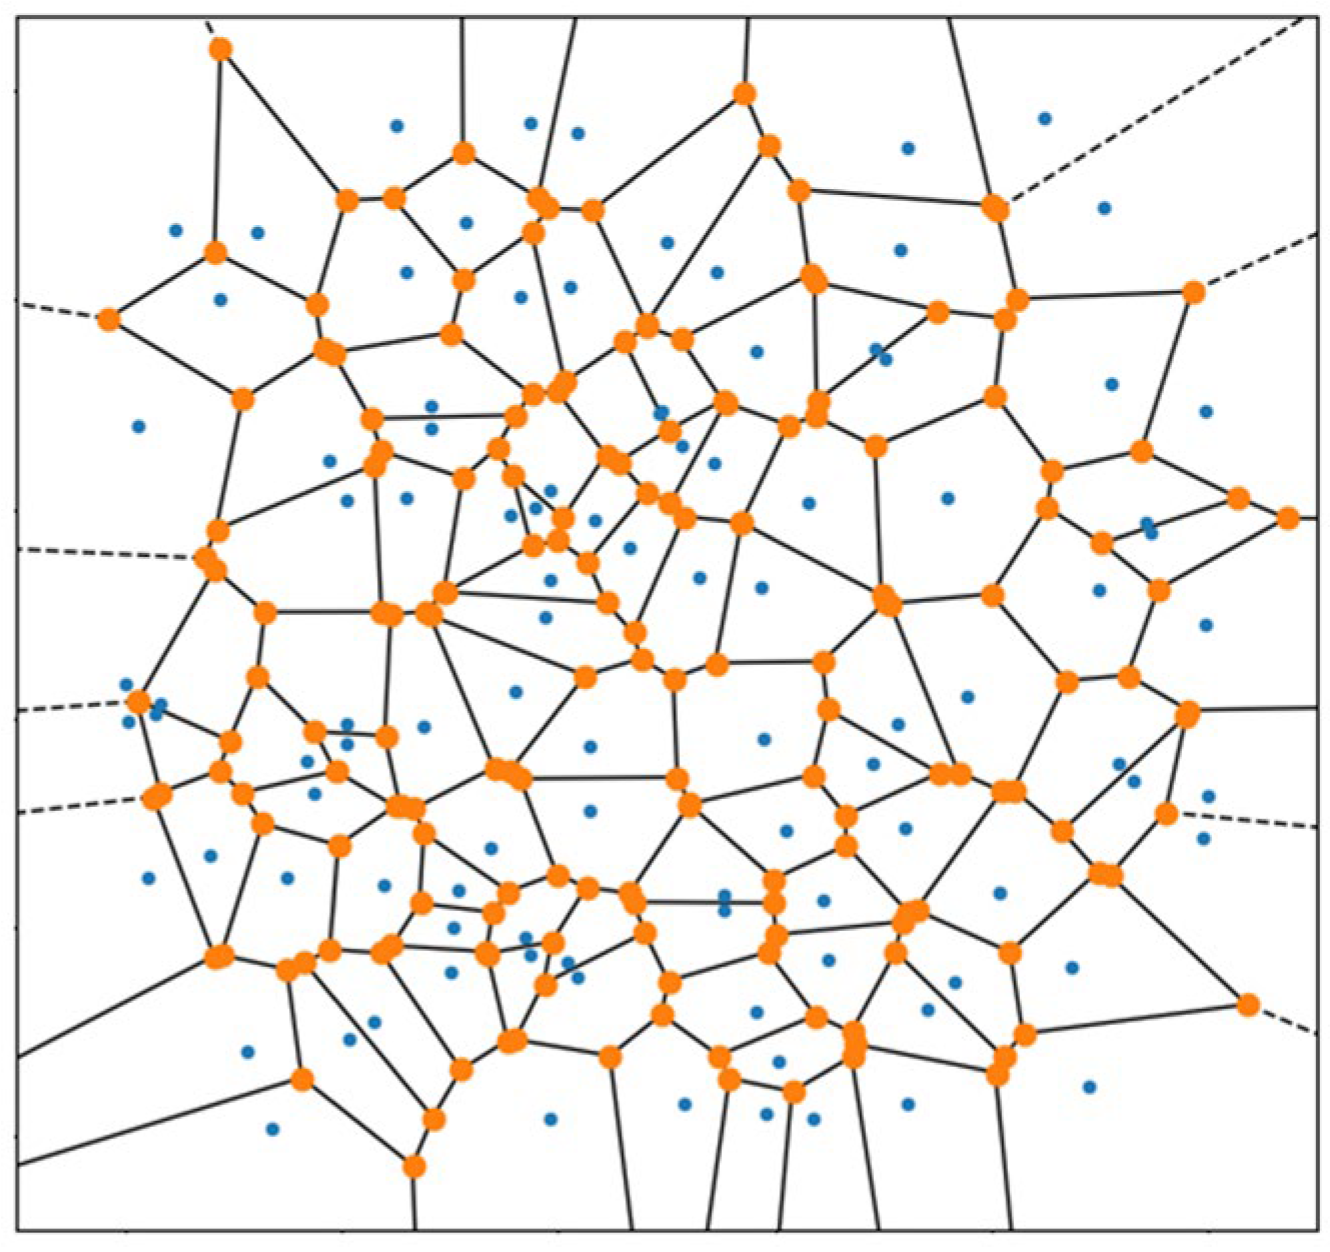
A similar configuration of a point and its territory is drawn as a Voronoi diagram [
1] (
Figure 1). A Voronoi diagram is known as a method of spatial subdivision of a plane based on the notion of “distance” between the two points. A set of distributed points creates a cluster of polygons, and the boundary of each polygon represents the territory belonging to the specific point.
The locations of elementary schools and each school district are accessible through the webpages of the Ministry of Land, Infrastructure, Transport and Tourism (hereinafter MLIT). Also, the population forecast until 2050 has been released by MLIT in the form of GIS data. By synthesizing these data, the distribution of the population in each school district is calculated and the future of elementary schools can be predicted. At the same time, drawing a Voronoi diagram based on the school locations and calculating the population in each Voronoi polygon reveal the effectiveness and the limitations of applying a Voronoi diagram as a method of urban planning.
2. Population Forecast until 2050
The GIS data of the population forecast until 2050 is downloadable from the website of MLIT [
2]. The data include the population forecast on every 500 m × 500 m mesh grid over the entire land of Shizuoka Prefecture for each time span of 5 years until 2050. This forecast is carried out based on the national census of 2015, and it predicts the population by age and sex.
By writing a short Python script [
3], the population forecast is summarized as shown in the bar chart below (
Figure 2). Shizuoka Prefecture had a population of 3,615,586 in 2020, and it is predicted to decrease down to 2,791,692 in 2050. The decreasing rate is approximately 77% in 30 years. For this calculation, the Pandas and GeoPandas libraries are used to manipulate data tables.
The original dataset has population columns for every 5 years from 2015 to 2050 on every 500 m × 500 m mesh grid. It is visualized on a map using red-blue gradation (
Figure 3). The reddish cells show dense areas with a population of around 10 to 40 per hectare. The most populated cell has a density of 128 per hectare, and is located in the southern part of Shizuoka City. On the contrary, in the mountain area, the cells are bluish and have a density of less than 5 per hectare.
The original data are described by age, and the population of school children, that is, between the ages 6 and 11, is calculated (
Figure 4). In 2020, the total number of school children amounts to 181,434, while this figure decreases down to 122,458 in 2050. The decreasing rate is 67.4%. This figure is lower than the case of all ages, which seems to reflect the ongoing tendency toward an aging society.
3. Applying Population Forecast to School Districts
Combining the two datasets, the population forecast of school children on each 500 m × 500 m grid and the distribution of school districts, a diagram showing the chronological changes on each school district is obtained. The original GIS data of school districts are available on the website of MLIT. That dataset basically reflects the status as of 2021; however, some of the data have not yet been updated in some municipalities. For those cases, the data of school districts as of 2010 are combined with the dataset of 2021.
On the map below (
Figure 5), altogether, 473 elementary schools within Shizuoka Prefecture are represented, whose locations are shown as blue points. Each school district is drawn as a closed polyline, and the inside of the region is filled with a red-colored gradation. This color represents the calculated population of school children in 2050 in each school district. The deeper the red, the lower the population becomes, while the whiter districts have more school children.
Extracting the number of school children in 2050 in each school district and sorting the data in ascending order results in the following bar chart (
Figure 6). There are 149 cases out of 473 samples that are predicted to have fewer than 120 school children in the year 2050. Suppose there are 20 students in each grade, and the school has 120 children altogether. If the number of children becomes smaller than this figure, it seems that it would be difficult to run that school any longer. This means that approximately 1/3 of the schools would need to be reorganized.
The line graph below (
Figure 7) shows the chronological changes in the decreasing rate of school children of the 473 samples in different colors.
4. Generating a Voronoi Diagram from the School Locations
Using QGIS [
4], a visualizer of geospatial data, it is possible to create a Voronoi diagram from the dataset of school locations. Also, the geometric intersection of the Voronoi polygons and the bounding polygon of Shizuoka Prefecture are visualized using a Python script. For this operation, i.e., a 2-dimensional Boolean operation, a library called Shapely is used. The calculation of the number of school children on each Voronoi polygon is made through the same process as explained before in the case of school districts.
On the following map (
Figure 8), the number of school children within each Voronoi polygon in the year 2050 is shown in red gradient colors. The deeper the red, the lower the population becomes. This is the same as in the case of
Figure 5.
The shape of each Voronoi polygon approximates the bounding lines of the corresponding school district. However, the actual school districts are determined based on their topographical and, sometimes, cultural characteristics. This causes a difference in shapes between the actual school districts and virtual Voronoi polygons.
To numerically compare the cases of actual school districts (
Figure 5) and the Voronoi diagram (
Figure 8), correlation coefficients are calculated. For this calculation, a Python script in the Pandas library is written. A correlation coefficient takes a value between −1.0 and +1.0, and the relationship between the two variables is stronger if the value becomes closer to +1.0.
Its result is shown in the bar chart below (
Figure 9). Regarding the number of school children, the coefficients exceed 0.87 throughout each time span of 5 years. As to the coefficient related to the area of polygons, i.e., the square meterage of school districts and Voronoi polygons, the value is 0.81, and it seems appropriate to conclude that their relationship is relatively strong.
5. Conclusions
Herein, the relationship of the actual school districts in Shizuoka Prefecture and the Voronoi regions generated from the school locations is determined and examined. They both fill up the entire land space, and geometrically, they both are configured as closed polylines on a map. Therefore, it seems quite natural that they show a strong correlation. However, when we apply the idea of the Voronoi diagram to various aspects in the field of actual city planning, its effectiveness and limitations need to be considered.
A Voronoi diagram theoretically subdivides the land into a cluster of polygons. However, it is mathematically drawn on an abstract plane, which is 2-dimensional and completely flat. On the contrary, in the real environment, mountains and rivers create natural topography, and human communities have been built on that basis. This seems to give the difference in the values of correlation coefficients.
On the other hand, there can be many scenes predicted where the method of the Voronoi diagram is applied to varied studies of urban planning. The operation of spatial subdivision forms the fundamental basis for planning. Its optimization has always been the central issue in urban planning.
A city can be viewed as a cluster of communities. Each community comprises a population of approximately 7000 to 10,000. Elementary schools have functioned as cultural and spiritual symbols of the community. The reorganization and consolidation of schools is inevitable under the current tendency of depopulation. The studies that have been conducted thus far can build a basis for planning the further reorganization of communities.
In this study, school districts are chosen as a case study. However, a real city can be conceived as a polymerized entity consisting of numerous types of community. The configuration of school districts is understood as one such example. In a real city, there exist multiple layers of territories with different sizes, which have been generated by public institutions like hospitals, post offices, museums, libraries, or even convenience stores. In the practice of urban planning, Voronoi diagrams can be an effective tool for architects and planners.


