Proceeding Paper

A Systematic Review of Packages for Time Series Analysis †

Fraunhofer Institut for Experimental Software Engineering IESE, Fraunhofer Platz 1, 67663 Kaiserslautern, Germany
*
Author to whom correspondence should be addressed.
Presented at the 7th International Conference on Time Series and Forecasting, Gran Canaria, Spain, 19–21 July 2021.
Eng. Proc. 2021, 5(1), 22; https://doi.org/10.3390/engproc2021005022
Published: 28 June 2021
(This article belongs to the Proceedings of The 7th International Conference on Time Series and Forecasting)

Abstract

:
This paper presents a systematic review of Python packages with a focus on time series analysis. The objective is to provide (1) an overview of the different time series analysis tasks and preprocessing methods implemented, and (2) an overview of the development characteristics of the packages (e.g., documentation, dependencies, and community size). This review is based on a search of literature databases as well as GitHub repositories. Following the filtering process, 40 packages were analyzed. We classified the packages according to the analysis tasks implemented, the methods related to data preparation, and the means for evaluating the results produced (methods and access to evaluation data). We also reviewed documentation aspects, the licenses, the size of the packages’ community, and the dependencies used. Among other things, our results show that forecasting is by far the most frequently implemented task, that half of the packages provide access to real datasets or allow generating synthetic data, and that many packages depend on a few libraries (the most used ones being numpy, scipy and pandas). We hope that this review can help practitioners and researchers navigate the space of Python packages dedicated to time series analysis. We also provide an updated list of the reviewed packages online.

1. Introduction

A time series is a set of data points generated from successive measurements over time. The analysis of this type of data has found application in many fields, from finance to health, including the monitoring of computer networks or the environment. The current trend of reducing the cost of sensors and data storage, the increasing performance of Big Data and data analysis technologies such as machine learning or data mining, are opening up more and more possibilities to acquire and analyze temporal data. Moreover, as the number of time series analysis application cases rises, more and more data scientists, data engineers, analysts, and software engineers have to use dedicated time series analysis libraries.
In this article, we systematically review Python packages dedicated to time series analysis. Python is one of the programming languages of choice for data scientists (See the different surveys performed by Kaggle from 2017 until 2020: https://www.kaggle.com/kaggle-survey-2020 (accessed on 24 June 2021). Data scientists are not only responsible for analyzing data; their task is also to ensure that services based on these analyses reach a sufficient level of maturity to be deployed and maintained in production. In this context, we review not only the analysis tasks implemented in the packages, but also several factors external to the tasks themselves, such as which dependencies are used or how big the community behind the development of the package in question is. Our goal is not to evaluate the quality of the implementations themselves but to provide a structured overview that is useful for data scientists confronted with time series analysis (and faced with having to choose which packages to rely on), the scientific community, and the community of Python developers working in this field. This paper is structured as follows: Related work is introduced in Section 2; the search methodology and the search results are described in Section 3 and Section 4, respectively; threats to validity are discussed in Section 5; and Section 6 concludes the paper.

2. Related Work

Time series analysis is a broad research field covering many application domains. The literature contains many reviews, either focusing on analysis tasks and methods (see, for instance, these reviews on forecasting [1,2,3,4], clustering and classification [5,6,7,8,9], anomaly detection [10,11,12], changepoint analysis [13,14,15], pattern recognition [16,17], or dimensionality reduction [18]) or focusing on a specific application domain (see, for instance, these surveys on finance [19], IoT and Industry 4.0 [20,21,22], or health [23]). Over time, several formal definitions and reviews of time series analysis tasks have been published; see, for example [24,25,26].
However, existing implementations (software packages or libraries) are often listed—usually in a non-systematic way—in textbooks (like [27,28] for R, or [29] for Python) or gray literature (for example, Towards Data Science (https://towardsdatascience.com/), KDnuggets (https://www.kdnuggets.com/) or Machine Learning Mastery (https://machinelearningmastery.com/), and few papers actually systematically review packages or libraries in a specific language. For example, Ref. [30] reviewed packages for analyzing animal movement data in R, and [31] surveyed R packages for hydrology. With respect to Python, we found several reviews of packages for different domains: social media content scrapping [32], topological data analysis [33], or data mining [34]. For time series analysis in Python, the only related work we could find is [35], where the authors review packages focusing on forecasting.
There is, to the best of our knowledge, no systematic review of Python packages for generic time series analysis.

3. Methodology

We conducted a systematic literature review according to [36]. However, these guidelines focus on printed literature, not on software packages. Hence, we adjusted these methods. Our search process is illustrated in Figure 1. We conducted a search in both literature databases and code repositories (GitHub). The following sections provide more details on the different steps of the search itself.

3.1. Research Questions

We already stated our goal and the context we set for this review in the introduction. We formalize this context as follows: We want to analyze Python packages dedicated to time series analysis for the purpose of structuring the available implementations (we explicitly exclude the purpose of evaluating them) with respect to the implemented time series analysis tasks from the viewpoint of practitioners in the context of building data-driven services on top of these implementations. Our research questions are:
  • RQ1 Which time series analysis tasks exist? And which of these are implemented in maintained Python packages?
  • RQ2 How do the packages support the evaluation of the produced results?
  • RQ3 How do the packages support their usage, and what insights can we gain to estimate the durability of a given package and make an informed choice about its long-term use?

3.2. Inclusion Criteria

To guide our review and filter relevant packages, we defined the following inclusion criteria (IC): The package should be open source, written in Python, and available on GitHub (IC1). The package should be actively maintained (last commit within less than 6 months) (IC2.1); it should have more than 100 GitHub stars (IC2.2); and it should be listed in PyPI (PyPI is the Python Package Index, a repository of software for the Python programming language, see https://pypi.org/) and be installable via pip (pip is the Python Package Installer, see https://pip.pypa.io/en/stable/) or conda (conda is a Python package management system and environment management provided by the Anaconda distribution, see https://docs.conda.io/en/latest/) (IC2.3). The package should explicitly target time series analysis (IC3). We excluded packages that can be used for time series analysis (as building blocks) but whose main purpose is not time series analysis per se (for example, generic scientific computing packages such as scipy or numpy, packages dedicated to data manipulation or storage such as pandas, or generic machine learning or data mining packages such as scikit-learn). Finally, we focused our search on packages offering methods that tend to be domain-agnostic (IC4) and excluded domain-specific packages. Domain-specific packages are packages aiming to solve time series analysis in a specific domain (for example, audio, finance, geoscience, etc.). They usually focus on specific types and formats of time series and domain related analysis tasks.

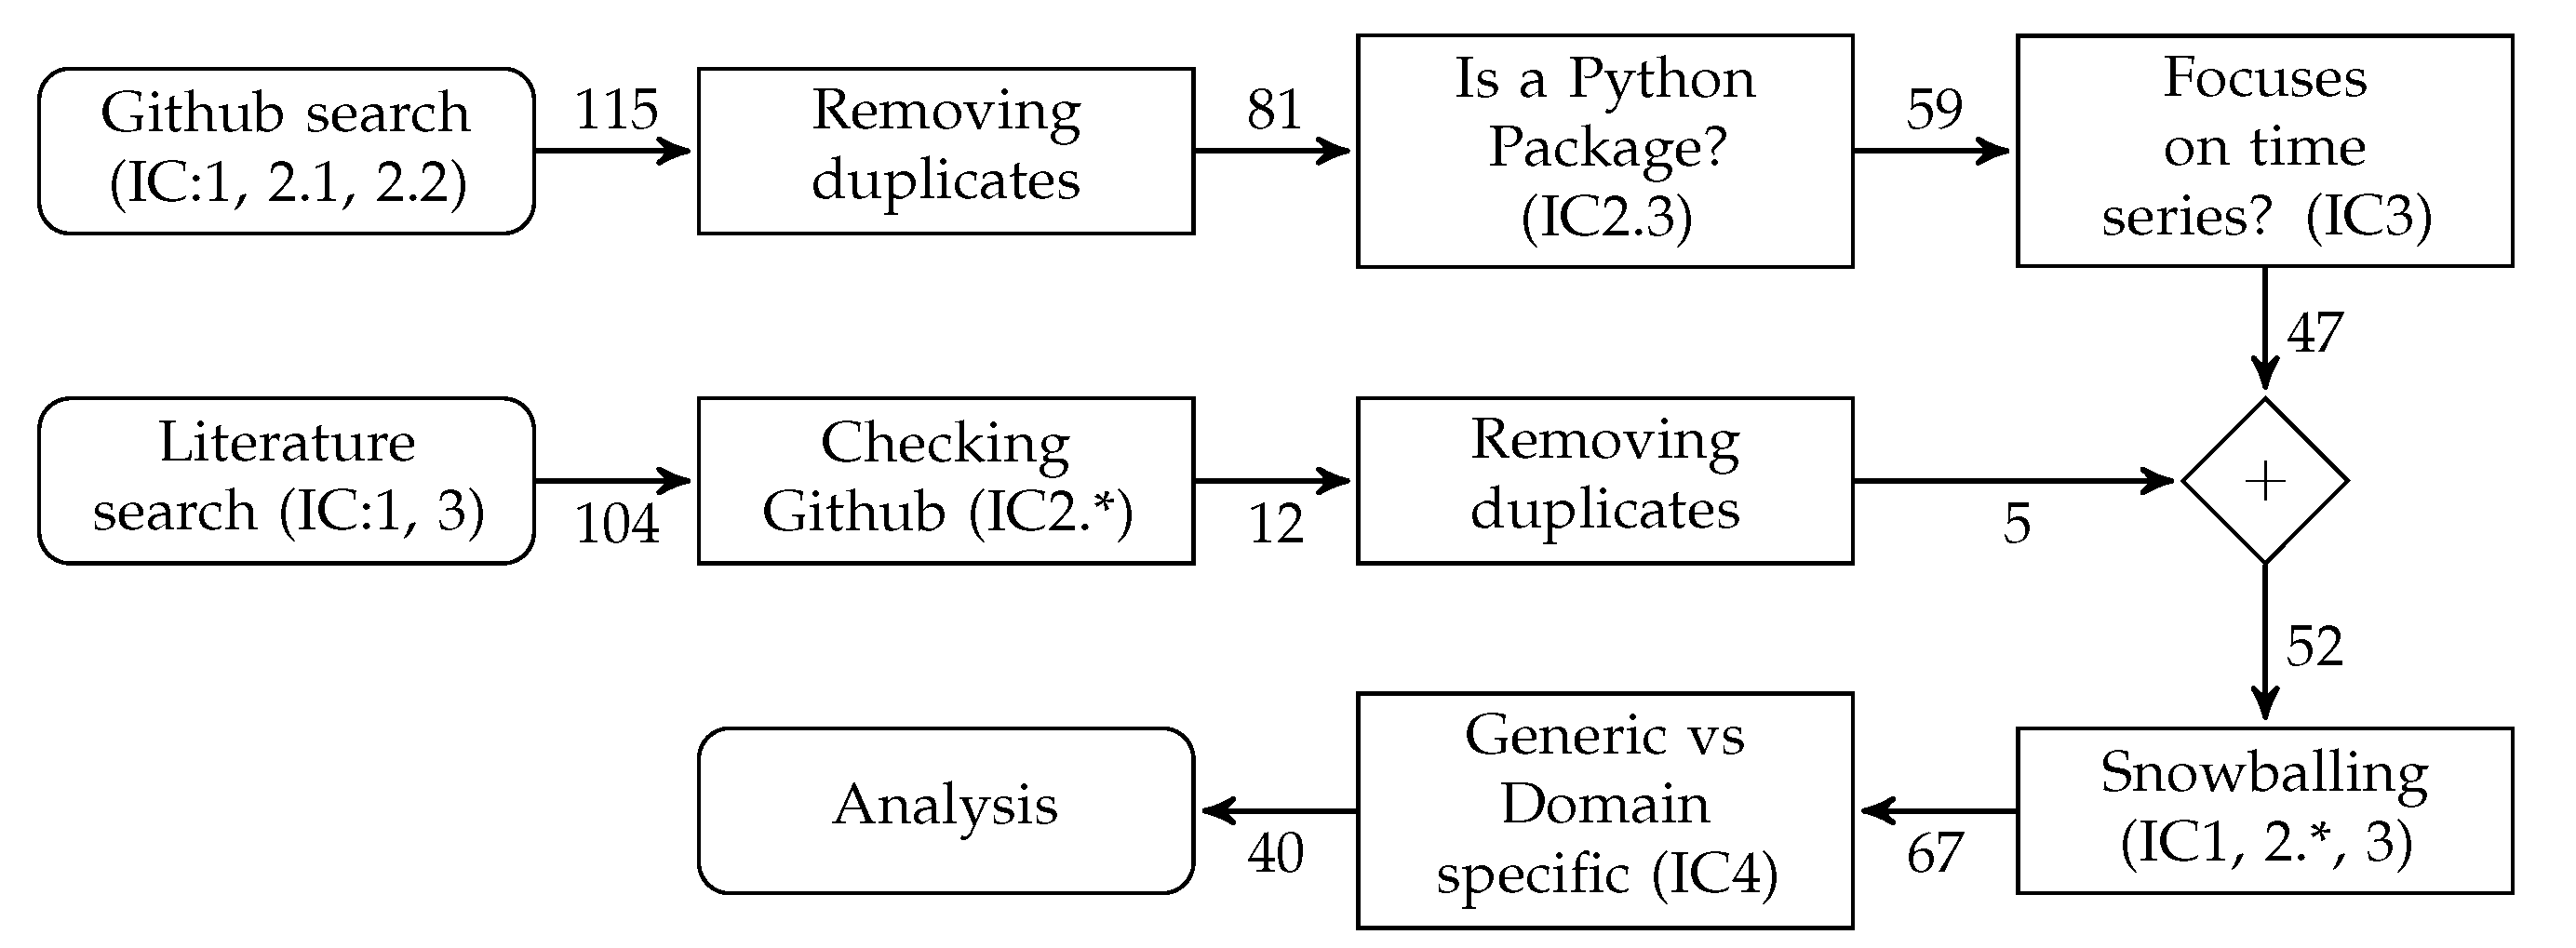
3.3. Searching Open-Source Repositories in GitHub

In order to filter GitHub repositories, we selected a list of topics (https://github.com/topics (accessed on 1 March 2021)), filtered the results by language (Python, IC1), by number of stars (at least 100, IC2.2), and considered only repositories that were updated after July 2020 (IC2.1).
In order to select a list of relevant topics, we first manually selected a list of eight Python packages known to be used in time series analysis (i.e., a seeds set): pandas, numpy, scipy, statsmodel, ruptures, tsfresh, tslearn, and sktime; as well as a sample of the packages using the topic “time-series”. We examined the topics used by these packages and then extended this list of topics with different spellings while manually double-checking their existence in GitHub. We considered a total of 16 different topics (see Table 1). The first search led to a total of 115 repositories.

3.3.1. Removing Duplicates

We found 24 unique repositories that were duplicated (i.e., listed in more than one topic). After duplicate removal, 81 unique repositories remained.

3.3.2. Checking If the Repository Contains the Code of a Python Package

We restricted our search to packages that are referenced by PyPI and can be installed with pip or conda (IC2.3). Note that the repository name might not reflect the package name (if one exists). For example, the repository https://github.com/PyWavelets/pywt (accessed on 24 June 2021) contains the source code for the package named pywavelets. The repository https://github.com/angus924/rocket (accessed on 24 June 2021) does not contain the source code for the Python package rocket. We therefore checked each of the 81 repositories manually and excluded 22 repositories, which yielded a total of 59 remaining repositories that contain the source code of a Python package.

3.3.3. Including only Packages Focused on Time Series Analysis

Finally, we manually checked whether the focus of the package is time series analysis (IC3). After exclusion, 47 remaining packages were kept for further analysis.

3.4. Searching Scientific Bibliographic Databases

The search for packages only in a repository might not be sufficient to cover all existing packages. For example, one of our seed packages (namely tsfresh) was not uncovered by the search. Hence, we extended our search to existing literature and software databases (in march 2021). We used the bibliographic databases IEEE Xplore (https://ieeexplore.ieee.org), ACM Digital Library (https://dl.acm.org/), Web of Science (https://www.webofknowledge.com), and Scopus (https://www.scopus.com/), as well as the Journal of Open Source Software (JOSS) (https://joss.theoj.org/), and Zenodo (https://zenodo.org/). For IEEE Xplore, ACM Digital Library, Web of Science, and Scopus, we limited ourselves to the search string ‘‘Python’’ AND ‘‘time series’’ in the document title. For the Journal of Open Source Software (JOSS), we first used the key words ‘‘time series’’ and then filtered the results by language (the query used is: https://joss.theoj.org/papers/search?q=time+series (accessed on 1 March 2021)). For Zenodo, we also used the search string ‘‘Python’’ AND ‘‘time series’’, limited the search to the software category and removed the duplicates (e.g., different versions of the same software). The full query for Zenodo is: https://zenodo.org/search?page=1&size=200&q=%22time%20series%22%20AND%20%22python%22&sort=mostrecent&type=software (accessed on 1 March 2021). We only included references that matched our inclusion criteria IC1, IC2.*, and IC3. Table 2 summarizes our search results.
We manually cross-checked the results obtained from GitHub with the results obtained by our literature search. Out of the eleven packages resulting from our literature search, only five repositories were not already in the GitHub search results: tsfresh, neurodsp, EoN, nolds, and pastas.

3.5. Snowballing

In order to extend our search, we used a snowballing approach. We first manually reviewed the package documentations in order to find links to other similar packages. Only two packages—tsfresh (https://tsfresh.readthedocs.io/en/latest/text/introduction.html#what-else-is-out-there (accessed on 24 June 2021)) and sktime (https://www.sktime.org/en/latest/related_software.html (accessed on 24 June 2021))—actually document related packages. Second, we manually reviewed the documentation and the GitHub repositories of all packages to find related publications. We then reviewed the papers to find new packages (i.e., we performed a single backward snowballing pass). Out of a total of 79 packages, 15 new packages were included after the snowballing phase, for a total of 67 packages.

3.6. Generic vs. Domain-Specific Packages (IC4)

Finally, we classified the packages in two categories: domain-specific and generic. As previously defined, we consider domain-specific packages to be packages aiming to solve time series analysis in a specific domain (for example, audio, finance, geoscience, etc.) and generic packages as those offering methods that tend to be domain-agnostic. Out of the 67 packages, 27 packages were categorized as domain-specific and 40 packages as generic.

3.7. Data Extraction and Categorization

We manually extracted relevant information about the packages from their documentation pages and code. For the categorization, we used an iterative, bottom-up approach. Two researchers first proposed category definitions and then categorized the packages. A third researcher was responsible for resolving disagreements. Iterations were performed until the categories and results were consolidated.

4. Results

4.1. RQ1: Implementation of the Time Series Analysis Tasks

To answer our research question RQ1, we first reviewed the task definitions present in the literature and then analyzed the 40 packages classified as generic to extract information about which tasks have been implemented in the packages.

4.1.1. Task Definitions

Time series analysis tasks are formally defined in the literature. Reviews like [24,25,26,48] define the following tasks: Indexing (query by content): given a time series and some similarity measure, find the nearest matching time series [24,25,26]. Clustering: find groups (clusters) of similar time series [24,25,26,48]. Classification: assign a time series to a predefined class [24,25,26,48]. Segmentation (Summarization): create an accurate approximation of a time series by reducing its dimensionality while retaining its essential features [24,25,26,48]. Forecasting (Prediction): given a time series dataset up to a given time t n , forecast the next values [24,25]. Anomaly Detection: find abnormal data points or subsequences (also called discords) [24,25]. Motif Discovery: find every subsequence (called motif) that appears recurrently in a time series [24,25,48]. Rules Discovery (Rule Mining): find the rules that may govern associations between sets of time series or subsequences [25,48].
Esling and Agon also define implementation components [24]: preprocessing (e.g., filtering noise, removing outliers, or imputing missing values), representation (e.g., dimensionality reduction, finding fundamental shape characteristics), similarity measures, and indexing schemes.

4.1.2. Implemented Tasks

While analyzing the packages, we found packages explicitly mentioning the tasks corresponding to our literature review. We found 20 packages explicitly providing forecasting methods (T1), 6 packages providing classification methods (T2), 6 packages providing clustering methods (T3), 6 packages providing anomaly detection methods (T4), and 4 packages providing segmentation methods (T5). We classified four packages under the category pattern recognition(T6), encompassing both indexing and motif discovery tasks. We also classified five packages under the category change point detection (T7), which was not in our literature review. Finally, we could not find any package explicitly mentioning the rules discovery task.
Considering the implementation components, we found 4 packages explicitly providing dimensionality reduction methods (DP1), 17 packages explicitly providing missing values imputation methods (DP2), 16 packages explicitly providing decomposition methods (e.g., decomposing time series into trends, seasonal components, or frequency components) (DP3), 24 packages explicitly providing generic transformation and features generation methods (DP4), and 7 packages explicitly providing methods for computing similarity measures (DP5). Table 3 gives an overview of our categorization of the packages.
Forecasting is by far the most frequently implemented task. There is no significant difference, in terms of number of packages, between the other tasks. However, we need to be cautious when interpreting these numbers. First, the tasks as formally defined in the literature might not be explicitly mentioned in the packages documentation or code. Second, the delineation between a task and the methods used to implement it is sometimes blurry and context dependent. For example, one can perform change point detection for the sake of finding time points where some time series properties change and, as a consequence, raising alarms in a production system, or use it as a preprocessing step for segmenting a time series into different phases. Another example are forecasting models, which can also be applied for outlier detection.

4.2. RQ2: Evaluation of the Produced Results

To answer our research question RQ2, we extracted information about the evaluation of the outcomes produced by the packages. We came up with two main clusters: functions that facilitate the evaluation itself (E1, E2, E3) and functions for either generating synthetic data or downloading existing datasets (D1, D2). We found 13 packages explicitly providing methods for model selection, hyperparameter search, or feature selection (E1), 20 packages explicitly providing evaluation metrics and statistical tests (E2), and 25 packages providing visualization methods (E3). Concerning the data, we found 16 packages explicitly providing functions for generating synthetic time series data (D1), and 19 packages providing access to time series datasets (D2). A large majority of the packages provide a way to evaluate the results produced. Only 4 packages have not been classified in any of the E or D classes.

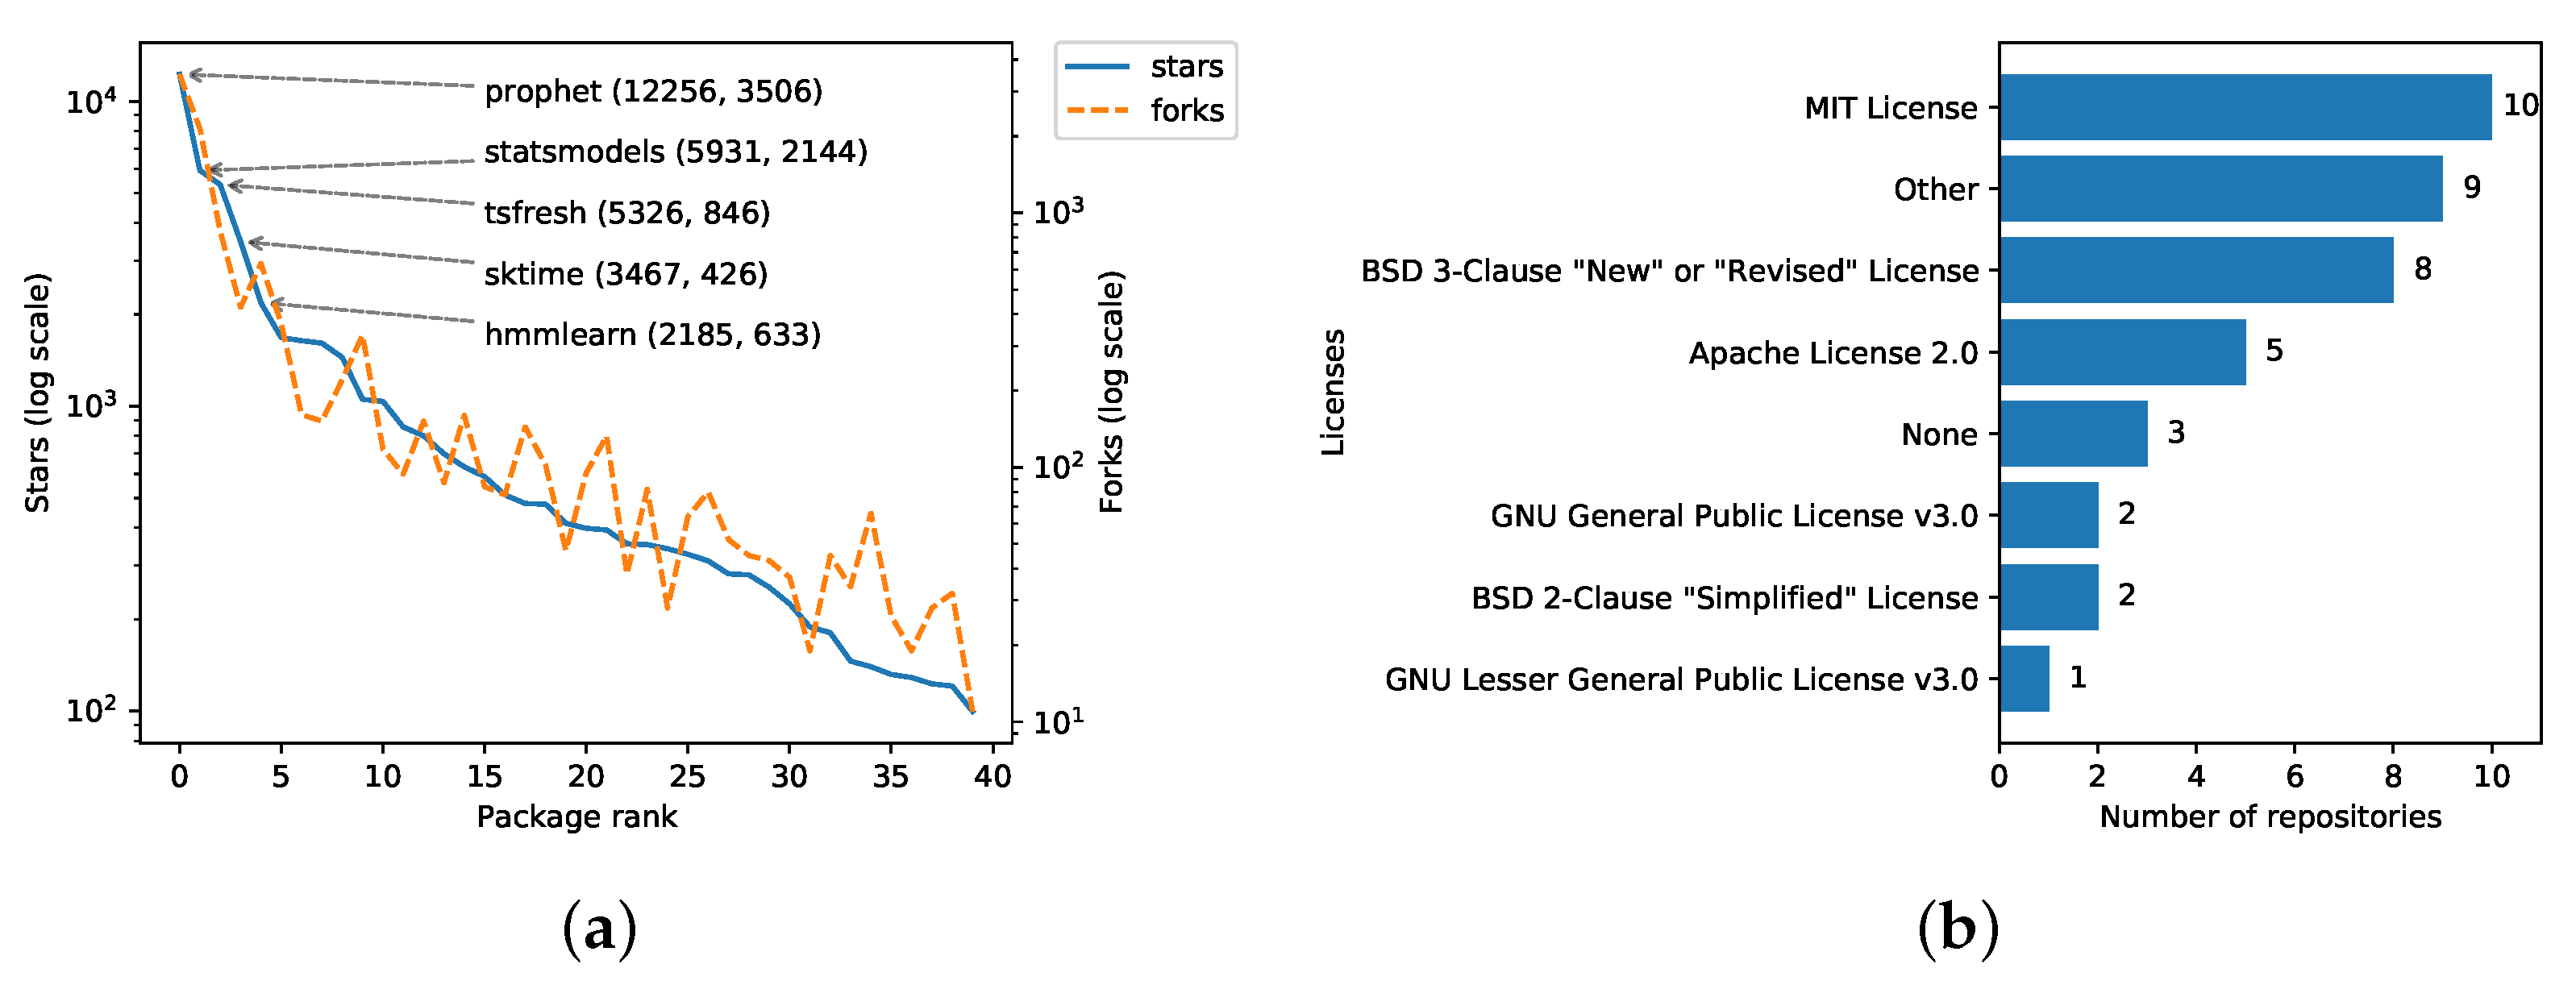
4.3. RQ3: Package Usage and Community

To answer our research question RQ3, we extracted information about the documentation, the dependencies, and the community supporting the packages. For instance, GitHub provides many statistics about a repository (e.g., the number of stars, forks, issues) that can be used to get a first idea of the liveliness of the different packages. We used the number of GitHub stars and forks to estimate the community behind each package. Figure 2a shows the distribution of stars and forks for all 40 packages. Another piece of information that is relevant to practitioners are the licenses under which the implementations are available. Figure 2b shows the distribution of the licenses used among the 40 repositories.
We also investigated the dependencies used by each of the selected 40 packages. We used the Python program johnnydep (https://pypi.org/project/johnnydep/ (accessed on 24 June 2021)) to automatically collect the dependencies without installing the packages directly. We only looked at direct dependencies required for the installation of the package. We did not consider specific installation options such as dev or test. We did not search for all dependencies recursively. Here is an example of how we called the program johnnydep PACKAGENAME --fields=ALL --no-deps --output-format=json. The dependencies of two packages could not be retrieved automatically (cesium and deeptime). We also manually cross-checked the dependencies and filled in the missing ones. Table 4 shows which dependencies are used the most by the packages.
Almost all packages (37) depends upon numpy. The top 5 dependencies are numpy, scipy (scientific computing), pandas (data manipulation), scikit-learn (machine learning), and matplotlib (visualization).
Finally, we investigated five documentation aspects (Do1-Do5). We found that 30 packages provide a separate documentation page (Do1). The other ten packages use the README of the repository file as documentation. 18 packages provide notebooks directly executable without installation via a link to either mybinder.org (https://mybinder.org/) or Google Colab (https://colab.research.google.com/ (accessed on 24 June 2021)) (Do2 +), 12 packages provide stand-alone notebook files to be downloaded (Do2 *), and 10 packages do not provide any notebook file at all. 28 packages provide an API reference (Do3). All packages provide an installation page (Do4) and almost all packages (38) provide user guides in the form of static examples or tutorials.

5. Discussion and Threats to Validity

In this section, we discuss the choices we made and that may affect the validity of this review.
This review focused on GitHub. Gitlab and Sourceforge were checked manually, but we decided not to include them as sources due to the insufficient number of results.
We limited ourselves to packages with at least 100 stars. This somehow arbitrary limit led us to exclude packages with a number of stars close to 100 (e.g., the stingray package with 93 stars at the time of the search). We excluded packages that were not maintained but might have been relevant for practitioners. An example is the pyflux package (forecasting). We also excluded repositories that are not Python packages. This led us to discard interesting repositories like ad_examples (which provides state-of-the-art anomaly detection methods) and many repositories containing code scripts associated with scientific papers.
Concerning the search process, we used a mix of literature databases and GitHub topics together with a snowballing approach to find relevant packages. The reason forthis was that several known packages could not be found automatically. For example, the package cesium does not list any topic and therefore was not found in our first GitHub search. It was found after snowballing. Another example is tsfresh, which was missing in the first GitHub search and was found in the literature search. The problem may be the language filter (strictly Python), as tsfresh lists some of the topics we searched for (“time-series”).
We tried to automate some of the tasks (e.g., filtering repositories that contain Python packages or finding the dependencies), using both PyPI and GitHub API, or the johnnydep tool. There were false positives and false negatives. This led us to manually cross check the results obtained from our automated search.
Whether a package focuses on time series analysis or not can sometimes be fuzzy. For example, we decided to leave the topic of survival analysis out of this review. We initially found two packages: lifelines and scikit-survival. The same applies to the boundary between generic and domain-specific packages. We took a conservative approach to keep our survey sufficiently focused.
As already mentioned above, the definition of what should be regarded as a task vs. an “implementation component” is difficult, as a strict boundary may not even exist. Moreover, it is sometimes not clear what methods the packages provide without actually installing them and testing them. Indeed, the documentation might not be complete or the vocabulary used may differ from one package to another. One solution was to check the code itself. Here again, the search strings used play an important role in avoiding false negatives.

6. Conclusions

This paper presented a systematic review of Python packages dedicated to time series analysis. The search process led to a total of 40 packages that were analyzed further. We proposed a categorization of the packages based on the analysis tasks implemented, the methods related to data preparation, the means for evaluating the results produced, and the kind of documentation present, and also looked at some development aspects (licenses, stars, dependencies). We also discussed the search process with its possible bias and the challenges we encountered while searching for and reviewing the relevant packages. The scope of this survey does, however, not include any evaluation of the implementations or the results they would produce, for example, on benchmark datasets. We hope that this review can help practitioners and researchers navigate the space of Python packages dedicated to time series analysis. Since the packages will evolve, we plan to maintain an updated list of the reviewed packages online at https://siebert-julien.github.io/time-series-analysis-python/.

Author Contributions

J.S. designed the search process. All authors contributed equally to the results evaluation and to the manuscript. All authors have read and agreed to the published version of the manuscript.

Funding

This research received no external funding.

Institutional Review Board Statement

Not applicable.

Informed Consent Statement

Not applicable.

Data Availability Statement

Not applicable.

Acknowledgments

The authors want to thank Anna Maria Vollmer and Markus Löning for their valuable feedback.

Conflicts of Interest

The authors declare no conflict of interest.

References

  1. Hendikawati, P.; Subanar; Abdurakhman; Tarno. A survey of time series forecasting from stochastic method to soft computing. J. Phys. Conf. Ser. 2020, 1613, 012019. [Google Scholar] [CrossRef]
  2. Mahalakshmi, G.; Sridevi, S.; Rajaram, S. A survey on forecasting of time series data. In Proceedings of the 2016 International Conference on Computing Technologies and Intelligent Data Engineering (ICCTIDE’16), Kovilpatti, India, 7–9 January 2016; IEEE: Piscataway, NJ, USA, 2016; pp. 1–8. [Google Scholar] [CrossRef]
  3. Panigrahi, S.; Behera, H.S. Fuzzy Time Series Forecasting: A Survey. In Computational Intelligence in Data Mining; Advances in Intelligent Systems and Computing Ser; Behera, H.S., Nayak, J., Naik, B., Pelusi, D., Eds.; Springer: Singapore, 2020; pp. 641–651. [Google Scholar]
  4. Tealab, A. Time series forecasting using artificial neural networks methodologies: A systematic review. Future Comput. Inform. J. 2018, 3, 334–340. [Google Scholar] [CrossRef]
  5. Abanda, A.; Mori, U.; Lozano, J.A. A review on distance based time series classification. Data Min. Knowl. Discov. 2019, 33, 378–412. [Google Scholar] [CrossRef] [Green Version]
  6. Aghabozorgi, S.; Seyed Shirkhorshidi, A.; Ying Wah, T. Time-series clustering—A decade review. Inf. Syst. 2015, 53, 16–38. [Google Scholar] [CrossRef]
  7. Bagnall, A.; Lines, J.; Bostrom, A.; Large, J.; Keogh, E. The great time series classification bake off: A review and experimental evaluation of recent algorithmic advances. Data Min. Knowl. Discov. 2017, 31, 606–660. [Google Scholar] [CrossRef] [PubMed] [Green Version]
  8. Fawaz, H.I.; Forestier, G.; Weber, J.; Idoumghar, L.; Muller, P.A. Deep learning for time series classification: A review. Data Min. Knowl. Discov. 2019, 33, 917–963. [Google Scholar] [CrossRef] [Green Version]
  9. Susto, G.A.; Cenedese, A.; Terzi, M. Time-Series Classification Methods: Review and Applications to Power Systems Data. In Big Data Application in Power Systems; Elsevier: Amsterdam, The Netherlands, 2018; pp. 179–220. [Google Scholar] [CrossRef]
  10. Ayadi, A.; Ghorbel, O.; Obeid, A.M.; Abid, M. Outlier detection approaches for wireless sensor networks: A survey. Comput. Netw. 2017, 129, 319–333. [Google Scholar] [CrossRef]
  11. Cook, A.A.; Misirli, G.; Fan, Z. Anomaly Detection for IoT Time-Series Data: A Survey. IEEE Internet Things J. 2020, 7, 6481–6494. [Google Scholar] [CrossRef]
  12. Wu, H.S. A survey of research on anomaly detection for time series. In Proceedings of the 2016 13th International Computer Conference on Wavelet Active Media Technology and Information Processing (ICCWAMTIP), Chengdu, China, 16–18 December 2016; Institute of Electrical and Electronics Engineers, Inc.: Piscataway, NJ, USA, 2016; pp. 426–431. [Google Scholar] [CrossRef]
  13. Aminikhanghahi, S.; Cook, D.J. A Survey of Methods for Time Series Change Point Detection. Knowl. Inf. Syst. 2017, 51, 339–367. [Google Scholar] [CrossRef] [Green Version]
  14. Sharma, S.; Swayne, D.A.; Obimbo, C. Trend analysis and change point techniques: A survey. Energy Ecol. Environ. 2016, 1, 123–130. [Google Scholar] [CrossRef] [Green Version]
  15. Truong, C.; Oudre, L.; Vayatis, N. Selective review of offline change point detection methods. Signal Process. 2020, 167, 107299. [Google Scholar] [CrossRef] [Green Version]
  16. Torkamani, S.; Lohweg, V. Survey on time series motif discovery. WIREs Data Min. Knowl. Discov. 2017, 7, e1199. [Google Scholar] [CrossRef]
  17. Wang, J.; Chen, Y.; Hao, S.; Peng, X.; Hu, L. Deep Learning for Sensor-based Activity Recognition: A Survey. Pattern Recognit. Lett. 2018. [Google Scholar] [CrossRef] [Green Version]
  18. Badhiye, S.S. A Review on Time Series Dimensionality Reduction. HELIX 2018, 8, 3957–3960. [Google Scholar] [CrossRef]
  19. Sezer, O.B.; Gudelek, M.U.; Ozbayoglu, A.M. Financial time series forecasting with deep learning: A systematic literature review: 2005–2019. Appl. Soft Comput. 2020, 90, 106181. [Google Scholar] [CrossRef] [Green Version]
  20. Lepenioti, K.; Bousdekis, A.; Apostolou, D.; Mentzas, G. Prescriptive analytics: Literature review and research challenges. Int. J. Inf. Manag. 2020, 50, 57–70. [Google Scholar] [CrossRef]
  21. Mohammadi, M.; Al-Fuqaha, A.; Sorour, S.; Guizani, M. Deep Learning for IoT Big Data and Streaming Analytics: A Survey. IEEE Commun. Surv. Tutor. 2018, 20, 2923–2960. [Google Scholar] [CrossRef] [Green Version]
  22. Zhao, Y.; Zhang, C.; Zhang, Y.; Wang, Z.; Li, J. A review of data mining technologies in building energy systems: Load prediction, pattern identification, fault detection and diagnosis. Energy Built Environ. 2019. [Google Scholar] [CrossRef]
  23. Zeger, S.L.; Irizarry, R.; Peng, R.D. On time series analysis of public health and biomedical data. Annu. Rev. Public Health 2006, 27, 57–79. [Google Scholar] [CrossRef] [Green Version]
  24. Esling, P.; Agon, C. Time-series data mining. ACM Comput. Surv. 2012, 45, 1–34. [Google Scholar] [CrossRef] [Green Version]
  25. Fakhrazari, A.; Vakilzadian, H. A survey on time series data mining. In Proceedings of the 2017 IEEE International Conference on Electro Information Technology (EIT), Lincoln, NE, USA, 14–17 May 2017; pp. 476–481. [Google Scholar] [CrossRef]
  26. Keogh, E.; Kasetty, S. On the Need for Time Series Data Mining Benchmarks: A Survey and Empirical Demonstration. Data Min. Knowl. Discov. 2003, 7, 349–371. [Google Scholar] [CrossRef]
  27. Cowpertwait, P.S.P.; Metcalfe, A.V. Introductory Time Series with R; Use R! Springer: Dordrecht, The Netherlands; New York, NY, USA, 2009. [Google Scholar]
  28. Shumway, R.H.; Stoffer, D.S. Time Series Analysis and Its Applications: With R Examples, 4th ed.; Springer: Cham, Switzerland, 2017. [Google Scholar]
  29. Nielsen, A. Practical Time Series Analysis: Prediction with Statistics and Machine Learning, 1st ed.; O’Reilly: Beijing, China, 2019. [Google Scholar]
  30. Joo, R.; Boone, M.E.; Clay, T.A.; Patrick, S.C.; Clusella-Trullas, S.; Basille, M. Navigating through the r packages for movement. J. Anim. Ecol. 2020, 89, 248–267. [Google Scholar] [CrossRef] [Green Version]
  31. Slater, L.J.; Thirel, G.; Harrigan, S.; Delaigue, O.; Hurley, A.; Khouakhi, A.; Prosdocimi, I.; Vitolo, C.; Smith, K. Using R in hydrology: A review of recent developments and future directions. Hydrol. Earth Syst. Sci. 2019, 23, 2939–2963. [Google Scholar] [CrossRef] [Green Version]
  32. Thivaharan, S.; Srivatsun, G.; Sarathambekai, S. A Survey on Python Libraries Used for Social Media Content Scraping. In Proceedings of the International Conference on Smart Electronics and Communication (ICOSEC 2020), Trichy, India, 10–12 September 2020. [Google Scholar] [CrossRef]
  33. Ray, J.; Trovati, M. A survey of topological data analysis (TDA) methods implemented in python. Lect. Notes Data Eng. Commun. Technol. 2018, 8, 594–600. [Google Scholar]
  34. Stancin, I.; Jovic, A. An overview and comparison of free Python libraries for data mining and big data analysis. In Proceedings of the 2019 42st International Convention on Information and Communication Technology, Electronics and Microelectronics (MIPRO), Opatija, Croatia, 20–24 May 2019; pp. 977–982. [Google Scholar] [CrossRef]
  35. Januschowski, T.; Gasthaus, J.; Wang, Y. Open-Source Forecasting Tools in Python. Foresight Int. J. Appl. Forecast. 2019, 55, 20–26. [Google Scholar]
  36. Kitchenham, B.; Brereton, P. A systematic review of systematic review process research in software engineering. Inf. Softw. Technol. 2013, 55, 2049–2075. [Google Scholar] [CrossRef]
  37. Burns, D.M.; Whyne, C.M. Seglearn: A Python Package for Learning Sequences and Time Series. J. Mach. Learn. Res. 2018, 19, 3238–3244. [Google Scholar]
  38. Christ, M.; Braun, N.; Neuffer, J.; Kempa-Liehr, A.W. Time Series FeatuRe Extraction on basis of Scalable Hypothesis tests (tsfresh—A Python package). Neurocomputing 2018, 307, 72–77. [Google Scholar] [CrossRef]
  39. Alexandrov, A.; Benidis, B.; Bohlke-Schneider, M.; Flunkert, V.; Gasthaus, J.; Januschowski, T.; Maddix, D.C.; Rangapuram, S.; Salinas, D.; Schulz, J.; et al. GluonTS: Probabilistic and Neural Time Series Modeling in Python. J. Mach. Learn. Res. 2020, 21, 1–6. [Google Scholar]
  40. Faouzi, J.; Janati, H. Pyts: A python package for time series classification. J. Mach. Learn. Res. 2020, 21, 1–6. Available online: http://jmlr.org/papers/v21/19-763.html (accessed on 24 June 2021).
  41. Law, S. STUMPY: A Powerful and Scalable Python Library for Time Series Data Mining. J. Open Source Softw. 2019, 4, 1504. [Google Scholar] [CrossRef] [Green Version]
  42. Collenteur, R.; Bakker, M.; Caljé, R.; Schaars, F. Pastas: Open-Source Software for the Analysis of Hydrogeological Time Series. Available online: https://zenodo.org/record/4277358 (accessed on 24 June 2021).
  43. Miller, J.C.; Ting, T. EoN (Epidemics on Networks): A Fast, Flexible Python Package for Simulation, Analytic Approximation, and Analysis of Epidemics on Networks. 2020. Available online: https://zenodo.org/record/3572756 (accessed on 24 June 2021).
  44. Schölzel, C. Nonlinear Measures for Dynamical Systems. Available online: https://zenodo.org/record/3814723 (accessed on 24 June 2021).
  45. Silva, P.C.D.L.E.; Júnior, C.A.S.; Alves, M.A.; Silva, R.C.P.; Vieira, G.L.; Lucas, P.D.O.E.; Sadaei, H.J.; Guimarães, F.G. PYFTS/pyFTS: Stable Version 1.6. 2019. Available online: https://zenodo.org/record/2669398 (accessed on 24 June 2021).
  46. Snow, D.; Baltacı, F. firmai/atspy: Zenodo. 2020. Available online: https://zenodo.org/record/4270168 (accessed on 24 June 2021).
  47. Team, T.O.D. Obspy 1.0.0. 2016. Available online: https://zenodo.org/record/46151 (accessed on 24 June 2021).
  48. Fu, T.C. A review on time series data mining. Eng. Appl. Artif. Intell. 2011, 24, 164–181. [Google Scholar] [CrossRef]
Figure 1. Search and filtering process overview. Edge labels indicate the number of repositories left after each step.
Engproc 05 00022 g001
Figure 2. (a) Distribution of stars and forks for all 40 repositories (log scale). The repositories are ranked by the number of stars, in descending order. (b) Distribution of licenses (number of repositories per license). None means that no license information was available from GitHub directly.
Engproc 05 00022 g002
Table 1. List of topics used to conduct the search on GitHub.
Table 2. Literature search results.
Data SourceNumber of HitsNumber of Included DocumentsIncluded References
IEEE Xplore10
ACM Digital Library21[37]
Web of Science104[37,38,39,40]
Scopus124[37,38,39,40]
JOSS211[41]
Zenodo686[42,43,44,45,46,47]
Table 3. Classification of packages. Tasks: T1 (forecasting), T2 (classification), T3 (clustering), T4 (anomaly detection), T5 (segmentation), T6 (pattern recognition), T7 (change point detection). Data Preparation (also called implementation components): DP1 (dimensionality reduction), DP2 (missing values imputation), DP3 (decomposition), DP4 (preprocessing), DP5 (similarity measures). Evaluation: E1 (model selection, hyperparameter search, feature selection), E2 (metrics and statistical tests), E3 (visualization). Datasets: D1 (synthetic data generation) and D2 (contains datasets). Documentation: Do1 (dedicated documentation), Do2 (notebook: directly executable (+), present (*)), Do3 (API reference), Do4 (install guide), Do5 (user guide).
Package NameTasksData PreparationEvaluationDataDocumentation
T1T2T3T4T5T6T7DP1DP2DP3DP4DP5E1E2E3D1D2Do1Do2Do3Do4Do5
arch+ + +++*+++
atspy+ +++ +++ + ++
banpei + + ++
cesium + +*+++
darts+ +++ +++++ +++
deeptime+ + + ++ +++ ++ ++
deltapy+ + + +++ +++++
dtaidistance + + + +++++
EMD-signal + + +++++
flood-forecast+ + + ++ +++++
gluonts+ + + +++++ +++
hcrystalball+ + + ++++++*+++
hmmlearn+ + + +* ++
hypertools + ++ + + +*+++
linearmodels + + * ++
luminaire+ + + +++ + + +
matrixprofile ++++ + + + ++ +++
mcfly + + + + ++
neuralprophet+ +++ + +*+++
nolds + + +++ +++
pmdarima+ ++ +++ + * ++
prophet+ + + ++ +*+++
pyaf+ +++ +++ ++ +++
pycwt + ++++++
pydlm+ + +++ +*+++
pyFTS+ + +++++ + ++
pyodds + +++ +*+++
pytorchts+ + + ++++++++
pyts + ++ ++++ +++++*++
PyWavelets ++ +++*+++
ruptures + +++ ++ ++
scikit-multiflow + + + + + +++ +*++
seglearn + ++*+++
sktime++ ++ +++++++ ++*+++
sktime-dl++ + + ++
statsmodels+ +++ ++++++*+++
stumpy ++ + +*+++
tftb ++ +++ +++++
tsfresh + + ++ ++ +++
tslearn ++ + ++ + +++ ++
Total206664454171624713232516193430284037
T1T2T3T4T5T6T7DP1DP2DP3DP4DP5E1E2E3D1D2Do1Do2Do3Do4Do5
TasksData PreparationEvaluationDataDocumentation
Table 4. Ranking of the most frequently used dependencies.
Package NameUsedRankPackage NameUsedRank
numpy371torch68
scipy302numba68
pandas233cython68
scikit-learn214tensorflow59
matplotlib165seaborn410
statsmodels86future410
tqdm77joblib410
Publisher’s Note: MDPI stays neutral with regard to jurisdictional claims in published maps and institutional affiliations.

