Proceeding Paper

Preparation, Properties, and Characterization of ZnS Nanoparticles †

by
Amani H. Ali
1,*,
Hassan Abd-elhamid Hashem
2,* and
Ahmed Elfalaky
2,*
1
Egyptian Meteorological Authority, Qobry EL-Kobba, Cairo P.O. Box 11784, Egypt
2
Faculty of Science, Physics Department, Zagazig University, Zagazig P.O. Box 44519, Egypt
*
Authors to whom correspondence should be addressed.
Presented at the 3rd International Electronic Conference on Applied Sciences, 1–15 December 2022; Available online: https://asec2022.sciforum.net/.
Eng. Proc. 2023, 31(1), 74; https://doi.org/10.3390/ASEC2022-13829
Published: 9 December 2022
(This article belongs to the Proceedings of The 3rd International Electronic Conference on Applied Sciences)

Abstract

:
In this paper, the structural, microstructural, thermal, electrical, and dielectric properties of synthesized ZnS nanoparticles are studied using the co-precipitation technique. The precipitate was characterized using X-ray diffraction (XRD). Characterization was confirmed via formation of a single-phase cubic nanocrystal line structure. The crystalline size was obtained using three different models. Information regarding thermal transition such as melting, oxidation, and crystallization was revealed using differential scanning calorimetry and thermogravimetry (DTG/TG). Transmission electron microscopy (TEM) images were obtained to explore the stability, morphology, and other properties of the ZnS nanoparticles. Regarding the crystallite size of the prepared ZnS, different techniques were utilized to estimate the crystallite size, and the calculations confirmed the formation of the ZnS in nanocrystal form. The electrical properties of the synthesized nanocrystals were measured at different temperatures (293–373 K) over a wide range of frequencies from about (50 Hz up to 5 MHz). Regarding the frequency dependence of the A.C conductivity and the Activation energy (Ea) was found to decrease as the frequency increase.

1. Introduction

ZnS nanomaterials, including II-VI binary compounds, have received tremendous attention because of their intriguing properties whish arise from the size quantization and extremely high surface to volume ratio of these materials, and which offer major advantages over their bulk materials. Nano-materials have sublime physical and chemical properties which are more efficient than those bulk materials. These unique properties occur when there is a change in a particular features e.g., variation in size or band gap energy.
Zinc sulfide nanomaterial is a non-toxic material which is chemically more stable than other semiconductors and it is characterized by a wide band-gap energy of ~3.7 eV. These properties give it promising potential for diverse applications such as ultraviolet light sensors, efficient UV light emitting diodes, optoelectronic devices, and electroluminescent applications. The photoemission wavelengths, the band gap, and the lattice parameter are strongly dependent on the grain size. There are many techniques used to prepare ZnS in nanomaterial form, such as the microwave irradiation technique [1,2], the sol-gel method, electrochemical deposition [3], the sonochemical method, the hydrothermal technique, and the low-temperature microemulsion method [4].
In this work, ZnS nanoparticles were prepared using a chemical co-precipitation method. The structural and morphological properties of the ZnS were investigated using X-ray diffraction. The electrical studies were carried out within a frequency range of 50 Hz to 5 MHz at different temperatures.

2. Materials and Methods

The following materials were needed for the preparation of the ZnS nano-materials: ZnCl2, sodium sulfide non hydrate (Na2S.9H2O) (assay 99.5%), sodium hydroxide (NaOH) from Alpha Chemika and butan (CH3.(CH2)3.OH) from El-Nasr Pharmaceutical Chemical Company.
ZnS nanoparticles were synthesized using the co-precipitation technique. First, 46.51 gm of the Na2S.9H2O was dissolved into 500 mL of distilled water at room temperature under stirring for 30 min until an aqueous solution was obtained. Then, 34.075 gm of ZnCl2 was dissolved into 500 mL distilled water under continuous stirring for 30 min to obtain an aqueous solution. A substitution reaction will took according to the following Equation (1):
Z n C l 2 + N a 2 S .9 H 2 O + N a O H Z n S + 2 N a C l + 9 H 2 O
After adding the first and second solutions to each other, a few drops of NaOH (as a catalyst) were added under continuous stirring for 30 min. The color of the aqueous medium was immediately converted to a whitish color due to the formation of ZnS. The stirring was continued for a specific time in order to facilitate complete nanoparticle precipitation. The pH value of the solution was 12.82. In order to remove the NaCl, the precipitate was washed several times with distilled water and then a whitish powder of ZnS was obtained. The prepared powder was pressed under a constant pressure of 1000 pa using a small amount of butane alcohol as a binding material. The sample was pressed into a disk shape with a thickness of 1.83 mm. The disk coated with silver paste solution for better electrical contacts.
The phase purity and crystal structure of the prepared pure ZnS nanoparticles were analyzed by analyzing the X-ray diffraction (XRD) patterns using monochromatic Cu- Kα radiation in a 2θ range of 10° to 80° with an X’ Pert PRO Diffractometer (XPERT-MPDUG, Philips PW 3040). A JEOL-Transmission Electron Microscope (TEM) (Model Jeol JEM-1230) was used to record the size of the pure ZnS nanoparticles samples. The FTIR spectra of the samples were recorded with a Shimadzu spectrophotometer in the range of 4000–400 cm−1 using the KBr pellet technique. The RCL computerized bridge model Hioki 3532 Hitester was used for the measurement of the electrical properties. Sample pellets of uniform thickness were prepared, and silver paste was coated on two extreme surfaces of the pallets to ensure the conductivity of those surfaces.

3. Results and discussion

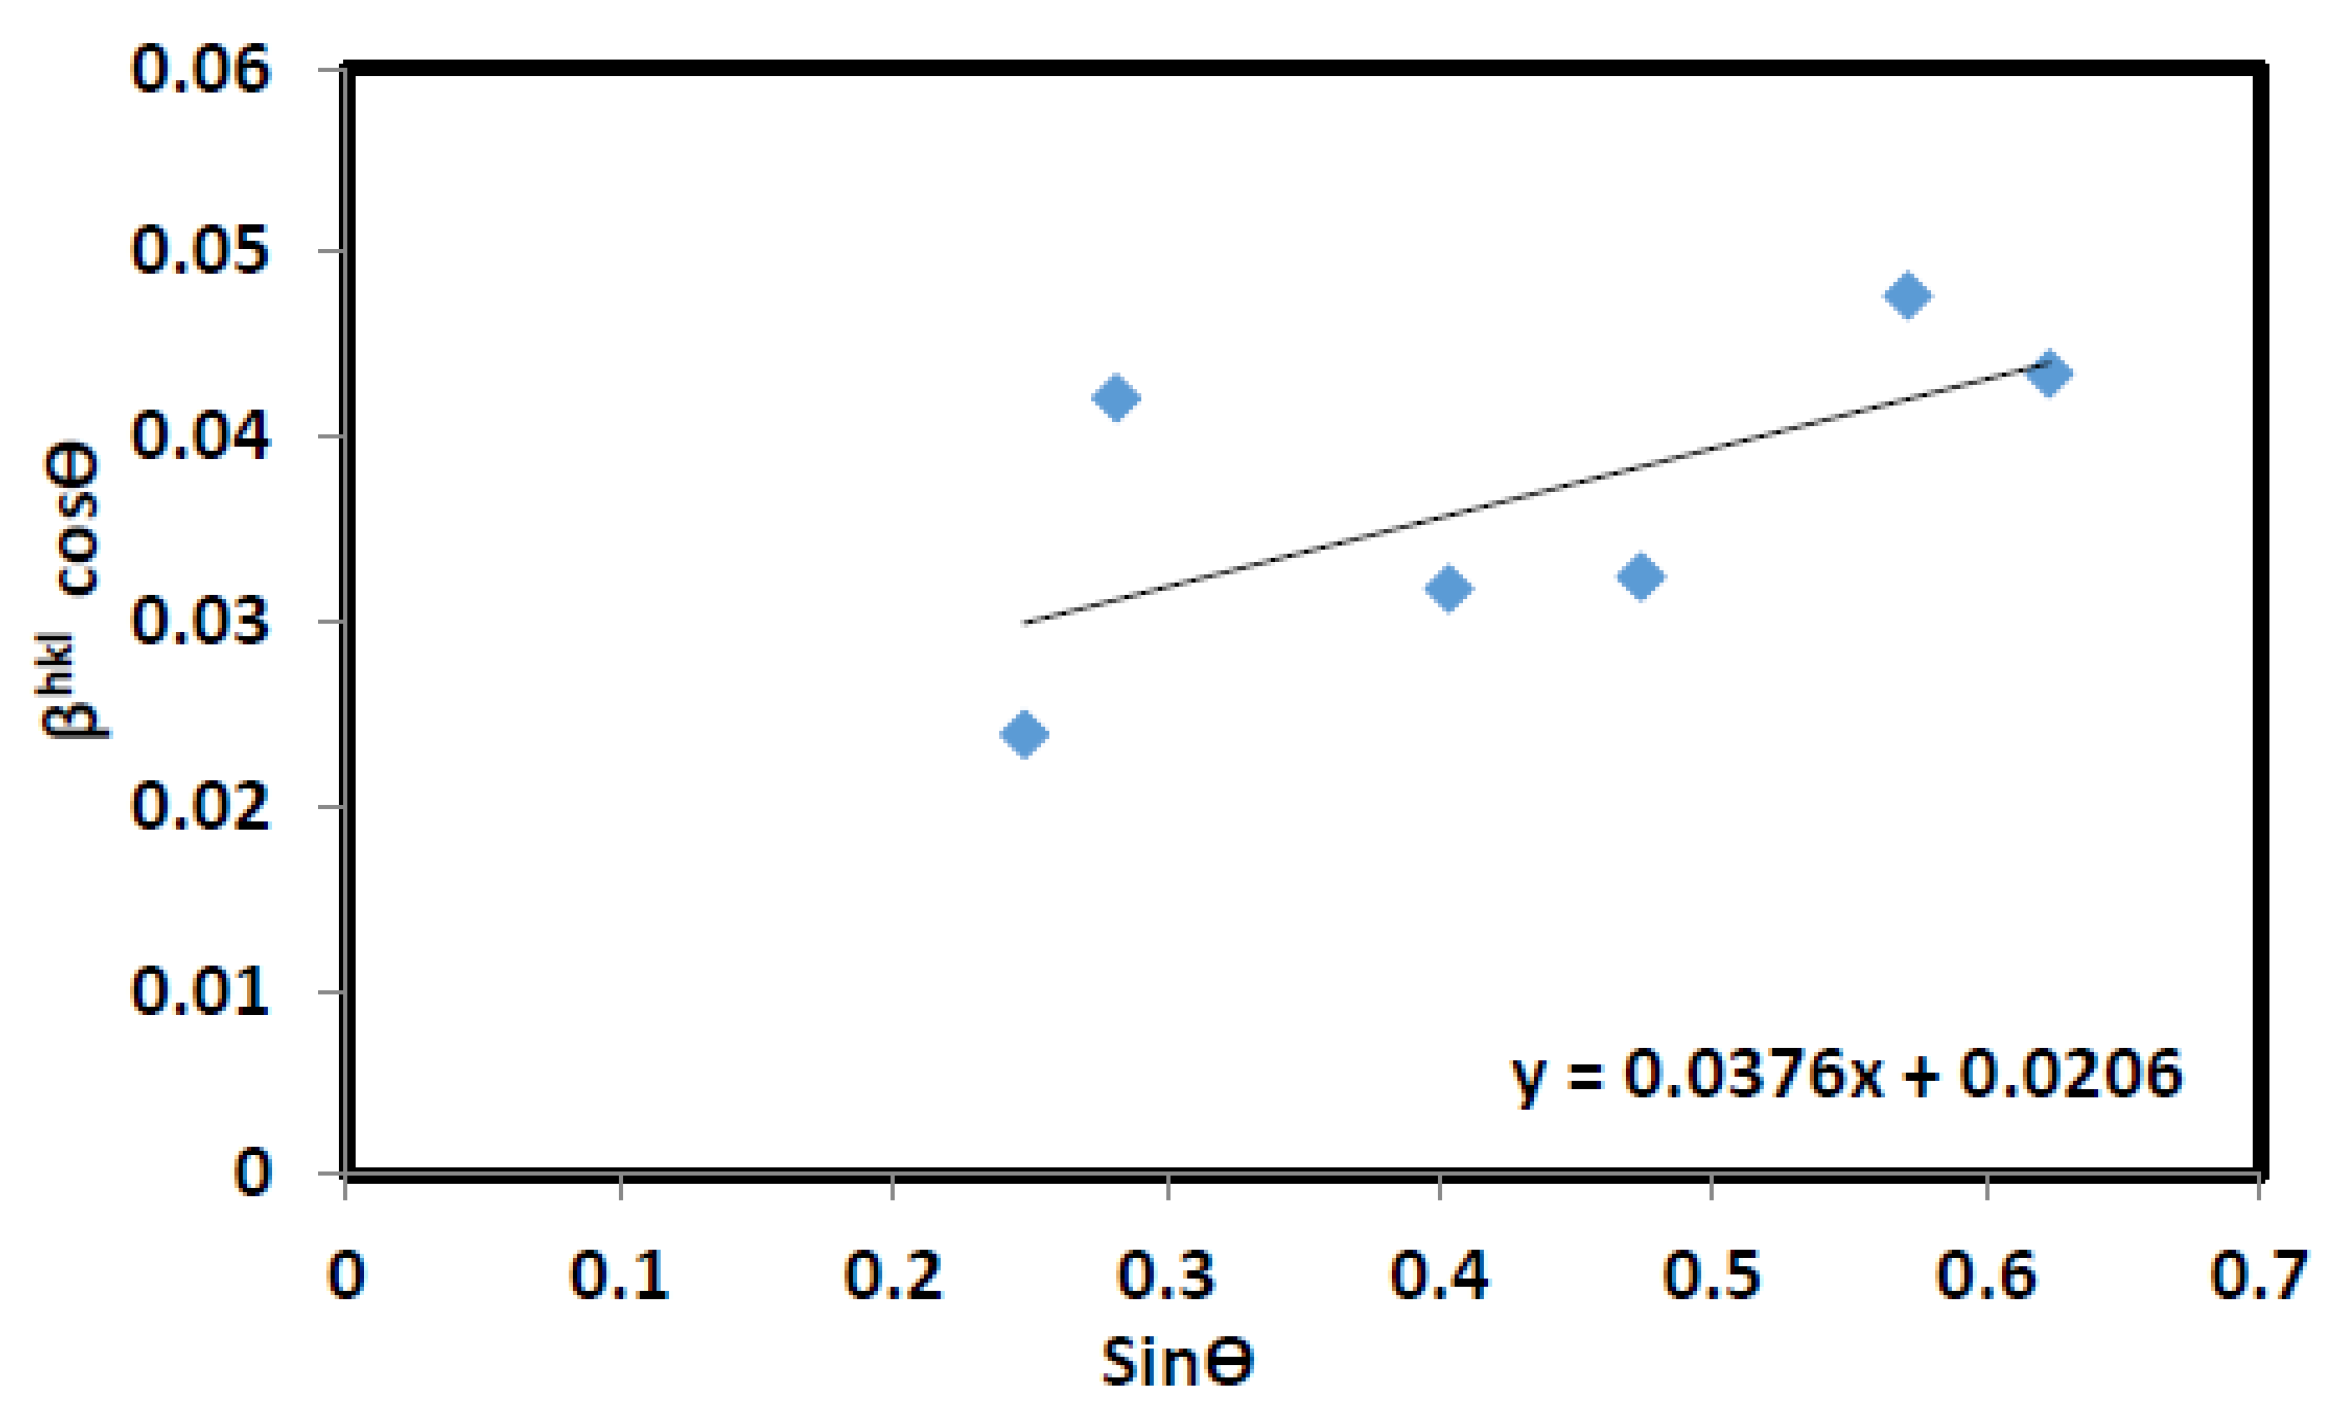
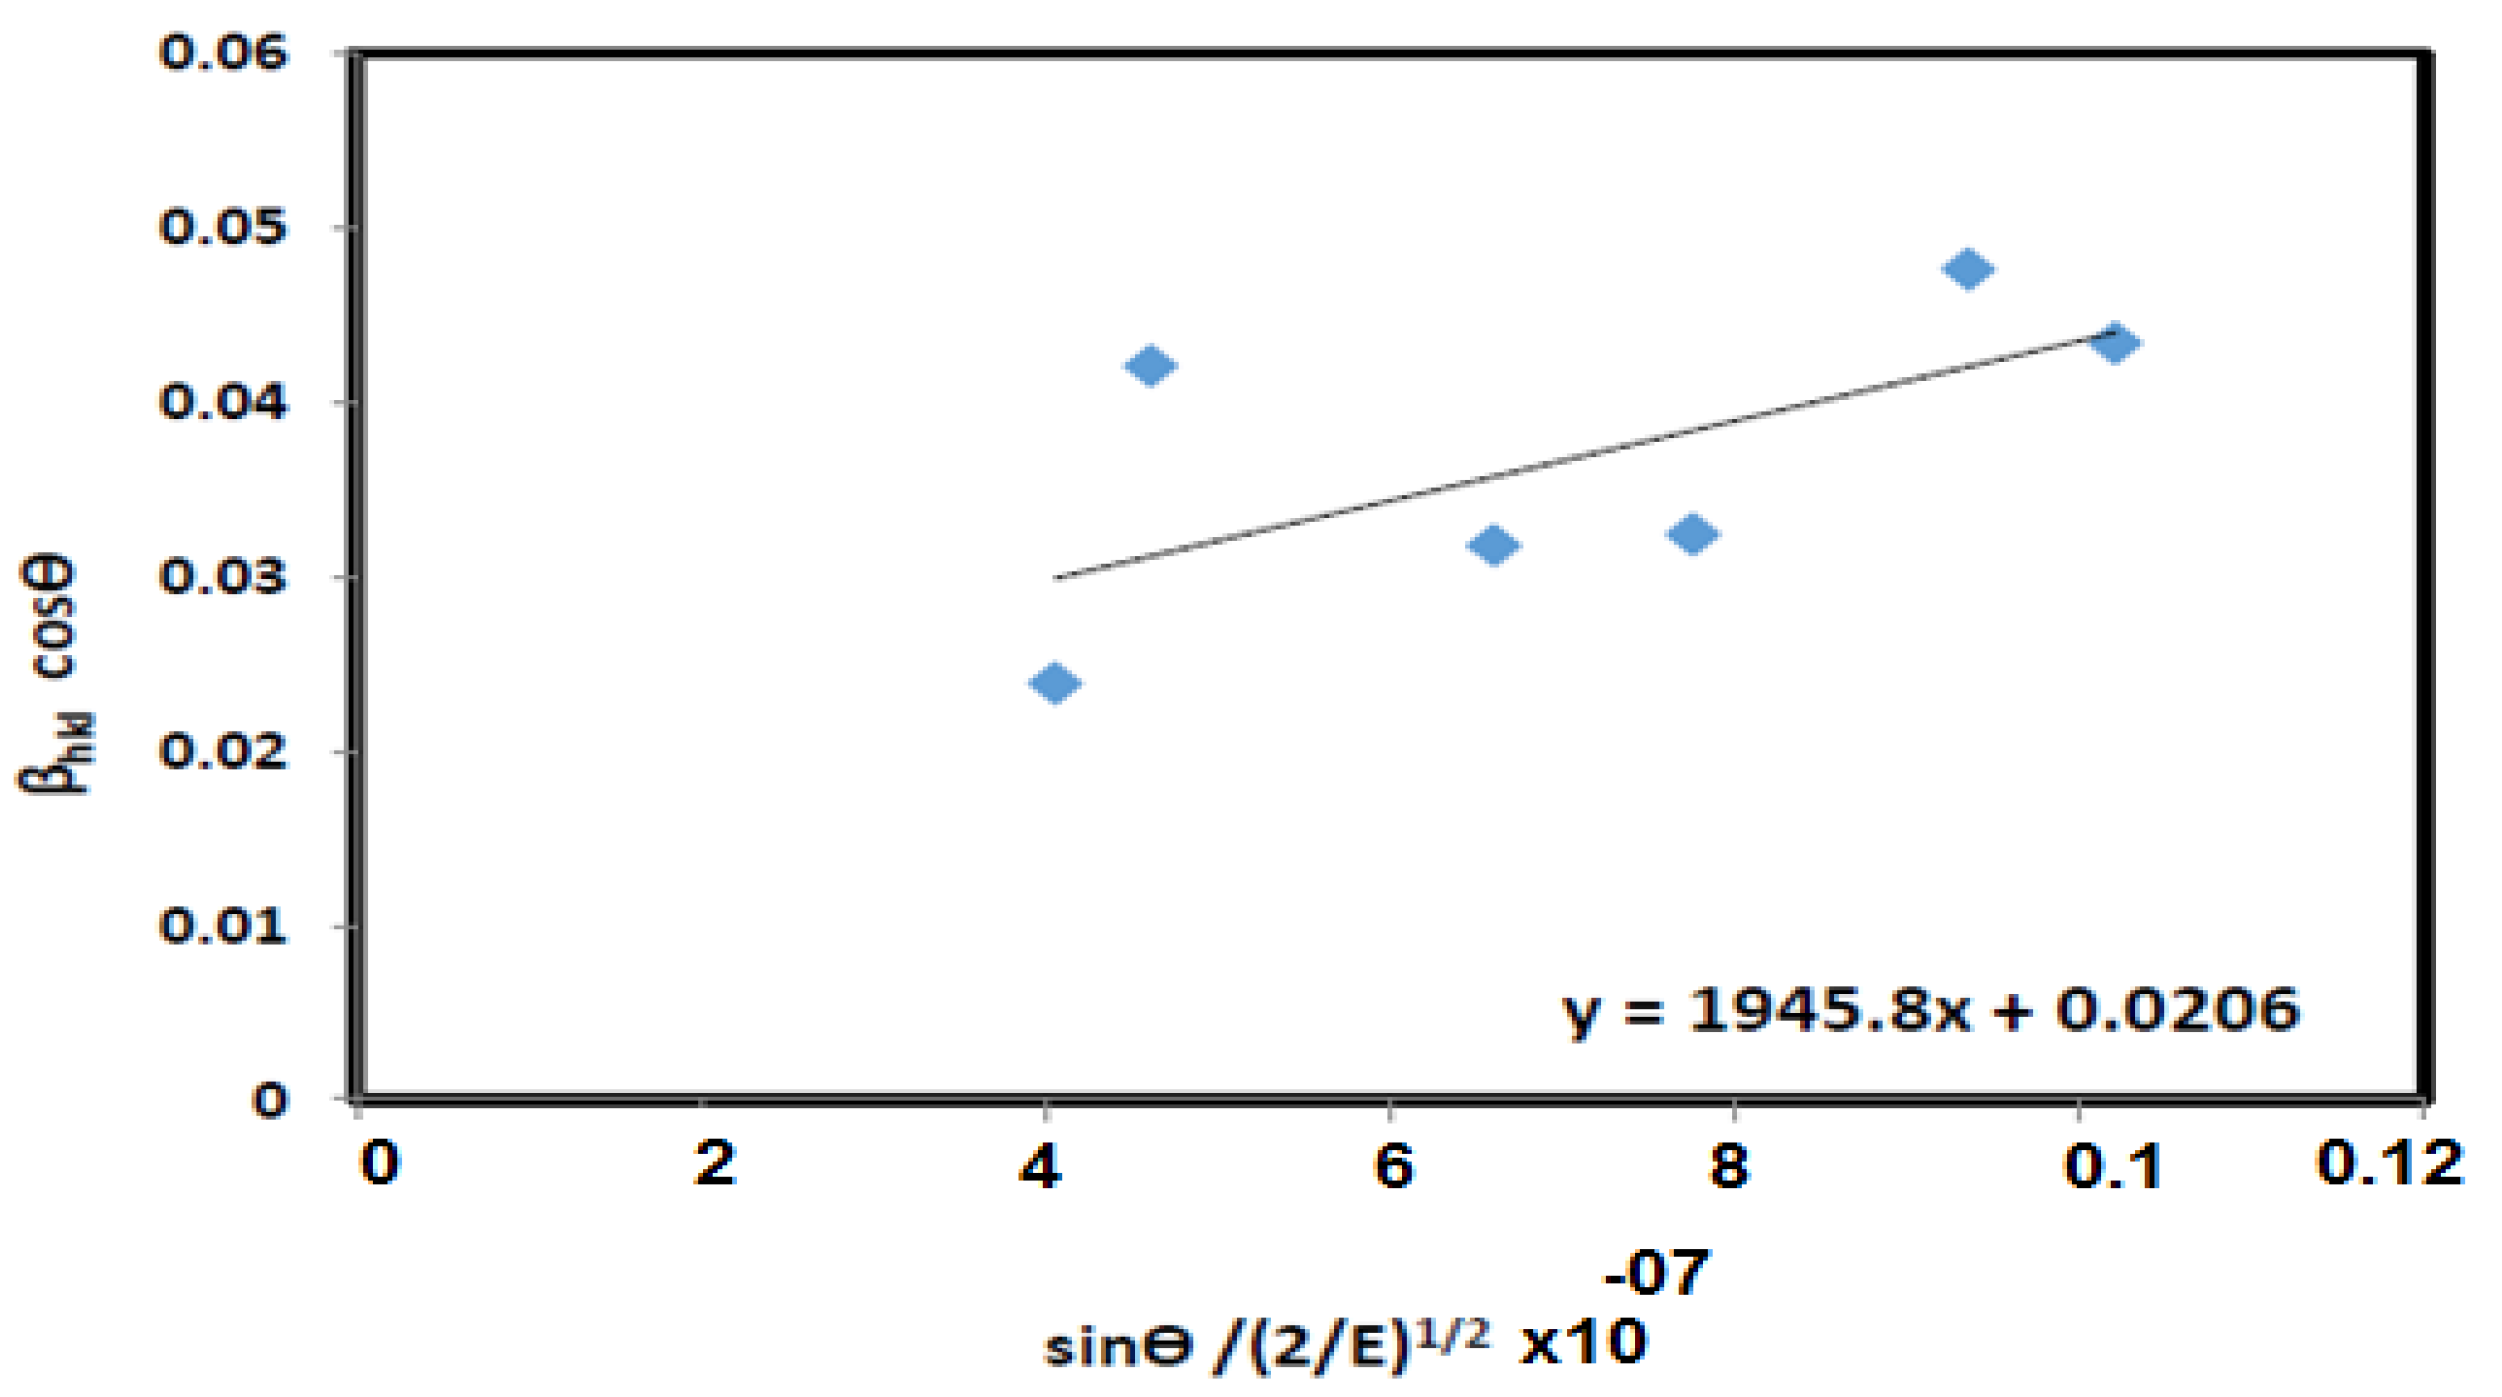
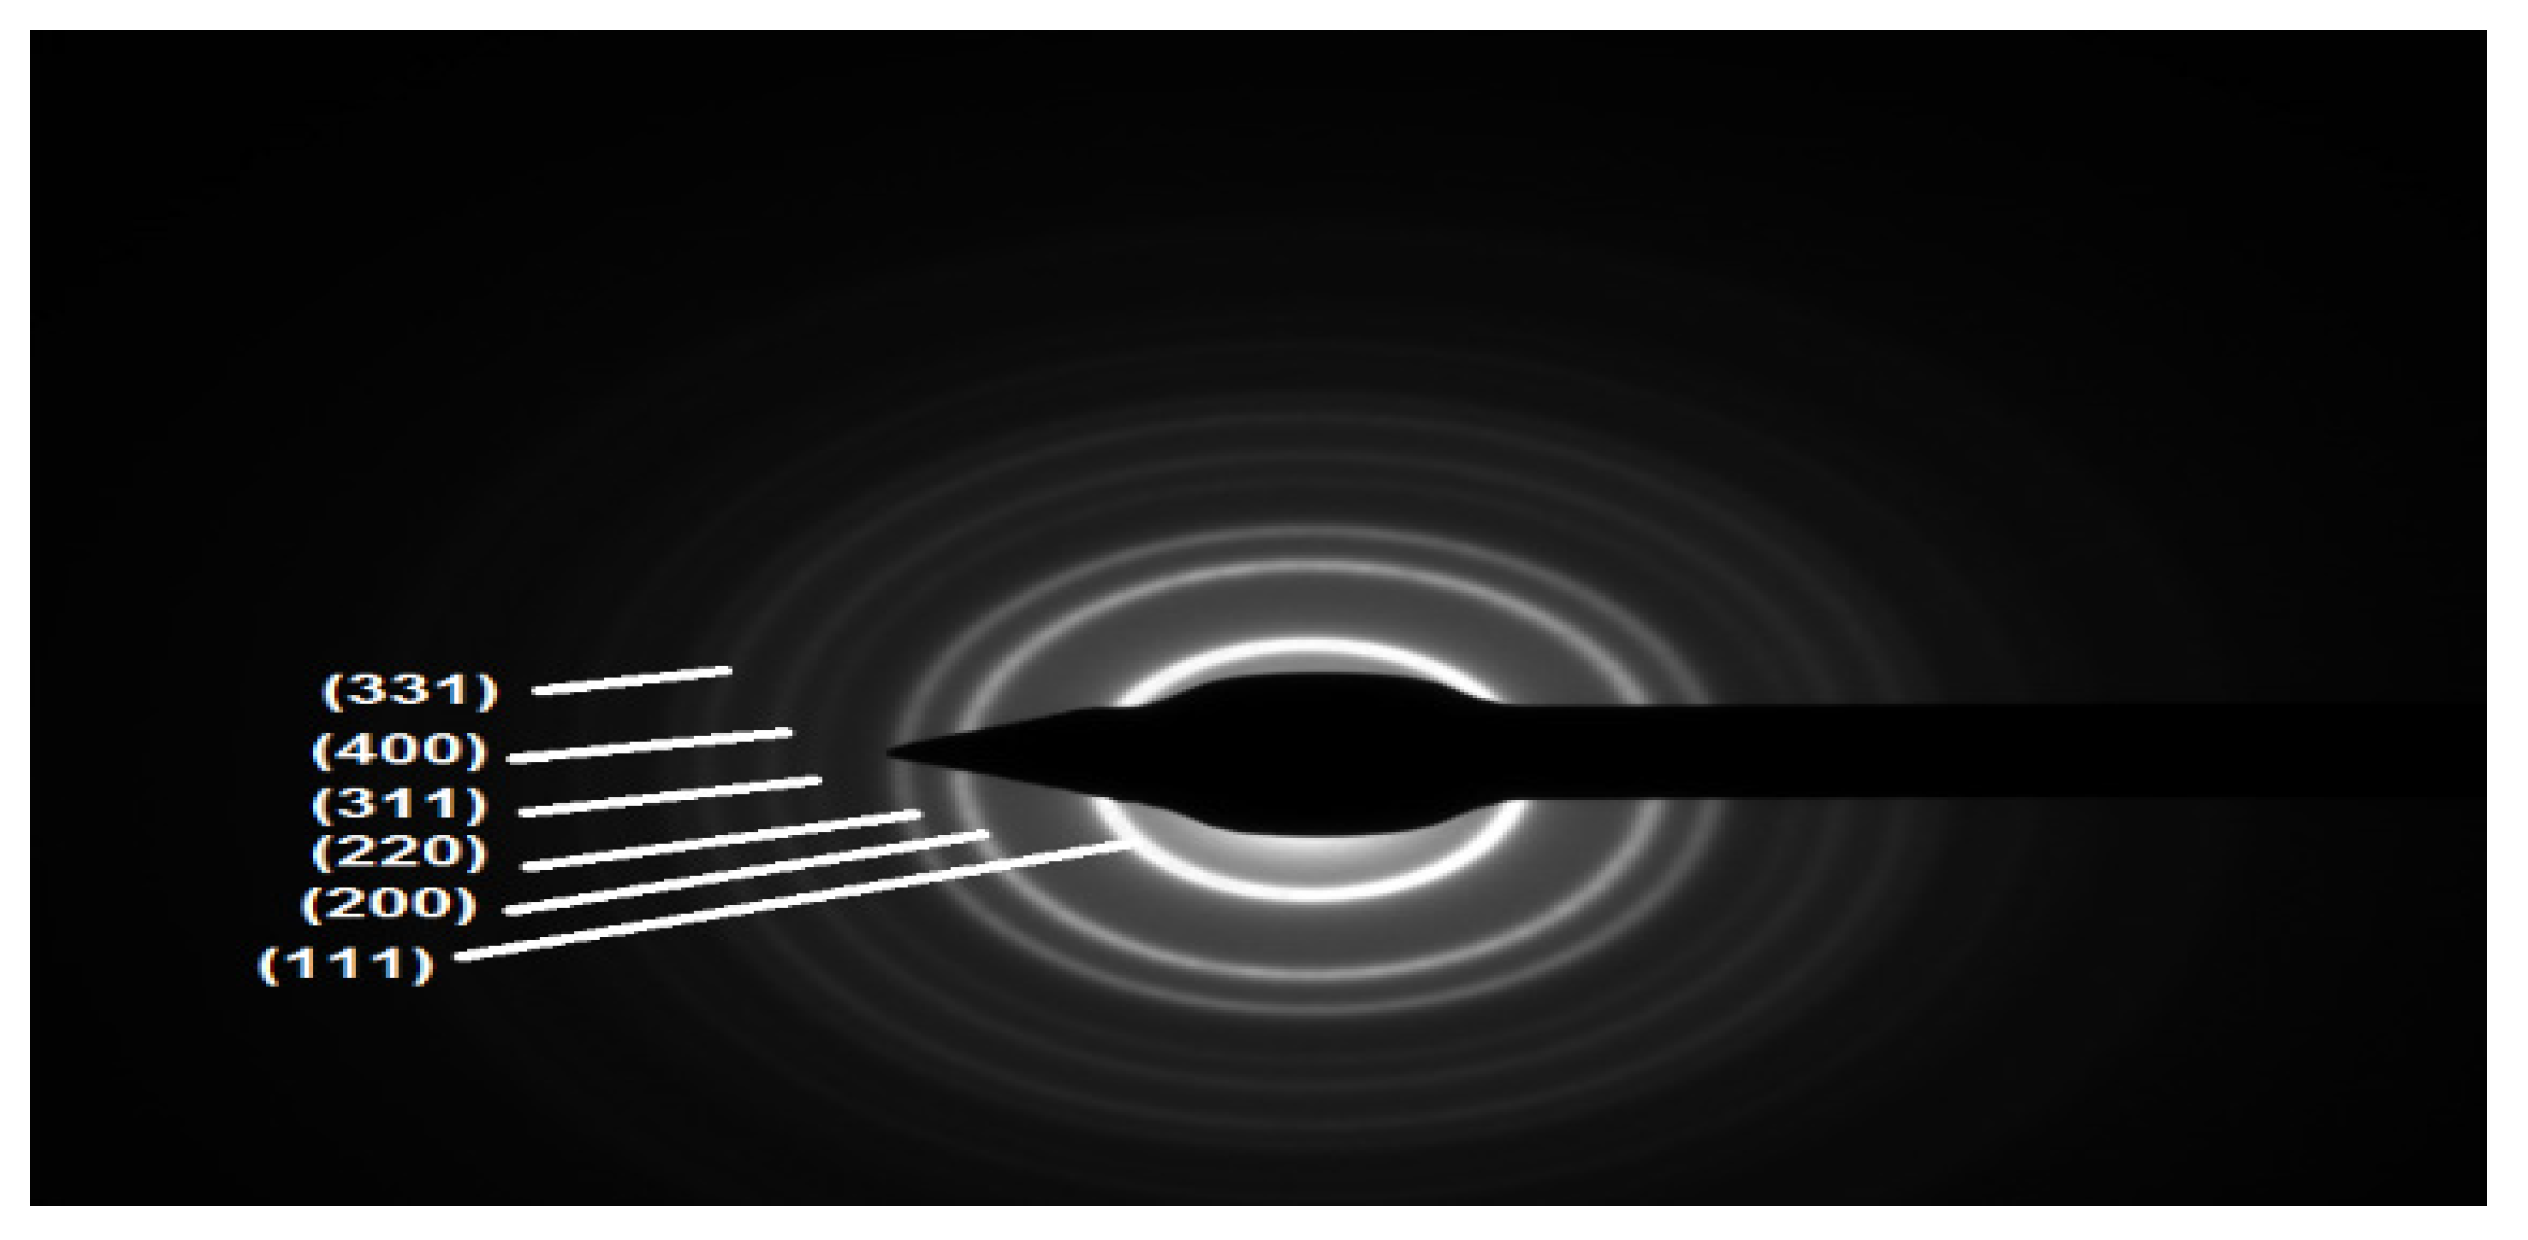
3.1. Structural Analysis

The XRD patterns of the ZnS particles indicate the most indexed peaks at (111), (200), (220), (311), (400), and (331) are shown in Figure 1. It is clear that the pattern represents a polycrystalline material. One can also observe that the peaks are significantly broad. Such results confirm that the particles belong to nano-sized crystals according to the (ICDD) reference card No. 04-004-3804 the pronounced peaks correspond to the cubic crystal system [5]. The spacing between the planes of the crystal is d and the lattice parameters a, b, and c for the cross ponding Miller indices (hkl) were calculated according to the following Equation (2) [6], which produced a result of 5.404 Å and a corresponding value of 5.392 Å.
1 d 2 = h 2 a 2 + k 2 b 2 + l 2 c 2
Two methods were used to investigate the crystalline size of the nanoparticles: the Scherrer method and the Williamson–Hall Method (W–H). The average crystalline size of the ZnS nanoparticles was calculated to be about 6.3 using Debye–Scherrer’s formula D = 0.9λ/βcosθ [7,8], Where D is the crystallite size, λ is the wavelength of the X-rays, β is the full-width at half-maxima (FWHM) in radians, and θ is the diffraction angle as shown in Figure 2. The dislocation density was calculated using δ = 1/D2 [9].
The W–H [10] method relies on the principle that the approximate formulas for size broadening (β) and strain broadening (βε) vary quite significantly with respect to the Bragg angle, θ [11]. The strain induced broadening arising from crystal imperfections and distortion can be calculated as in Equation (3). Either the maximum tensile strain alone or the maximum compressive strain alone can be calculated from the observed broadening. If both crystallite size and strain contributions present independently of each other, then their combined effects can be determined by convolution. The W–H method can be simplifed by assuming that the convolution is a sum of β and βc using the form of [8].
Bhkl = B + Bε
B hkl = k λ D   cos θ + 4   ε   tan   θ
By rearranging the above equation, we obtain the following:
B hkl cos θ = k λ D   + 4   ε   tan   θ
Equation (5) represents the uniform deformation model (UDM), according to which the strain is assumed to be uniform in all crystallographic directions. The plot in Figure 3 shows that βhklcosθ against sinθ would give a crystallite size that corresponds to the y-intercept and strain due to lattice deformation in the sample that can be calculated from the slope of the graph. The graph indicates that the ZnS exhibits a positive gradient, which represents the positive strain in the sample.
The uniform deformation strain model (UDSM) and the uniform deformation energy density model (UDEDM) were used where the anisotropic nature of Young’s modulus, was inappropriate and the E of the ZnS was more realistic. A generalized Hooke’s law refers to the linear proportionality between the stress and strain as given by σ = Ehkl ε, where σ is the stress in the surface and Ehkl is the Young’s modulus in the direction perpendicular to the set of crystal lattice planes (hkl). The (W–H) Equation (5) was then modified by substituting the value of ε [7], and obtained Equation (6):
B hkl cos θ = k λ D   + 4   σ sin θ E h k l
The modulus of elasticity is perpendicular to the crystal lattice planes (hkl). The Young’s value modulus for pure ZnS is 74.5 GPa. [12]. The stress (σ) and crystallite size (D) were calculated using the linear equation shown in Figure 4 to represent the model (UDSM). In principle, materials are not always homogenous and isotropic. Agglomerates, defects, dislocations, etc., result in imperfections in materials. These facts suggest the need for another model, one in which the constants of proportionality associated with the strain-stress relation are no longer independent. We consedered The strain energy density (μ). According to Hooke’s law, the energy density (μ) that is to say the following relation [13] gives energy per unit volume as a function of stain (ε):
μ = ε2 Ehkl/2
The uniform deformation energy density model (UDEDM) can thus be used to estimate the crystallite size (D), strain (ε) and energy density (μ). In this model, the Williamson–Hall equation is written as follow:
β h k l cos θ = k λ D   + 4 sin θ 2 μ 2 E h k l
From the linear function shows in Figure 5, the lattice strain (ε) can be calculated if the Young’s modulus value of the nanoparticles is known (it is taken as 74.5 GPa for ZnS) [13]. A summary of these parameters (crystallite size, strain, stress and energy densities) calculated using the UDM, the UDSM, and the UDEDM is presented in Table 1.
The UDEDM, UDM, and UDSM confirmed a good agreement with the TEM analysis of the average crystallite size obtained with the results, so these models are acceptable in the present case. Inaddition the crystallite values presented by the three models are in good agreement with those obtained from Scherrer’s formula and from TEM.

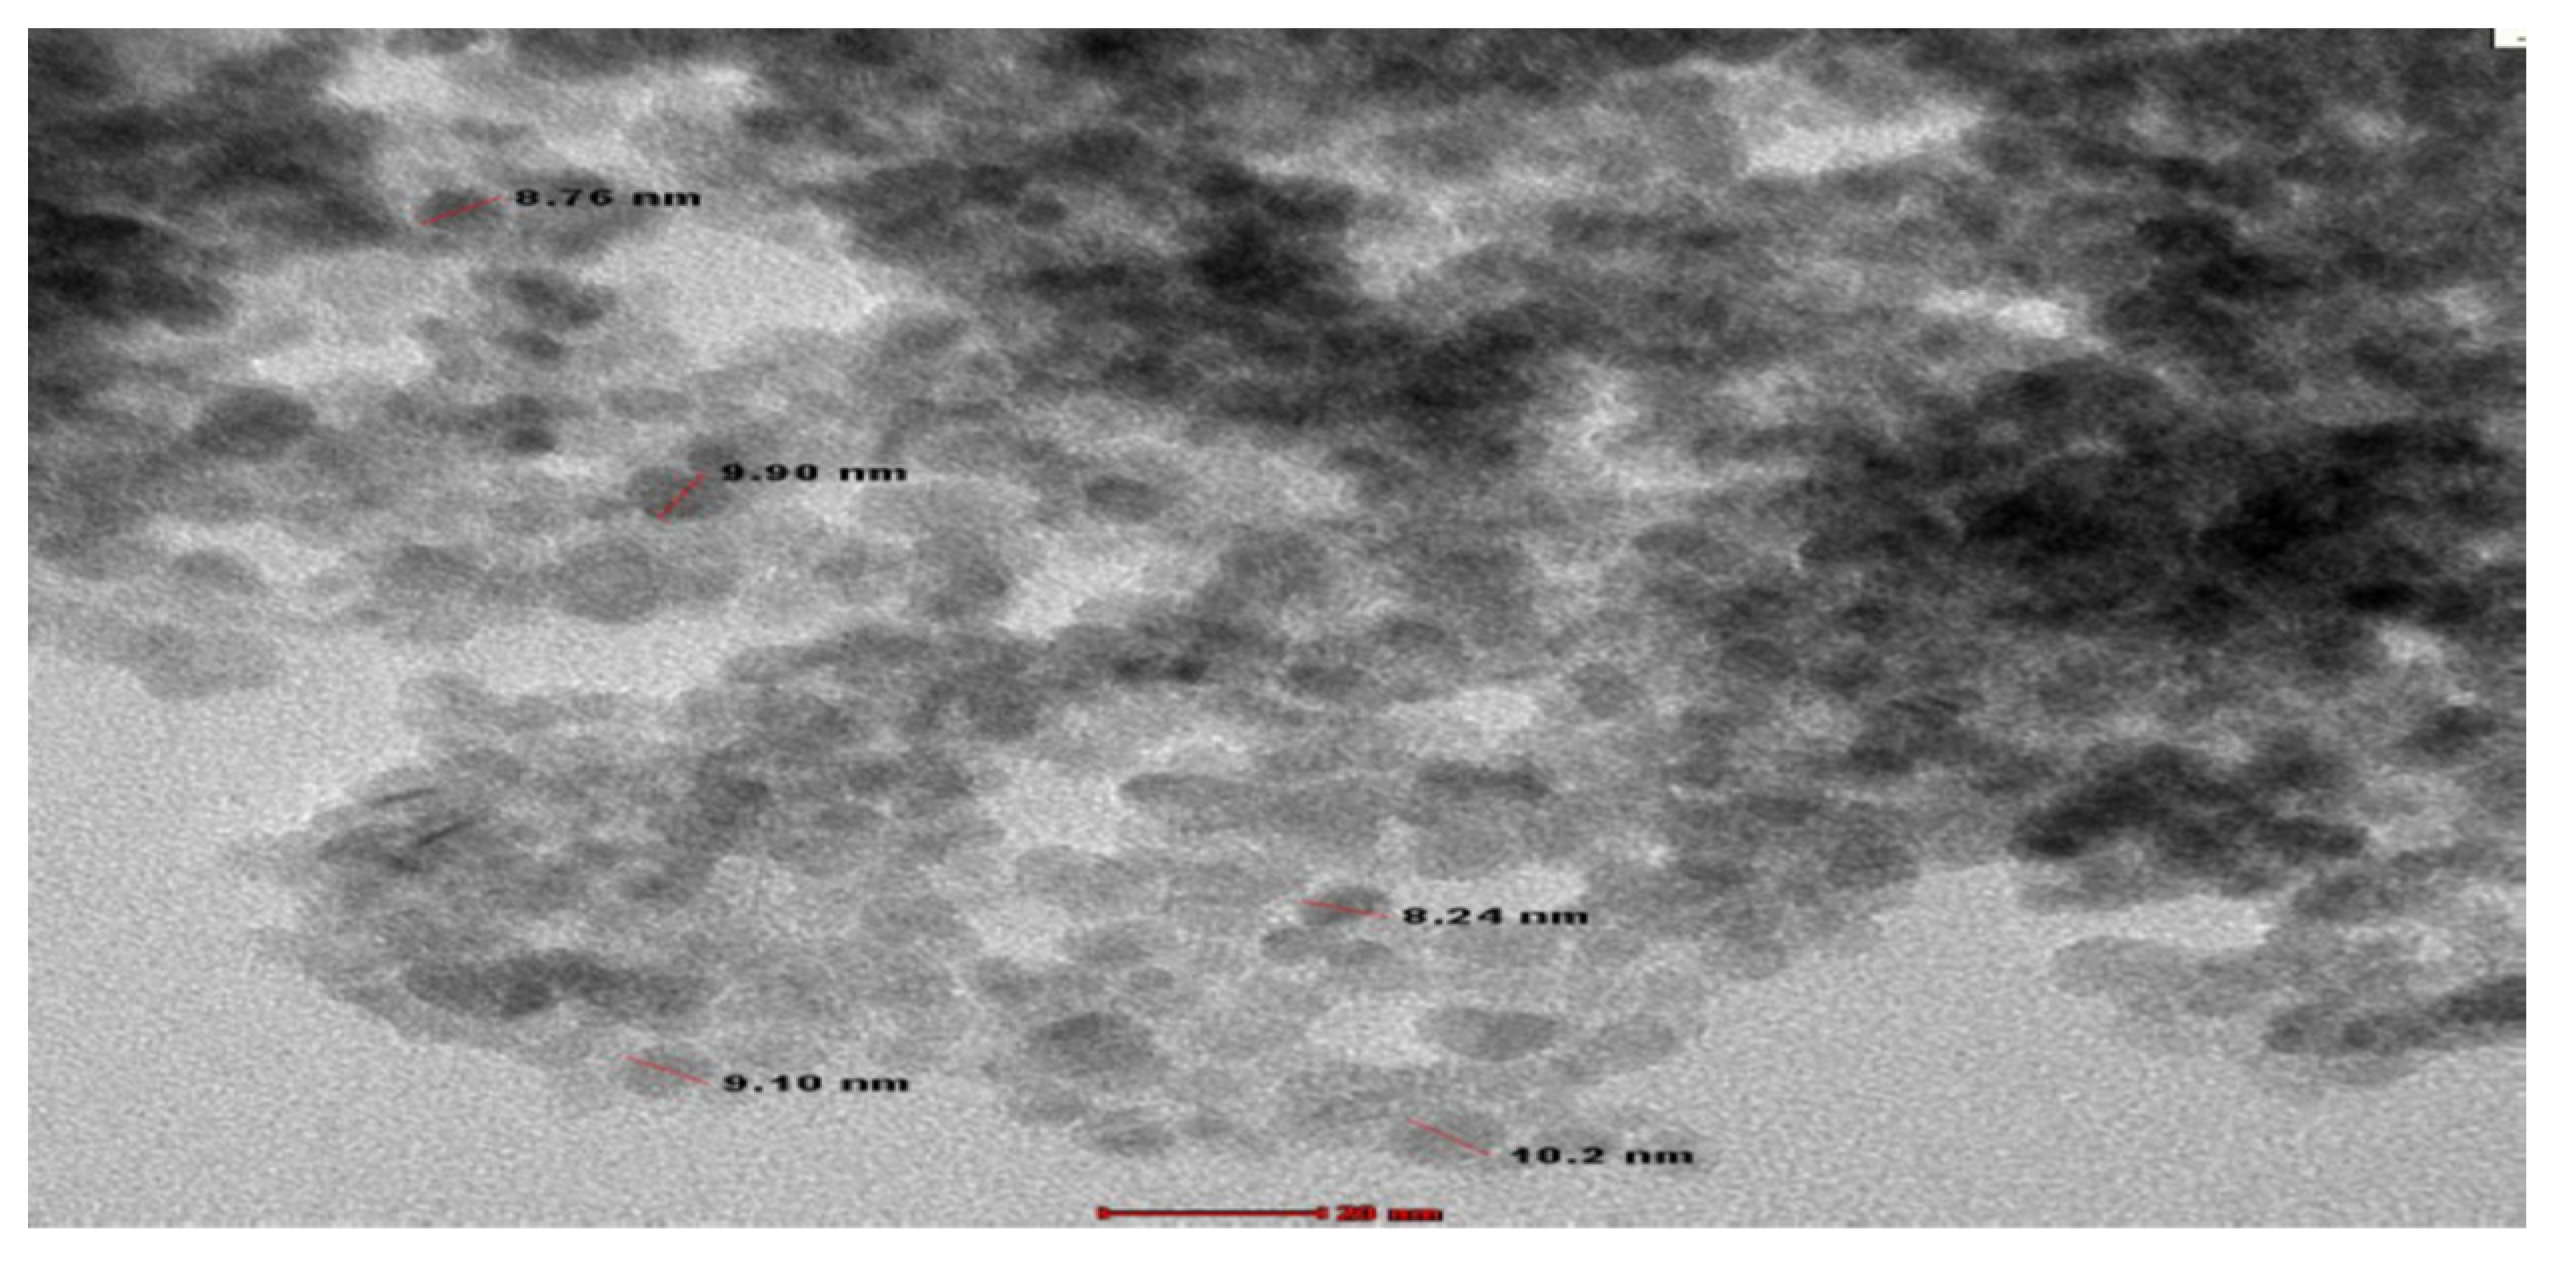
3.2. Transmission Electron Microscopy Measurements

The typical morphology of the obtained ZnS nanoparticles was necessary in order to know their exact size and structure by using direct TEM measurement. Figure 6 is a TEM image that shows the presence of a large number of nearly spherical ZnS nanoparticles with distinct grain boundaries. The particle size range was found to be 8–10 nm, which is nearly consistent with the particle sizes obtained from XRD observations. Therefore, the diameter and the size distribution of the nanoparticles are difficult to determine simply by viewing TEM images [11,12].
Figure 7 shows the selected area electron diffraction (SAED) pattern of the ZnS nanoparticles. The SAED pattern shows a set of rings which relate to diffraction from different planes of the ZnS nanocrystallites. The pattern shows many rings, and among these the strongest six rings correspond to the (111), (200), (220), (311), (400), and (311) planes of the cubic phase of the ZnS. This result is consistent with the XRD analysis. It was observed that the particles were well separated and of a spherical shape, as it shown by the magnified view of the nanocrystals.

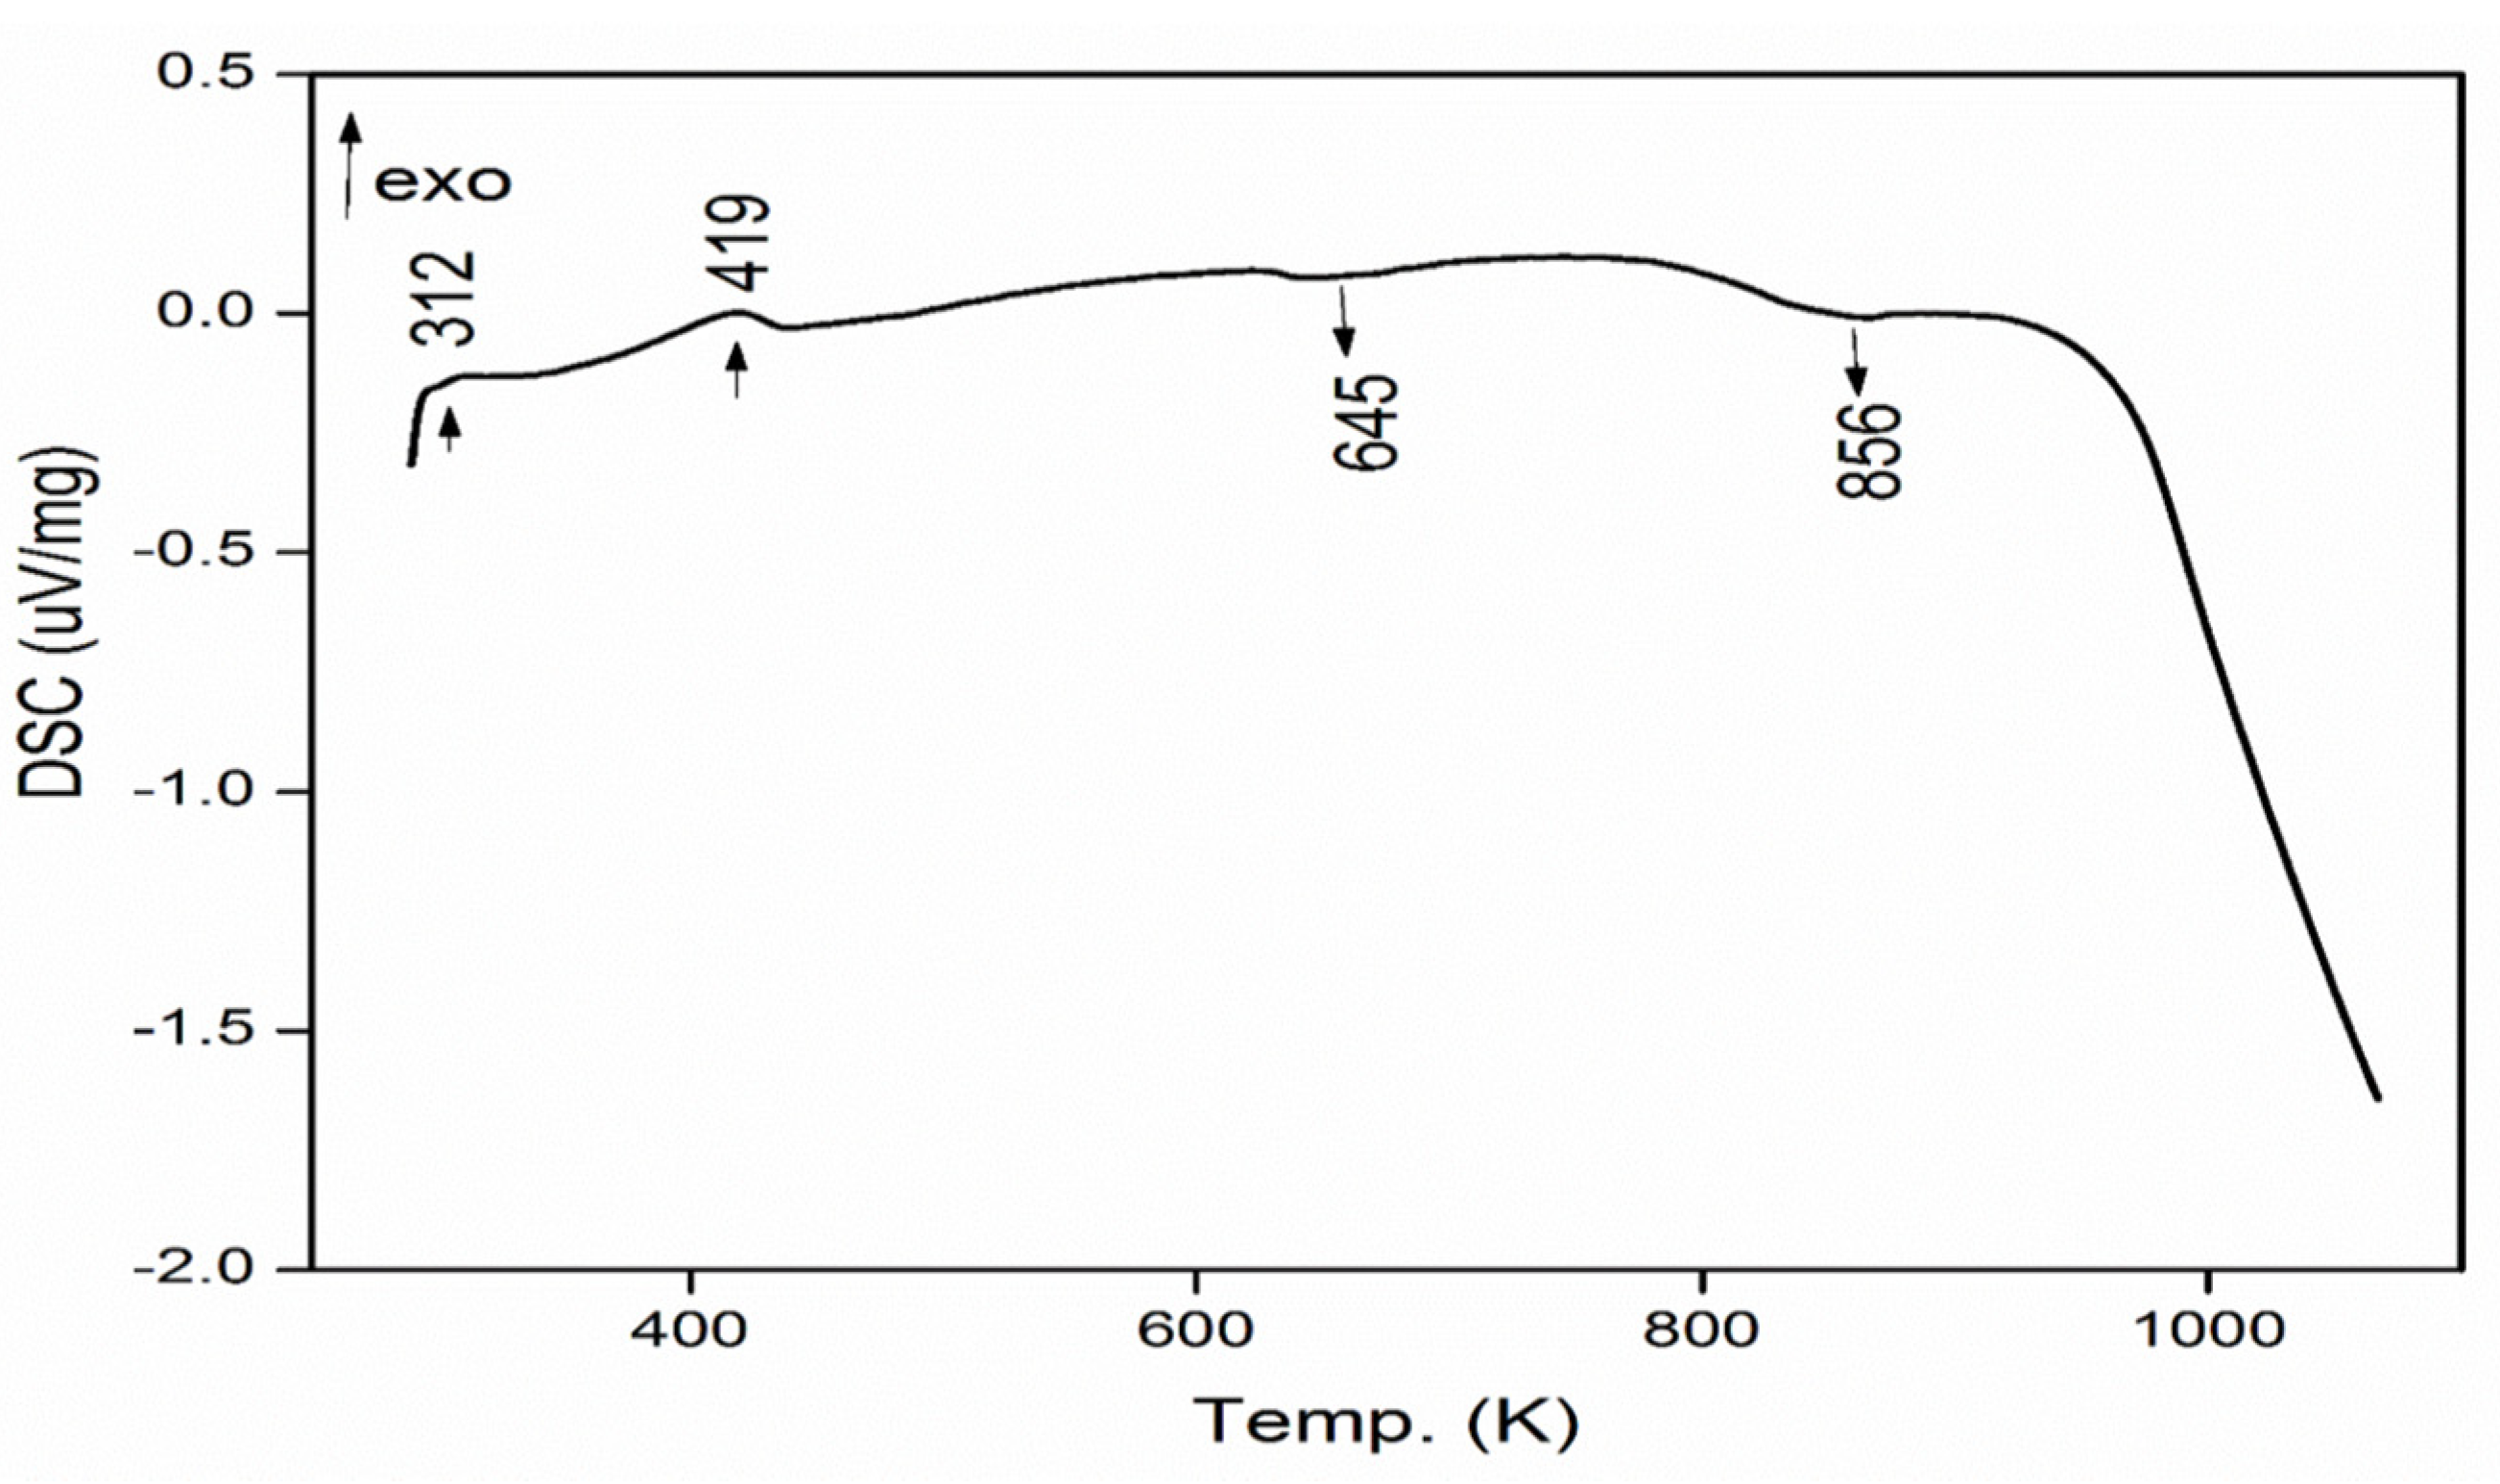
3.3. Thermal Analysis Measurement

Figure 8 represents a combined TG and DTG plot produced to explore the stability and the transitions which might occur. The TG curve of ZnS nanoparticles was obtained at a heating rate of 283 K min−1 under a nitrogen atmosphere from room temperature up to 1100 K due to the strong water absorption of ZnS at 313 K.
There are three obvious weight loss regions. The first weight loss was 5%, and it can observed around 393 K [14] due to some water molecules present in the samples. The second stage of weight loss started at 639 K, during which the ZnS was converted into ZnSO3 with a weight loss of 2.2%, representing the evaporation and degradation of the sulfuric acid group [15]. Further mass loss was also observed at 1029 K, at which point the ZnSO3 was converted into ZnO with a 2% weight loss. Therefore, the total weight loss of the ZnS was 9.2% from 323 K to 1093 K. It can be concluded that ZnS particles have good thermal stability.
Differential scanning calorimetry (DSC) measures endothermic and exothermic processes in materials as a function of temperature and heat flow. The first exothermic peak was observed at 419 K [16] (Figure 9). This peak was attributed to the evaporation of water molecules. The second strong endothermic peak was observed at 654 K, probably corresponding to the lattice deformation of the ZnS, but above 873 K in DSC curve, there was a smooth downward trend with significant weight loss. This may be due to the residual sulfur ions released from the sample.

3.4. Infrared Absorption Spectra of the ZnS Nanoparticles

The infrared absorption spectra (FTIR) of the ZnS were recorded in the range of (400–4000) cm as is shown in Figure 10. Spectrum analysis of the ZnS shows that despite the successive washes with absolute ethanol, traces of solvent still exist. This is confirmed by the presence of a broad and intense band at around 3340 cm−1 which is attributed to to the vibrations of the valence of the O-H mode in the H2O molecules. This peak may be due to water present in the sample. The small and weak peak observed at 2338 cm−1 may be due to the formation of S-H bonds (H2S). The presence of a band around 1613 cm−1 [17] may correspond to the O–H bending of water molecules [18] and the absorption at 1122 cm−1 is attributed to SO4−. The weak additional bands observed at 1002 cm−1 and 924 cm−1 [19] indicate the presence of resonance interaction between the vibrational modes of the sulfide ions in the crystal [19]. The vibration of the ZnS bond is confirmed by the presence of medium and strong bands located around 1122 cm−1 and 654 cm−1 [20,21], and the small and weak band at 465 cm−1 is attributed to the metal sulfur bond.

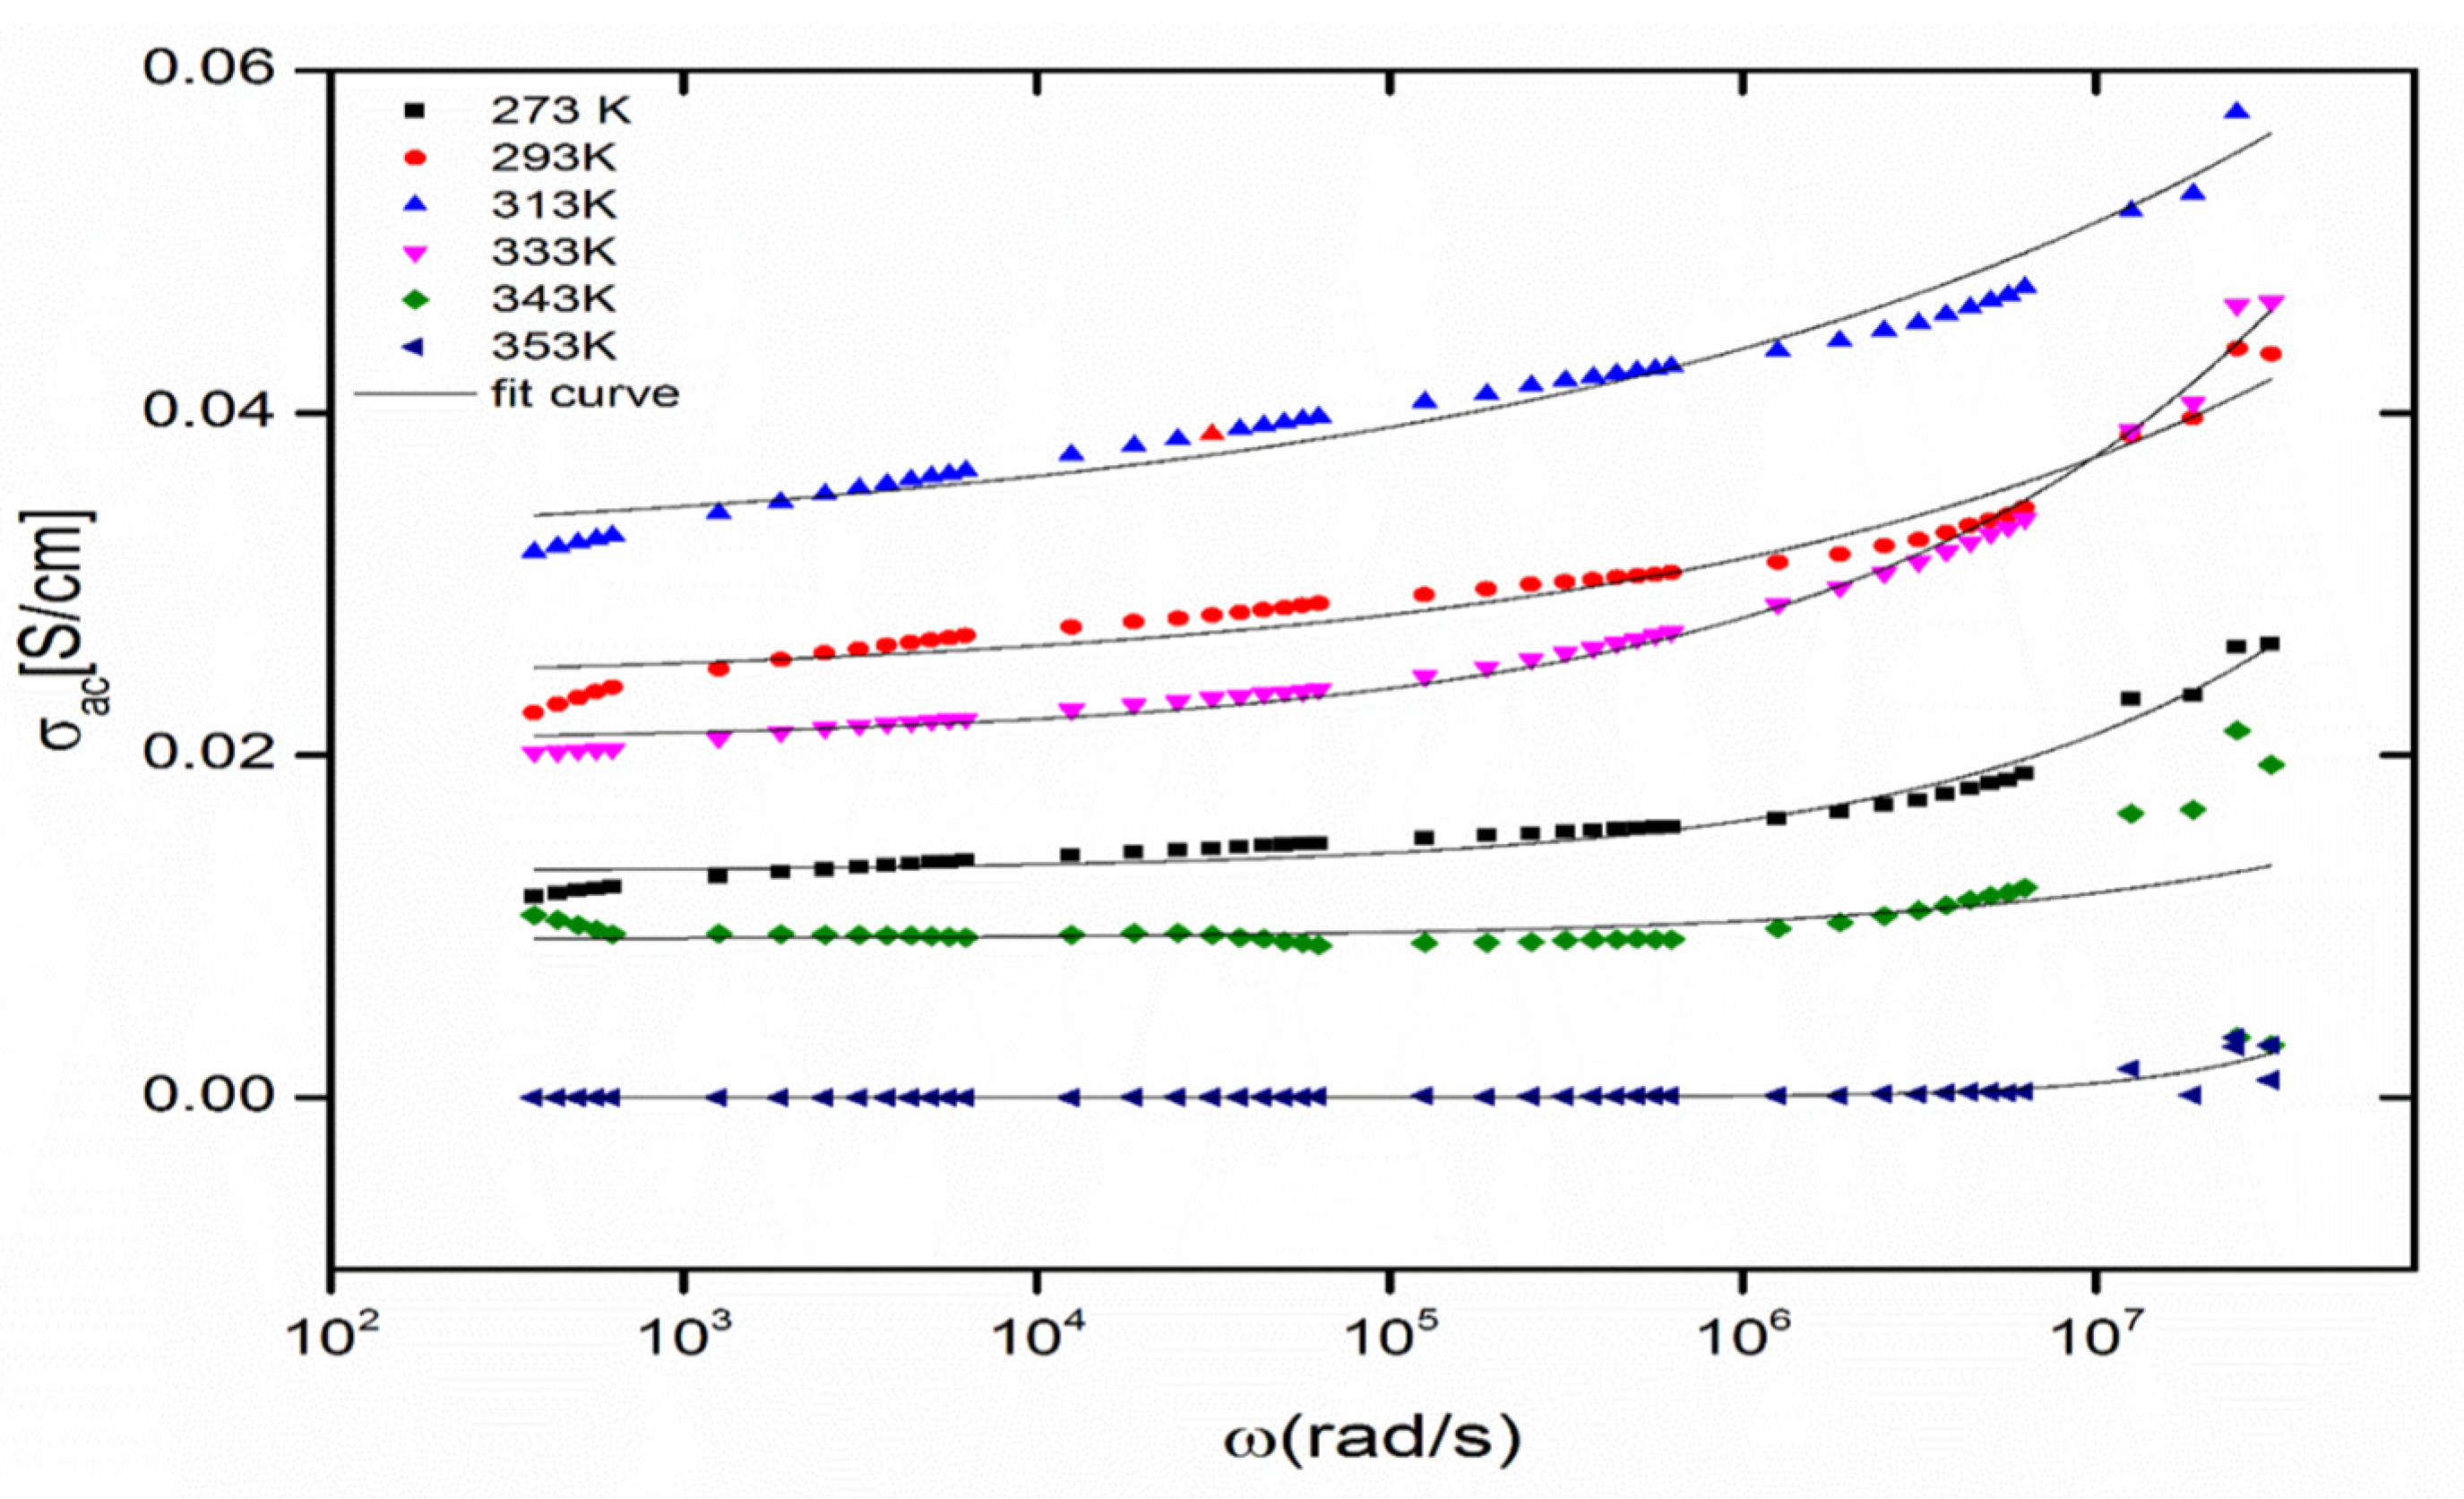
3.5. A.C conductivity of the ZnS nanocrystal:

The frequency dependence of the A.C conductivity in the ZnS nanoparticles at different temperatures (293–373 K) is shown in Figure 11. The range of low frequency conductivity increases with temperature, while the temperature is independent in the high-frequency region. In addition, the conductivity is found to be less frequency dependence in the low-frequency regime.
Figure 12 shows the variation in σac (ω) versus 1000/T for studied the composition at different frequency values. It is evident that A.C conductivity decreases nonlinearly with the temperature, which suggests that σac (ω) is a thermally activated process with single activation energy from various localized states in the band gap. The A.C conduction of activation energy was calculated at different frequencies using the Arrhenius temperature dependence of σac (ω) [22]. The activation energy ΔEac decreases with the frequency, which may be attributed to the increasing field frequency which is responsible for the electronic jump between localized states [22]. The activation energy values with the corresponding frequencies are shown in the table below (Table 2).

4. Conclusions

ZnS nanoparticles were synthesized using a low-cost, easy, high-yield precipitation method. Different techniques (XRD and FTIR) were used to achieve the formation of the ZnS particles, and XRD and TEM were used to investigate the size of the nanocrystal particles, which were consistent. The sensitized ZnS nanoparticles exhibited a good thermal stability. The W–H deformation models (UDM, UDSM, and UDEDM) were very helpful in determining the approximate strain, stress and energy density, and hence these models are highly preferable when defining the degree of crystal perfection. The temperature and A.C conductivity frequency dependence σac (ω) was studied in the frequency range 50 Hz–5×10⁶ Hz and temperature range 293–373 K.

Author Contributions

Conceptualization, A.H.A.; methodology, A.H.A.; software, A.H.A.; validation, A.H.A.; formal analysis, A.H.A.; investigation, A.H.A.; resources, A.E.; data curation, A.H.A.; writing—original draft preparation, A.H.A.; writing—review and editing, A.H.A.; visualization, A.H.A.; supervision, H.A.-e.H.; and A.E.; project administration, A.H.A. and A.E. All authors have read and agreed to the published version of the manuscript.

Funding

No fund received for this study.

Institutional Review Board Statement

Not applicable.

Informed Consent Statement

Not applicable.

Data Availability Statement

Not applicable.

Conflicts of Interest

The authors declare no conflict of interest.

References

  1. Soltani, N.; Saion, E.; Hussein, M.Z.; Erfani, M.; Abedini, A.; Bahmanrokh, G.; Navasery, M.; Vaziri, P. Visible Light-Induced Degradation of Methylene Blue in the Presence of Photocatalytic ZnS and CdS Nanoparticles. Int. J. Mol. Sci. 2012, 13, 12242–12258. [Google Scholar] [CrossRef] [PubMed]
  2. Al-Rasoul, K.T.; Ibrahim, I.M.; Ali, I.M.; Al-Haddad, R.M. Synthesis, structure and characterization of ZnS QDs and using it in photocatalytic reaction. Int. J. Sci. Technol. Res. 2014, 3, 213–217. [Google Scholar]
  3. Hoa, T.T.Q.; Vu, L.V.; Canh, T.D.; Long, N.N. Preparation of ZnS nanoparticles by hydrothermal method. J. Phys. Conf. Ser. 2009, 187, 1–6. [Google Scholar] [CrossRef]
  4. Liveri, V.T.; Rossi, M.; D’Arrigo, G.; Manno, D.; Micocci, G.A. Synthesis and characterization of ZnS nanoparticles in water/AOT/n-heptane microemulsions. Appl. Phys. 1999, 69, 369–373. [Google Scholar] [CrossRef]
  5. Soltani, N.; Dehzangi, A.; Kharazmi, A.; Saion, E.; Yunus, W.M.M.; Majlis, B.Y.; Zare, M.R.; Gharibshahi, E.; Khalilzadeh, N. Structural optical and electrical properties of zns nanoparticles affecting by organic coating. Chalcogenide Lett. 2014, 11, 79–90. [Google Scholar]
  6. Simbrunner, J.; Simbrunner, C.; Schrode, B.; Röthel, C.; Martinez, N.B.; Salzmann, I.; Resel, R. Indexing of grazing-incidence X-ray diffraction patterns: The case of fibre-textured thin films. Acta Cryst. 2018, A74, 373–387. [Google Scholar] [CrossRef]
  7. Date, E.H.F.; Andrews, K.W. Anisotropic and composition effects in the elastic properties of polycrystalline metals. J. Phys. D Appl. Phys. 1969, 2, 13–21. [Google Scholar] [CrossRef] [Green Version]
  8. Rogers, K.; Daniels, P. An X-ray diffraction study of the effects of heat treatment on bone mineral microstructure. Biomaterials 2002, 23, 2577–2585. [Google Scholar] [CrossRef] [PubMed]
  9. Chandrasekar, L.B.; Chandramohan, R.; Vijayalakshmi, R.; Chandrasekaran, S. Preparation and characterization of Mn-doped ZnS nanoparticles. Nano Letters. 2015, 5, 71–75. [Google Scholar] [CrossRef] [Green Version]
  10. Thandavan, T.M.K.; Gani, S.M.A.; Wong, C.S.; Nor, R.M. Evaluation of Williamson–Hall Strain and Stress Distribution in ZnO Nanowires Prepared Using Aliphatic Alcohol. J. Nondestruct. Eval. 2015, 34, 4–14. [Google Scholar] [CrossRef]
  11. Mochahari, K.; Sarma, K.C. Study of structural and optical properties of chemically synthesized nano structured cadmium zinc sulphide films for band gap tunability. Sci. Eng. Technol. Res. 2013, 2, 2067–2070. [Google Scholar]
  12. Ayodhya, D.; Venkatesham, M.; Kumari, A.S.; Mangatayaru, K.G.; Veerabhadram, G. Synthesis, Characterization of ZnS nanoparticles by Coprecipitation method using various capping agents Photocatalytic activity and Kinetic study. IOSR J. Appl. Chem. 2013, 6, 101–109. [Google Scholar] [CrossRef]
  13. Raleaooa, P.V.; Roodt, A.; Mhlongo, G.G.; Motaung, D.E.; Ntwaeaborwa, M.O. Analysis of the structure, particle morphology and photoluminescent properties of ZnS:Mn2+ nanoparticulate phosphors. Optik 2018, 153, 31–42. [Google Scholar] [CrossRef]
  14. Chandrakanthi, N.; Careem, M.A. Thermal stability of polyaniline. Polym. Bull. 2000, 44, 101–108. [Google Scholar] [CrossRef]
  15. Sharma, A.L.; Saxena, V.; Annapoorni, S.; Malhotra, B.D. Synthesis and characterization of a copolymer: Poly(aniline-co-fluoroaniline). J. Appl. Polym. Sci. 2001, 81, 1460–1466. [Google Scholar] [CrossRef]
  16. Suganthi, N.; Pushpanathan, K. Photocatalytic degradation and ferromagnetism in mesoporous La doped ZnS nanoparticles. Mater. Sci. Mater. Electron. 2018, 29, 13970–13983. [Google Scholar] [CrossRef]
  17. Viswanath, R.; Naik HS, B.; Somalanaik YK, G.; Neelanjeneallu PK, P.; Harish, K.N.; Prabhakara, M.C. Studies on Characterization, Optical Absorption, and Photoluminescence of Yttrium Doped ZnS Nanoparticles. J. Nanotechnol. 2014, 2014, 924797. [Google Scholar] [CrossRef] [Green Version]
  18. Mailhot, B.; Morlat, S.; Gardette, J.L. Photooxidation of blends of polystyrene and poly (vinyl methyl ether): FTIR and AFM studies. Polymer 2000, 41, 1981–1988. [Google Scholar] [CrossRef]
  19. Prasad, B.E.; Kamath, P.V.; Upadhya, S. Electrochemical Synthesis of Macroporous Oxide Coatings on Stainless-Steel Substrates. Am. Ceram. Soc. 2008, 91, 3870–3874. [Google Scholar] [CrossRef]
  20. Ezzaier, H.; Guegan, R.; Muller, F.; Amara BH, M.; Ben Rhaiem, H. Dielectric properties of ZnS filled polystyrene nanoparticules. Innov. Appl. Stud. 2014, 9, 29–36. [Google Scholar]
  21. Zhao, Y.; Wang, F.; Fu, Q.; Shi, W. Synthesis and characterization of ZnS/hyperbranched polyester nanocomposite and its optical properties. Polymer 2007, 48, 2853–2859. [Google Scholar] [CrossRef]
  22. Rose, I.R.C.; Raj, F.M.; Sathish, R.; Rajendran, A. Structural, Optical, Dielectric and Photovoltaic Application of Mn, doped Zinc Selenide Nanoparticles. J. Chem. Pharm. Sci. 2015, 43–46. [Google Scholar]
Figure 1. X-ray patterns of the synthesized ZnS nanocrystal.
Engproc 31 00074 g001
Figure 2. Debye- Scherrer plot for the ZnS nanocrystals nanocrystal.
Engproc 31 00074 g002
Figure 3. The W–H plot of the ZnS nanoparticles according to the uniform deformation model (UDM).
Engproc 31 00074 g003
Figure 4. The W–H plot of the ZnS nanoparticles according to the uniform deformation strain model (UDSM).
Engproc 31 00074 g004
Figure 5. The W–H plot of the ZnS nanoparticles according to the uniform deformation energy density model (UDEDM).
Engproc 31 00074 g005
Figure 6. TEM image of the ZnS nanoparticles.
Engproc 31 00074 g006
Figure 7. The SAED pattern of the ZnS nanostructure.
Engproc 31 00074 g007
Figure 8. TG and DTA thermograms of the ZnS nanoparticles.
Engproc 31 00074 g008
Figure 9. FTIR spectra of the ZnS nanoparticles.
Engproc 31 00074 g009
Figure 10. FTIR spectra of the ZnS nanoparticles.
Engproc 31 00074 g010
Figure 11. Frequency dependence of A.C conductivity at various temperatures.
Engproc 31 00074 g011
Figure 12. Temperature dependence of σac (ω) for the ZnS nanoparticles.
Engproc 31 00074 g012
Table 1. Micro-structural properties of ZnS nanoparticles.
Structural ParametersUDMUDSMUDEDMScherrer
D (nm)7.35 7.35 7.356.3
ε0.00930.00930.0017-------
σ(Pa) × 109-----71.2-------
μ × 105 (J m−1)-------------2.36------
δ × 1012/m21.81.81.82.5
Table 2. The values of activation energy with the corresponding frequency.
Frequency
(Hz)
Activation
Energy (eV)
10 K0.22319
30 K0.18
100 K0.174
500 K0.105
5 M0.014
Disclaimer/Publisher’s Note: The statements, opinions and data contained in all publications are solely those of the individual author(s) and contributor(s) and not of MDPI and/or the editor(s). MDPI and/or the editor(s) disclaim responsibility for any injury to people or property resulting from any ideas, methods, instructions or products referred to in the content.

