Proceeding Paper

Detection and Classification of Power Quality Disturbances Using LSTM †

by
Fatma Zohra Dekhandji
*,
Abdelmadjid Recioui
,
Athmane Ladada
and
Taha Slimane Moulay Brahim
Laboratory of Signals and systems, Institute of Electrical and Electronic Engineering, University M’hamed Bougara of Boumerdes, Boumerdes 35000, Algeria
*
Author to whom correspondence should be addressed.
Presented at the 2nd International Conference on Computational Engineering and Intelligent Systems, Online, 18–20 November 2022.
Eng. Proc. 2023, 29(1), 2; https://doi.org/10.3390/engproc2023029002
Published: 10 January 2023

Abstract

:
The detection and diagnosis of power quality (PQ) issues are critical topics in the electrical power system’s generation, transmission, and distribution. Nonlinear loads, power electronic converters, system malfunctions, and switching events are the most common causes of PQ issues. The main purpose of this work is to use an artificial intelligence (AI) technique based on automatic feature extraction to discover and identify PQ difficulties. The AI technique consists of a dedicated architecture of the Long Short-Term Memory (LSTM) network, which is a special type of Recurrent Neural Network (RNN).

1. Introduction

In today’s world, power quality (PQ) is important for modern electric power utilities and their consumers, especially when it comes to power quality disturbances, because of the huge increase in nonlinear load, the increased use of sensitive electronic devices, and the need to apply green power globally as well as increase renewable energy applications. Power quality issues have become more crucial than ever [1]. Interruptions and other disturbances are caused by greater usage of semiconductor devices, lighting controls, solid-state switching devices, inverters, and protection and relaying equipment. Such issues have become some of the most pressing concerns for engineers and decision-makers, as frequent occurrences result in significant financial losses for power companies [2].
Detecting power quality issues is critical for improving power quality in electric power systems and for making effective decisions about how to handle network disturbances. Engineers reading waveforms in the field is one method of identifying and classifying power disruptions. Unfortunately, due to the amount of data sampled in current power systems, manual recording is nearly impossible. Furthermore, more equipment failures in power systems occurred because of PQ problems, as well as damage to its sensitive controllers. As a result, the expense of addressing these issues is high in terms of finances, and it results in time losses. Therefore, studying the waveforms of power quality disturbances is important in order to detect and classify them successfully [3]. The power system must overcome various power quality challenges; some of them make it operational, resulting in a blackout of the network. The most significant challenges that the power system must overcome include:voltage spikes, voltage fluctuations, voltage unbalance, voltage sag, voltages swell, harmonic distortion, noise, very short interruptions, and long interruptions [4].
In order to evaluate the power quality and the disturbances that are experienced, it is necessary to detect and classify these disturbances in time, precisely and correctly. To do that, several signal processing methods, such as FT, ST, and WT, have offered sophisticated mathematical algorithms that may detect power quality problems, and these algorithms have shown substantial success in this field [3,4,5]. Classification techniques like ANN, SVM, and Fuzzy logic provide assistance to the detecting algorithm by testing, validating, and training large amounts of signals. This helps to ensure that the selected algorithm is both successful and efficient [6]. Long Short-Term Memory (LSTM) hasprovided a powerful mathematical algorithm for the detection and classification of PQ problems in a power system. LSTM isa developed version of Recurrent Neural Network (RNN). LSTM contains neurons to perform computation (memory cells). These cells have weights and gates; the gates are the defining characteristic of LSTM models. There are three gates within each cell: theinput, forget, and output gates [7].
In this work, the PQ detection and classification system is presented in order to solve part of the power system problems. The paper is divided into the following sections: a description of power quality problems with their causes and effects. Next, a presentation of the existing detection and classification methods is given, with a brief explanation oftheiradvantages and drawbacks. Finally, the simulation results and their discussion are given, with conclusions drawn.

2. Long Short-Term Memory (LSTM)

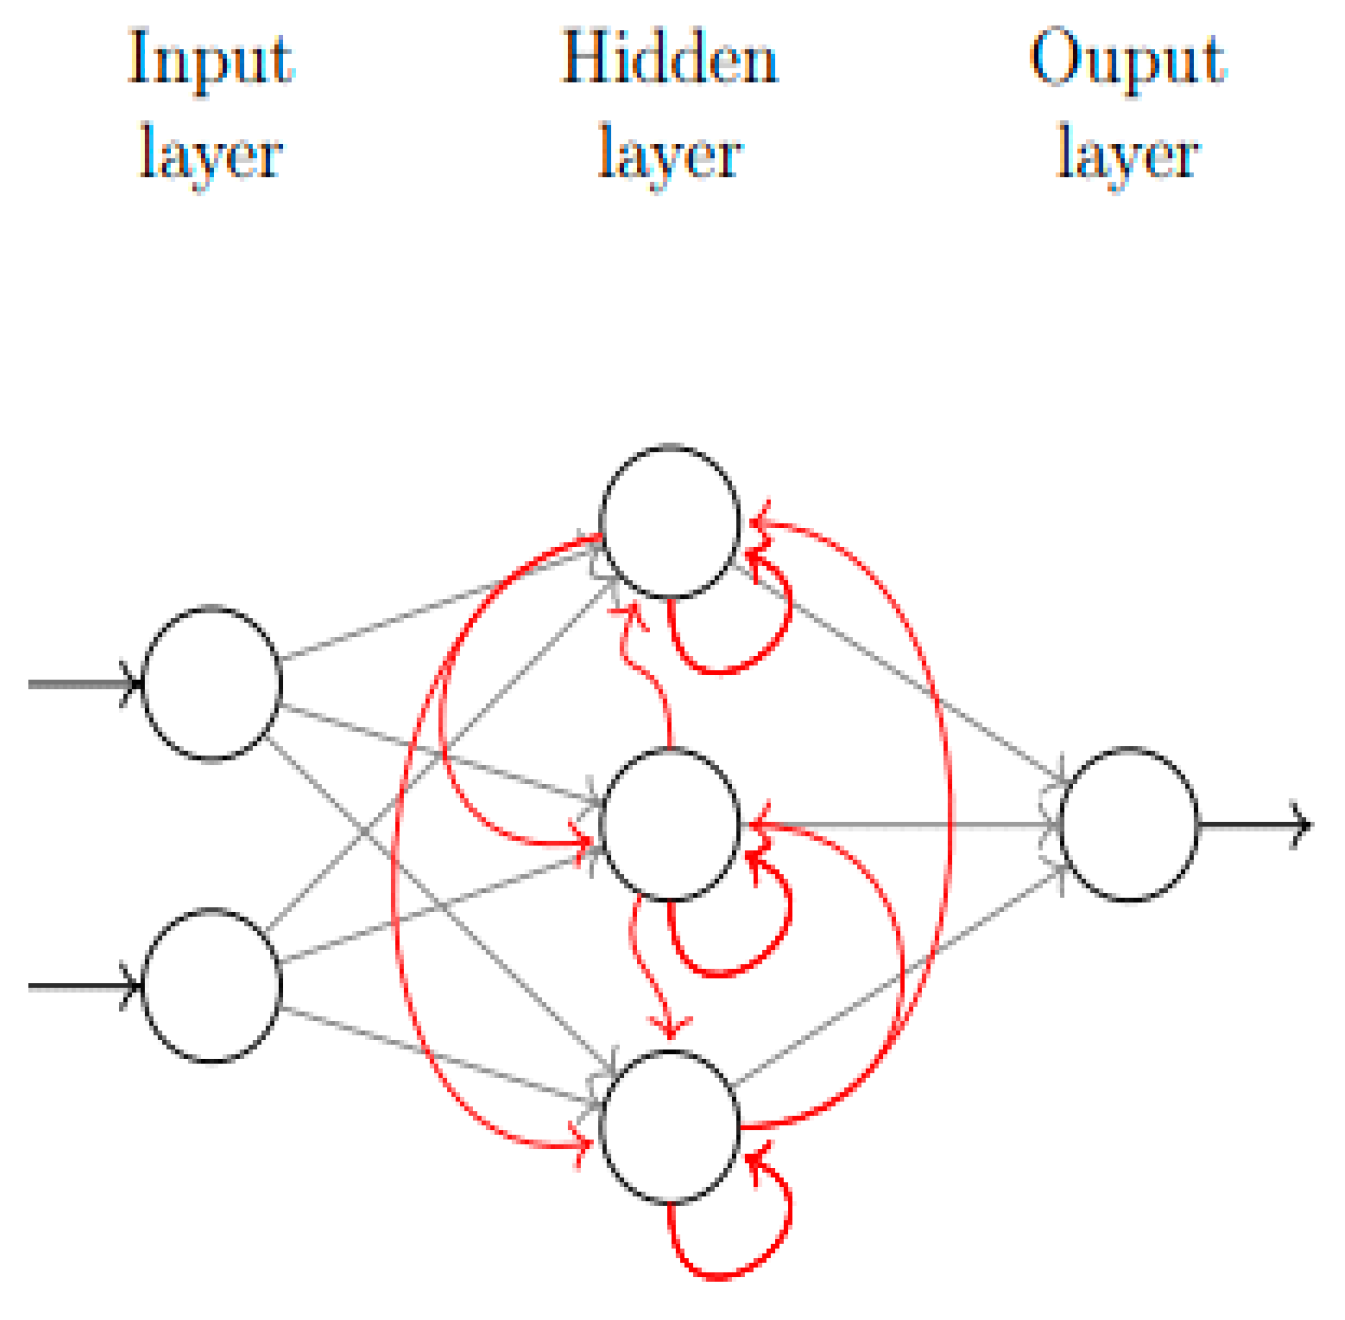
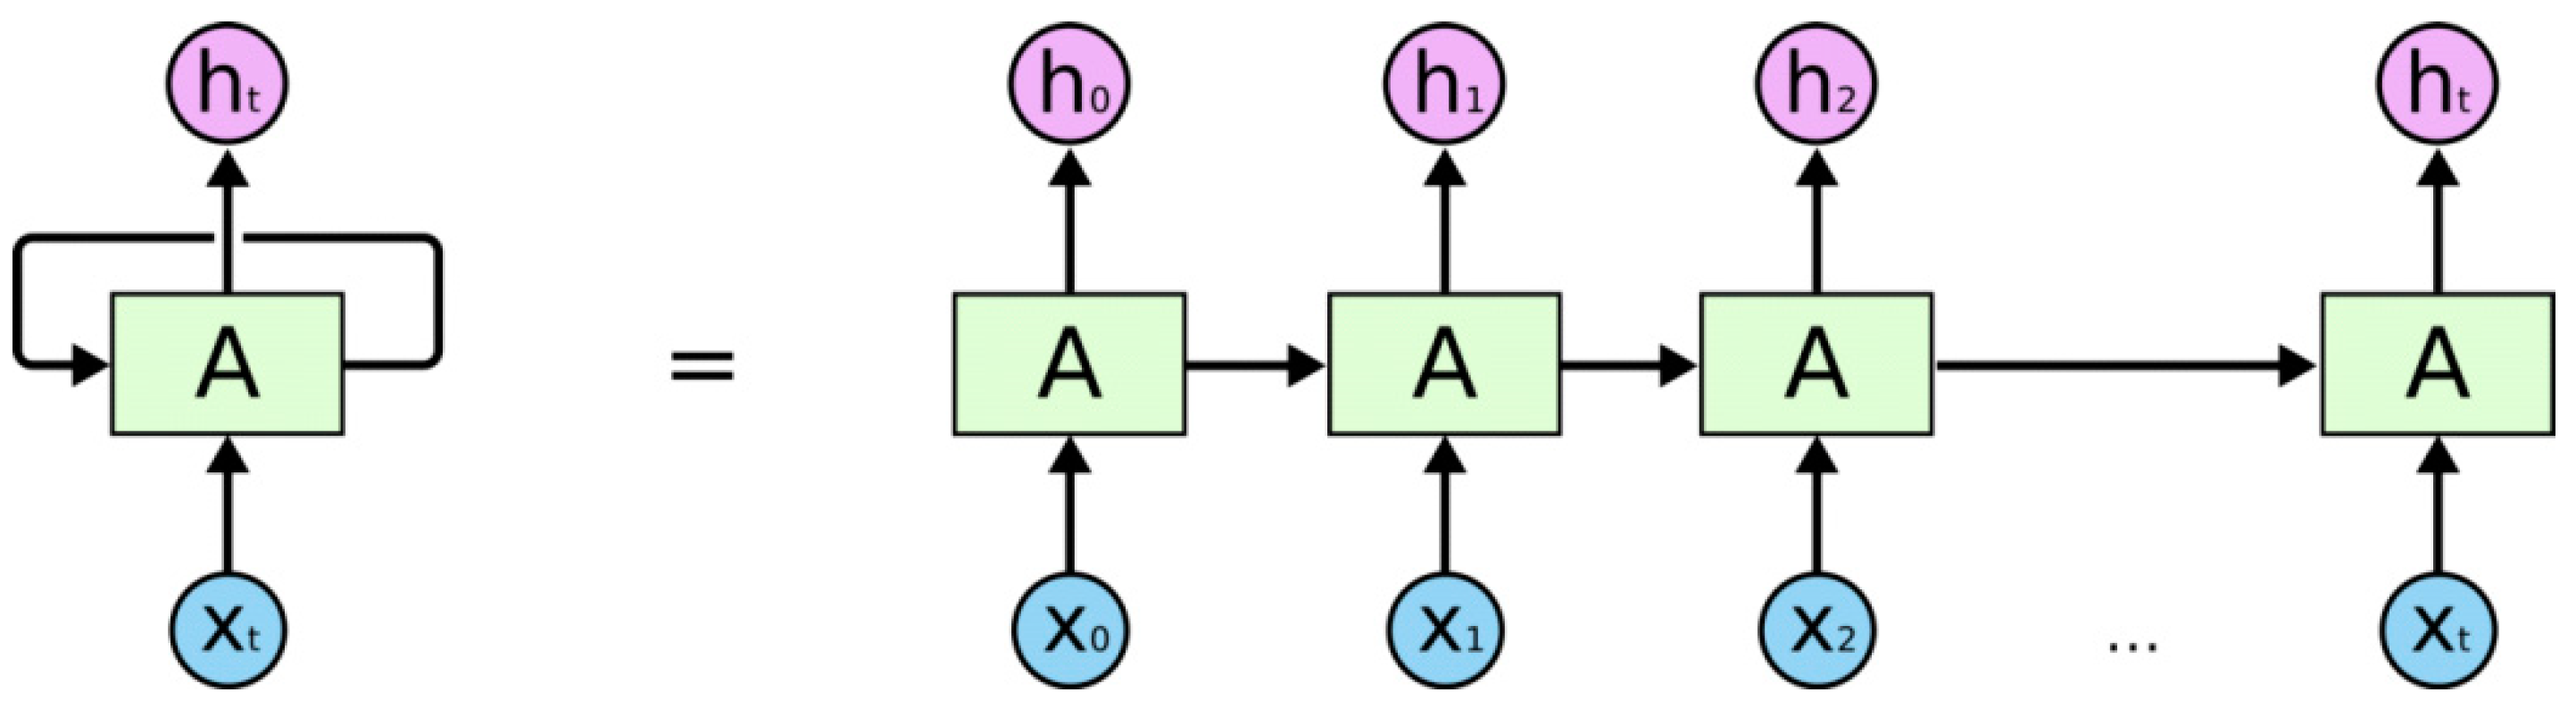
2.1. Recurrent Neural Networks (RNN)

Recurrent neural networks (RNNs) are networks with an internal network loop that ensures information persistence. RNNs have been particularly developed to process sequential data [8]. RNNs have complete connections between adjacent layers and nodes within the same layer as illustrated in Figure 1. Furthermore, RNNs’ hidden units receive feedback from prior states to current status. These properties are appropriate for dealing with temporal–spatial data [9].
RNNs are referred to as recurrent because they do the same task for each element of a sequence, with the outcome relying on previous estimates. Another way to conceive of RNNs is that they have a “memory” that stores information about previous calculations [10]. As a result, RNNs can link earlier data to the current task. RNN is already being used to solve a number of problems using an internal state (memory) to process a sequence of inputs, including language modeling and translation, speech recognition, text recognition, time series data, and autonomous driving systems to predict vehicle trajectories and assist in avoiding accidents.

2.2. RNN Architecture

In Figure 2, ( x t ) denotes the current input of time step t, ( h t ) is the output of that time step, and A denotes the network’s recurrently connected unit. The previous time step’s output is passed on to the following time step as an extra input. If a dense layer is following, the last concealed state ( h t ) is passed and processed to form ( y t ), or if a dense layer follows, ( h t ) is passed and processed to form ( y t ).

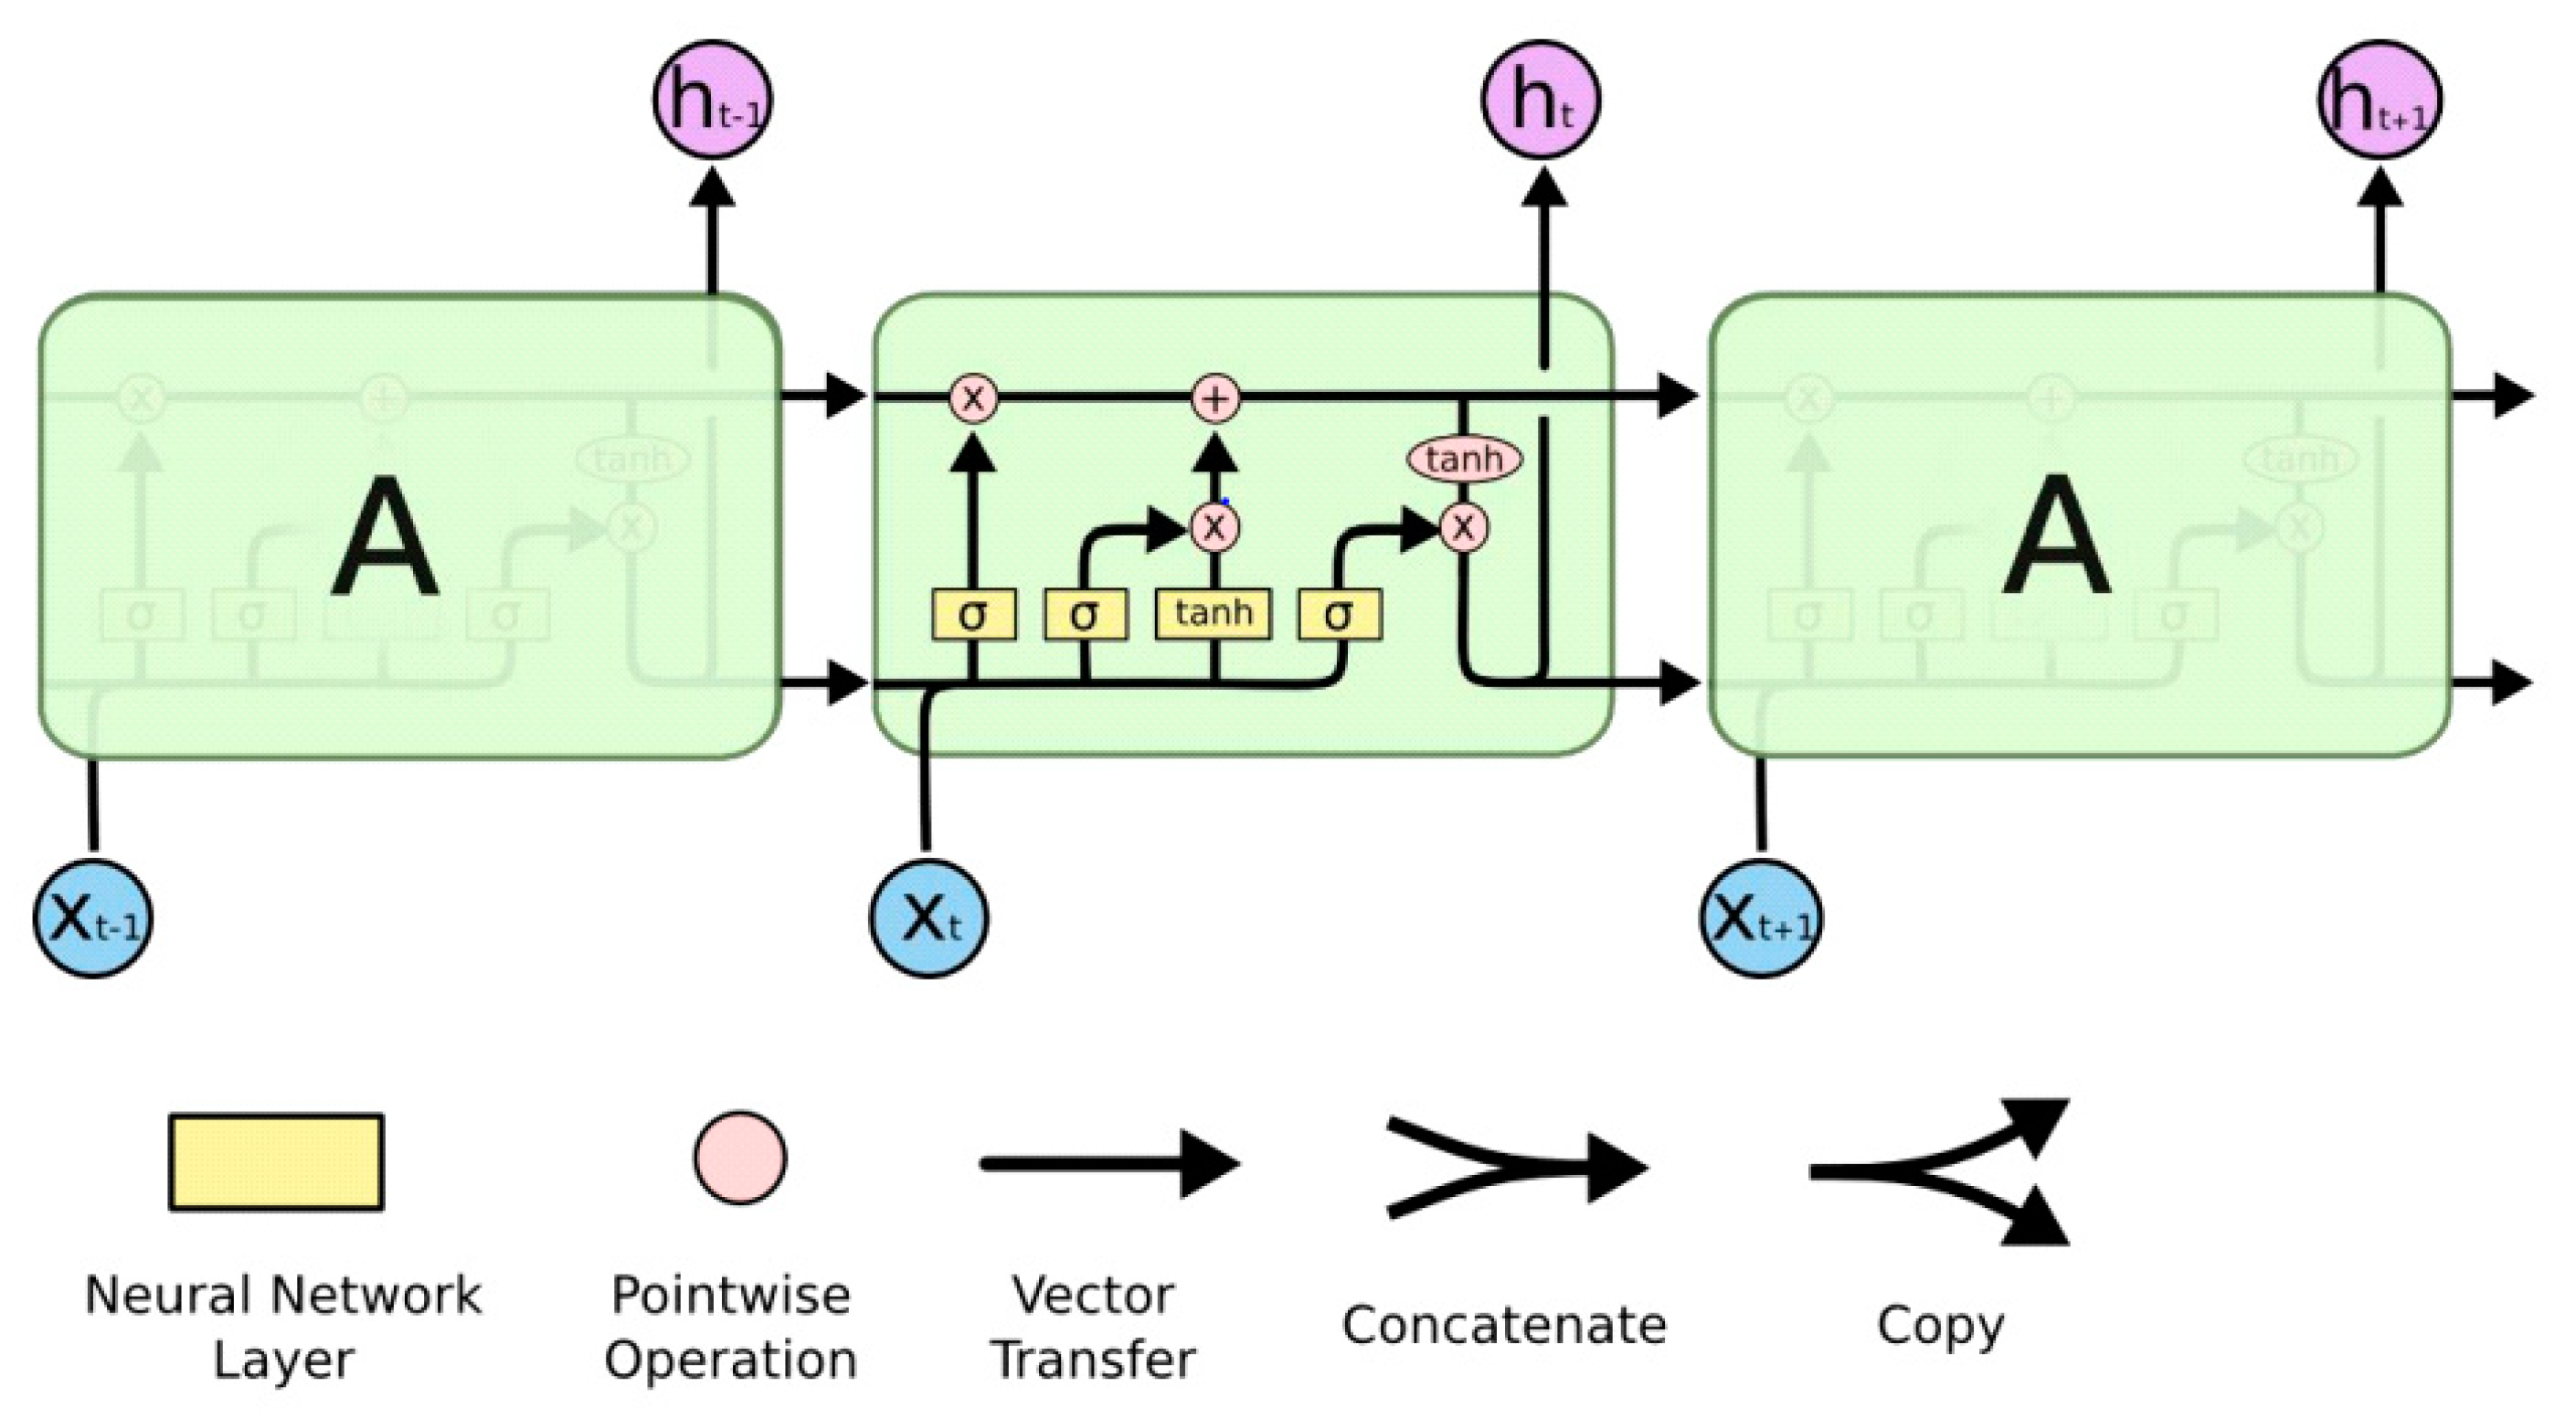
2.3. Long Short-Term Memory (LSTM)

Long Short-Term Memory networks are a developed version of the previously mentioned simple RNNs. Hochreiter and Schmidthuber first proposed them in 1997 [11], and they have demonstrated accurate performance in modeling both long- and short-term dependencies of sequential data [8]. In theory, they were created expressly for long-term dependencies in order to overcome the vanishing/exploding gradient problem. Figure 3 shows the structure of a simple LSTM network for prediction, which includes a sequence input layer, an LSTM layer, and a prediction (classification) output layer.

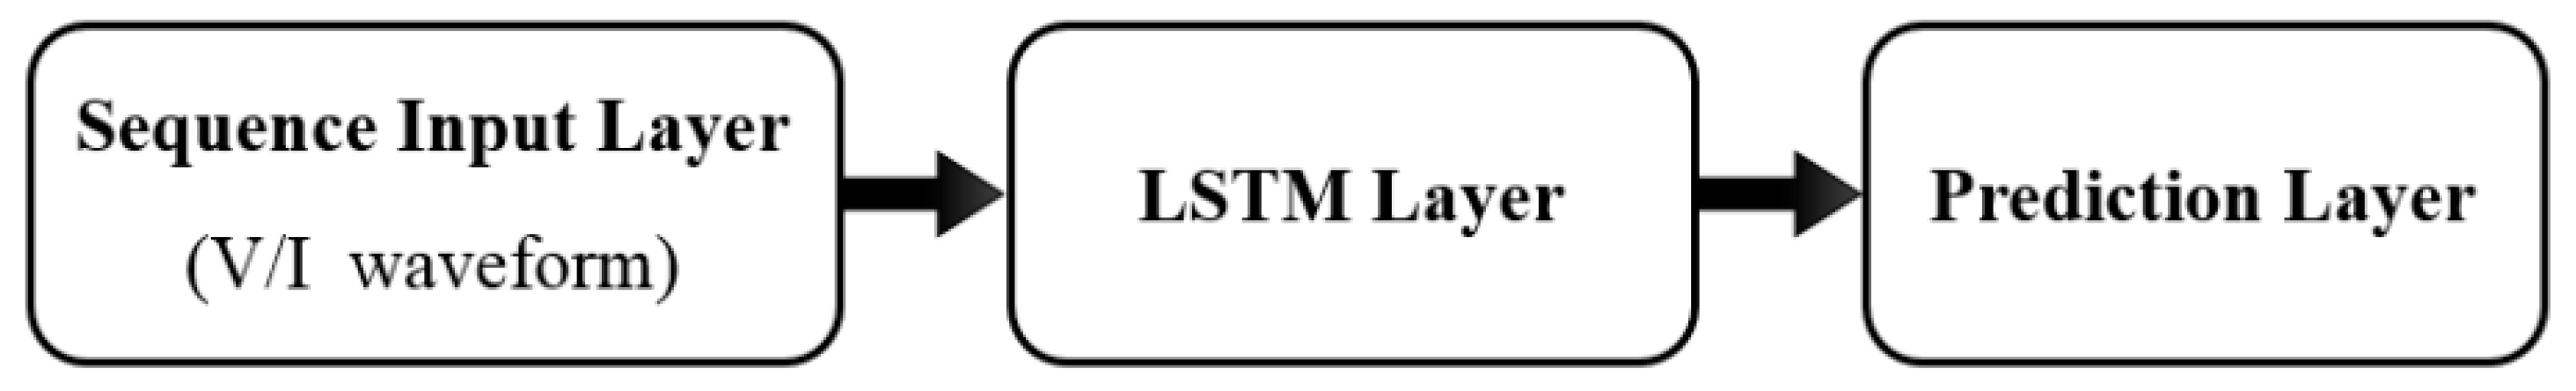
2.4. LSTM Network Architecture

The LSTM architecture is based on the existence of a memory cell that is capable of maintaining its state over time and has a nonlinear gating mechanism that controls the flow of information into and out of the cell. The LSTM network is being utilized to create a more complicated and deeper nonlinear neural network capable of demonstrating the effect of long-term memory [12].
LSTM networks have an input layer, an output layer, and a multitude of hidden layers in between. The memory cell is built into the hidden layer. Each cell has three gates (input, forget, and output) and a recurrent connection unit [13].
The LSTM architecture is depicted in Figure 4 as it unfolds over time. The LSTM cell (denoted as A in Figure 4) on the left represents the previous time step, while the cell on the right represents the next time step. The current time step is halfway through. The cell contains three lines. It obtains the input ( X t ) and the output from the previous time step in the bottom left corner (the output from the previous layer is called the hidden state in RNNs and is abbreviated as ( h t 1 ). Before running into the four gates denoted as yellow boxes in the drawing, the input ( X t ) and the hidden state ( h t 1 ) are concatenated. The cell’s third input, which comes from the preceding cell, is represented by a straight arrow that passes through the upper section of the cells. This is the cell state, which allows the LSTM to remember long-term dependencies with a far lower risk of the vanishing and exploding gradient problems that plague typical RNNs [14,15,16,17].

3. Results and Discussions

3.1. Description of the Simulation Environment

MATLAB is used to generate several PQ signals, including interruptions, sag, harmonic distortion, flicker, swell, surge, sag with harmonics, and swell with harmonics, in this section. A comparative study to evaluate the LSTM performance in terms of the detection and classification of these signals is performed. Each simulated waveform is made up of voltage waves recorded at a rate of 64 samples per cycle. A total of 200 case studies are created for each power quality problem by varying the voltage magnitude and the beginning and finish time instants of each PQ problem. Simulated signals are blended with random white noise with signal-to-noise ratios of 40 dB and 20 dB, respectively.
The signal-to-noise ratio (SNR) is a metric that compares the strength of a desired signal to the strength of an additive white Gaussian noise as:
SNR = Psignal Pnoise
where P designates the power. Higher values of SNR generally mean a better specification since this means more useful information (the signal) than unwanted data (the noise).

3.2. Proposed Methodology

As shown in Figure 5, the LSTM system is designed and built to perform detection and classification using five parameters: amplitude, start time, end time, duration, and THD percent, as well as two outputs: waveform class and harmonics indicator.

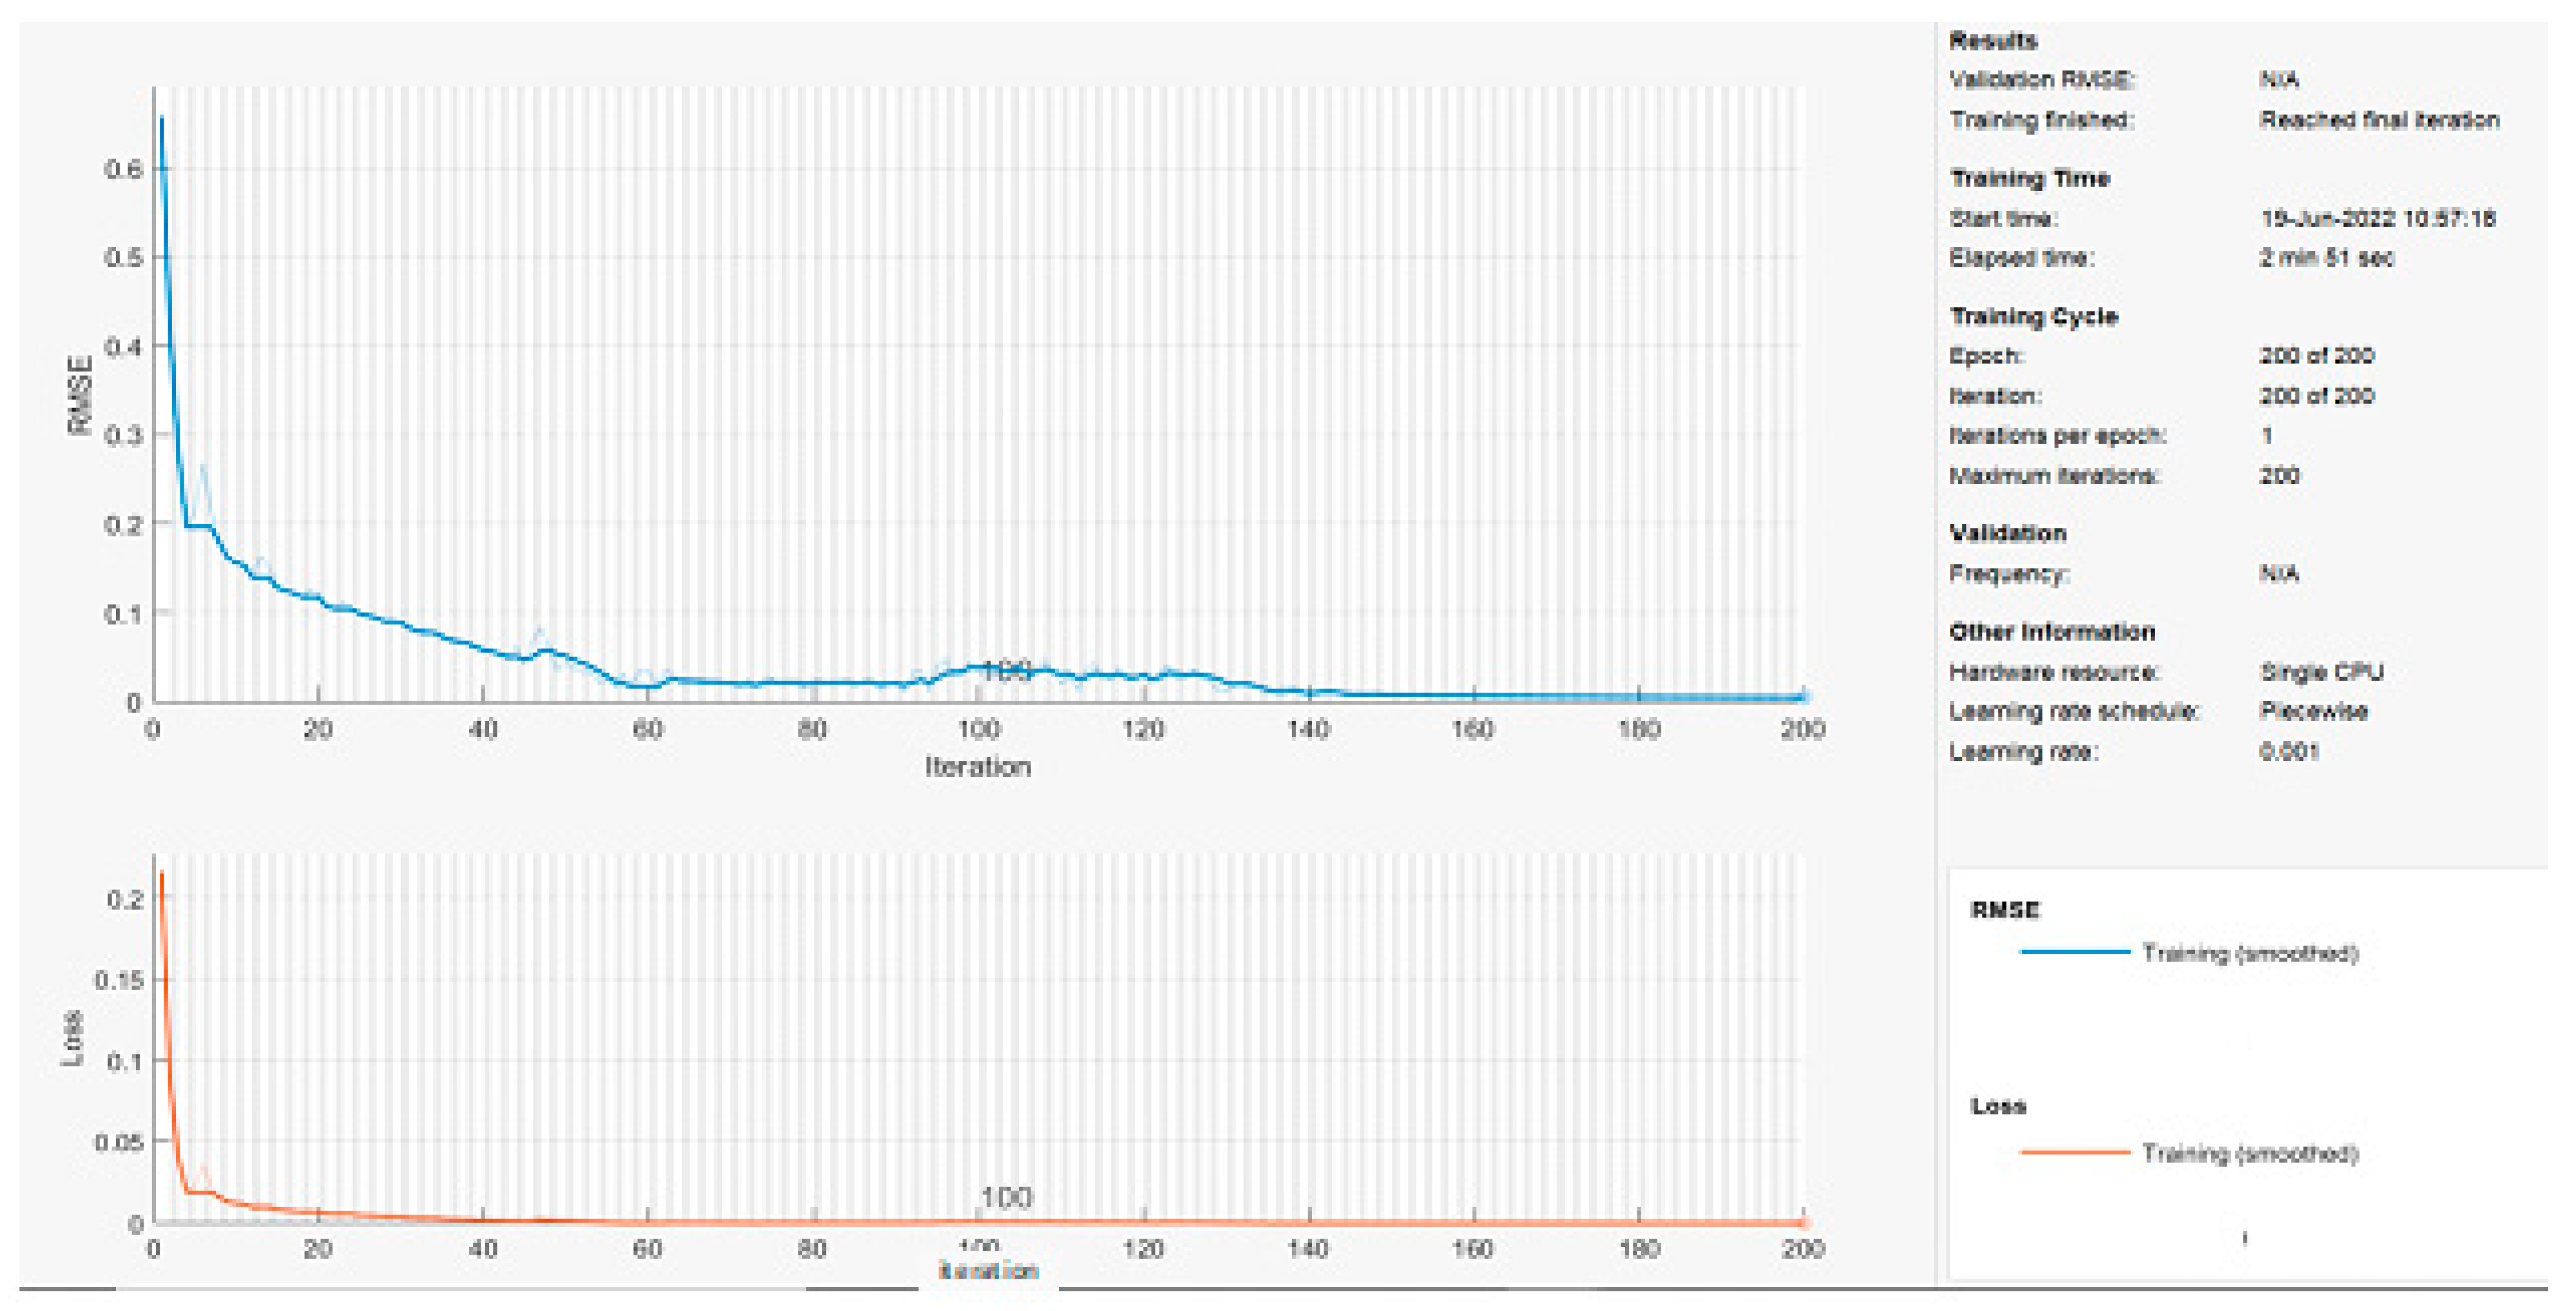
3.3. Model Implementation and Training

In this section, the proposed model is trained by altering the voltage magnitude and the start and finish time instants of each power quality problem; 200 case studies are constructed for each PQ problem. Figure 6 shows the trained system.
To detect and classify the problem waveforms, the LSTM has two outputs as follows:
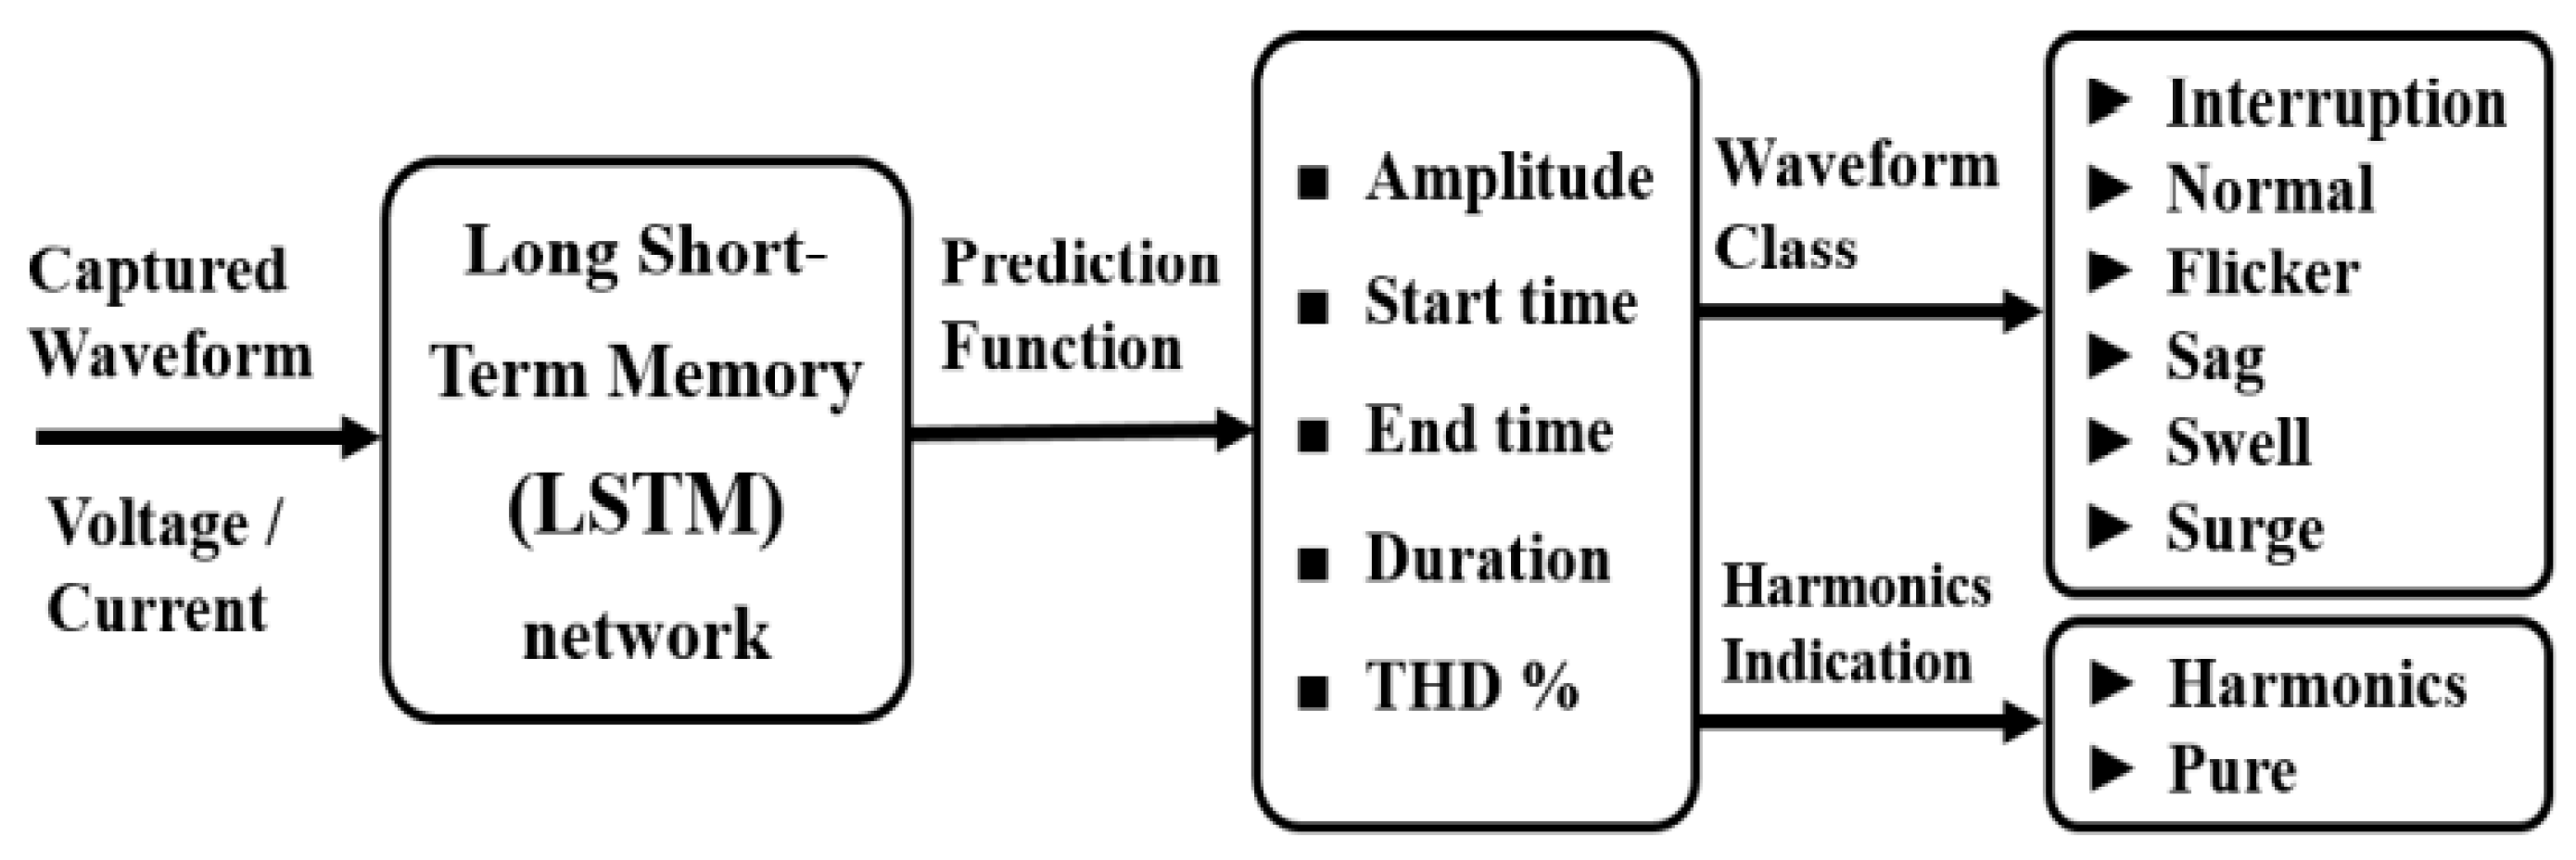
  • The first output of the LSTM function is for the waveform class, which is defined by six sets. These sets are the interruption, sag, normal, flicker, swell, and surge. Any output value, which does not belong to these sets, represents the distortion. The first output of the LSTM network system can assume values between 0 and 3, as shown in Table 1.
  • The second output of the LSTM function is for harmonics indication, which is partitioned into two function sets. The labels of these sets are Pure and Harmonics, as shown in Table 1.

3.4. Results and Discussions

Table 2 summarizes the performance of the LSTM technique following extensive simulations. The percentage values indicated show how good LSTM is in terms of power quality disturbance detection and classification.
The following remarks may be drawn from Table 2:
  • The LSTM has performance values ranging from 96.3674% to 99.7458%.
  • A value of 40 dB SNR and the harmonics do not have much of an effect on the detection results, which shows the effectiveness of the LSTM model.
  • An SNR of 30 dB is considered a high noise ratio even if the final accuracy was not deduced higher than 3%.
  • Merging the normal signal with PQ disturbances at an SNR of 30 dB and harmonics gives an accuracy of around 96%.
  • The worst-case PQ disturbances with harmonics and noises were clearly and successfully detected and classified, which proves the LSTM’s robustness.

4. Conclusions

The main objective of this work is to develop a Power Quality Detection and Classification using Long Short-Term Memory (LSTM). The method is able to identify and classify several PQ problems (normal, sag, swell, surge, distortion, and interruption) in both simple and complex power quality disturbances in the presence of random noise at different values of the signal-to-noise ratio (SNR). The detection and classification using the LSTM model aredesigned and implemented to perform with five input data parameters (amplitude, start time, end time, duration, THD %) and two outcomes: the waveform class and a harmonics content indicator.The detection and classification of PQ problems using LSTM show the high accuracy of this model, even in the worst cases of adding harmonics with 30-dB SNR simultaneously with PQ problemsignals. This proves the robustness of the LSTM method, as the obtained classification rate was 96.3674%. Hence, the findings of the present work prove that the LSTM network is a leading method in the world of PQ detection and classification.

Author Contributions

Conceptualization, F.Z.D. and A.R.; methodology, A.R.; software, F.Z.D.; validation, A.R., T.S.M.B. and A.L.; formal analysis, F.Z.D.; investigation, A.R.; resources, F.Z.D.; data curation, T.S.M.B.; writing—original draft preparation, F.Z.D.; writing—review and editing, A.R.; visualization, F.Z.D.; supervision, A.R.; project administration, F.Z.D. All authors have read and agreed to the published version of the manuscript.

Funding

This research received no external funding.

Institutional Review Board Statement

Not applicable.

Informed Consent Statement

Not applicable.

Data Availability Statement

The data presented in this study are available on request from the corresponding author. The data have been synthesized for the purpose of this study and are not publicly available.

Conflicts of Interest

The authors declare no conflict of interest.

References

  1. Lei, J.; Liu, C.; Jiang, D. Fault diagnosis of wind turbine based on Long Short-term memory networks. Renew. Energy 2019, 133, 422–432. [Google Scholar] [CrossRef]
  2. Dekhandji, F.Z.; Rais, M.C. A Comparative Study of Power Quality Monitoring Using Various Techniques. In Optimizing and Measuring Smart Grid Operation and Control; IGIGlobal: Hershey, PA, USA, 2021; pp. 259–288. [Google Scholar]
  3. Dekhandji, F. Signal Processing Deployment in Power Quality Disturbance Detection and Classification. Acta Phys. Pol. A 2017, 132, 415–419. [Google Scholar] [CrossRef]
  4. Dekhandji, F.Z.; Talhaoui, S.; Arkab, Y. Power Quality Detection, Classification and Monitoring Using LABVIEW. Alger. J. Signals Syst. 2019, 4, 101–111. [Google Scholar] [CrossRef]
  5. Dekhandji, F.Z.; Bentarzi, H.; Recioui, A. Effects of voltage disturbances on induction motors and adjustable speed drives. In Proceedings of the 2015 4th International Conference on Electrical Engineering (ICEE), Boumerdes, Algeria, 29–31 October 2015; pp. 1–4. [Google Scholar]
  6. Dekhandji, F.Z.; Douche, M.; Zebidi, N. DVR and D-STATCOM Mitigation Techniques of Power Quality Effects on Induction Motors. Alger. J. Signals Syst. 2017, 2, 110–129. [Google Scholar] [CrossRef]
  7. Balouji, E.; Gu, I.Y.; Bollen, M.H.; Bagheri, A.; Nazari, M. ALSTM-based deep learning method with application to voltage dip classification. In Proceedings of the 2018 18th International Conference on Harmonics and Quality of Power (ICHQP), Ljubljana, Slovenia, 13–16 May 2018; pp. 1–5. [Google Scholar]
  8. Rens, J.; DeKock, J.; Van Wyk, W.; Van Zyl, J. The effect of real network phase disturbances on the calculation of IEC61000-4-30 parameters. In Proceedings of the 2014 16th International Conference on Harmonics and Quality of Power (ICHQP), Bucharest, Romania, 25–28 May 2014; pp. 303–306. [Google Scholar]
  9. De Almeida, P.R.; da Silva, A.M.; Lemes, M.I.; Garcia, F.R. Application of reactive compensation equipment in industrial systems under aspects of harmonics and switching transients: A study of real case. In Proceedings of the 2016 17th International Conference on Harmonics and Quality of Power (ICHQP), Belo Horizonte, Brazil, 16–19 October 2016; pp. 798–803. [Google Scholar]
  10. Langella, R.; Testa, A.; Et, A. IEEE Recommended Practice and Requirements for Harmonic Control in Electric Power Systems; IEEE: Piscataway, NJ, USA, 2014. [Google Scholar]
  11. Jaekel, B.W. Description and classification of electromagnetic environments-revision of IEC61000-2-5. In Proceedings of the 2008 IEEE International Symposium on Electromagnetic Compatibility, Detroit, MI, USA, 18–22 August 2008; pp. 1–4. [Google Scholar]
  12. De, S.; Debnath, S. Real-time cross-correlation-based technique for detection and classification of power quality disturbances. IETGener. Transm. Distrib. 2017, 12, 688–695. [Google Scholar] [CrossRef]
  13. Babu, N.R.; Mohan, B.J. Fault classification in power systems using EMD and SVM. Ain Shams Eng. J. 2017, 8, 103–111. [Google Scholar] [CrossRef] [Green Version]
  14. Zhang, S.; Wang, Y.; Liu, M.; Bao, Z. Data-Based Line Trip Fault Prediction in Power Systems Using LSTM Networks and SVM. IEEE Access 2018, 6, 7675–7686. [Google Scholar] [CrossRef]
  15. Dekhandji, F.Z. Detection of power quality disturbances using discrete wavelet transform. In Proceedings of the 2017 5th International Conference on Electrical Engineering-Boumerdes (ICEE-B), Boumerdes, Algeria, 29–31 October 2017; pp. 1–5. [Google Scholar]
  16. Method Based on Long Short-Term Memory Neural Networks. In Proceedings of the 2017 IEEE 86th Vehicular Technology Conference (VTC-Fall), Toronto, ON, Canada, 24–27 September 2017; pp. 1–5.
  17. Tsiouris, K.M.; Pezoulas, V.C.; Zervakis, M.; Konitsiotis, S.; Koutsouris, D.D.; Fotiadis, D.I. A LongShort-Term Memory deep learning network for the prediction of epileptic seizures using EEG signals. Comput. Biol. Med. 2018, 99, 24–37. [Google Scholar] [CrossRef] [PubMed]
Figure 1. Architecture of a recurrent neural network.
Engproc 29 00002 g001
Figure 2. A simple rolled RNN layer and its corresponding unrolled architecture.
Engproc 29 00002 g002
Figure 3. LSTM network system.
Engproc 29 00002 g003
Figure 4. LSTM module containing four interacting layers.
Engproc 29 00002 g004
Figure 5. Block diagram of proposed method.
Engproc 29 00002 g005
Figure 6. Training process of LSTM model.
Engproc 29 00002 g006
Table 1. LSTM Network Outputs.
PQ ProblemLSTM Output
First LSTM output
Interruption0
Sag0.5
Flicker0.8
Normal sine wave1
Swell1.5
Surges3
Second LSTM output
Pure0
Harmonics1
Table 2. Summary of the Obtained results.
EventsPure SignalWith SNR 40With SNR 30 dBWith HarmonicsWith Harmonics and SNR 30 dB
Normal case99.464499.355198.958898.904495.9687
Sag99.887599.534698.252899.566296.6155
Swell99.909199.329397.360998.837296.7574
Interruption99.986198.541397.498599.955396.1080
Surge99.482197.886094.6241//
The totals99.745899.529297.379099.315896.3674
Disclaimer/Publisher’s Note: The statements, opinions and data contained in all publications are solely those of the individual author(s) and contributor(s) and not of MDPI and/or the editor(s). MDPI and/or the editor(s) disclaim responsibility for any injury to people or property resulting from any ideas, methods, instructions or products referred to in the content.

