1. Introduction
Lithium-ion cells can be considered the backbone of many Battery Energy Storage Systems (BESS). They have many relative advantages when compared to other cells, such as power density, power throughput, high lifecycle, and low self-discharge; however, they need careful management. Lithium-ion cells are available in numerous types and brands with different characteristics. By connecting them in series and/or parallel, these cells are used to construct batteries of different voltages and capacities, from a few watt hours to hundreds of Megawatt-hours. These are widely used in various applications, such as electric vehicles (EVs), storage of renewable energy, power banks, electric yachts, bikes, scooters, laptops, smartphones, and many other applications. In each application, lithium-ion batteries are used in different ways and in different conditions. In order to manage and run them effectively and securely, many parameters should be taken into consideration. One of the important parameters that should be known and monitored in real time is the state of charge (SOC), which represents the amount of capacity left in the battery (in Ah) as a percentage of its maximum capacity. In addition, it is important to estimate the state of health (SOH) of a battery, which represents the total amount of energy that the battery can hold and deliver compared to a fresh battery [
1,
2,
3].
Because of the global transfer toward renewable green energy, and increasing demand of BESS-based systems like EVs and smart grids, many developments have been undertaken to BMS (Battery Management System) technology to become more efficient and reliable. Moreover, to provide good management of the batteries, particularly SOC and SOH estimations, many techniques have been proposed by researchers and developers for SOC estimation. Some of the approaches are enhancing the existing techniques and some of them are more recent, such as Data-Driven Model-based methods using Machine Learning (ML) that show very interesting results [
1,
4,
5]. However, although the noticed improvements in SOC estimation methods are important, there is as yet no universal solution for SOC estimation sufficiently accurate for every battery in any condition; therefore, more research and development are still to be done in this field.
Wrong estimation of lithium-ion batteries’ SOC can lead to sudden failure or complete shutdown of any BESS-based system, and rapid degradation of the batteries’ ability to store and deliver energy due to overcharge or discharge that can occur, potentially causing an unsafe situation. The estimation of SOC is not a direct measurement, but is a tricky operation and depends on many other parameters like voltage, current, temperature, and aging. There are various methods used to estimate the SOC. The criteria to choose the best method for a certain application is that it should be an online method without affecting the performance of the batteries, and with less computational complexity and high estimating accuracy [
2,
6]. Hence, this paper presents a prototype battery characterization system that will be used as a low-cost laboratory test bed in order to develop and test advanced estimation techniques for SOC and SOH estimations.
2. State of Charge Estimating Methods Overview
Due to the recent increased need for BESS-dependent systems such as EVs and renewable ESS, several research works and ongoing development have been undertaken to improve the performance and the reliability of such systems, by making battery management systems more sophisticated and more accurate. One of the main tasks of the battery management system is to accurately control SOC and SOH as much as possible in real time to prevent any unwanted scenarios. Thus, many methods have been developed to estimate the SOC, and each of them can be more suitable than the others for certain applications.
2.1. Open Circuit Voltage (OCV)
Open circuit voltage is getting the SOC of the battery by converting its open circuit voltage to its state of charge using a predefined look-up table that maps the OCV to SOC. This method is quite precise; however, it is not too practical in real applications. In fact, the battery should be at rest for a large amount of time until the stabilization of its electrochemistry; then, the OCV measurement can be performed and compared to the look-up table. The drawback of this method is that one look-up table cannot be used for all batteries; mostly, it is affected by the battery itself, its type, and its aging [
7,
8].
2.2. Coulomb Counting
This method is very common and simple. It depends on counting the amount of the charge flow in or out of the battery in (
Ah) by integrating the current in time. This method can be expressed by Equation (1) where
I is the current entering the battery,
SOC (
t = 0) is the initial estimated SOC, and
C max is the maximum capacity that the battery is able to store and deliver.
An accurate estimation of this method depends directly on high-precision measurement of the current and knowing the exact initial state of charge
SOC (
t = 0) and the state of health SOH. Therefore, any slight errors that will occur even with high-precision measurements will cause an accumulated error over time; in the process, it will cause a large deviation in the SOC estimation [
2,
3,
9].
2.3. Voltage Method
This depends on the different existing discharging curves that are generated experimentally for certain batteries. It is not computationally complex and suitable for constant current applications and constant conditions in general; however, when the current or temperature is fluctuating, its accuracy will decline and it will no longer be practical. Thus, it is not very practical for real applications [
1,
2].
2.4. Kalman Filter
Kalman filter is an algorithm that can estimate the inner state of many systems; as well as this, it can be used for SOC estimation of a battery with a suitable model. It is based on the current, voltage, and temperature measurements to estimate the state of charge [
1]. EKF (extended Kalman Filter) compares the cell voltage that was actually measured to the cell voltage that a battery model predicted to estimate the battery SOC after corrections [
10].
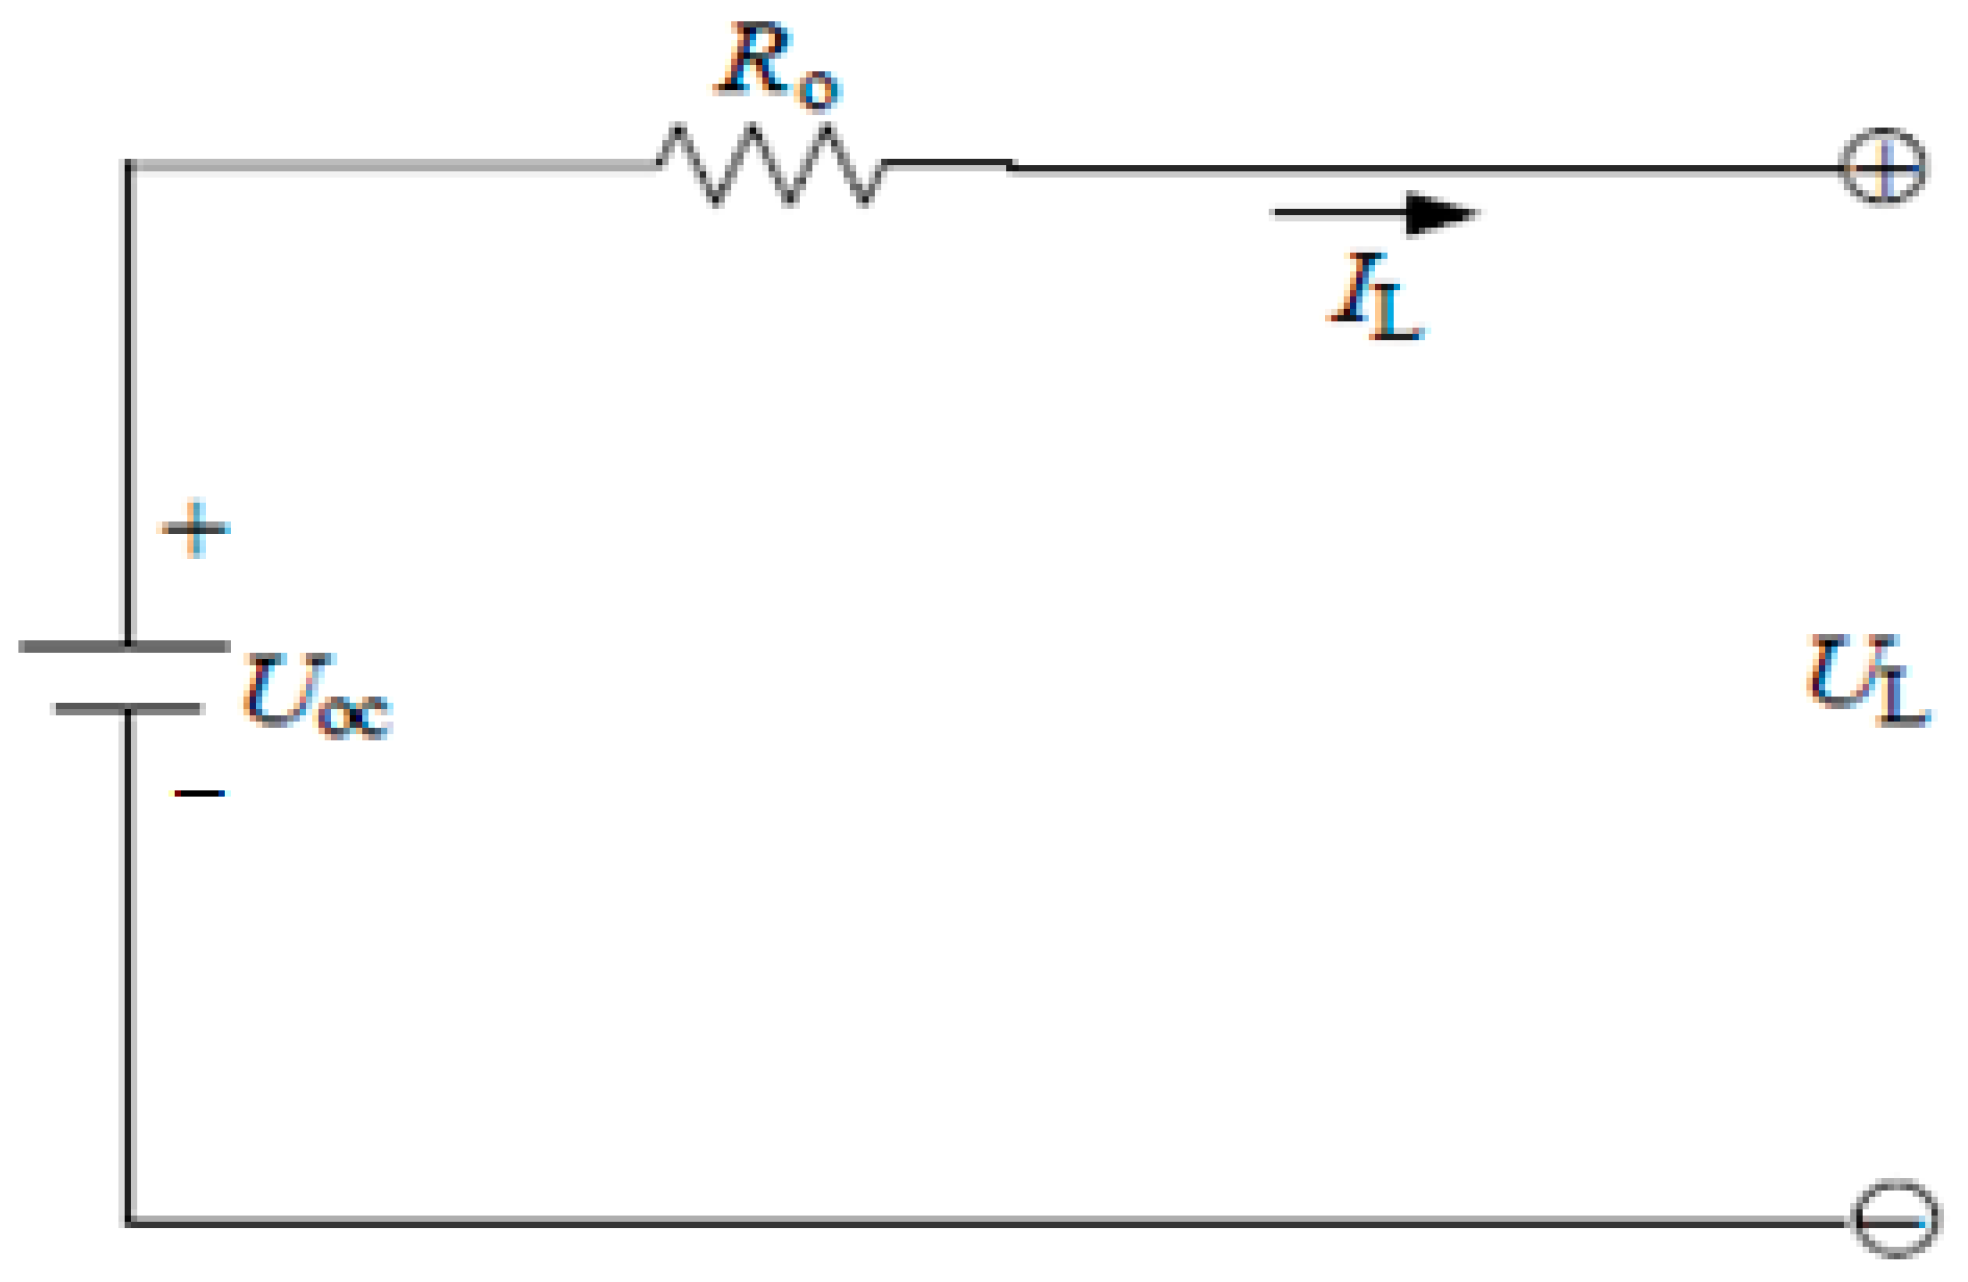
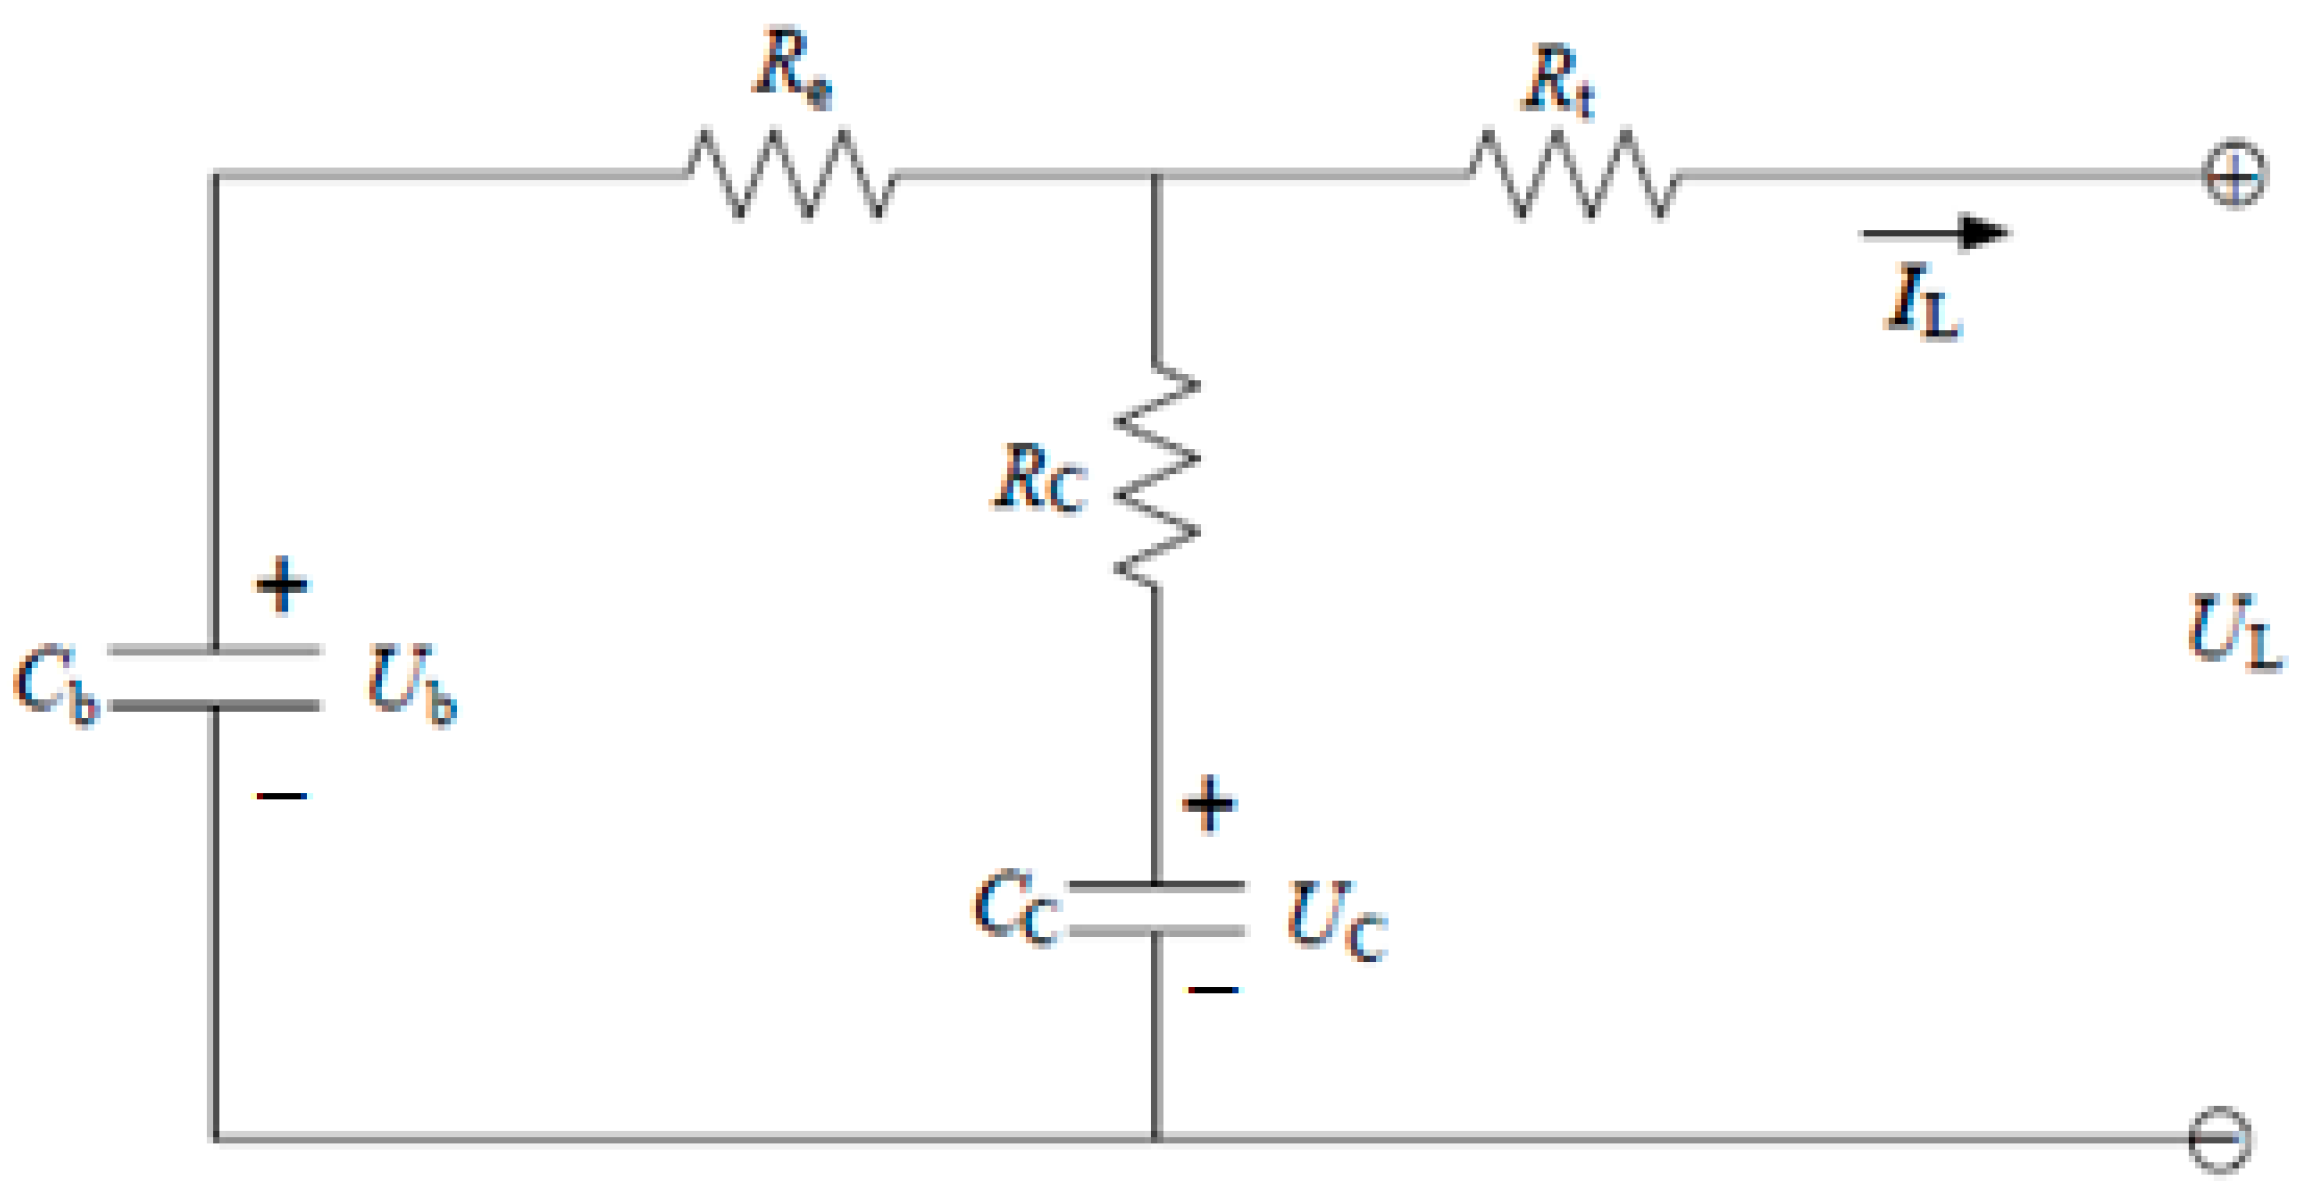
2.5. Equivalent Circuit Model (ECM)
This technique presents the battery as an electric equivalent circuit model by choosing the right circuit and the right values of its components, so that it can predict the parameters of the battery in real time. Some circuit models are shown in
Figure 1 and
Figure 2. This method has acceptable results, it is simple and computationally less complex; however, after the battery aging, the model chosen can no longer fit the battery behavior [
1,
11].
2.6. Impedance Spectroscopy
The internal impedance spectroscopy of lithium-ion batteries can reflect the SOC with a high accuracy. By analyzing the impedance of the battery at different frequencies from 40 Hz to 20 kHz, the phase and the modulus is measured and compared to predefined impedance spectroscopy to get the SOC. Conversely, it is implemented using expansive hardware; as well as interrupting the battery performance, the external condition and aging my affect its precision [
1,
12].
2.7. Data-Driven Model
This method does not depend on any physical model but relies on using artificial intelligence (AI), where a suitable neural network can be implemented and trained with sufficient related data of the battery behavior. This technique gained the advantage with the recent improvement in computational power of the hardware and the massive data that is generated from different applications like EVs and other BESS systems. However, this method is computationally complex and has an over-fitting problem [
1,
4,
13].
3. Problematic
Our state-of-the-art overview of the existing SOC estimation methods led us to summarize the advantages and drawbacks of each technique in
Table 1.
Therefore, due to the diversity of the types and brands of Lithium-ion cells that are existing today and the different conditions and applications where they can be used; there is a need for further investigation and improvement of SOC estimating methods. Many tests should be conducted in regulated conditions, and a lot of data should be generated. Thus, an affordable Battery cell test system is needed. This article deals with the designing, implementation, and demonstration of a low-cost prototype battery cell test system that can perform several types of testing with pretty accurate results. At the same time, it offers good flexibility and ergonomic use; thus, this will provide more accessibility for more experiments and tests to be done.
4. Design and Implementation
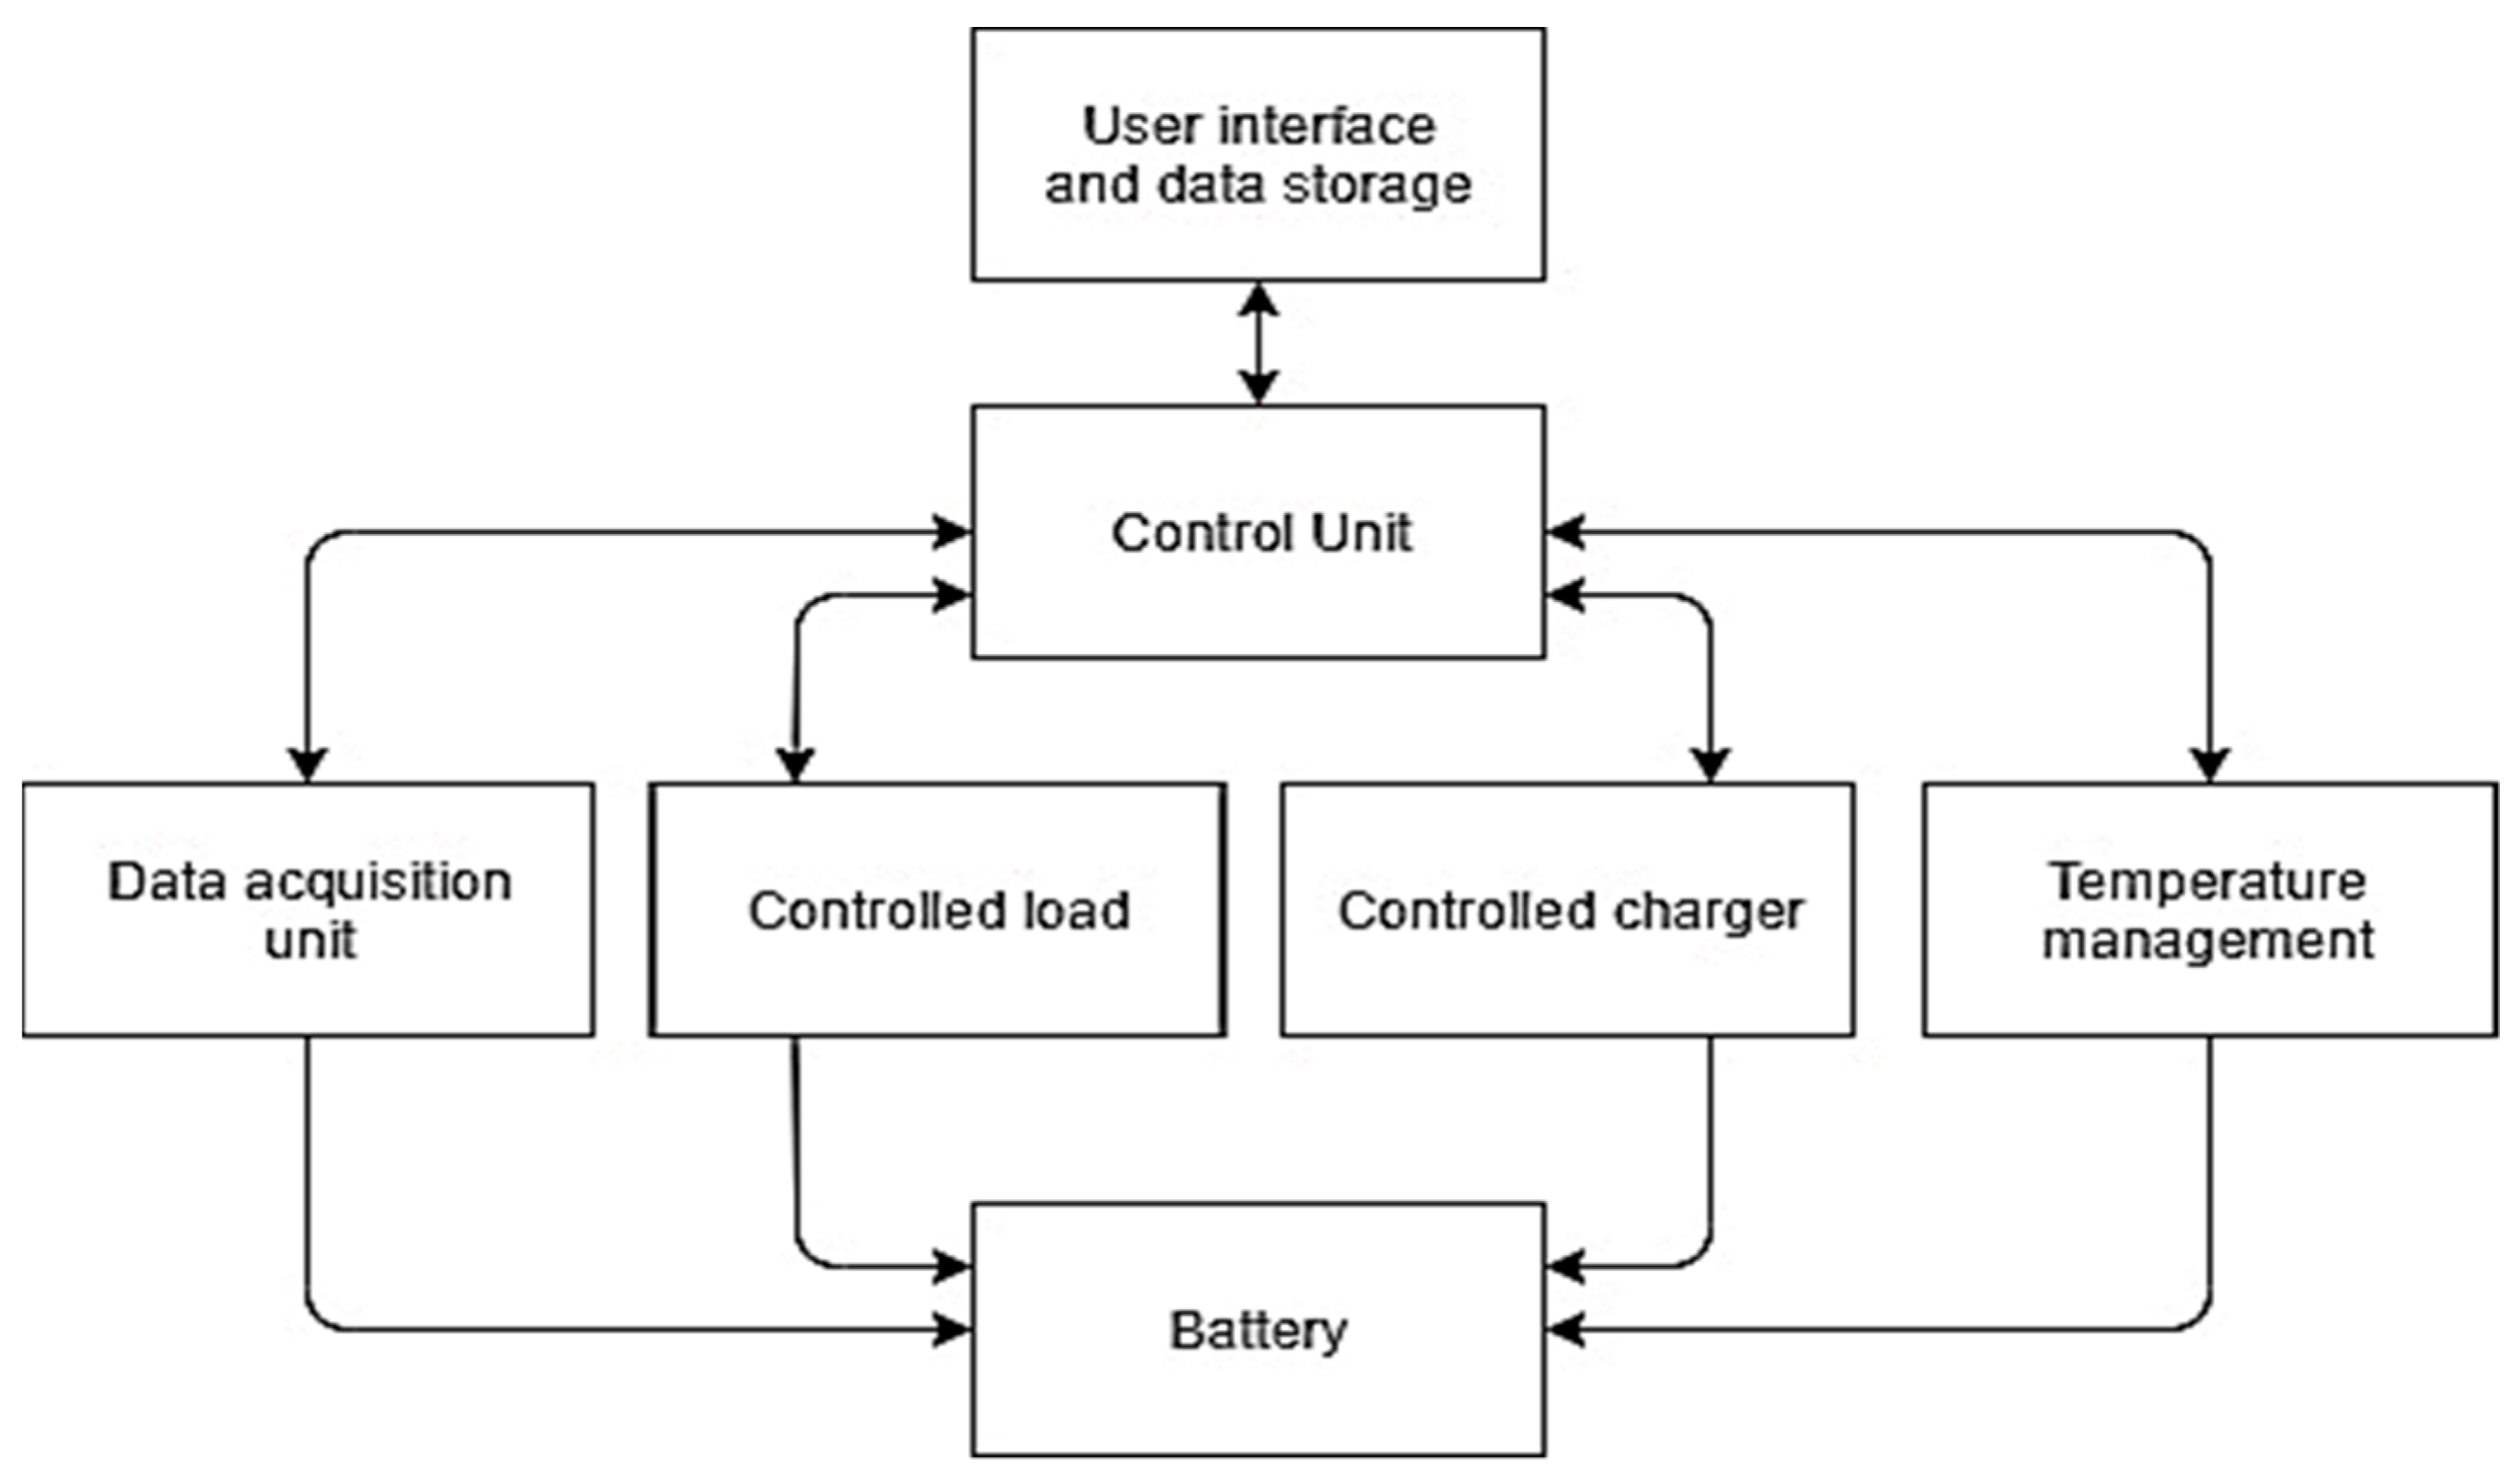
Lithium-ion cell is not a simple component that has characteristics that can be known or predicted easily; as well, these characteristics are not linearly correlated. This is due to its complex electrochemistry behavior in different conditions, and because of the different types of batteries that already exist and keep emerging every day. Consequently, many tests should be conducted in a controlled environment to classify and understand more about the characteristics of the batteries. These tests can include capacity tests, lifecycle tests, aging, internal resistance, the best temperature for different operations, optimum charging and discharging current, and testing of the maximum safe limits of the battery operation in controlled conditions to ensure safe operation in the real world. Thus, these tests are essential for battery manufacturers, developers, and researchers. The battery can be in different states: charging, discharging, or at rest (no current flow). At the same time, the temperature can be varying, and other parameters can be included too. In order to test the battery in the mentioned states, the battery tester should be automated and consist of at least: a control unit, data acquisition unit, controlled variable load unit, controlled charging unit, and possibly adding thermal management unit [
14,
15] as demonstrated in
Figure 3.
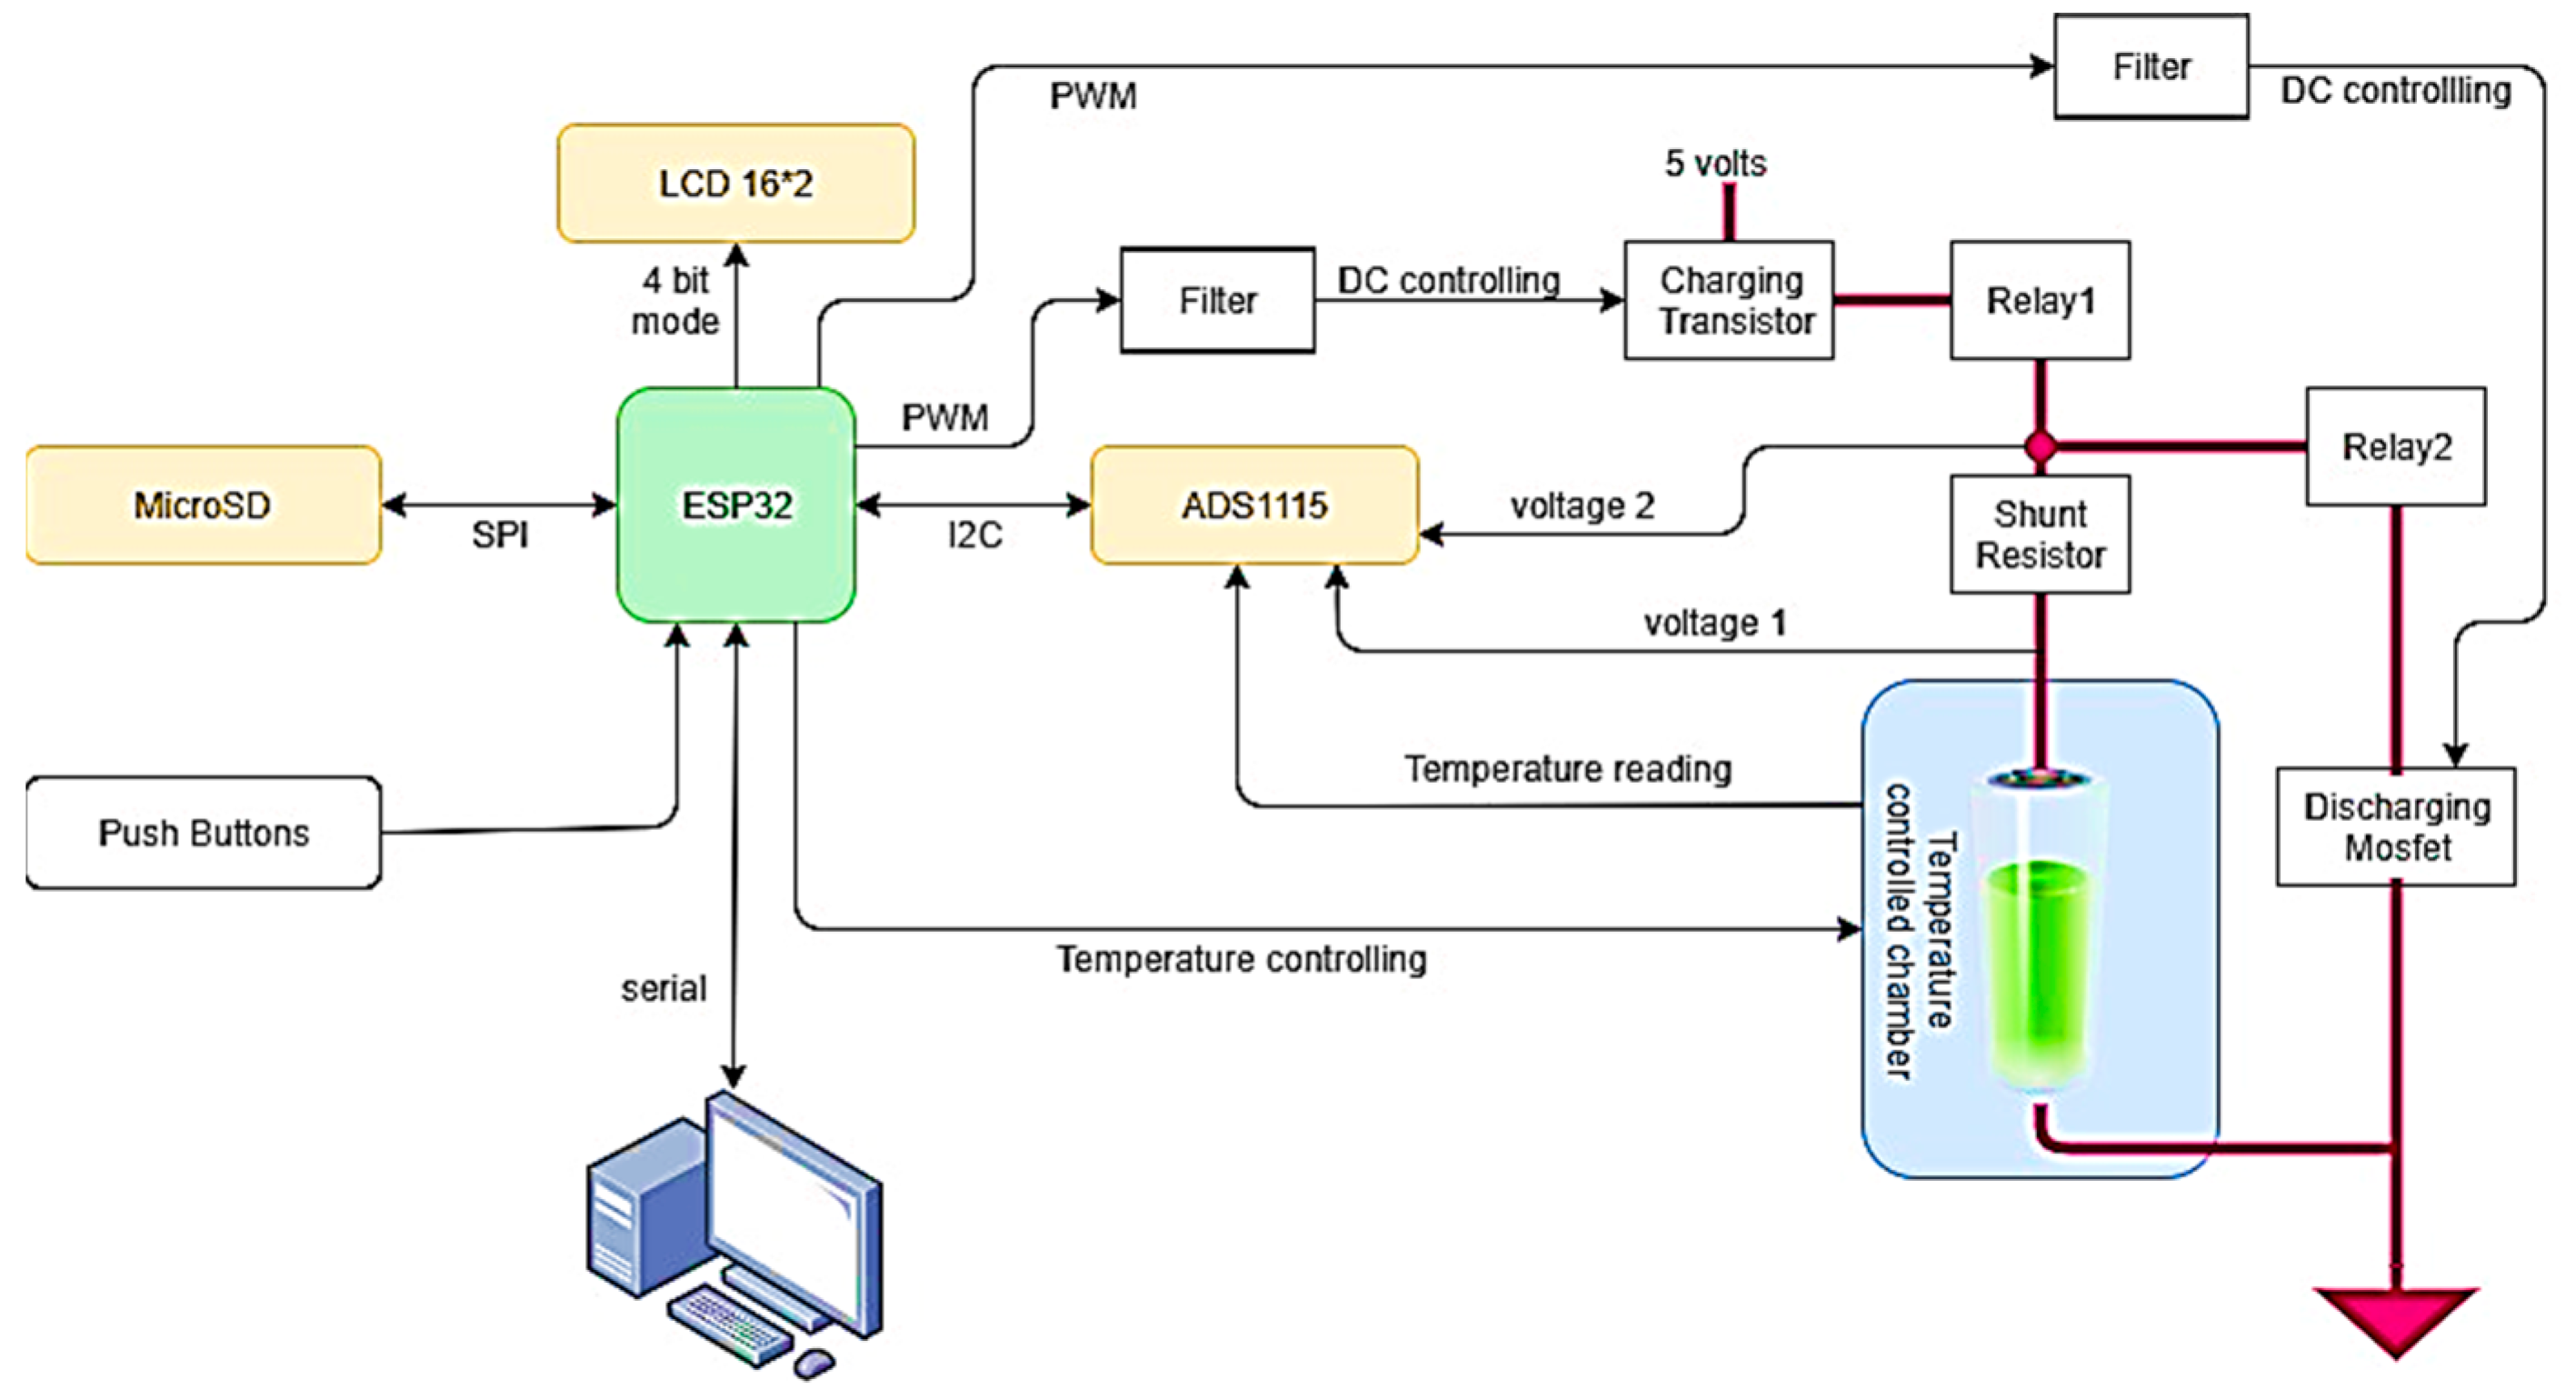
The designed system block diagram is shown in
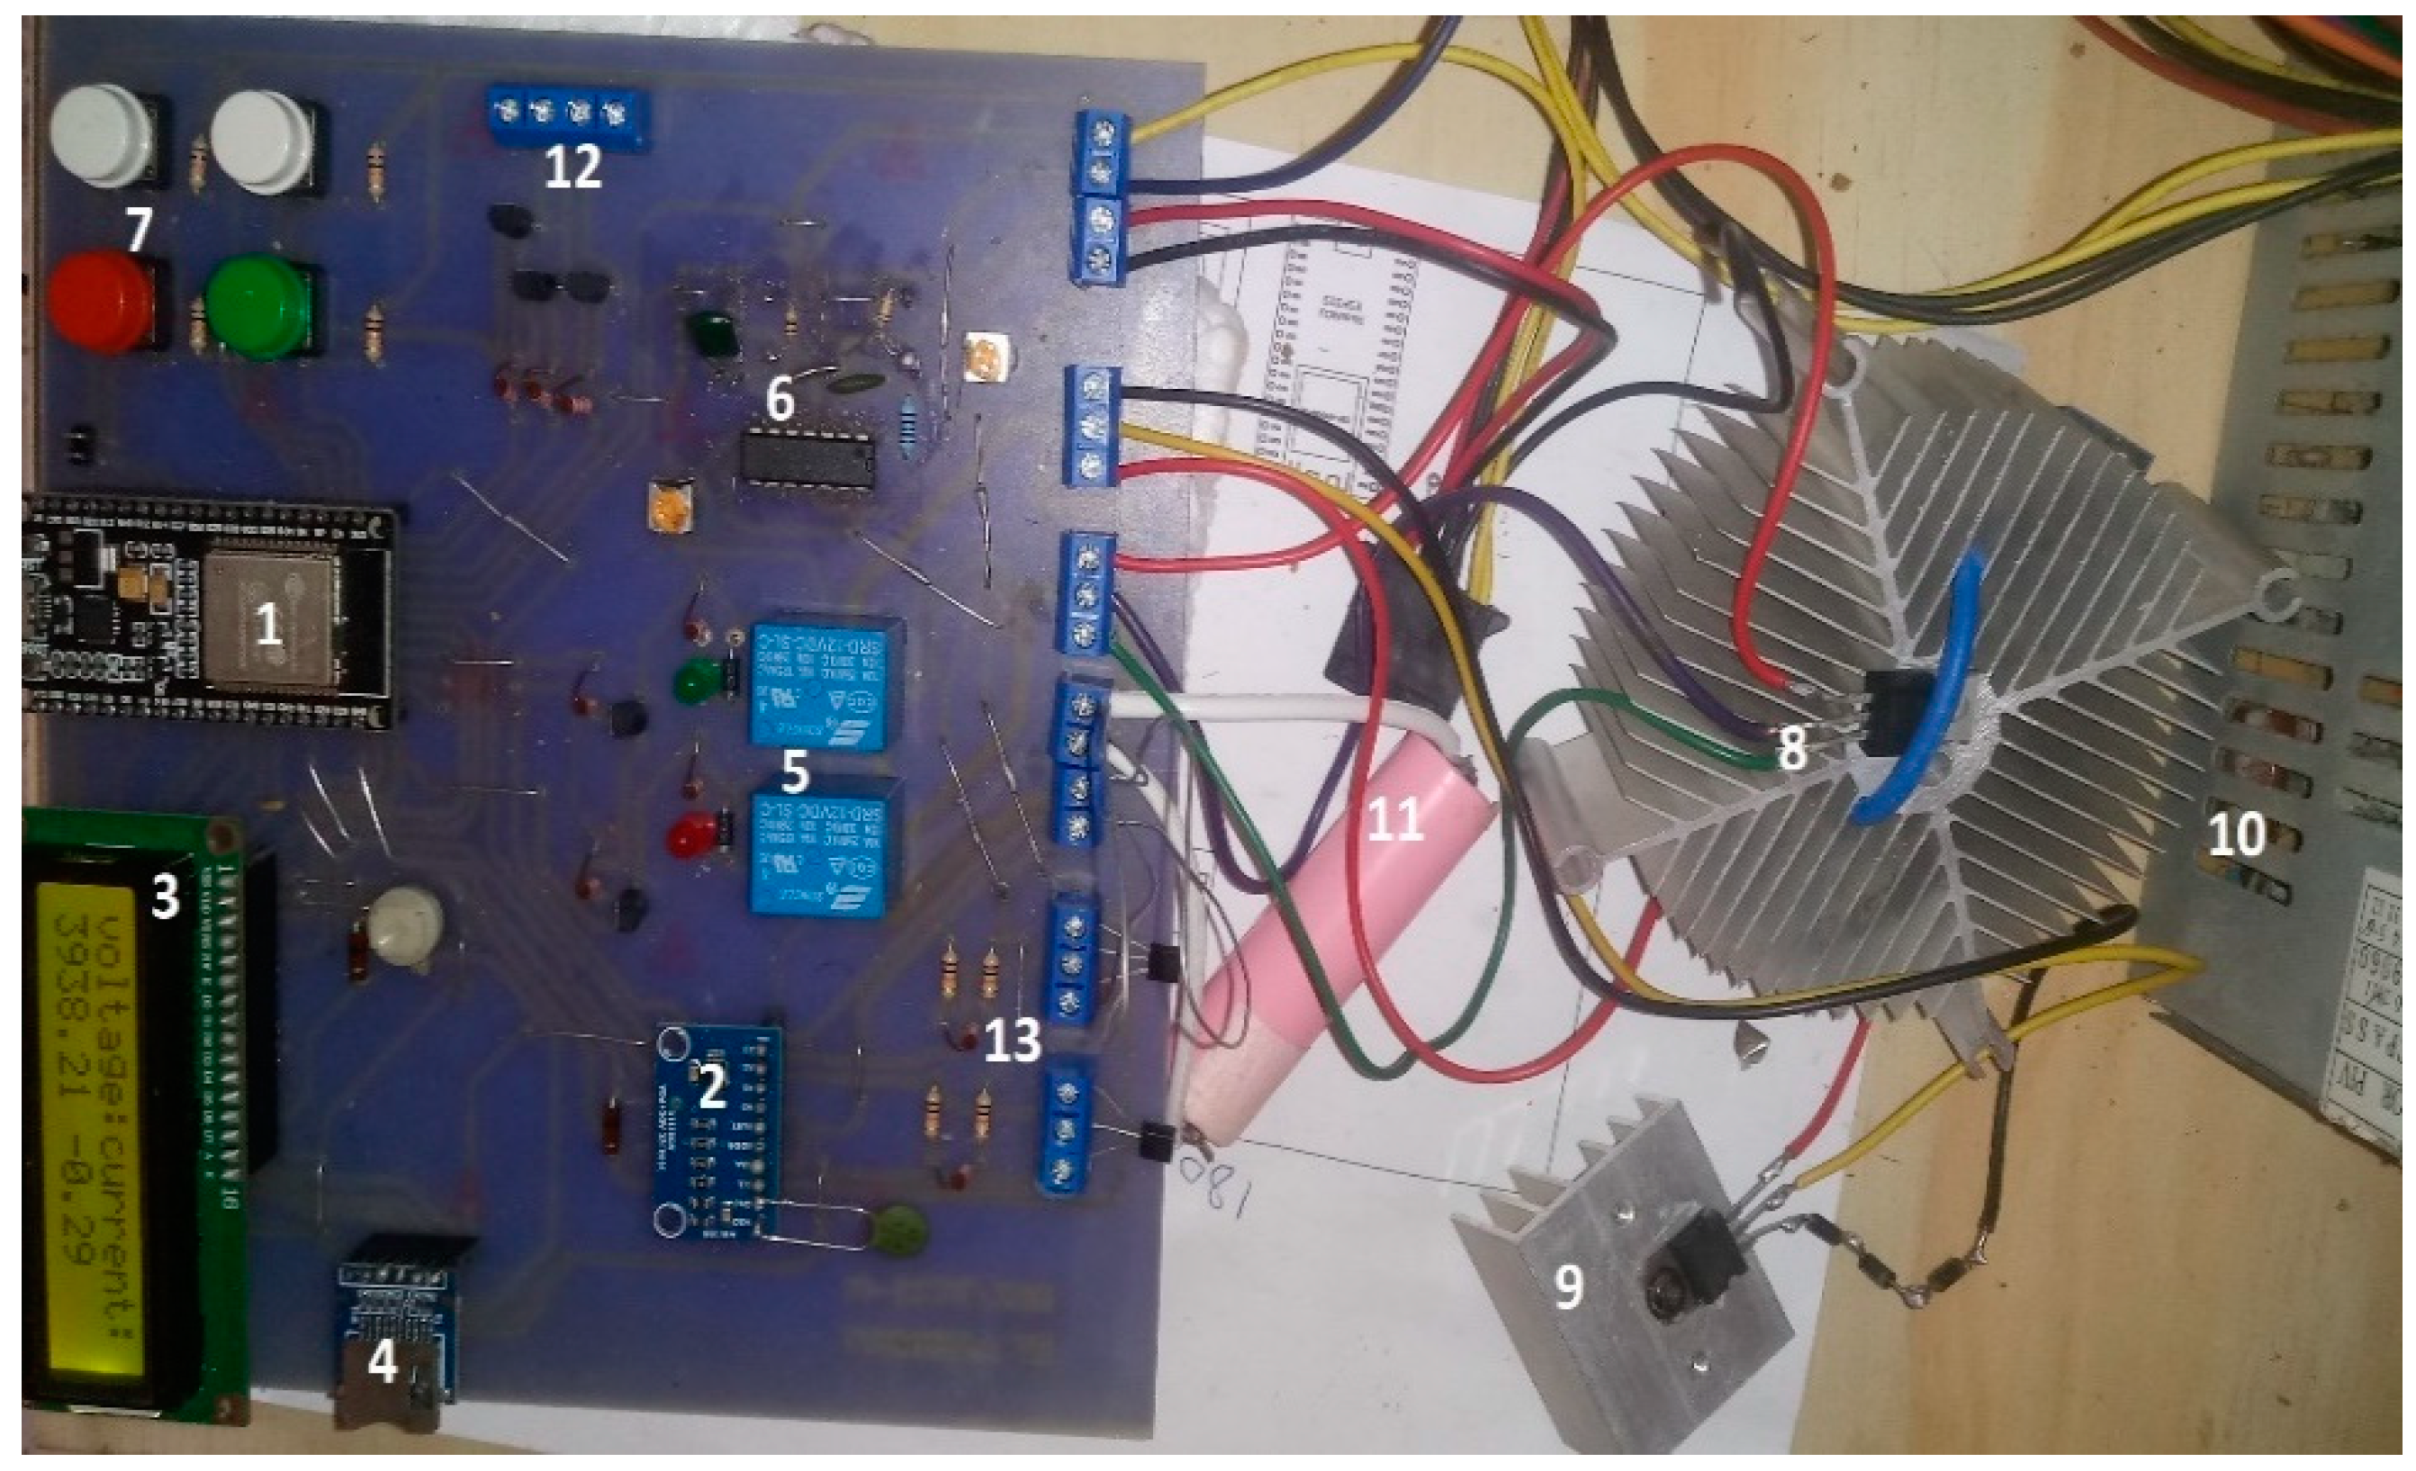
Figure 4. It consists of different components. ESP32 is the main control unit that controls the system. It has an 80 MHz processor, and 38 IO pins. It communicates with the ADS1115 and controls the LCD screen, the relays, discharging MOSFET, and charging PNP Transistor using PWM. ADS1115 is a 16-bit ADC that converts the analog signal to 16-bit 2′s complement format. It senses voltage 1, which is the voltage of the battery, and the difference between voltage 1 and voltage 2 that will be divided by the shunt resistor to get the current. The LCD display and push buttons will be the main user interface, especially when a computer is not connected. The MicroSD card will be used for data storage, as well as the test instructions that can be saved and executed without the need for a computer. For the temperature-controlled chamber, it has not yet been completely implemented. It will consist of two temperature sensors–one for the chamber, and one for the battery surface. The implemented system is shown in
Figure 5; the components used are outlined in
Table 2.
5. Results and Discussion
A number of tests were performed on an aged lithium-ion cell at room temperature (around 24 °C) with the characteristics described in
Table 3.
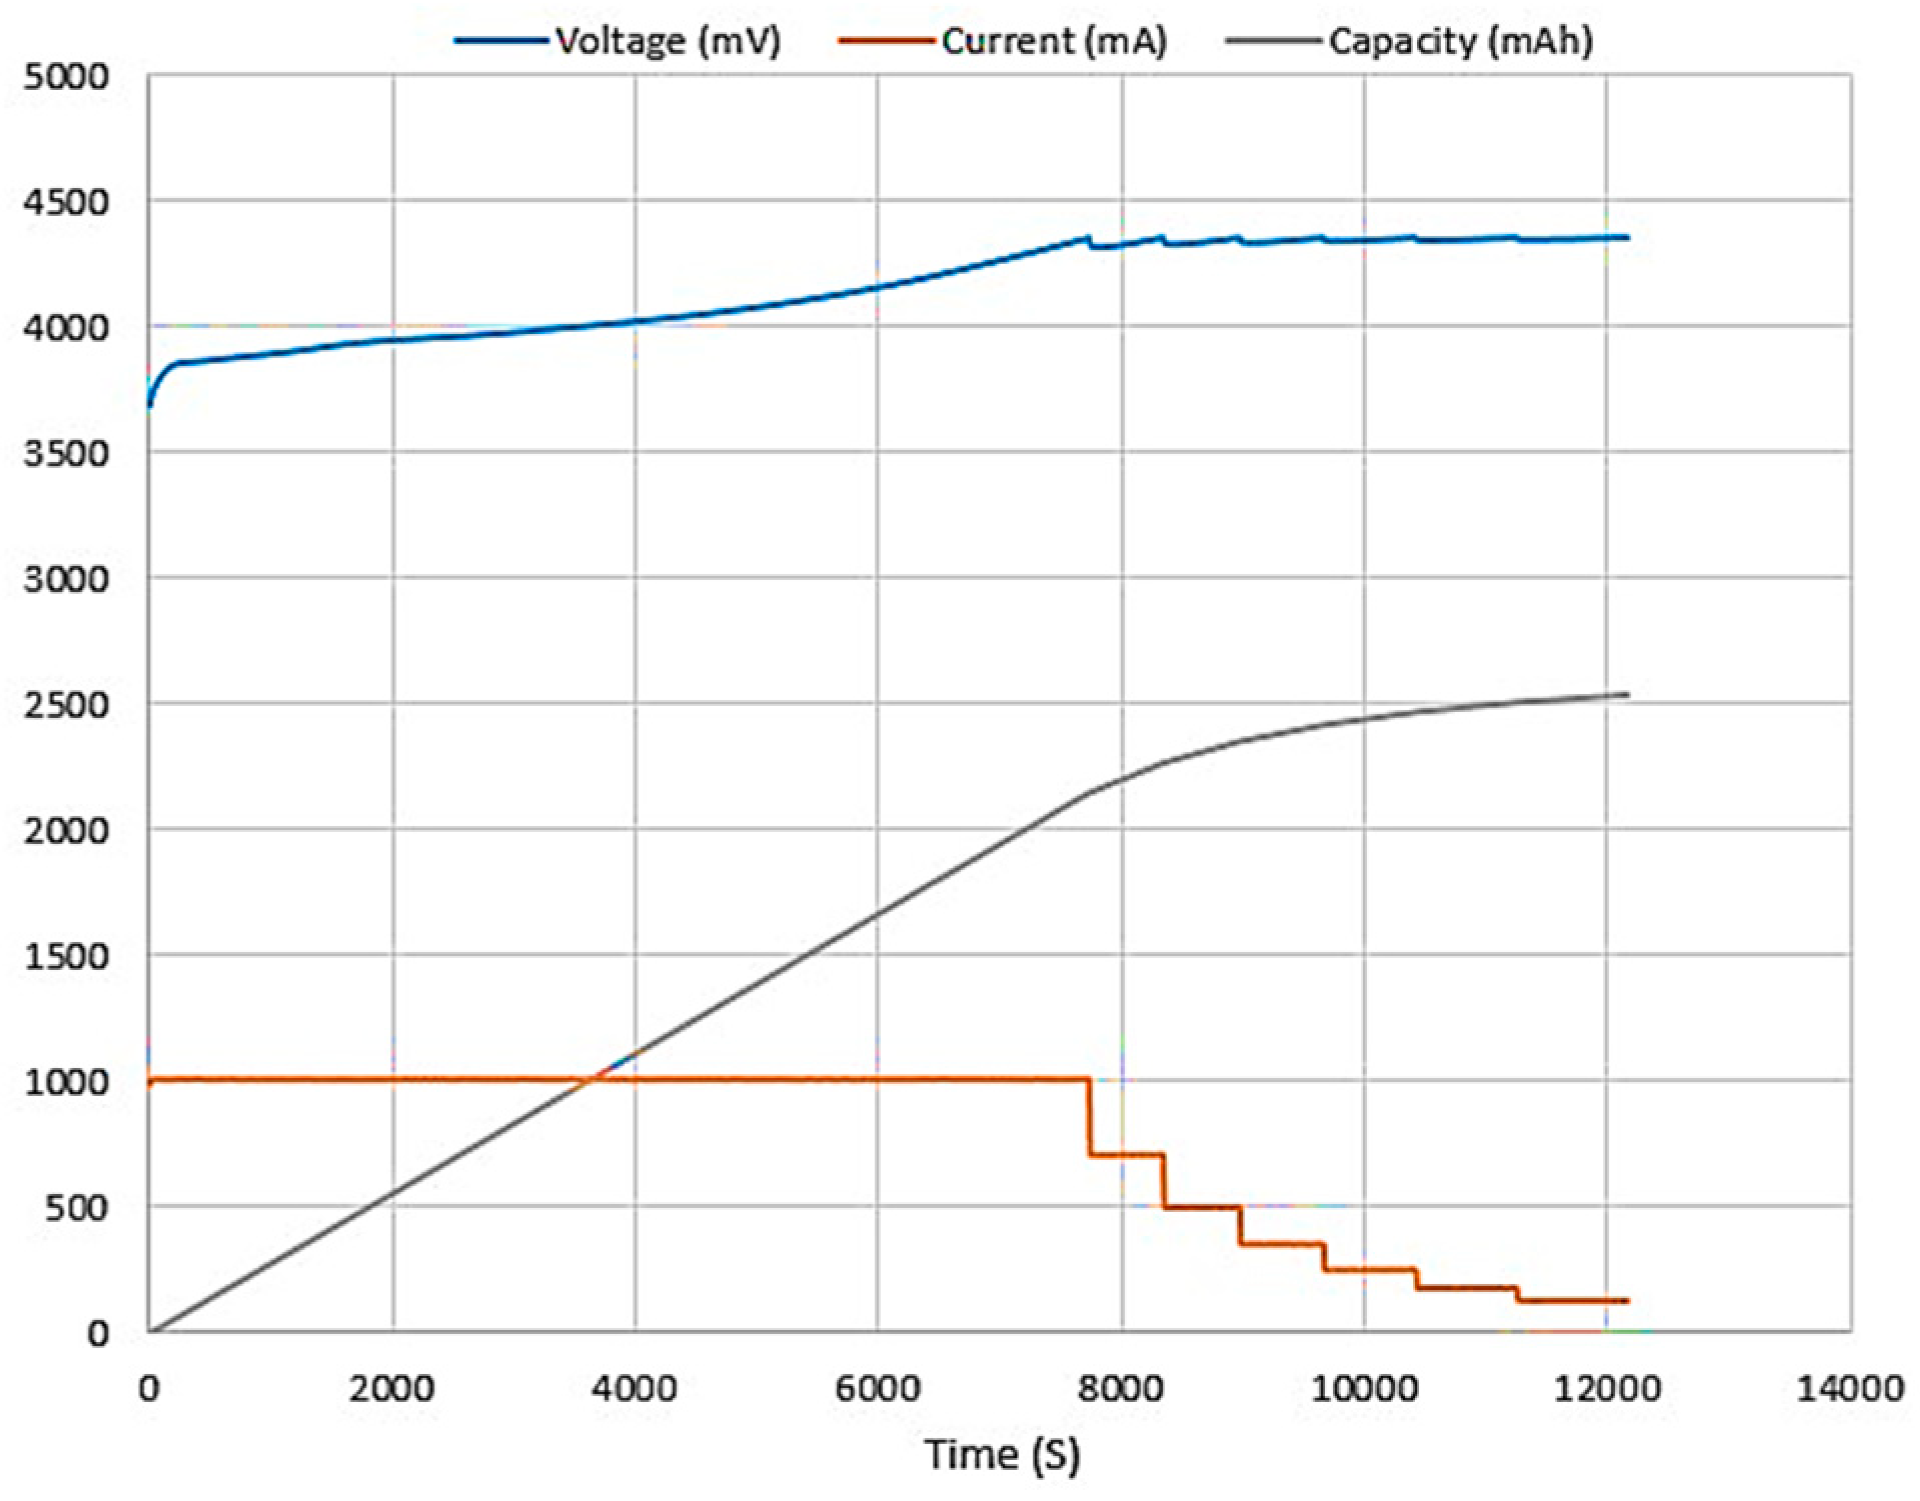
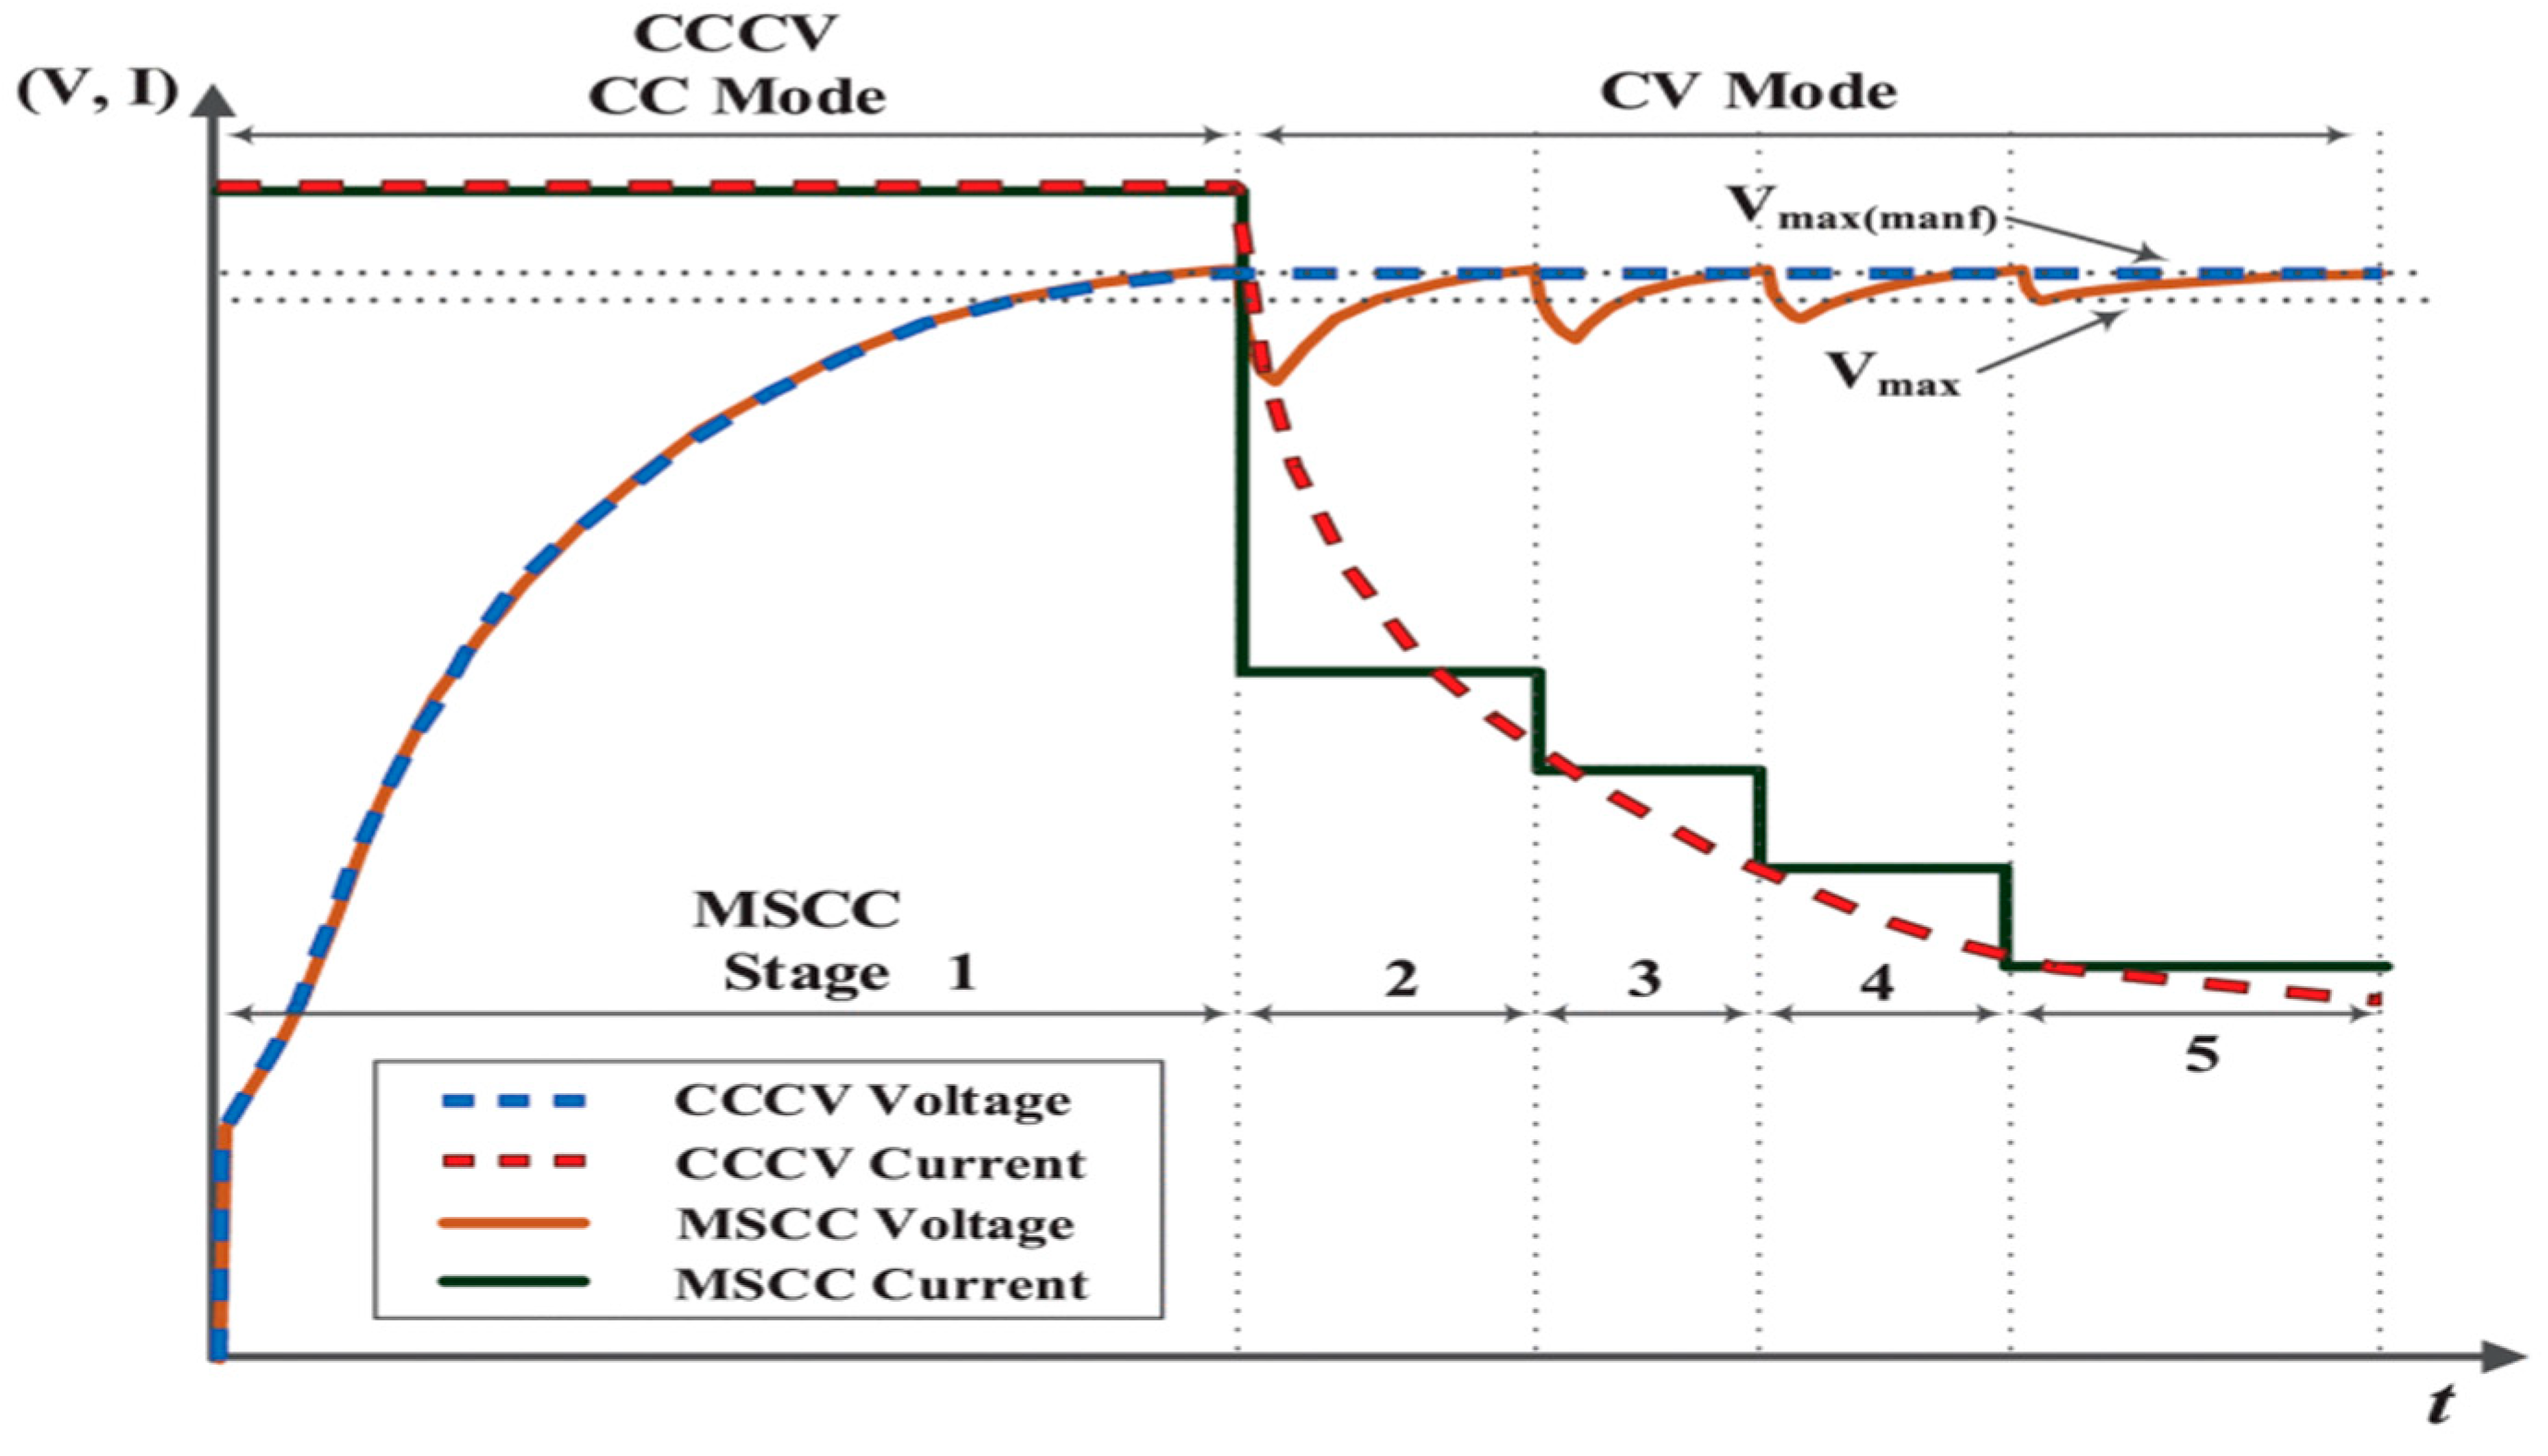
A Multistage Constant Current (MSCC) charging protocol was applied to the lithium-ion cell. The results are shown in
Figure 6, which resemble the results obtained by the study in [
16] and are illustrated in
Figure 7. During this test, the battery was charged with a constant current of 1 A until it reached 4.35 V; then, the current was stepped down to a less constant current. Thus, the voltage of the battery drops down; it is kept until it reaches 4.35 V again. The same steps were repeated until the current is less than or equal to 100 mA; then, the charging process was stopped.
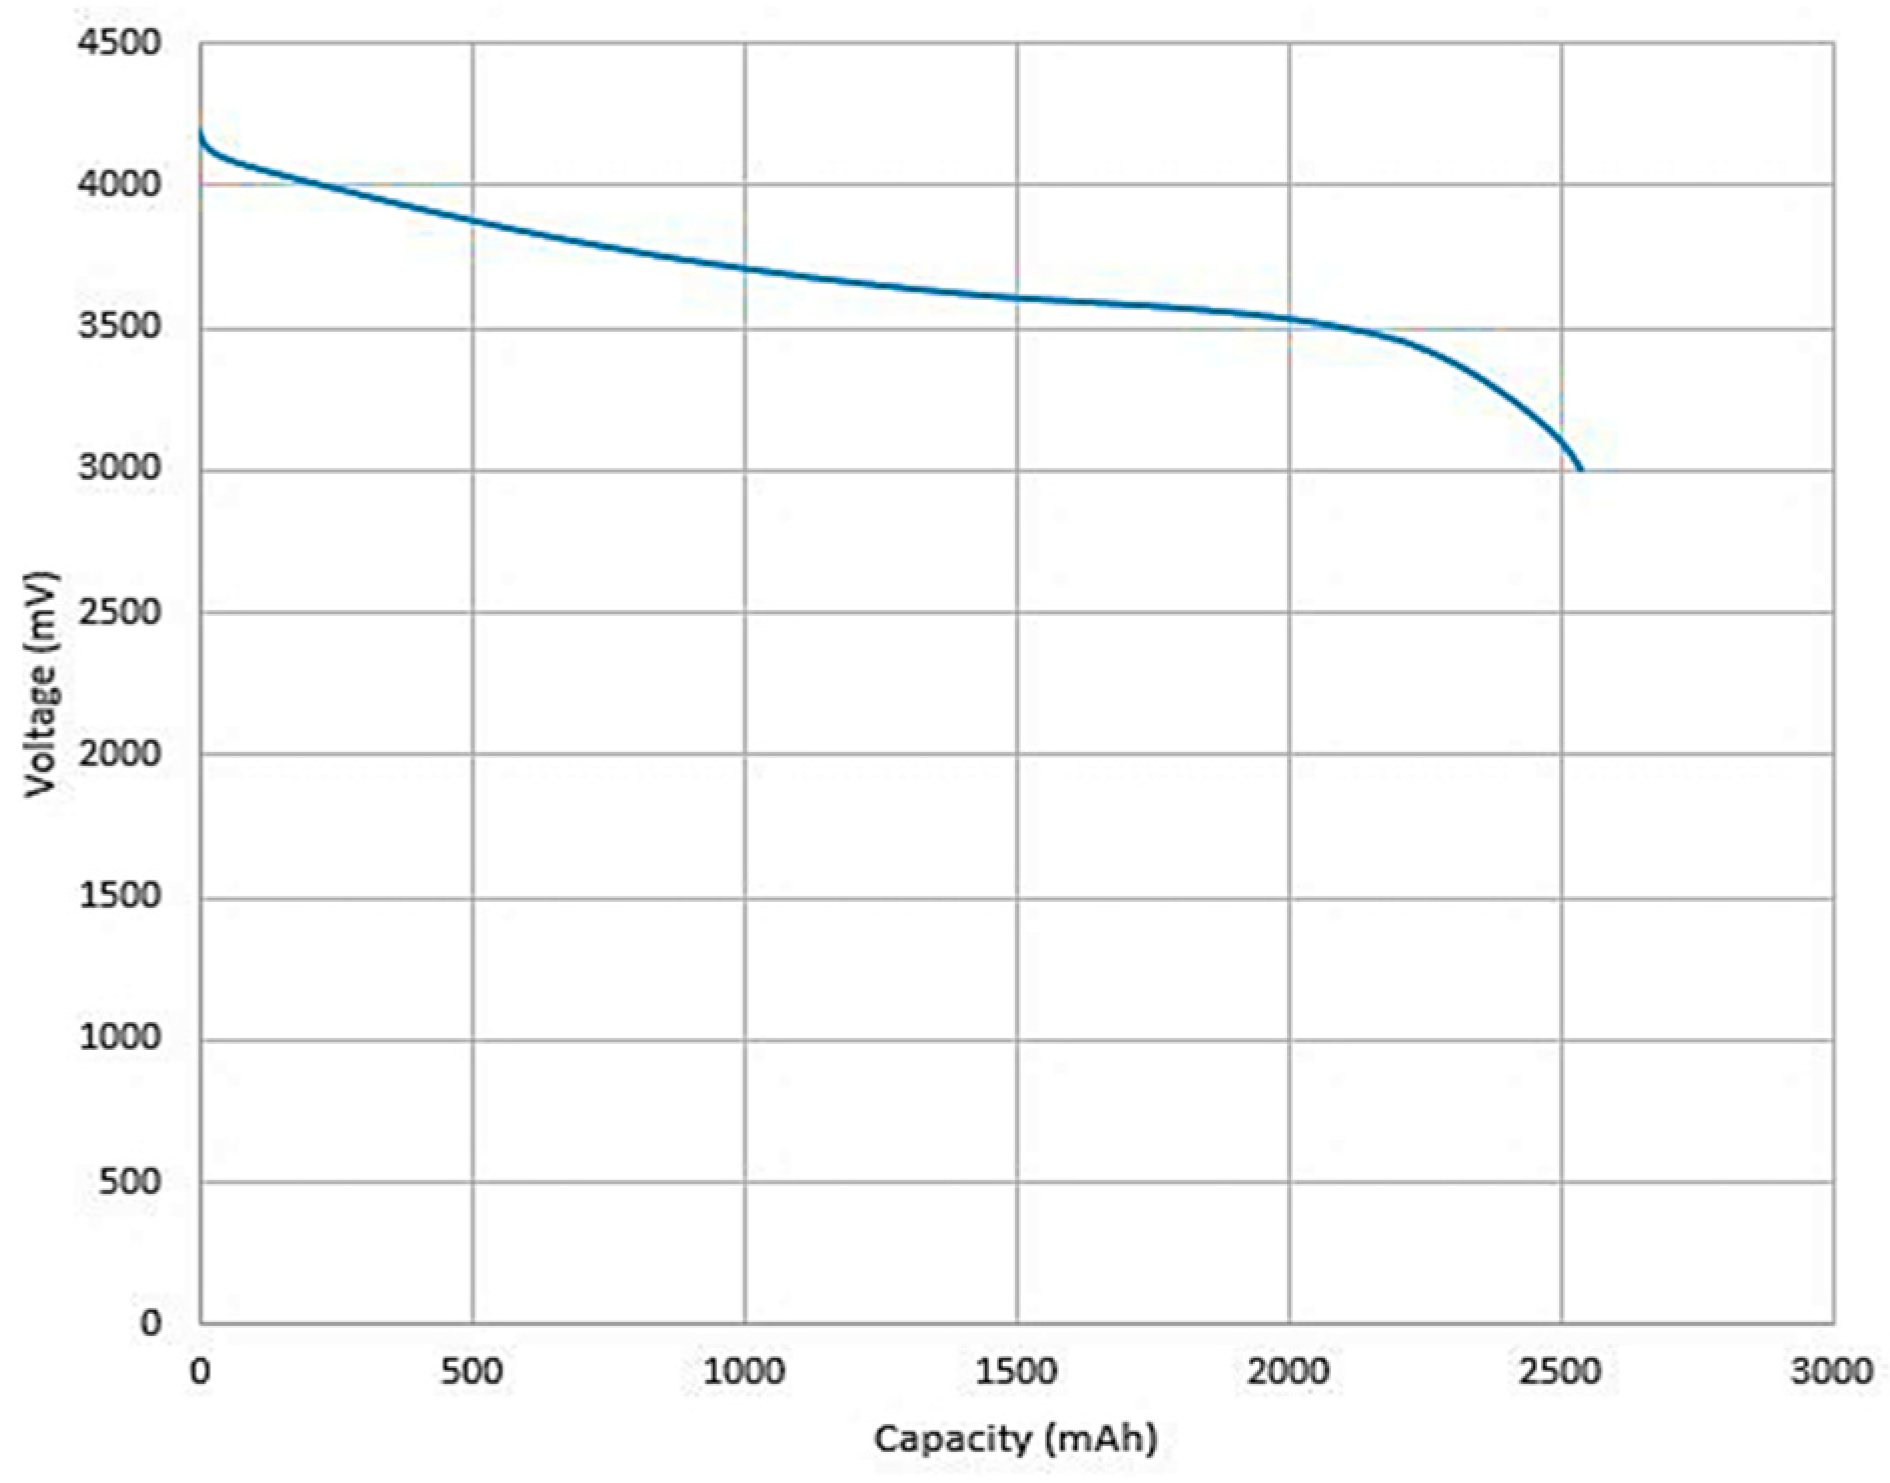
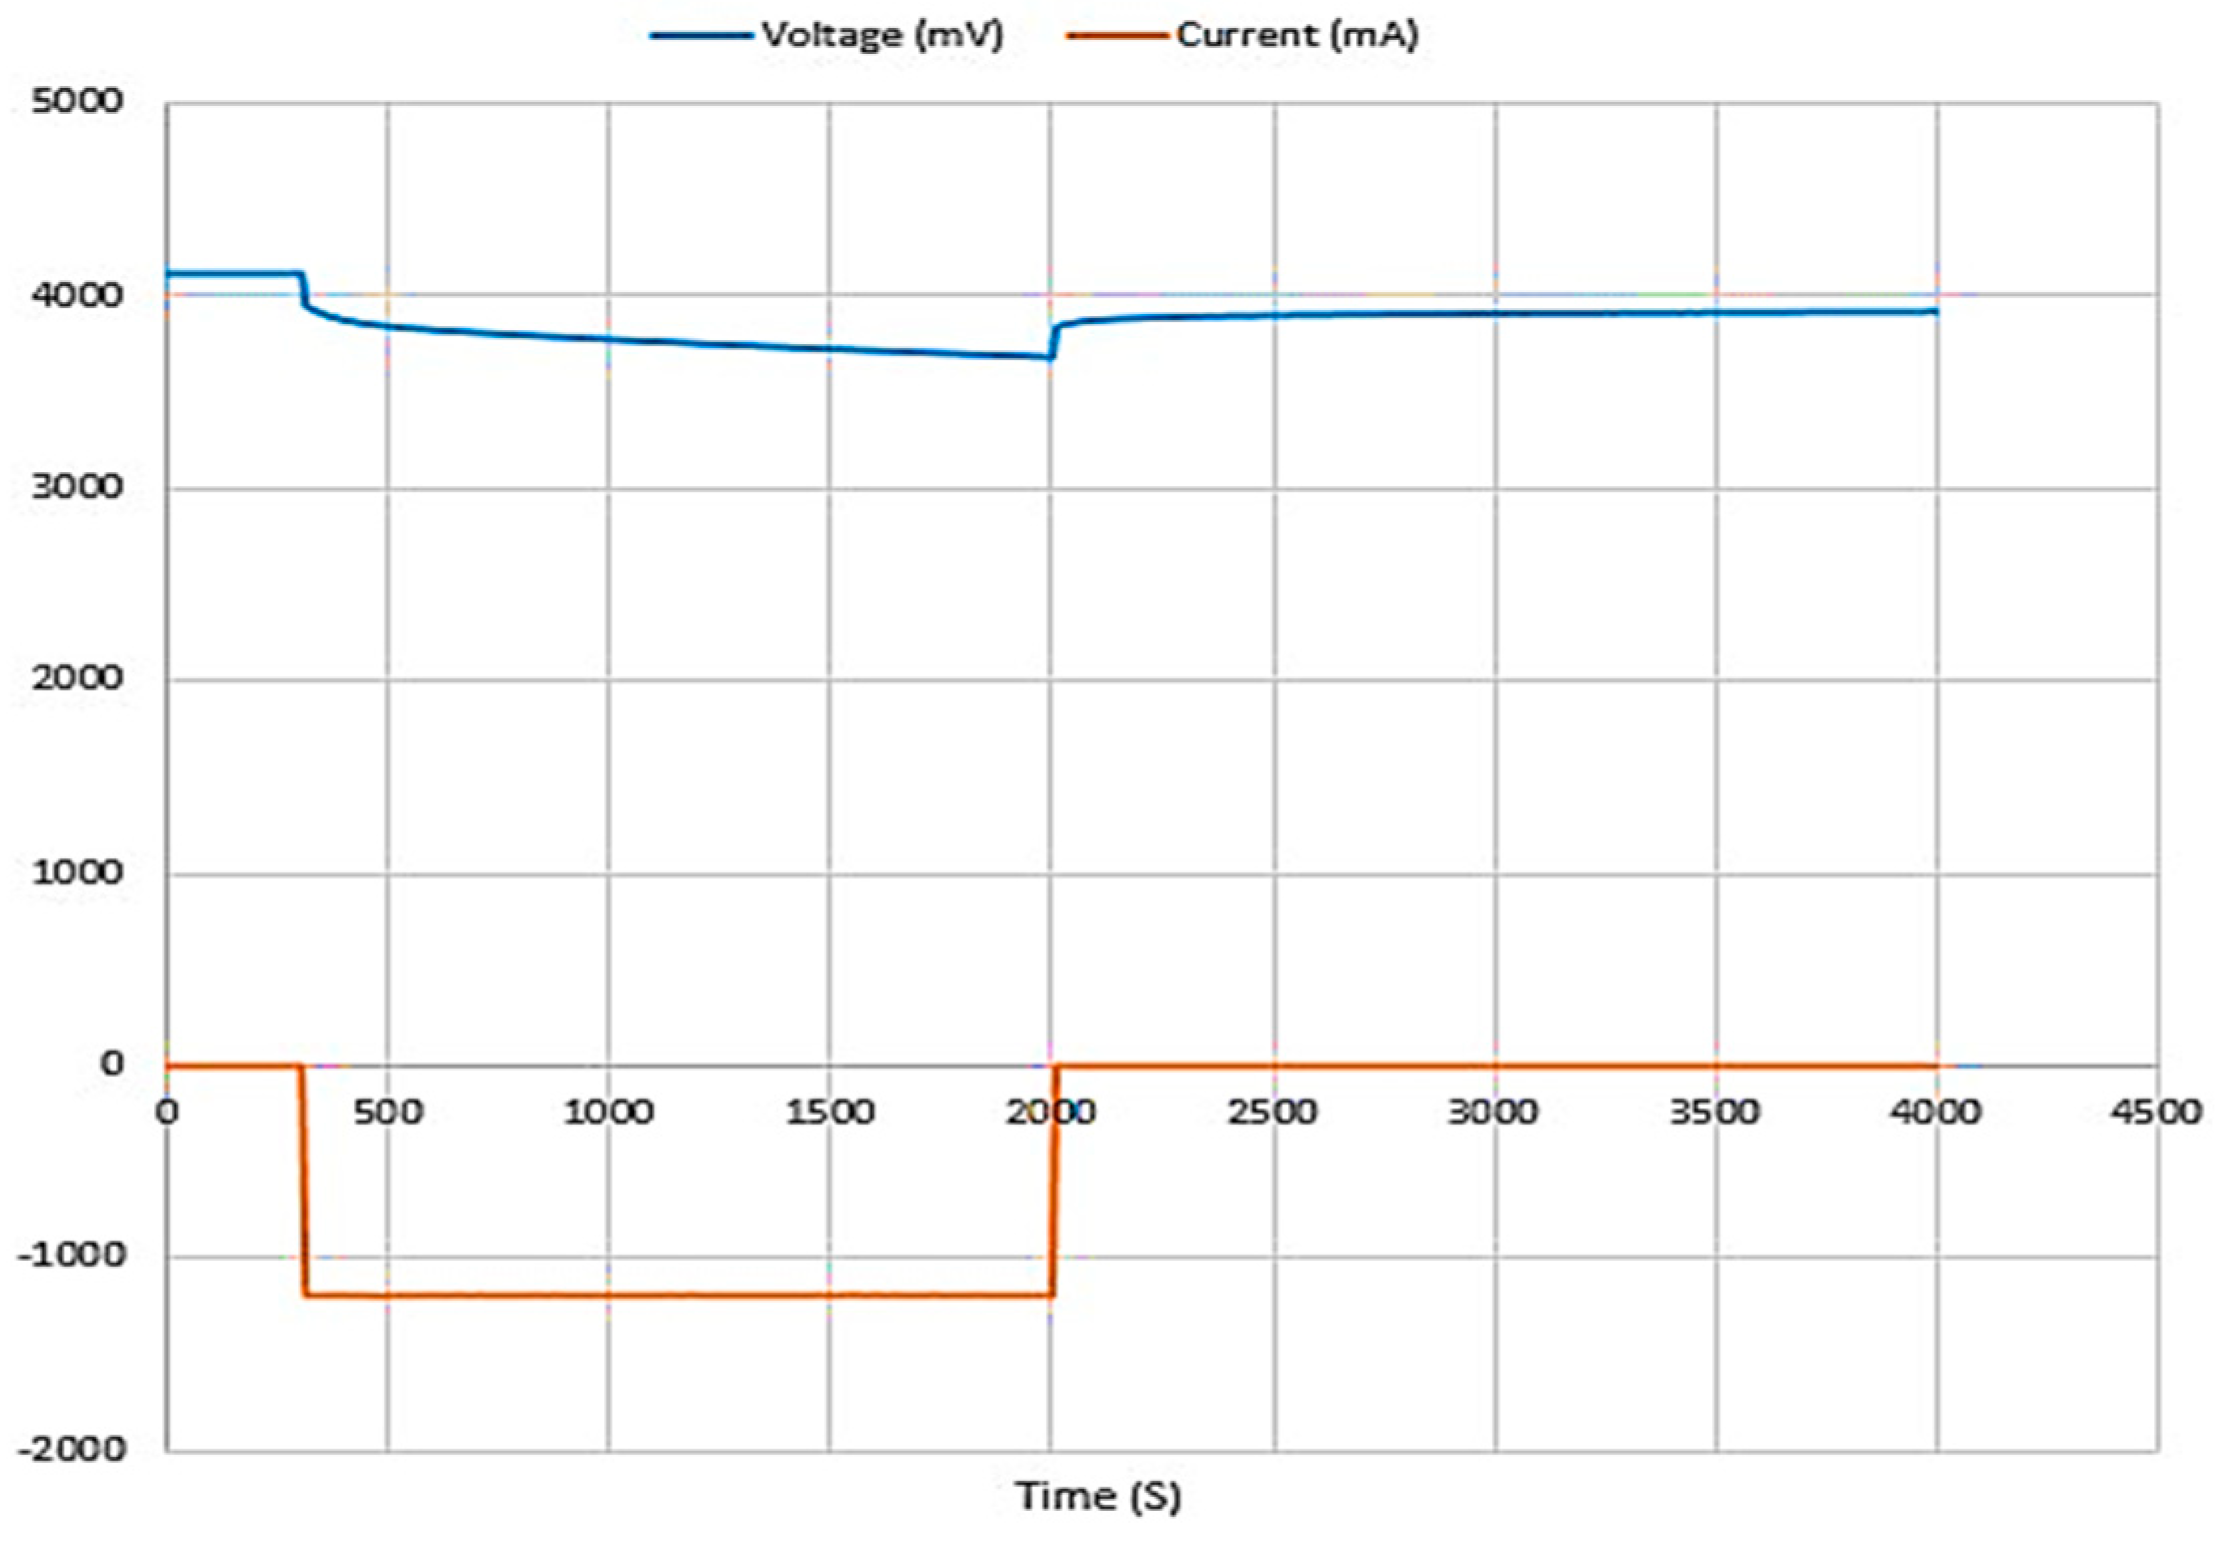
Figure 8 shows the discharging curve. The battery is discharged with 1 A constant current until the voltage reached the cutoff voltage of 3.0 V. The
x-axis represents the total capacity discharged in (mAh).
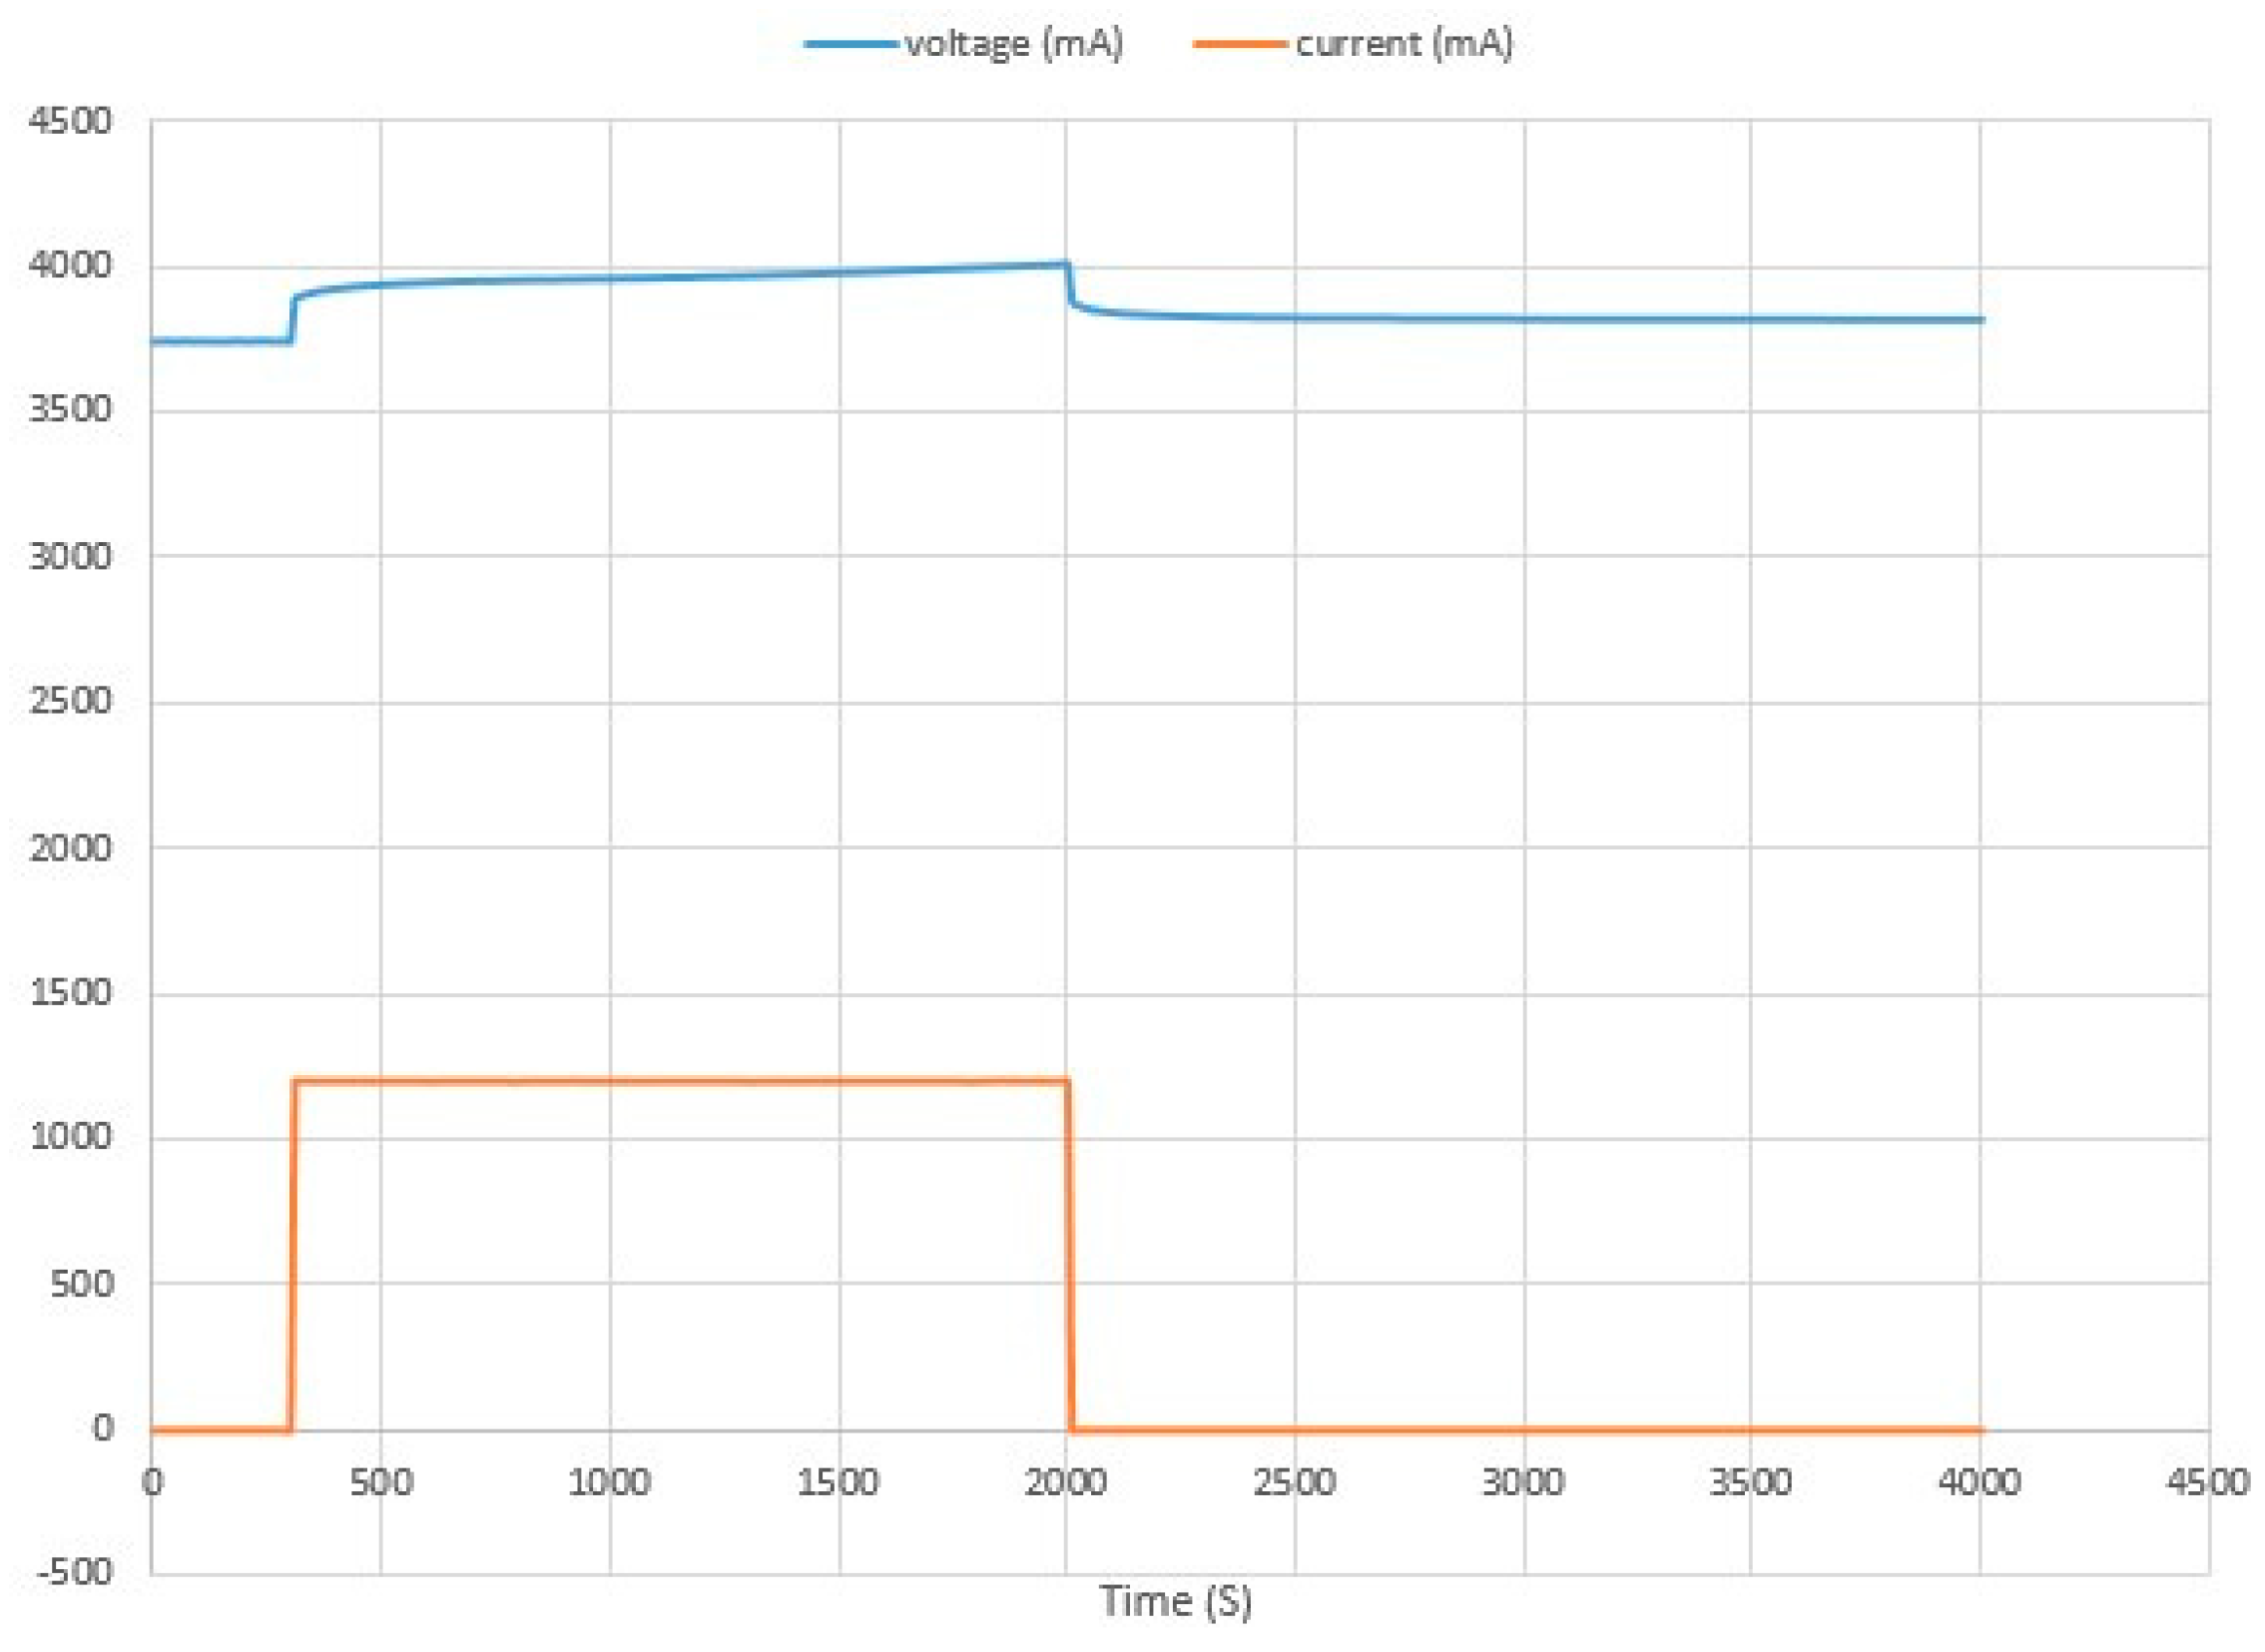
Figure 9 and
Figure 10 represent the voltage response of the battery to discharging pulse and charging pulse respectively, with the negative current denoting the discharging current.
Table 4 shows the performance characteristics of the implemented hardware. As illustrated in the results, the voltage and current resolution is less than 2 m (V or A) with a sampling rate of 35 samples/s. This led to satisfactory outcomes with a very small reading error of approximately 0.5 m (A or V). Thus, the implemented hardware can be used for some battery characterization purpose.
6. Conclusions
This work reported the progress of designing and implementing an automated battery test system. The tests performed generated acceptable results compared to results reported in the literature. The reading voltage and current error were around 0.5 m, which validates the work and makes the obtained results encouraging to carry on the implementation of a customized battery characterization system. However, work is still needed to complete the temperature-controlled chamber and the software running the overall system. In addition, the discharging and charging circuit need to be improved for more stability, better performance, and accuracy in general.
Author Contributions
Conceptualization, A.Z., H.B. and A.M.; methodology, A.Z. and H.B.; software, A.Z.; validation, H.B., A.Z. and A.M.; formal analysis, A.Z.; investigation, A.Z. and H.B.; resources, A.Z. and H.B.; data curation, A.Z.; writing—original draft preparation, A.Z. and H.B.; writing—review and editing, A.Z., H.B. and A.M.; visualization, H.B. and A.M.; supervision, H.B. and A.M.; project administration, H.B.; funding acquisition, A.Z. All authors have read and agreed to the published version of the manuscript.
Funding
This research received no external funding.
Institutional Review Board Statement
Not applicable.
Informed Consent Statement
Not applicable.
Data Availability Statement
Data is unavailable.
Conflicts of Interest
The authors declare no conflict of interest.
References
- Zhou, W.; Zheng, Y.; Pan, Z.; Lu, Q. Review on the battery model and SOC estimation method. Processes 2021, 9, 1685. [Google Scholar] [CrossRef]
- Murnane, M.; Ghazel, A. A closer look at state of charge (SOC) and state of health (SOH) estimation techniques for batteries. Analog. Devices 2017, 2, 426–436. [Google Scholar]
- Chiasson, J.; Vairamohan, B. Estimating the state of charge of a battery. In Proceedings of the 2003 American Control Conference, Denver, CO, USA, 4–6 June 2003; Volume 4, pp. 2863–2868. [Google Scholar]
- Vidal, C.; Malysz, P.; Kollmeyer, P.; Emadi, A. Machine learning applied to electrified vehicle battery state of charge and state of health estimation: State-of-the-art. IEEE Access 2020, 8, 52796–52814. [Google Scholar] [CrossRef]
- Mussi, M.; Pellegrino, L.; Restelli, M.; Trovò, F. An online state of health estimation method for lithium-ion batteries based on time partitioning and data-driven model identification. J. Energy Storage 2022, 55, 105467. [Google Scholar] [CrossRef]
- Liu, K.; Li, K.; Peng, Q.; Zhang, C. A brief review on key technologies in the battery management system of electric vehicles. Front. Mech. Eng. 2019, 14, 47–64. [Google Scholar] [CrossRef] [Green Version]
- Lee, S.; Kim, J.; Lee, J.; Cho, B.H. State-of-charge and capacity estimation of lithium-ion battery using a new open-circuit voltage versus state-of-charge. J. Power Sources 2008, 185, 1367–1373. [Google Scholar] [CrossRef]
- Zheng, F.; Xing, Y.; Jiang, J.; Sun, B.; Kim, J.; Pecht, M. Influence of different open circuit voltage tests on state of charge online estimation for lithium-ion batteries. Appl. Energy 2016, 183, 513–525. [Google Scholar] [CrossRef]
- Ng, K.S.; Moo, C.S.; Chen, Y.P.; Hsieh, Y.C. Enhanced coulomb counting method for estimating state-of-charge and state-of-health of lithium-ion batteries. Appl. Energy 2009, 86, 1506–1511. [Google Scholar] [CrossRef]
- Rzepka, B.; Bischof, S.; Blank, T. Implementing an Extended Kalman Filter for SoC Estimation of a Li-Ion Battery with Hysteresis: A Step-by-Step Guide. Energies 2021, 14, 3733. [Google Scholar] [CrossRef]
- He, H.; Xiong, R.; Fan, J. Evaluation of lithium-ion battery equivalent circuit models for state of charge estimation by an experimental approach. Energies 2011, 4, 582–598. [Google Scholar] [CrossRef]
- Cuadras, A.; Kanoun, O. SoC Li-ion battery monitoring with impedance spectroscopy. In Proceedings of the 2009 6th International Multi-Conference on Systems, Signals and Devices, Djerba, Tunisia, 23–26 March 2009; pp. 1–5. [Google Scholar]
- How, D.N.; Hannan, M.A.; Lipu, M.H.; Ker, P.J. State of charge estimation for lithium-ion batteries using model-based and data-driven methods: A review. IEEE Access 2019, 7, 136116–136136. [Google Scholar] [CrossRef]
- Pascoe, P.E.; Anbuky, A.H. Automated battery test system. Measurement 2003, 34, 325–345. [Google Scholar] [CrossRef]
- Alessandrini, S.; Rizzuto, E.; Del Prete, Z. Characterizing different types of lithium-ion cells with an automated measurement system. J. Energy Storage 2016, 7, 244–251. [Google Scholar] [CrossRef]
- Imran, R.M.; Li, Q.; Flaih, F.M.F. An Enhanced Lithium-Ion Battery Model for Estimating the State of Charge and Degraded Capacity Using an Optimized Extended Kalman Filter. IEEE Access 2020, 8, 208322–208336. [Google Scholar] [CrossRef]
| Disclaimer/Publisher’s Note: The statements, opinions and data contained in all publications are solely those of the individual author(s) and contributor(s) and not of MDPI and/or the editor(s). MDPI and/or the editor(s) disclaim responsibility for any injury to people or property resulting from any ideas, methods, instructions or products referred to in the content. |
© 2023 by the authors. Licensee MDPI, Basel, Switzerland. This article is an open access article distributed under the terms and conditions of the Creative Commons Attribution (CC BY) license (https://creativecommons.org/licenses/by/4.0/).


