Proceeding Paper

Experimental Analysis of Soiling Loss on PV Module in Cement Plant Environment †

Department of Electrical Engineering, University of Engineering and Technology Taxila, Rawalpindi 47050, Pakistan
*
Author to whom correspondence should be addressed.
Presented at the 7th International Electrical Engineering Conference, Karachi, Pakistan, 25–26 March 2022.
Eng. Proc. 2022, 20(1), 13; https://doi.org/10.3390/engproc2022020013
Published: 29 July 2022
(This article belongs to the Proceedings of The 7th International Electrical Engineering Conference)

Abstract

:
The soiling phenomenon occurs when photovoltaic panels are covered with layers of dust resulting in the reduction of radiation reaching the panels, thus reducing PV performance. This research focuses on the PV performance degradation due to soiling and the chemical composition of dust particles. Four types of dust samples having different physical, chemical, and optical properties were collected for experimental analysis. Three of them were coal, cement, and iron oxide, which are extensively used in cement plants, collected to investigate the impact of darker color dust on albedo and hence on the transmission of sunlight, and the fourth sample was named as panel dust, collected from solar plates installed at a cement plant. The experimental results show that the transmission of sunlight strongly depends on particle size distribution. Fine particles increase the transmission loss and degrade the performance of the solar cell more than larger ones, as these particles leave no empty spaces between grains and hence do not allow sunlight to reach the solar cell, while randomly accumulated larger particles leave voids between grains, allowing light to penetrate. Moreover, albedo and a higher quantity of iron oxide in dust boost the absorption of sunlight and play a significant role in the scattering and attenuation of solar irradiance.

1. Introduction

External environmental conditions badly affect the PV performance in lowering energy generation. One of these conditions, which remains mostly unnoticed and underestimated, is soiling. Soiling is the phenomenon in which dust particles accumulate on the PV panel surface and prevent sunlight from reaching the active part of the solar cells. The power generation of a PV module was lowered by up to 35% due to a thick coating of dust collected on the PV surface [1]. Dust causes spectrum filtering, which decreases the PV module’s input energy depending on the size and chemical structure of the dust particles. Smaller size particles are carried by the wind at a low speed and are likely to obstruct more solar energy and cause greater light scattering. Small dust particles are more evenly distributed on the PV surface, have a greater dust deposition rate, and adhere to the surface better than larger dust particles [2]. The authors in [3] were the first to investigate the impact of dust on the performance of solar panels in detail. Artificial dust (limestone, cement, and carbon particles) and halogen lights were used for the experiment-based study in a laboratory. It was discovered that the cement particles had the largest influence, with a 80 % reduction in short-circuit current at a dust density of 73 g/m2. In [4], it was found that accumulated dust at a density of only 4 g/m2 on the PV module may lower the output power generated by 40 % . The authors in [5] conducted studies with artificial impurities ranging in size from 1 to 100 μm and observed that particle accumulation lowered the PV module Isc current considerably while having no effect on the module Voc voltage. It was also discovered that as dust density increased from 0 to 22 g/m2, the PV module performance reduced linearly from 0 to approximately 26%.
An experimental study was conducted about soiling on a solar power plant by using its natural dust samples. Its analysis showed that soiling losses depend on the climatological condition of the site. Considering the same weather condition and equal dust density on the PV module, smaller size particles lead to a more severe drop in the transmission of light than larger particles. Moreover, the darker color of particles enhances the absorption of light, increasing further transmission losses due to layers of dust [6]. An experiment was conducted to gain an understanding about the reduction in the transmission of light caused by different layers of soiling. A PV glass surface was covered with dust layers of cement, limestone, and carbon and was analyzed separately. It was found that the Isc current was decreased by up to 20 % of its initial value for the carbon particles with a dust density of just 28 g/m2, but the same reduction was noted with 73 g/m2 dust density of cement, 125 g/m2 for a particle size of 50 µm, 168 g/m2 for 60 µm, and 250 g/m2 for 80 µm limestone dust. The material composition of the dust was particularly mentioned as having an impact on the PV performance. According to findings, carbon particles absorb more sun radiation compared to other dust types [7].
In an experimental study, the output power loss of several PV modules was investigated by using different types of dust particles accumulated on PV plates due to dust pollution. Its findings revealed that dust pollution has a substantial impact on the energy production of PV modules. As the deposited dust density increased from 0 to 22 g/m2, the loss in PV output performance increased from 0 to 26% [8]. It was pointed out in an experiment that finer particles, with a higher specific surface to volume ratio, may cause greater performance degradation in photovoltaic modules than bigger particles for the same quantity of dust [9].

2. Methodology

2.1. Experimental Set Up

The solar power plant which is the subject of this study is installed at a cement plant and has a capacity of 6.44 MW. This solar plant consists of LR5-72HPH-540M type mono crystalline PV panels. Each panel has dimensions of 2256 × 1133 × 35 mm with 540 W maximum power generating capacity. During this analysis, the PV panels were directed at a tilt angle β = 15° and azimuth at true south.

2.2. Laboratory Analysis

The dust samples were collected during the month of November 2021. The comparison of panel dust was carried out with coal, cement, and iron oxide dust collected from different areas of the cement plant. Cotton pieces were used for the collection of the dust. The following tests were performed for testing the attributes of the dust.

2.2.1. Albedo Measurement

The soiling layer on the top of PV panels has its own reflective and absorptive properties. Albedo measurement was performed using the brightness function in ImageJ. A dust sample was spread uniformly on white A4 paper and a picture of this sample was taken for analysis in the ImageJ program. To calculate the albedo δ, the mean brightness of each dust sample B(ds) was divided by the mean brightness of the white paper B(wp) and the result was multiplied with the white paper albedo ( δ w p = 0.65 ) as shown in the equation below:
Albedo   ( δ ) = B ( d s ) B ( w p ) δ w p

2.2.2. Chemical Composition of Dust

An XRF spectrometer, model ARL OPTIM’X from Thermo Scientific, was used to find the quantity of each molecule; the amount of iron oxide in the dust especially gives insight into its impact on PV performance.

2.2.3. Particle Size Distribution

Sieve analysis was performed to find the particle size. To calculate the PSD of a dust sample, the diameter di of each particle is multiplied with the volume vi in percentage and summation of the whole distribution is performed. The number of digits is reduced by dividing the result by 1000 as given in the equation below:
PSD = i = 1 N [ ( d i a ) i ( V o l ) i ] 1000

2.2.4. Transmission Measurement

A UV-Vis spectrophotometer (CECIL CE 7400s) was used for transmission measurement at various dust densities. For this purpose, the dust was distributed uniformly onto glass plates with an area of 5 cm2. To find the dust density ρ , the mass of clean and dust contaminated plates is measured, respectively, and the difference is divided by the area of the glass plate as shown below:
Dust   density   ( ρ ) = m c o n m c l A
where mcon denotes the mass of the contaminated plate, mcl represents the clean plate, and A represents the area of the glass plate. The spectral transmission curves of the dust samples at different dust densities were compared to find the optical properties of particles involved in sun light attenuation.

3. Results and Discussion

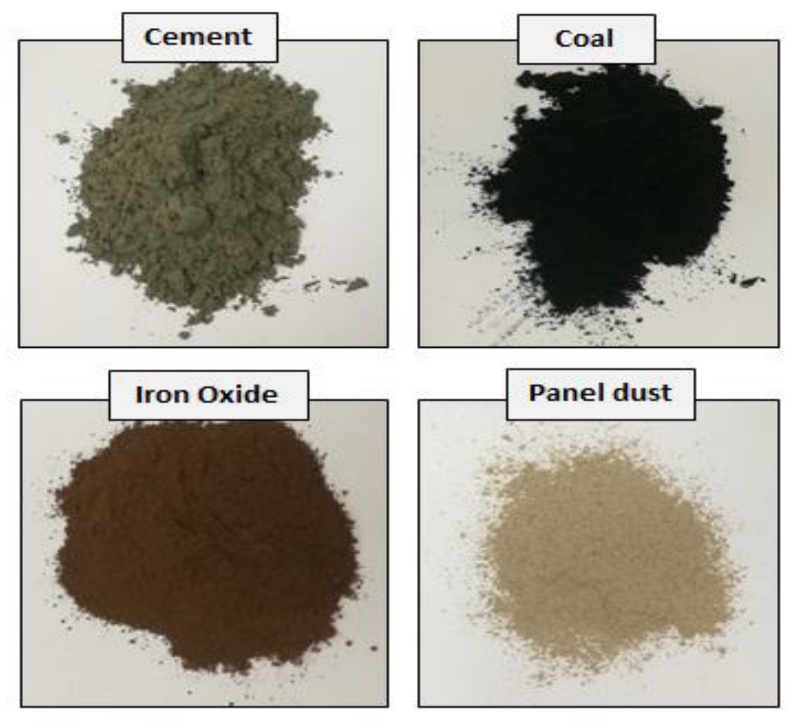
3.1. Visual Comparison

Each dust sample has different dust characteristics due to its color difference. Cement has dark grey color. Coal dust is black in color. Iron oxide has reddish color whereas Panel dust exhibit brighter color as shown in Figure 1.

3.2. Albedo

The four collected dust samples had different colors as shown in Figure 1. These dust samples had different albedos due to their color difference as shown in Table 1. The overview shows that the coal dust had the lowest (0.15) albedo among the tested dust samples due to its black color.

3.3. Particle Size Distribution

The coal dust showed a higher agglomeration rate among the other dust samples due to it having the smallest particle size distribution, followed by the cement dust as shown in Figure 2, indicating a correlation between the diameter and agglomeration of particles. Among the samples, the coal had extra fine particles with a diameter ranging from 0.2 to 25 µm. In the case of cement, it had a lower percentage of particle sizes ranging from 0.3 to 10 µm, but particle sizes from 10 to 40 µm dominated in the volumetric percentage and peaking occurred at 50 µm as compared to the iron oxide dust, where the particle size approached its peak at 90 µm. That is why cement has a lower PSD than iron oxide dust.

3.4. Chemical Composition of Dust Samples

The molecular composition present in the dust samples was determined by XRF, as it is important to find the source of dust particle generation and emission. The results of this test can be used to determine the degree of particle adhesion between the PV panel surface and dust particles. Among the oxides in Figure 3, it was found from XRF that the major constituents in the dust samples were calcium oxide (Cao) followed by SiO2, Fe2O3, and Al2O3.

3.5. Transmission Measurement

Reduction in transmission due to soiling decreases the electric current and the effects of these soiling layers become prominent as soon as the dust accumulation rate becomes higher than 0.1 g/m2. The spectral transmission curves of different densities of coal, cement, iron oxide, and panel dust are given in Figure 4. The curve decreases exponentially with the increase in dust density and this decline in transmission follows the Beer–Lambert law on the absorption of radiation. As the dust density of any of the four dust samples reached 20 g/m2, the sunlight was obstructed by approximately 80%. The transmission loss was more severe in coal, while the iron oxide and cement dusts were second and third worst, respectively. The panel dust attenuated the sunlight the least. At 50 g/m2 dust density, the coal dust almost blocked all the sun irradiance.
The transmission loss relates perfectly with the different PSD curves in Figure 2, which showed that the coal dust consisted of extra fine particles, followed by the cement, then iron oxide dust, and finally the panel dust, which contained coarser grains. Therefore, it can be concluded that the particle size distribution plays a vital role in the attenuation of sunlight and the results show that smaller or very fine particles become the cause of higher transmission loss compared to coarser grains at an equal dust density. The reason is that, at the same dust density, the coarser particles in the dust sample leave empty spaces through which light penetrates, whereas fine particles not only distribute themselves uniformly but also completely fill the empty places between themselves and resist the light over the entire area.

3.6. Summary of Results

There exists a strong relation between the transmission of sunlight and the PSD, albedo, and iron oxide content in a dust sample. The dust characteristics of all the dust samples are summarized in Table 2. The PSD plays a significant role in the attenuation of sunlight, while albedo and iron contents help in intensifying the decrease in the transmission of sunlight by the absorption of light. Coal dust attenuated the transmission of sunlight most among all the tested dust samples due to it having the finest PSD with a maximum particle size at 25 µm, which resulted in the PSD curve reaching 100% before any other dust sample. The very fine PSD, along with lowest albedo and homogenous distribution of particles, makes coal dust the most severe in attenuating the transmission of sunlight.
The effect of albedo and iron oxide content on sunlight transmission can be proved by comparing the transmission curves of the cement and iron oxide dust in Figure 4. The iron oxide dust had a low albedo (ջ = 0.27), higher iron oxide content (32.62%), and coarser particle size distribution compared to the cement, but it had a more negative impact on the transmission of sunlight than the cement because the expected lower transmission loss due to the effect of the coarser particles in the iron oxide dust can be nullified by a greater absorption rate due to the low albedo and a clearly higher iron oxide content. The secondary and most important role in the determination of sunlight transmission is the albedo and percentage of iron oxide in the sample. The darker the color of the dust, the lower the albedo and the higher the absorption rate of sunlight will be, and absorption lowers the solar energy coming in the form of electromagnetic waves and transforms the energy of photons into vibrations in the lattice, resulting in a temperature rise. That is why the iron oxide dust sample obstructed more sunlight than the cement and panel dust.

4. Conclusions

The transmission of light through dust was influenced by particle size distribution. Among the dust samples, the coal dust showed the worst deterioration effect on the PV cells’ performance due to very fine particle distribution (PSD), and its low value of albedo resulted in the highest transmission loss. It can be observed from Figure 4 that at 5 g/m2 dust density, the transmission loss was 60% for the coal dust, 44% for the cement dust, 43% for the iron oxide dust, and 31% for the panel dust. As a result of the higher absorption rate due to the higher iron oxide content and low albedo, the iron oxide dust had a greater transmission loss than the cement dust. The physical and chemical composition of dust particles is a key factor in determining the particles’ adhesion with the PV surface. Moreover, this experimental analysis illustrates that the degradation in PV power generation performance not only depends on the quantity of dust but also on its physical, chemical, and optical characteristics.

Author Contributions

M.H.R. contributed substantially to the work reported and supervised by T.M. All authors have read and agreed to the published version of the manuscript.

Funding

This research received no external funding.

Institutional Review Board Statement

Not applicable.

Informed Consent Statement

Not applicable.

Data Availability Statement

Not applicable.

Acknowledgments

Thanks are given to Zafar Malik regarding transmission loss measurement.

Conflicts of Interest

The authors declare no conflict of interest.

References

  1. Kazem, H.A.; Chaichan, M.T. Experimental analysis of the effect of dust’s physical properties on photovoltaic modules in Northern Oman. Sol. Energy 2016, 139, 68–80. [Google Scholar] [CrossRef]
  2. Qasem, H.; Betts, T.R.; Müllejans, H.; Albusairi, H.; Gottschalg, R. Dust-induced shading on photovoltaic modules. Prog. Photovoltaics Res. Appl. 2014, 22, 218–226. [Google Scholar] [CrossRef] [Green Version]
  3. El-Shobokshy, M.S.; Hussein, F.M. Effect of dust with different physical properties on the performance of photovoltaic cells. Sol. Energy 1993, 51, 505–511. [Google Scholar] [CrossRef]
  4. Zhao, W.; Lv, Y.; Wei, Z.; Yan, W.; Zhou, Q. Review on dust deposition and cleaning methods for solar PV modules. J. Renew. Sustain. Energy 2021, 13, 032701. [Google Scholar] [CrossRef]
  5. Jiang, Y.; Lu, L. A Study of Dust Accumulating Process on Solar Photovoltaic Modules with Different Surface Temperatures. Energy Procedia 2015, 75, 337–342. [Google Scholar] [CrossRef] [Green Version]
  6. Ovrum, O.; Marchetti, J.M.; Kelesoglu, S.; Marstein, E.S. Comparative Analysis of Site-Specific Soiling Losses on PV Power Production. IEEE J. Photovoltaics 2021, 75, 337–342. [Google Scholar] [CrossRef]
  7. El-Shobokshy, M.S.; Hussein, F.M. Degradation of photovoltaic cell performance due to dust deposition on to its surface. Renew. Energy 1993, 3, 585–590. [Google Scholar] [CrossRef]
  8. Jiang, H.; Lu, L.; Sun, K. Experimental investigation of the impact of airborne dust deposition on the performance of solar photovoltaic (PV) modules. Atmos. Environ. 2011, 45, 4299–4304. [Google Scholar] [CrossRef]
  9. Javed, W.; Wubulikasimu, Y.; Figgis, B.; Guo, B. Characterization of dust accumulated on photovoltaic panels in Doha, Qatar. Sol. Energy 2017, 142, 123–135. [Google Scholar] [CrossRef]
Figure 1. Visual comparison of dust samples.
Engproc 20 00013 g001
Figure 2. PSD of dust samples: coal dust (black), cement dust (green), iron oxide dust (red), panel dust (blue).
Engproc 20 00013 g002
Figure 3. Chemical composition of dust samples by XRF.
Engproc 20 00013 g003
Figure 4. Spectral transmission measurement following the Beer–Lambert law on the absorption of radiation.
Engproc 20 00013 g004
Table 1. Albedo measurement of dust samples.
SamplesAlbedo
Coal dust0.15
Cement dust0.31
Iron oxide dust0.27
Panel dust0.33
Table 2. Dust characteristics of four dust samples.
Dust SamplesAlbedo (ջ)PSDIron Oxide Content (%)
Coal dust0.151.19*
Cement dust0.311.253.813
Iron oxide dust0.271.4032.62
Panel dust0.331.482.341
* The chemical composition of coal contains sulphur.
Publisher’s Note: MDPI stays neutral with regard to jurisdictional claims in published maps and institutional affiliations.

