1. Introduction
Team sports are gaining traction with association football (soccer) in the lead as the most watched sport on television [
1]. In 2018, 3.572 billion viewers tuned in to watch the FIFA World Cup [
2]. This is equivalent to half of the population on the globe [
2]. Soccer is played by amateurs and professionals globally and is a sport that brings people together across the world.
For most professional sports achievements, athletes’ individual physical abilities are combined with many modern technologies from fields such as medicine, equipment production, nutrition, and physical and mental health monitoring. Proper diet, rest, and training regimens, as well as continuous monitoring and analysis of wellness and performance metrics can make a big difference for both individual and team sports. Soccer players constantly adhere to a strict nutrition plan, training process, and rest regime so that their body is in the required state at particular moments. The athletes’ condition is influenced not only by the amount of consumed and burned calories, or the duration and intensity of the training process, but also by parameters such as the duration and quality of their sleep and their general mental state including mood and stress level.
The increasing popularity and adoption of Machine Learning (ML) approaches has led to more evidence-based decision making [
3]. In this context, it is possible to compile a set of parameters describing the general state of the athlete at a certain point of time, collect objective or subjective measurements of these parameters, and try to predict the state/behavior of the athlete’s body in the near future using ML. For instance, according to Fuller et al. [
4], an average soccer team can expect around 50 injuries per season. Using ML, it might be feasible to make evidence-based decisions for reducing injuries at a chosen period in the future using time series analysis and predictions. The desired outcome of implementing such technologies into sports science is that injuries will be reduced, performance will be improved, and better decisions will be made. Similar technologies have already been approved by organizations such as FIFA and are used by several teams in the Norwegian top league.
In this work, we address the problem of predicting soccer players’ ability to perform, from subjective self-reported wellness parameters collected using a commercially deployed digital health monitoring system called PmSys. We focus on readiness to play, which is a measure of a player’s ability to complete a training session or play in a match. We address the research question: Can we predict readiness for elite female soccer athletes using ML on data collected using an athlete monitoring system? More specifically, we try to answer the following. Which time series models are capable of capturing adequate information for accurate predictions? Is it more accurate to predict a player’s readiness using data from an individual player or team based data? How far back in the historical data should we go and how far into the future can we predict? Does the training dataset size have an impact on the results? Which hyperparameter configurations result in the most accurate predictions?
We design and implement a software framework for undertaking time series predictions which can be configured extensively [
5], and run multiple iterations of experiments to answer the above questions. Our results show that a number of time series analysis models are able to predict readiness with high accuracy in near real-time. Equipped with such insight, coaches and trainers can better plan individual and team training sessions, and perhaps avoid over training and injuries.
The rest of this paper is organized as follows. In
Section 2, we provide background information and an overview of related work. In
Section 3, we describe our dataset and methodology. In
Section 4, we present selected results from our analysis of the above research questions, and discuss our findings. In
Section 5, we conclude the paper.
2. Background and Related Work
2.1. Time Series Prediction
A time series is described as an ordered collection of data points where each data point is an observation in time [
6,
7,
8]. Time series are sample realizations of stochastic processes [
6]. Stochastic processes can be found in various fields, such as temperature measurements or a stock market index. Time series have an inherent dependence in time. Successive observations are dependent and thus not randomly sampled [
6]. Time as an additional dimension distinguishes time series data from the more generally known cross-sectional data. The time series analysis describes a set of statistical models that aim to model the underlying stochastic process. The objectives of time series analysis are forecasting and control [
6]. Forecasting is considered as a regression problem and is defined as the prediction of values based on the time series model beyond the present. The main tasks of time series analysis are: (i) understand under the influence of which parameters the value of the time series is formed, (ii) build a mathematical model for each parameter or combination. Any time series can be decomposed into a trend, seasonal, cyclical, and random components. The first three components form the non-random component of the time series. The random component is present in any time series, but components of a non-random constituent in the time series structure are not necessary [
9].
The development of Recurrent Neural Networks (RNNs) made a significant contribution to the study and help solve regression problems associated with time series. RNNs are applicable in tasks where something holistic is broken into parts. One of the most popular types of recurrent neural networks is the Long Short-Term Memory (LSTM) network. Some of the most outstanding achievements of using LSTM are the revolutionizing of speech recognition, outperforming traditional models in specific speech applications [
10], improving large-vocabulary speech recognition [
11,
12], and breaking records for improved machine translation [
13]. The LSTM extends the traditional time series analysis models such as autoregressive integrated moving average models or exponential smoothing methods. Saimi et al. [
14] demonstrated the superiority of the LSTM over the traditional approaches. In addition, in 2014, a gate mechanism was introduced, called Gated Recurrent Units (GRU), for recurrent neural networks. One found that its effectiveness in solving problems of modeling music and speech signals is comparable to the use of long short-term memory [
15]. Compared to LSTM, this mechanism has fewer parameters because there are no output gates [
16].
2.2. The PmSys Athlete Monitoring System
PmSys is a digital monitoring system that was developed for the collection, storage, analysis, and visualization of athletes’ health data [
17,
18]. The intention for creating this system was to replace the manual method of collecting information, and its storage on paper, with a digital one. According to the creators, the primary users are soccer players, coaches, and medical personnel [
19]. The primary tool for information registration is a questionnaire that the players could easily and quickly fill out each day using a mobile application [
20]. This approach allows athletes to manage their own time when filling out the questionnaire without the coach’s insistent control of the process.
Several experiments have been carried out to see if ML can be used to forecast future values of soccer player readiness to play in previous work. Wiik et al. [
18] conducted a study with the purpose of reducing sports injuries and predicting readiness to play. Based on a dataset from two male high division soccer teams in Norway (one team from January 2017 until late August 2017 including 19 players, the other team from February 2018 to mid June 2018 including 22 players, with an overall dataset of 6000 entries), they demonstrated the value of utilizing a LSTM RNN to predict reported training load. They were able to train the model to predict positive peaks and negative peaks. Positive peaks are categorized as values above 8 and negative peaks are categorized as values below 3. Both of the datasets did not have values for all days. As a result, they had to account for the issue of missing data. The missing data were not replaced or deleted to provide a realistic use scenario. This was performed to provide a more realistic use case, as data gaps would always exist due to vacations, injury time, and other factors. To keep the simplicity of reproducing and interpreting the results, the model was kept small. This allowed to explore the underlying possibilities in the data. To assess and confirm the data, two distinct methodologies were used. The initial strategy was to train the entire team and then predict when the player would be ready to play. The second strategy involves training the model on the player who will be predicted. When the entire team was used to train the model, the predictions were more accurate, and the graphs closely tracked the peaks. Wiik et al. [
18] attempted another experiment with traditional ML methods such as linear regression and random forest, but the results were not significantly improved.
Another research performed by Johansen et al. [
21] demonstrated the impact of employing current technologies in sports to detect injuries and train optimally. In this study they have seen the advantages of incorporating technology into elite athlete performance. Their decade of expertise has culminated in a smartphone-based application with a backend system for cutting-edge athlete monitoring. A cooperation between computer scientists, sport scientists, and medical professionals has helped to discover gaps that technology can address, allowing athletes to progress in the proper direction. PmSys was well received by both athletes and staff, making it simpler to advocate for earlier bedtimes and modified training days.
3. Dataset and Methodology
3.1. Dataset
Over the course of 2 years, players from 2 participant elite female soccer teams in the PmSys system have contributed to the collection of subjective reports through a mobile application, where they used questionnaires for registering their individual subjective responses to a list of metrics daily. In this work, we use a subset of these metrics as listed below.
Readiness to play (rated 1–10).
Mood (rated 1–5).
Stress level (rated 1–5).
General muscle soreness (rated 1–5).
Fatigue (rated 1–5).
Sleep quality (rated 1–5).
3.2. Proposed Investigations
Time series models: We propose to benchmark different time series models, such as purely recurrent models (RNN, LSTM, GRU, RNNPlus, LSTMPLus, GRU-Plus), models of mixed recursive convolutional types (RNN-FCNPlus, LSTM-FCNPlus, GRU-FCNPlus), ensemble of deep CNN models (InceptionTime), and multivariate versions of the recurrent models (MRNN-FCNPlus, MLSTM-FCNPlus, MGRU-FCNPlus).
Univariate vs. multivariate prediction: A univariate time series has a single time-dependent variable. Using only the readiness parameter from our dataset to predict readiness is an example of a univariate time series. A multivariate time series, on the other hand, has more than one time-dependent variable. We propose to use mood, stress, soreness, and fatigue, along with readiness, as a multivariate time series, to compare univariate vs. multivariate prediction performance of the readiness parameter.
Window size: We propose to compare the performance of running trained models on test data with different sliding window sizes, both in terms of input window (indicating the amount of data to be used for making predictions) and output window (indicating the amount of data to be predicted).
Training on team vs. training on player: Motivated by the findings of Wiik et al. [
18], we propose to compare the accuracy of predicting the readiness parameter for a single player, using a model trained on data from the same player only versus using a model trained on data from the player’s entire team.
Hyperparameter configuration: We propose to investigate the influence of hyperparameters on prediction accuracy, in particular batch size, number of epochs in training, and data shuffling.
Data imputation: As our dataset is composed of subjectively reported metrics, a common problem is missing data (i.e., responses not being recorded every day). Missing data causes time series to have gaps. Several solutions can address this challenge: (i) replacing all gaps with 0, (ii) filling in the gaps with the value from the previous day, and (iii) removing all gaps and concatenating the data array.
3.3. Implementation
Python is a suitable language for working with large data sets since it is easy to use and has many already implemented libraries related to machine learning. We use
pandas to extract data from file and preprocessing. Pandas’ data functionality is built on the NumPy library, a lower-level tool. Includes special techniques for working with numeric tables and time series.
Tsai is a state-of-the-art deep learning library for time series and sequences (
https://timeseriesai.github.io/tsai/ (accessed on 1 June 2022)). It is an open-source deep learning package built on top of Pytorch and fastai [
22], focusing on state-of-the-art techniques for time series tasks such as classification, regression, forecasting, and imputation. This library contains a number of ready-to-use deep learning models that are possible to run directly in Python for time series prediction, which we use. To test the performance of various models, we also use the process and system utilities library (
psutil).
Table 1 presents the specifications of the hardware and software components of the benchmark implementation of our proposed framework.
3.4. Metrics
Prediction performance: The metrics used to evaluate prediction models operate on a set of continuous values (with an infinite number of items) and therefore differ slightly from the metrics used for classification tasks. The most popular metrics for regression models are Mean Squared Error (MSE), Root Mean Square Error (RMSE), and Mean Absolute Error (MAE). In the following, we primarily use MSE. MSE measures the average sum of the square of the difference between the actual value and the predicted value for all data points. Exponentiation is performed, so negative values are not compensated with positive ones. Compared to the MAE, MSE has several advantages: it emphasizes big mistakes over more minor mistakes. It is differentiable, which allows it to be more efficiently used to find the minimum or maximum values using mathematical methods. The lower the MSE, the higher the prediction accuracy.
System performance: The primary metrics for measuring performance are usually time spent on training and testing models, processor, memory, disk, and Graphics Processing Unit (GPU) usage. We primarily focus on computation without the requirement for a GPU, therefore we measure all other parameters except the GPU usage:
(i) Time usage: Time is measured in seconds. For measuring the time to train and test each model, we use the
time module (
https://docs.python.org/3/library/time.html (accessed on 1 June 2022)) from the Python standard library, which provides various time-related functions.
(ii) CPU, memory and disk usage: To measure CPU, memory, and disk usage, we use a cross-platform library called psutil (
https://pypi.org/project/psutil/ (accessed on 1 June 2022)). This library has a set of utilities for obtaining information about system performance (since our processor consists of 8 cores, we use the utility
cpu_percent() to obtain information about a load of each core in percentage. We also use psutil to measure memory and disk usage. The
virtual_memory() utility function provides information about various memory parameters. We are interested in the parameter
used, which shows the amount of memory used at a given time. The
disk_usage() function also has the parameter
used that provides information about the used disk space at a given time). We measure the used memory and disk in GiB. We measure CPU, memory, and disk usage with an interval of one second.
4. Selected Results
4.1. Benchmarking Different Time Series Models
We ran the 13 different models listed in
Section 3 on data from one team, predicting the readiness parameter for a single player using the model trained on the player’s own data. Initial values for the hyperparameters batch size and number of epochs were chosen based on examples in the Tsai code repository (
https://github.com/timeseriesAI/tsai/tree/main/tutorial_nbs (accessed on 1 June 2022)). For the sliding window size, multiple values (3, 5, 7, 14, 21, 28, 35, 42, 49) were considered. Missing data were treated with and without gaps.
Table 2 presents the best performing models and their corresponding MSE for univariate prediction. The best results were obtained using a sliding window of size 3 and data without gaps. The initial value for the number of epochs (200) was suitable for almost all models, except for the GRU, where overfitting was observed in the training, and the value reduced to 100. Almost all models could predict the ground truth contour of readiness over time quite well with a slight deviation, except for GRUPlus. Some models also were able to predict positive and negative peaks successfully, especially the InceptionTime, MGRU-FCNPlus, MLSTM-FCNPlus, RNN-FCNPlus, MRNN-FCNPlus, GRU-FCNPlus, and LSTM-FCNPlus.
4.2. Univariate vs. Multivariate Prediction
We ran the same configurations to carry out the initial experiments for multivariate scenario, with the difference that multivariate times series consisting of readiness, mood, stress, soreness, and fatigue, where the target parameter to predict is readiness, are used. After initial observations of multivariate prediction, 200 epochs turned out to be too high and influenced the results of predictions. As the plots of the training and validation loss function for various models showed, many of them were already trained after 20 epochs; therefore, we decided to correct the number of epochs for all models and rerun the initial experiments with sliding window sizes of 3, 5, 7, 28, and 49.
Table 3 presents the best performing models and their corresponding MSE for multivariate prediction with a higher number of epochs (top), and a lower number of epochs (bottom). With a large number of epochs, only three neural networks had an MSE below 2. Where MSE for the top ten models for univariate prediction was within the range 1191–1480, the MSE for only the four best models with multivariate prediction was within 1325–1603, which meant that employing univariate prediction was more accurate. The best results for both multivariate and univariate prediction were obtained for a sliding window of size 3 and data without gaps. Overfitting influenced multivariate prediction to a greater extent. Similar to univariate prediction, InceptionTime was among the best models, with LSTMPlus and InceptionTime predictions closest to ground truth overall, and the plots of predicted against actual values of readiness for most models adequate for following peaks.
4.3. Input and Output Window Size
To investigate how the input window and output window sizes influence prediction in a more practical context, we focused on a daily and weekly predictions as might be relevant to soccer clubs during a game season. We ran experiments using a period of 2 years to train on the entire team and predict the readiness for one player for (7, 14, 21) days as the input window, and 1 and 7 days as the output window.
Table 4 presents the MSE values for univariate prediction with LSTMPlus as a representative model, with different window sizes, for Team A. We note that similar results are obtained for Team B, and the MSE value increases for each day predicted in the future (see
Figure 1), which was against our initial expectation of a somewhat weekly pattern (and therefore reduced MSE for 7 days). The increase in inaccuracy is possibly due to readiness being a continuous rather than periodically peaking parameter, meaning that the days immediately leading up to a day are important. If the peaks were more periodic, the predictions for future days which are ahead by multiple days (e.g., same day of the week in the upcoming week) would be possible to predict without relying on the whole of the leading week.
4.4. Training on Team vs. Training on Player
Previous related work has proven that training on the entire team and predicting readiness for a single player can give promising results [
18,
21,
23]. In
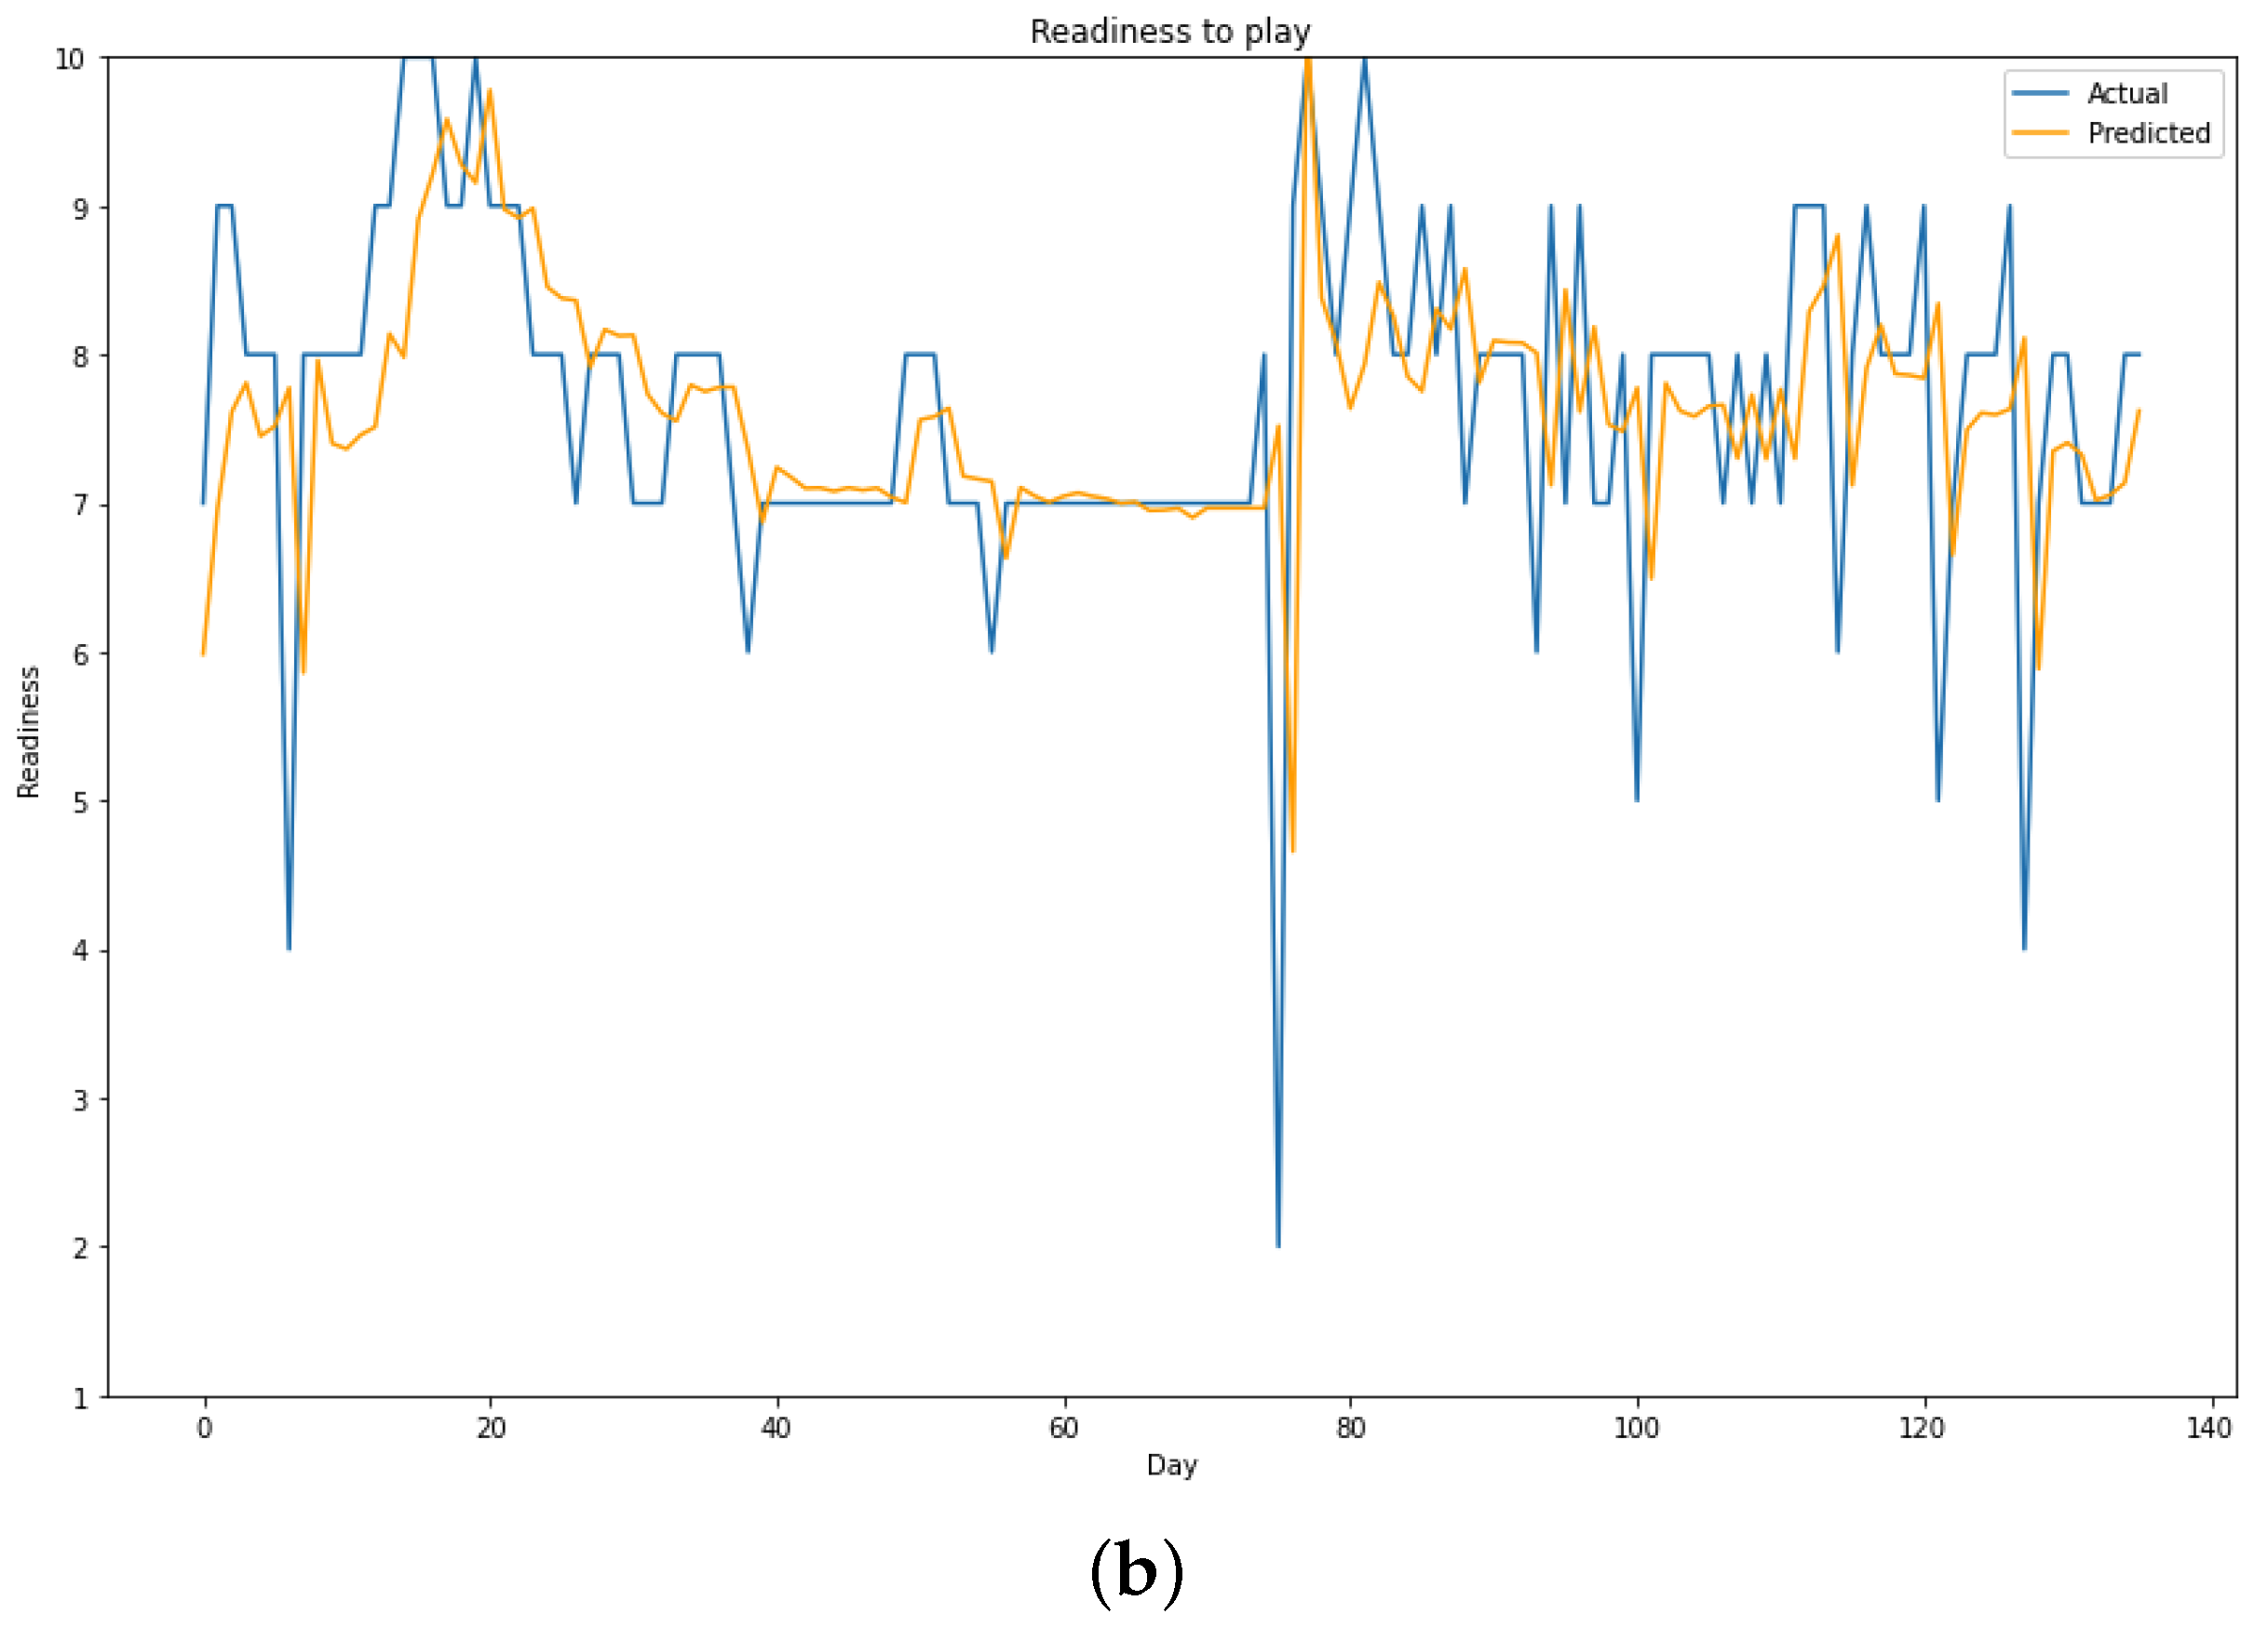
Table 5, we present the results from experiments on Team A with 30 epochs and a batch size of 5, comparing the performance of models trained on the entire team and trained on a single player for predicting the readiness for the player. Overall, training on the entire team and predicting for one player show lower MSE values.
Figure 2 demonstrates the viability of training on the entire team, where the predictions follow the actual values quite accurately and the peaks are anticipated correctly. We also observe that the MSE value increases as the input window increases, possibly indicating that predicting the next day using data from the last week (input window: 7, output window: 1) might be the optimal use case for our scenario.
4.5. Hyperparameter Configuration
Model optimization depends on hyperparameters, which include number of epochs, batch size and data shuffle. We pick a single player from a team, modify the hyperparameters and train the model on the entire team to predict on the player using univariate prediction with LSTMPLus.
Table 6 presents the MSE values for different hyperparameter settings. The result showed that enabling shuffle led to a reduced MSE. The plots of actual and predicted values, however, were almost identical for different values for other hyperparameters. For all cases, the predicted peaks were quite close to the actual values. The only hyperparameter modification that reduced the MSE value was enabling data shuffle, and its influence was not significant.
4.6. System Performance
Table 7 reports system performance metrics as recorded on the benchmark implementation specified in
Table 1 for selected models for univariate and multivariate prediction.
InceptionTime and LSTM have the best training time (200 epochs) for multivariate and univariate prediction, respectively. The testing time for all models (7100 data points) turned out to be approximately the same, and we see that testing proceeded very quickly. To calculate the CPU usage, we used a utility that measured the utilization for each core separately. The CPU utilization was measured only in the process of training the models. As a result, it turned out that the usage increased several times at the start of the training process and remained at the level of 75–100% (multivariate) and 65–100% (univariate) for all models. After the end of the training, the CPU utilization also immediately decreased. The values of memory and disk usage in the training process turned out to be insignificant. The minimum and maximum amount of memory and disk usage differed by about a few hundred MB. Overall, our preliminary analysis indicates that a framework as we have proposed in this work can be run in near real time without requiring a lot of resources.
5. Conclusions
In this work, we addressed the problem of predicting soccer players’ ability to perform, from subjective self-reported wellness parameters collected using a commercially deployed digital health monitoring system called PmSys. We focused on readiness to play, which is a measure of a player’s ability to complete a training session or play in a match, and experimented with a software framework for undertaking time series predictions to derive insights regarding the influence of different factors on prediction accuracy.
As an initial study, we investigated and presented our results regarding the following: (1) We tested various time series models to see which were capable of capturing adequate information for accurate predictions. (2) We compared univariate and multivariate approaches to see if we can leverage different wellness parameters in the dataset to predict readiness? (3) We looked at the impact of different input and output sizes to see how far back in the historical data it is necessary to go for training, and how far into the future it is possible to predict with acceptable accuracy. (4) We looked at how training on a single player versus training on the entire team affected the results, to see if prediction frameworks can leverage data from teams for making predictions on individual players. (5) We investigated the influence of different hyperparameters such as the number of epochs, batch size, and data shuffle on prediction accuracy.
We found out that most of the tested ML models are able to yield a reasonable accuracy in prediction, provided that training parameters are adjusted to avoid overfitting. In terms of performance, the best model for the multivariate prediction turned out to be InceptionTime, and for the univariate prediction, LSTM. We could not find evidence that multivariate predictions perform better within the context of our dataset and scenario, however, further analysis of the other parameters available from the PmSys dataset are necessary. We saw that daily predictions performed better than weekly predictions, indicating that the readiness parameter might not be as strongly periodic as initially assumed.
Training on the entire team and predicting for a single player resulted in more accurate overall results, especially when a team has high consistency across players, and the correct prediction of peaks. This is a first step toward determining the system’s generalizability so that it may be used in other sports. Hyperparameter tuning did not have significant influence within our testing range, except for data shuffling, which improved performance.
In this work, we have tried to address various research aspects independently, and using different parts of the PmSys dataset at times; however, there are many investigations that need to be continued in a more systematic manner over the complete and extended dataset for a more comprehensive understanding of the potentially complex interplay between influencing factors on prediction performance. Dataset and pipeline standardization, including the evaluation of libraries other than Tsai, are also necessary for a large-scale analysis covering a wide range of parameter values and system settings. Other future work topics include the investigation of the contextual relevance of the samples (e.g., what effects does it have on the predictions when using off-season vs. on-season, weekday vs. weekend, match day vs. regular training), more advanced methods for handling missing data, and a deeper analysis of multivariate prediction with an augmented set of supplementary wellness and health parameters.
Overall, we demonstrated that it is possible to make relatively accurate predictions about elite soccer player readiness using ML algorithms such as LSTM, using the kind of datasets collected by athlete monitoring platforms such as PmSys. ML-based time series prediction pipelines, integrated with such platforms, can have a huge impact in the field of sports science and computer science, and our approach can be extended to various health, wellness, injury, and training parameters, as well as different sports as well.
Author Contributions
Conceptualization, D.J., M.A.R., and P.H.; methodology, D.J., M.A.R., P.H., and C.M.; software, S.K. and N.R.; validation, S.K., N.R., P.H., and C.M.; investigation, S.K., N.R., P.H., and C.M.; resources, D.J., M.A.R., and P.H.; data curation, M.B., C.M., and P.H.; writing—original draft preparation, C.M.; writing—review and editing, C.M., M.B., and P.H.; visualization, N.R.; supervision, C.M., D.J., M.A.R., and P.H.; project administration, P.H.; funding acquisition, D.J., M.A.R., and P.H. All authors have read and agreed to the published version of the manuscript.
Funding
The work is partially funded by Tromsø Research Foundation. The funding body had no role in the study itself or in the writing of this paper.
Institutional Review Board Statement
Not applicable.
Informed Consent Statement
Informed consent was obtained from all subjects involved in the study. The study was approved by both the Norwegian Privacy Data Protection Authority (reference number: 296155) and exempted from further user consent because the data were fully anonymous. All metadata were removed, and all files renamed to randomly generated file names before the original PmSys system exported the files from the cloud server. The study was also exempted from approval from the Regional Committee for Medical and Health Research Ethics—South East Norway and the Regional Committee for Medical and Health Research Ethics—Northern Norway since the collection of the data did not include a bio-bank, medical, or health data related to illness or interfere the normal operation of the players. Since the data are anonymous, the dataset is publicly shareable based on Norwegian and General Data Protection Regulation (GDPR) laws.
Data Availability Statement
Conflicts of Interest
Authors D.J. and P.H. both own shares in the Forzasys AS company developing among other things data collection systems and solutions for AI-based analysis of sports data. The PmSys system from Forzasys was used to collect the subjective reports, but there is no commercial interest from Forzasys regarding this publication and dataset. Otherwise, the authors declare no competing interests.
References
- Bandyopadhyay, K. Legacies of Great Men in World Soccer: Heroes, Icons; Routledge: Abingdon-on-Thames, UK, 2017. [Google Scholar]
- FIFA. More than Half the World Watched Record-Breaking 2018 World Cup. 2022. Available online: https://www.fifa.com/tournaments/mens/worldcup/2018russia/media-releases/more-than-half-the-world-watched-record-breaking-2018-world-cup (accessed on 11 May 2022).
- Pugliese, R.; Regondi, S.; Marini, R. Machine learning-based approach: Global trends, research directions, and regulatory standpoints. Data Sci. Manag. 2021, 4, 19–29. [Google Scholar] [CrossRef]
- Fuller, C.W.; Ekstrand, J.; Junge, A.; Andersen, T.E.; Bahr, R.; Dvorak, J.; Hägglund, M.; McCrory, P.; Meeuwisse, W.H. Consensus statement on injury definitions and data collection procedures in studies of football (soccer) injuries. Br. J. Sports Med. 2006, 40, 193–201. [Google Scholar] [CrossRef] [PubMed]
- Kulakou, S.; Ragab, N.; Midoglu, C. PmSys. 2022. Available online: https://github.com/simula/pmsys (accessed on 23 May 2022).
- Box, G.E.; Jenkins, G.M.; Reinsel, G.C.; Ljung, G.M. Time Series Analysis: Forecasting and Control; John Wiley & Sons: Hoboken, NJ, USA, 2015. [Google Scholar]
- Adhikari, R.; Agrawal, R.K. An introductory study on time series modeling and forecasting. arXiv 2013, arXiv:1302.6613. [Google Scholar]
- Shumway, R.H.; Stoffer, D.S.; Stoffer, D.S. Time Series Analysis and Its Applications; Springer: Berlin/Heidelberg, Germany, 2000; Volume 3. [Google Scholar]
- Hamilton, J.D. Time Series Analysis; Princeton University Press: Princeton, NJ, USA, 2020. [Google Scholar]
- Fernández, S.; Graves, A.; Schmidhuber, J. An application of recurrent neural networks to discriminative keyword spotting. In Proceedings of the International Conference on Artificial Neural Networks, Porto, Portugal, 9–13 September 2007; pp. 220–229. [Google Scholar]
- Sak, H.; Senior, A.W.; Beaufays, F. Long Short-Term Memory Recurrent Neural Network Architectures for Large Scale Acoustic Modeling. 2014. Available online: https://static.googleusercontent.com/media/research.google.com/en//pubs/archive/43905.pdf (accessed on 26 June 2022).
- Li, X.; Wu, X. Constructing long short-term memory based deep recurrent neural networks for large vocabulary speech recognition. In Proceedings of the 2015 IEEE International Conference on Acoustics, Speech and Signal Processing (ICASSP), Brisbane, Australia, 19–24 April 2015; pp. 4520–4524. [Google Scholar]
- Sutskever, I.; Vinyals, O.; Le, Q.V. Sequence to sequence learning with neural networks. In Proceedings of the Twenty-Seventh Conference on Neural Information Processing Systems (NIPS’14), Montreal, QC, Canada, 8–13 December 2014; pp. 3104–3112. [Google Scholar]
- Siami-Namini, S.; Tavakoli, N.; Namin, A.S. A comparison of ARIMA and LSTM in forecasting time series. In Proceedings of the 2018 17th IEEE International Conference on Machine Learning and Applications (ICMLA), Orlando, FL, USA, 17–20 December 2018; pp. 1394–1401. [Google Scholar]
- Chung, J.; Gulcehre, C.; Cho, K.; Bengio, Y. Empirical evaluation of gated recurrent neural networks on sequence modeling. arXiv 2014, arXiv:1412.3555. [Google Scholar]
- Britz, D. Recurrent Neural Network Tutorial, Part 4 Implementing a GRU/LSTM RNN with Python and Theano. 2015. Available online: https://sites.google.com/site/nttrungmtwiki/home/it/machine-lear/neural-networks/recurrent-neural-network/recurrent-neural-network-tutorial-part-4-implementing-a-gru-lstm-rnn-with-python-and-theano (accessed on 26 June 2022).
- Pettersen, S.A.; Johansen, H.D.; Baptista, I.A.M.; Halvorsen, P.; Johansen, D. Quantified Soccer Using Positional Data: A Case Study. Front. Physiol. 2018, 9, 866. [Google Scholar] [CrossRef]
- Wiik, T.; Johansen, H.D.; Pettersen, S.A.; Baptista, I.; Kupka, T.; Johansen, D.; Riegler, M.; Halvorsen, P. Predicting Peek Readiness-to-Train of Soccer Players Using Long Short-Term Memory Recurrent Neural Networks. In Proceedings of the 2019 International Conference on Content-Based Multimedia Indexing (CBMI), Dublin, Ireland, 4–6 September 2019; pp. 1–6. [Google Scholar] [CrossRef] [Green Version]
- Hoang, T.T. pmSys: Implementation of a Digital Player Monitoring System. Master’s Thesis, University of Oslo, Oslo, Norway, 2015. [Google Scholar]
- Nguyen, C.N. Implementation of a Digital Player Monitoring System: PmSys. Master’s Thesis, University of Oslo, Oslo, Norway, 2015. [Google Scholar]
- Johansen, H.D.; Johansen, D.; Kupka, T.; Riegler, M.A.; Halvorsen, P. Scalable Infrastructure for Efficient Real-Time Sports Analytics. In Proceedings of the ICMI’20 Companion: Companion Publication of the 2020 International Conference on Multimodal Interaction, Virtual, 25–29 October 2020; Association for Computing Machinery: New York, NY, USA, 2020; pp. 230–234. [Google Scholar] [CrossRef]
- Howard, J.; Gugger, S. Fastai: A layered API for deep learning. Information 2020, 11, 108. [Google Scholar] [CrossRef] [Green Version]
- Kulakou, S. Exploration of Time-Series Models on Time Series Data. Master’s Thesis, University of Oslo, Oslo, Norway, 2021. [Google Scholar]
| Publisher’s Note: MDPI stays neutral with regard to jurisdictional claims in published maps and institutional affiliations. |
© 2022 by the authors. Licensee MDPI, Basel, Switzerland. This article is an open access article distributed under the terms and conditions of the Creative Commons Attribution (CC BY) license (https://creativecommons.org/licenses/by/4.0/).


 ,
, 


