Proceeding Paper

Towards Smart Big Weather Data Management †

by
Chouaib EL Hachimi
1,*,
Salwa Belaqziz
1,2,
Saïd Khabba
1,3 and
Abdelghani Chehbouni
1,4
1
Center for Remote Sensing Applications (CRSA), Mohammed VI Polytechnic University (UM6P), Benguerir 43150, Morocco
2
LabSIV Laboratory, Department of Computer Science, Faculty of Science, UIZ University, Agadir 80000, Morocco
3
LMFE, Department of Physics, Faculty of Sciences Semlalia, Cadi Ayyad University, Marrakesh 40000, Morocco
4
Centre d’Etudes Spatiales de la Biosphère (CESBIO), Université de Toulouse, 31400 Toulouse, France
*
Author to whom correspondence should be addressed.
Presented at the 1st International Online Conference on Agriculture—Advances in Agricultural Science and Technology, 10–25 February 2022; Available online: https://iocag2022.sciforum.net/.
Chem. Proc. 2022, 10(1), 54; https://doi.org/10.3390/IOCAG2022-12240
Published: 10 February 2022

Abstract

:
Smart management of weather data is pivotal to achieving sustainable agriculture since weather monitoring is linked to crop water requirement estimation and consequently to efficient irrigation systems. Advances in technologies such as remote sensing and the Internet of Things (IoT) have led to the generation of this data with a high temporal resolution which requires adequate infrastructure and processing tools to gain insights from it. To this end, this paper presents a smart weather data management system composed of three layers: the data acquisition layer, the data storage layer, and the application layer. The data can be sourced from station sensors, real-time IoT sensors, third-party services (APIs), or manually imported from files. It is then checked for errors and missing values before being stored using the distributed database MongoDB. The platform provides various services related to weather data: (i) forecast univariate weather time series, (ii) perform advanced analysis and visualization, (iii) use machine learning to estimate and model important climatic parameters such as the reference evapotranspiration (ET 0 ) estimation using the XGBoost model (R 2 = 0.96 and RMSE = 0.39). As part of a test phase, the system uses data from a meteorological station installed in the study area in Morocco.

1. Introduction

Since the industrial revolution, our planet is facing real challenges related to climate change [1]. Effects of this latter are going to get worse as we go into the future, especially in the context of a high rate of population growth [2] which reveals another type of issue related to food security. Agriculture is the concerned sector, and agricultural management practices must be optimized to meet the increasing food demand. One step toward this is optimizing water resources usage, which is used mainly in irrigation. There are several types of irrigation, such as surface irrigation, which is the most prevalent mode of irrigation worldwide [3] and pressurized irrigation that requires energy in order to supply water. Whatever the type of irrigation, efficiency can’t be achieved without knowing the right amount of water to apply and when to apply it [4]. To achieve this, estimation of the evapotranspiration is pivotal. It is the sum of the evaporation from the soil surface and the transpiration from plants. The evapotranspiration of a crop (ET c ) is estimated by multiplying the crop coefficient (K c ) and the reference evapotranspiration (ET 0 ) which represents the rate of evapotranspiration for a reference crop (grass) with known properties obtained by monitoring some meteorological parameters such as air temperature, net solar radiation, humidity, and wind speed. Therefore, weather monitoring is essential for accurately managing irrigation water and, in turn, achieve sustainable agriculture.
Thanks to advances in science and technology, we are currently able to collect weather data at high spatial and temporal resolution and with low-cost [5,6,7,8,9,10,11]. This huge amount of generated data is unprecedented, and it brings the notion of big data to this field, which requires adequate infrastructure and processing methods.
This paper presents a web platform to store and process this abundant resource (data) using big data analytics and artificial intelligence algorithms.

2. Materials and Methods

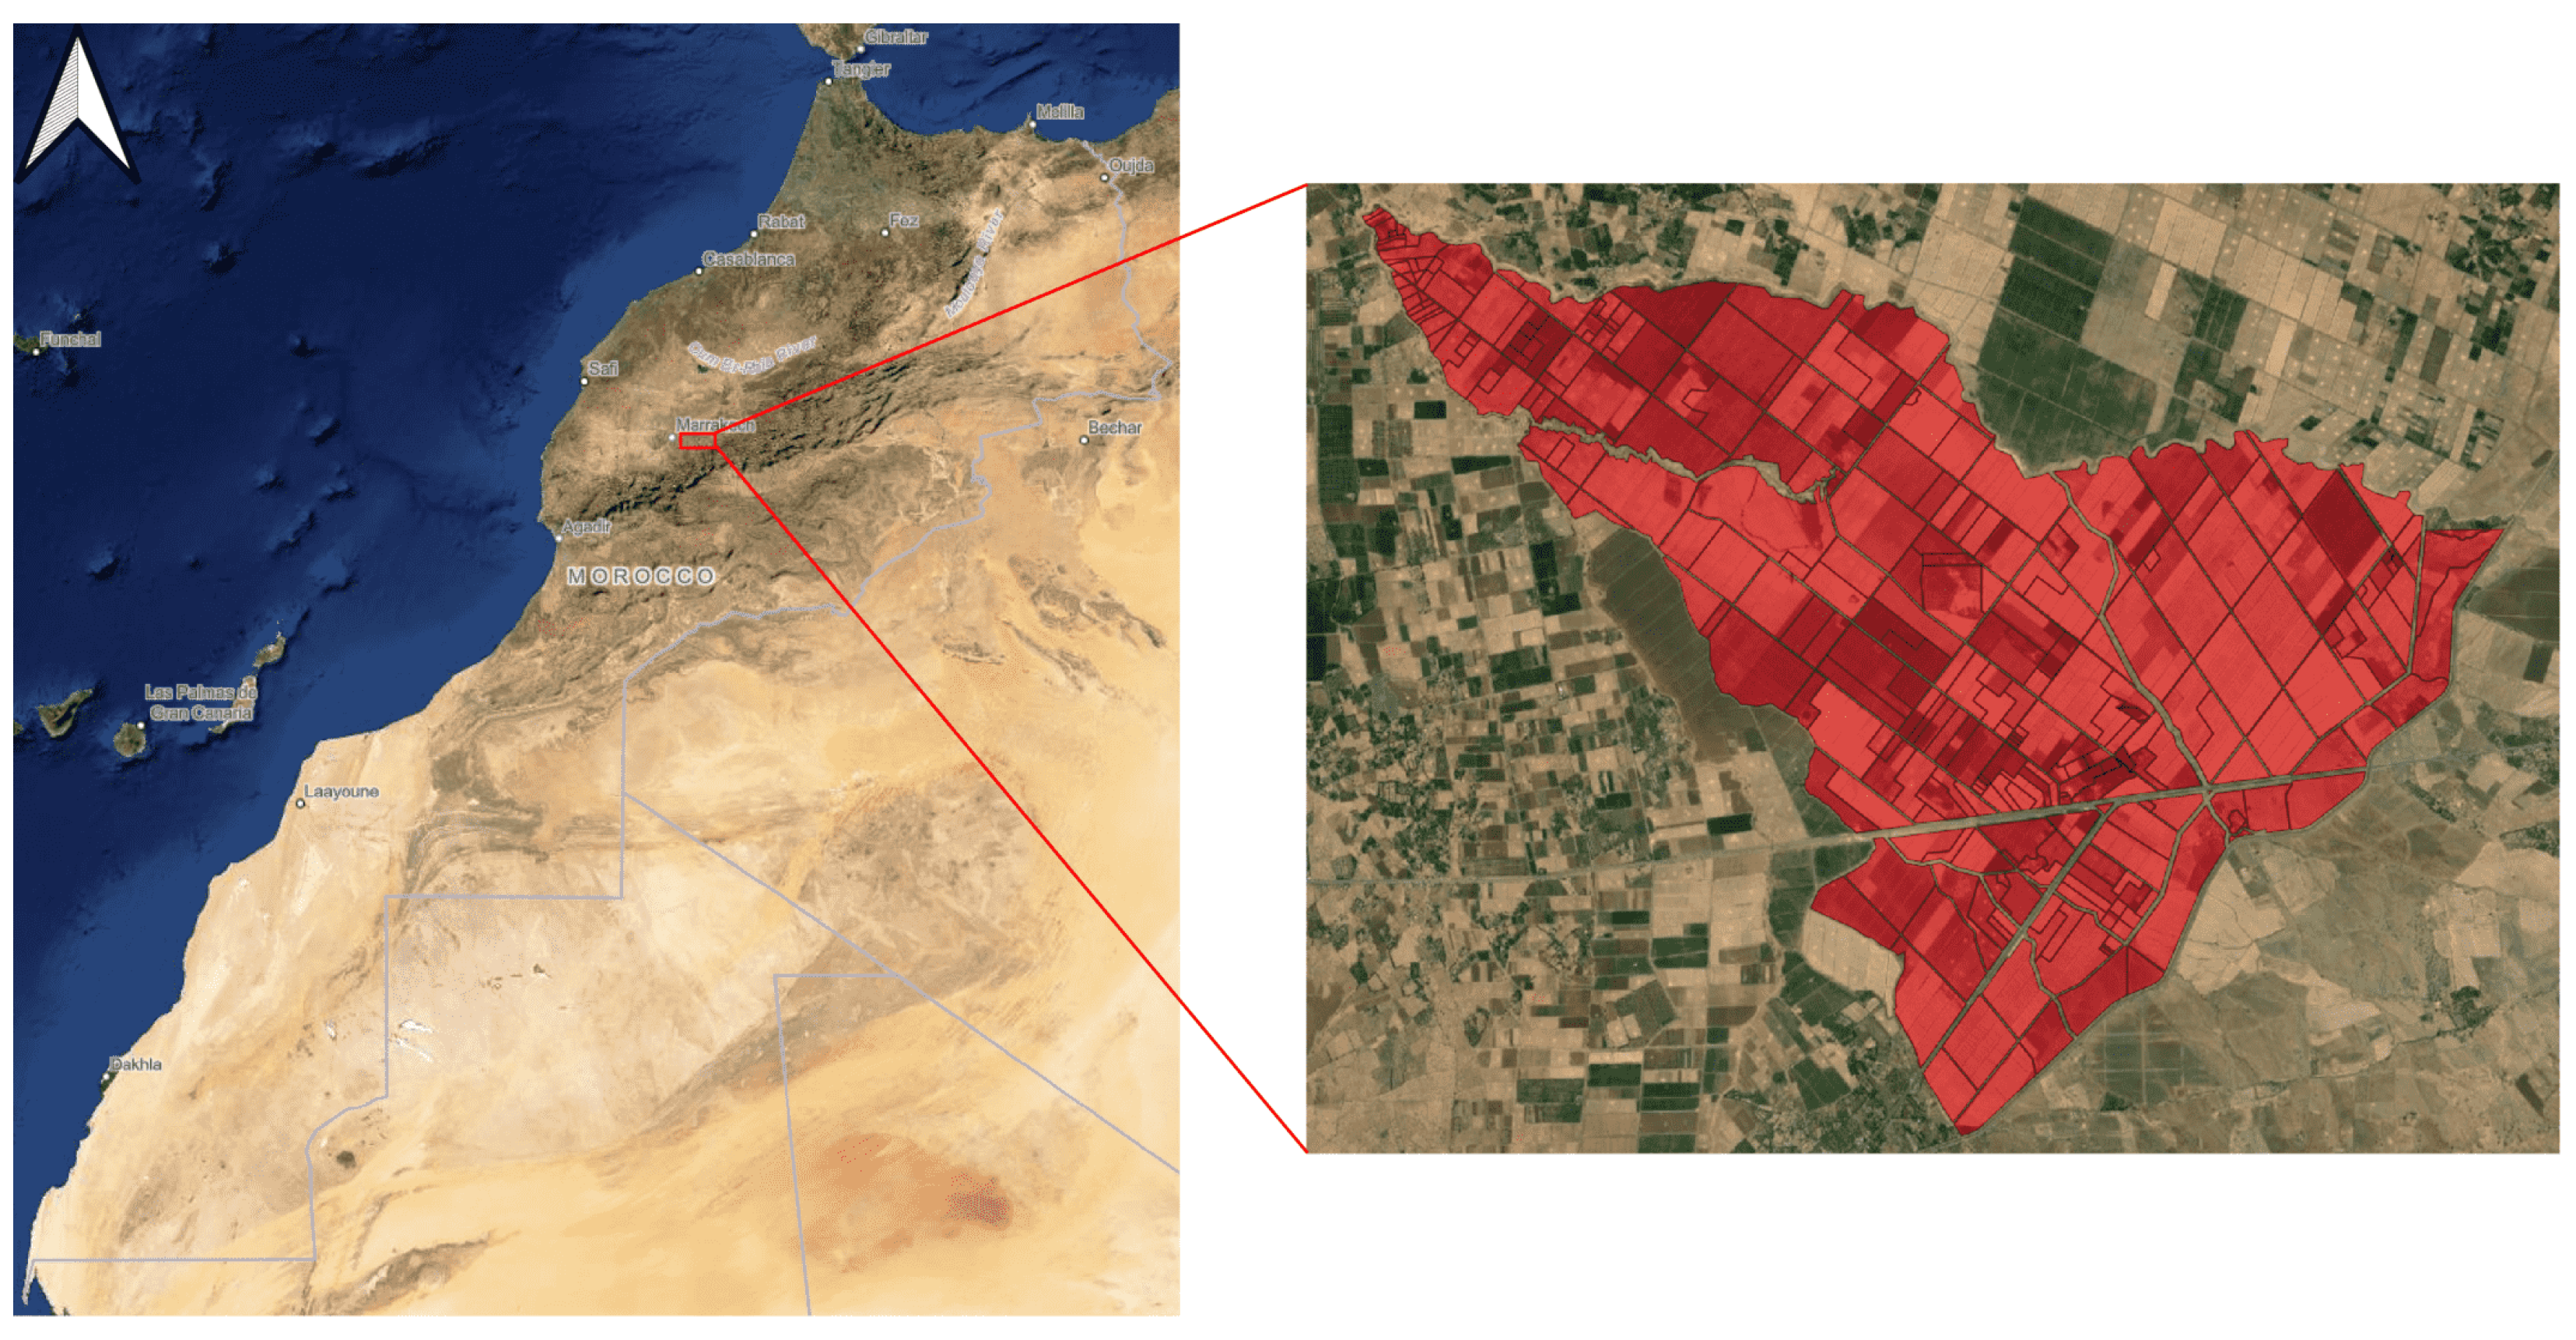
2.1. Study Area and Data

The experimental site (Figure 1) is located 40 km east of Marrakesh city in Morocco (31°39 33.68 N, 7°36 23.586 W, 582 m above mean sea level using the World Geodetic Coordinate System (WGS84 [12])). It is an irrigated area of about 2800 ha, which is almost flat. It has a Mediterranean semiarid climate, with around 250 mm of average annual rainfall [13,14] generally recorded between November and the end of April and average annual evapotranspiration (ET 0 ) of 1600 mm [15].
The collected data from the weather station installed in the study area covers the period between January 3, 2013, to December 31, 2020 (Table 1) at half-hour scale. A detailed description of the different sensors used in the station can be found in previous work conducted in the same study area [17,18].

2.2. Proposed Smart Weather Data Management Platform
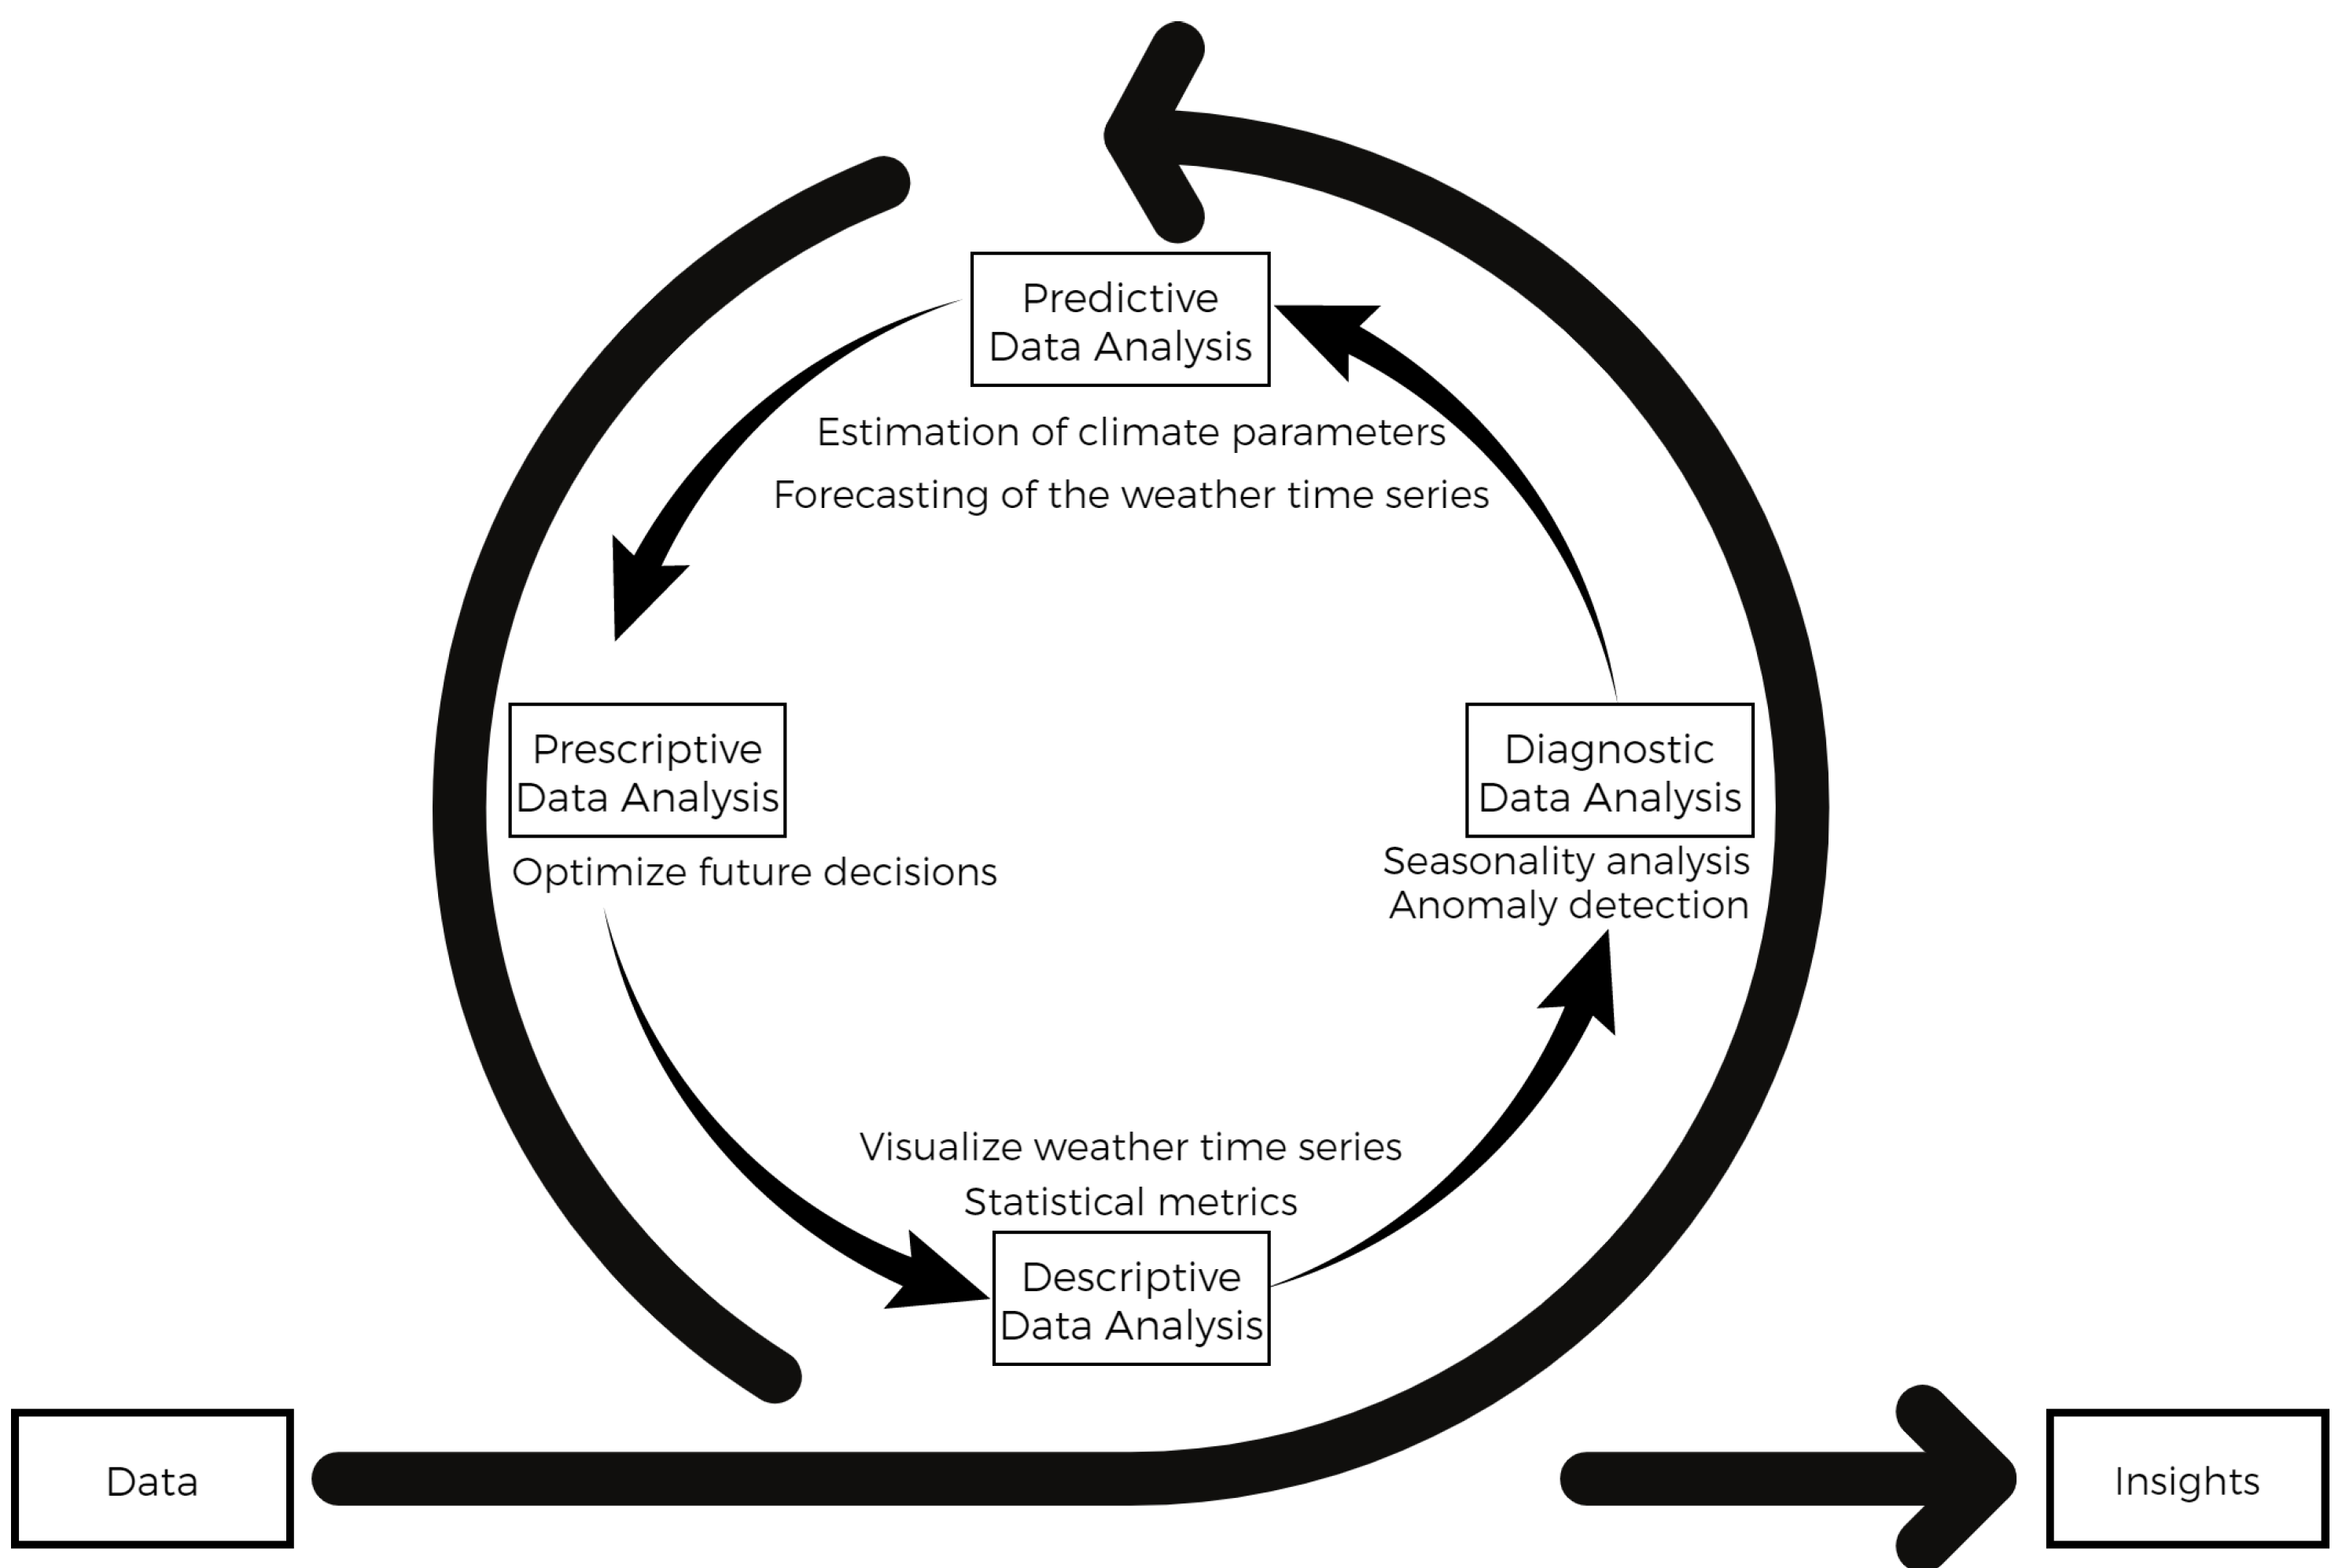
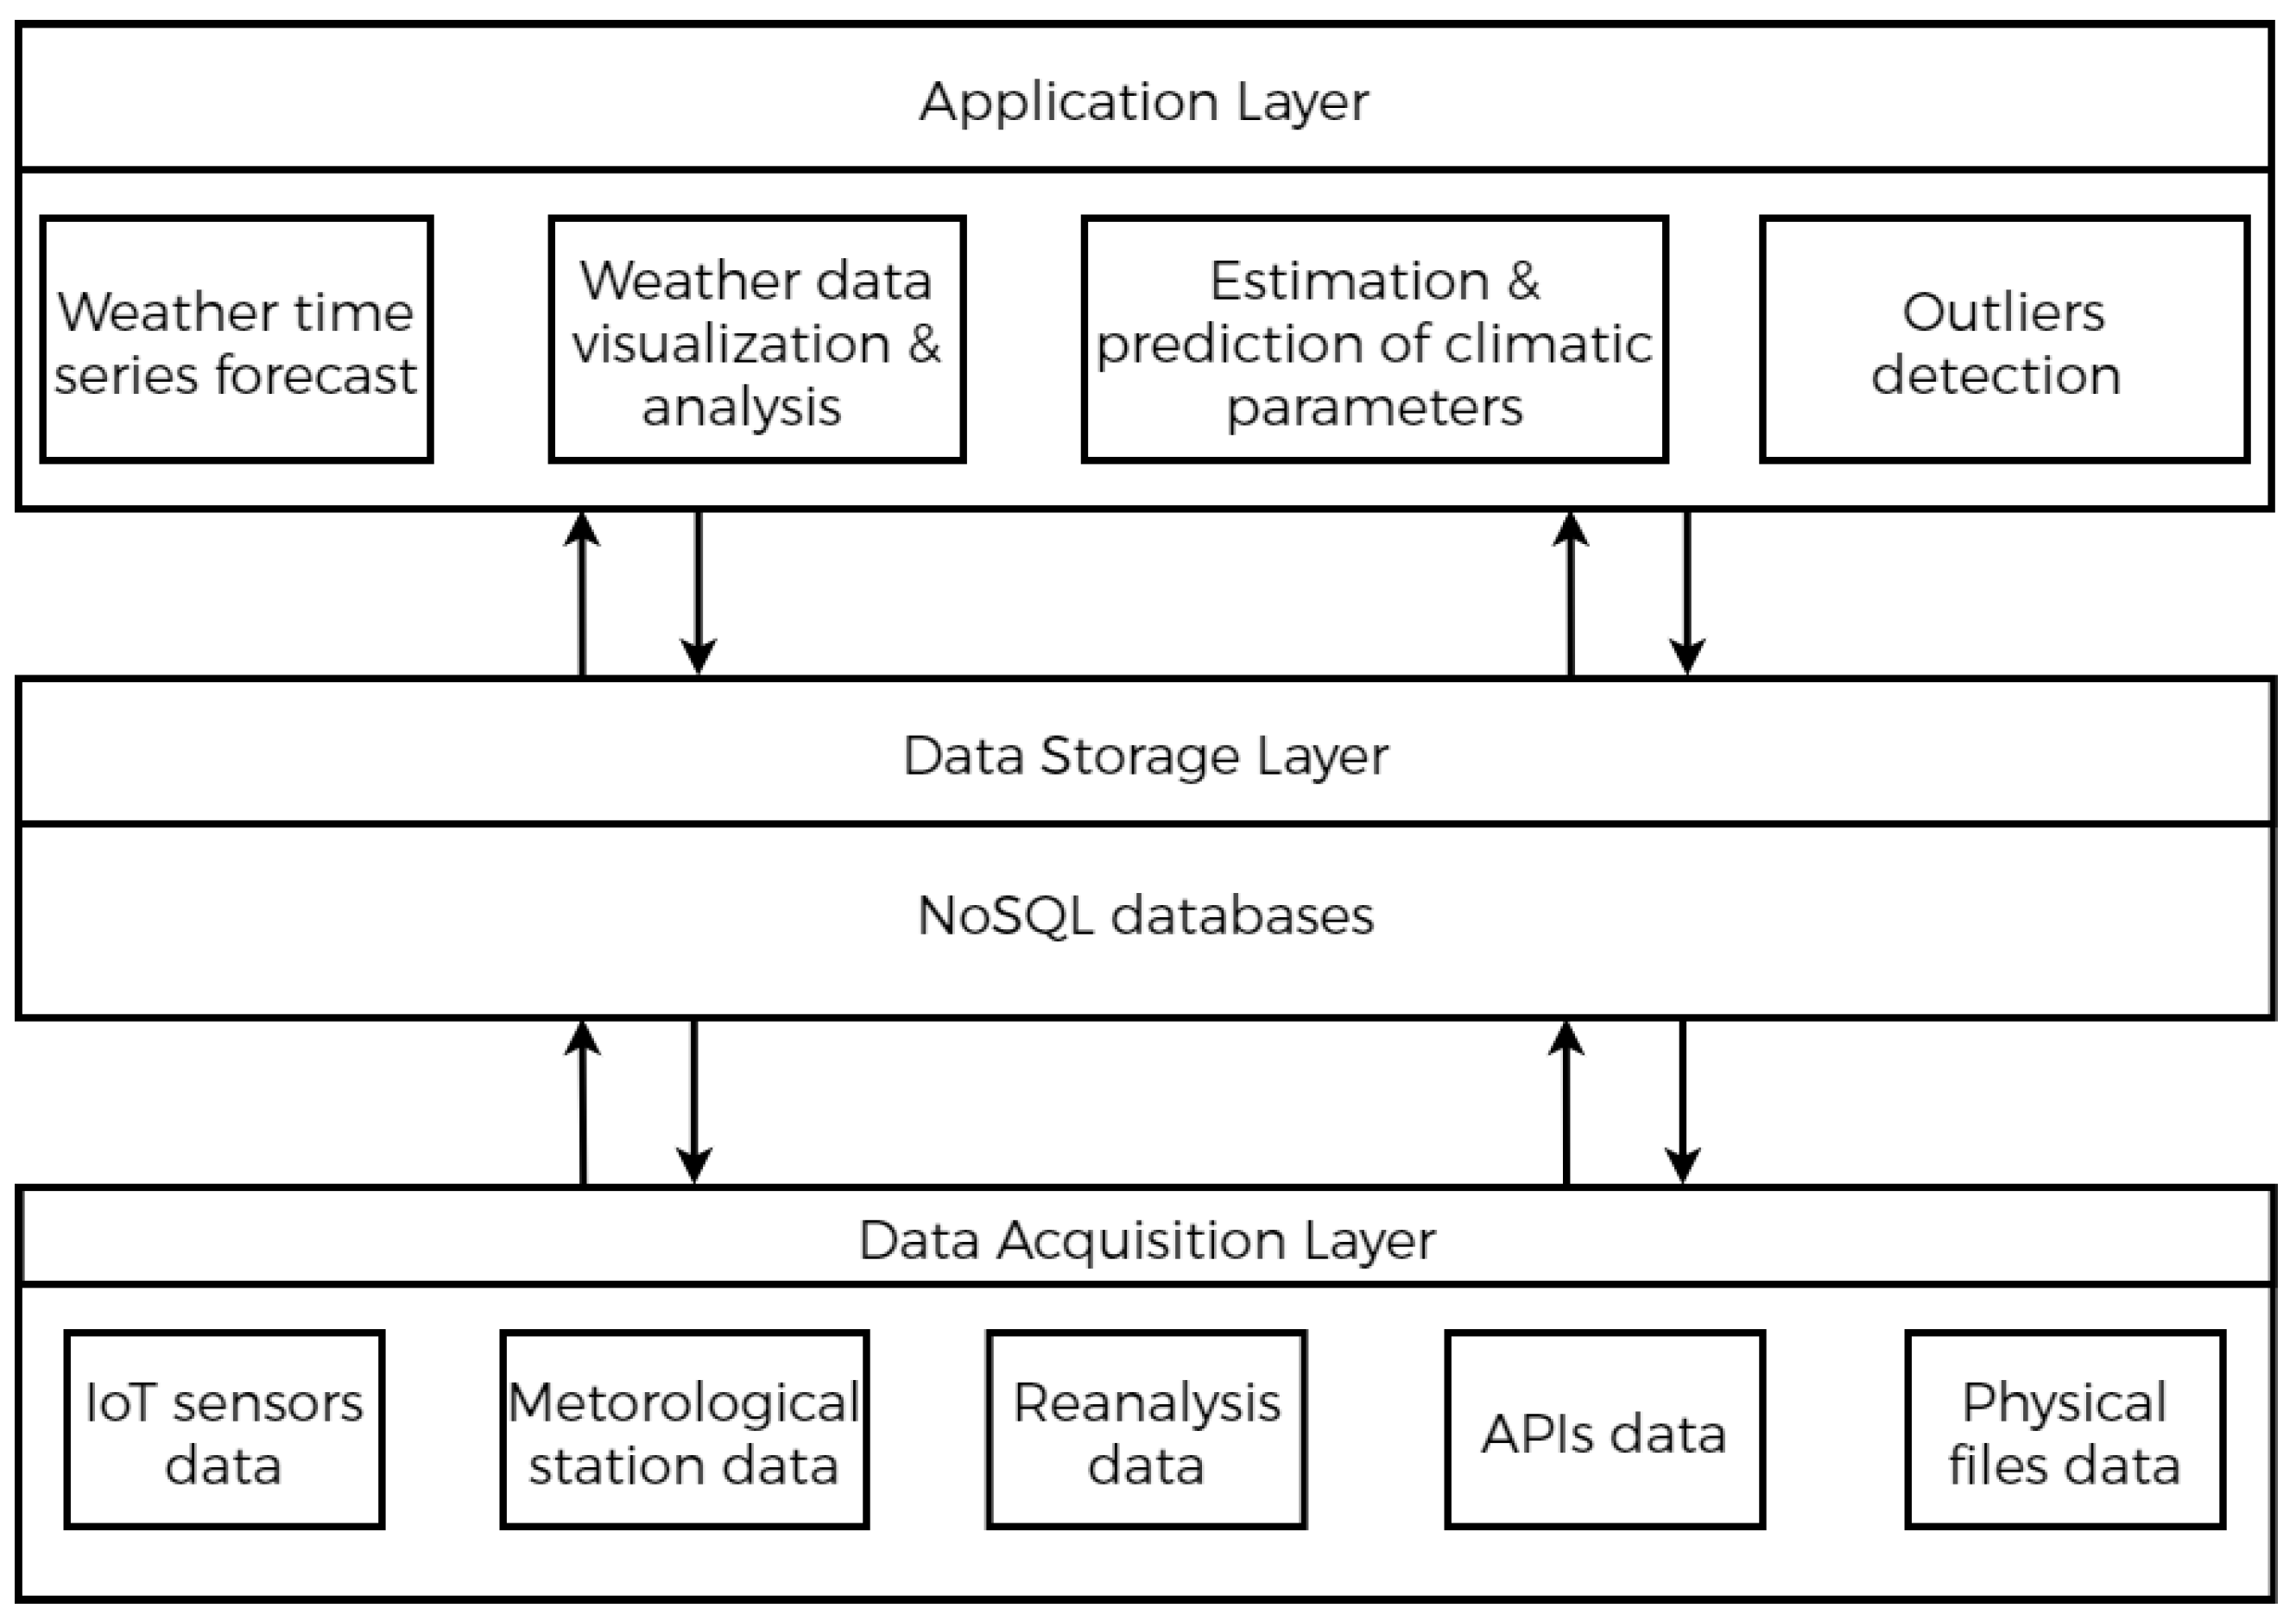
2.2.1. Overview

The proposed platform adopts a service-oriented architecture providing services that cover all four types of data analytics from descriptive data analysis to prescriptive data analysis (Figure 2).
It consists of three layers: the data acquisition layer, the data storage layer, and the application layer (Figure 3). The data can be collected from heterogeneous sources such as meteorological station sensors, real-time IoT-based weather stations, reanalysis data, third-party meteorological services or Application Programming Interfaces (APIs), or manually imported from physical files (CSV, Excel, etc.). This data is then checked and preprocessed to handle missing values, before being stored using the MongoDB NoSQL database. This database represents a suitable solution for our use case, given its ability to handle real-time data, querying, and retrieving large volumes of data, in addition to its scalability and schema-less characteristics. In contrast, fault tolerance issues are a weakness of MongoDB and are the case for almost all distributed databases as well.

2.2.2. Forecasting Service

The forecasting service helps predict the future evolution of weather (air temperature, solar radiation, relative humidity, etc.). It initially uses the Facebook Prophet model [19] given the performance it shows when compared with a Long Short-Term Memory (LSTM [20]) neural network architecture when applied to the same meteorological station data we used [21].
The platform enables the user to specify the number of years needed to train and test the model performance and the time period for the forecast.
Results for univariate time series forecasting were evaluated on the data available in the platform database described in Table 1. The evaluation metrics used were: the Coefficient of determination Equation (1) and Root Mean Squared Error Equation (2). Results are presented in Section 3.1.
R 2 = 1 1 n ( y i y ^ i ) 2 1 n ( y i y ¯ i ) 2
R M S E = 1 n 1 n ( y i y ^ i ) 2

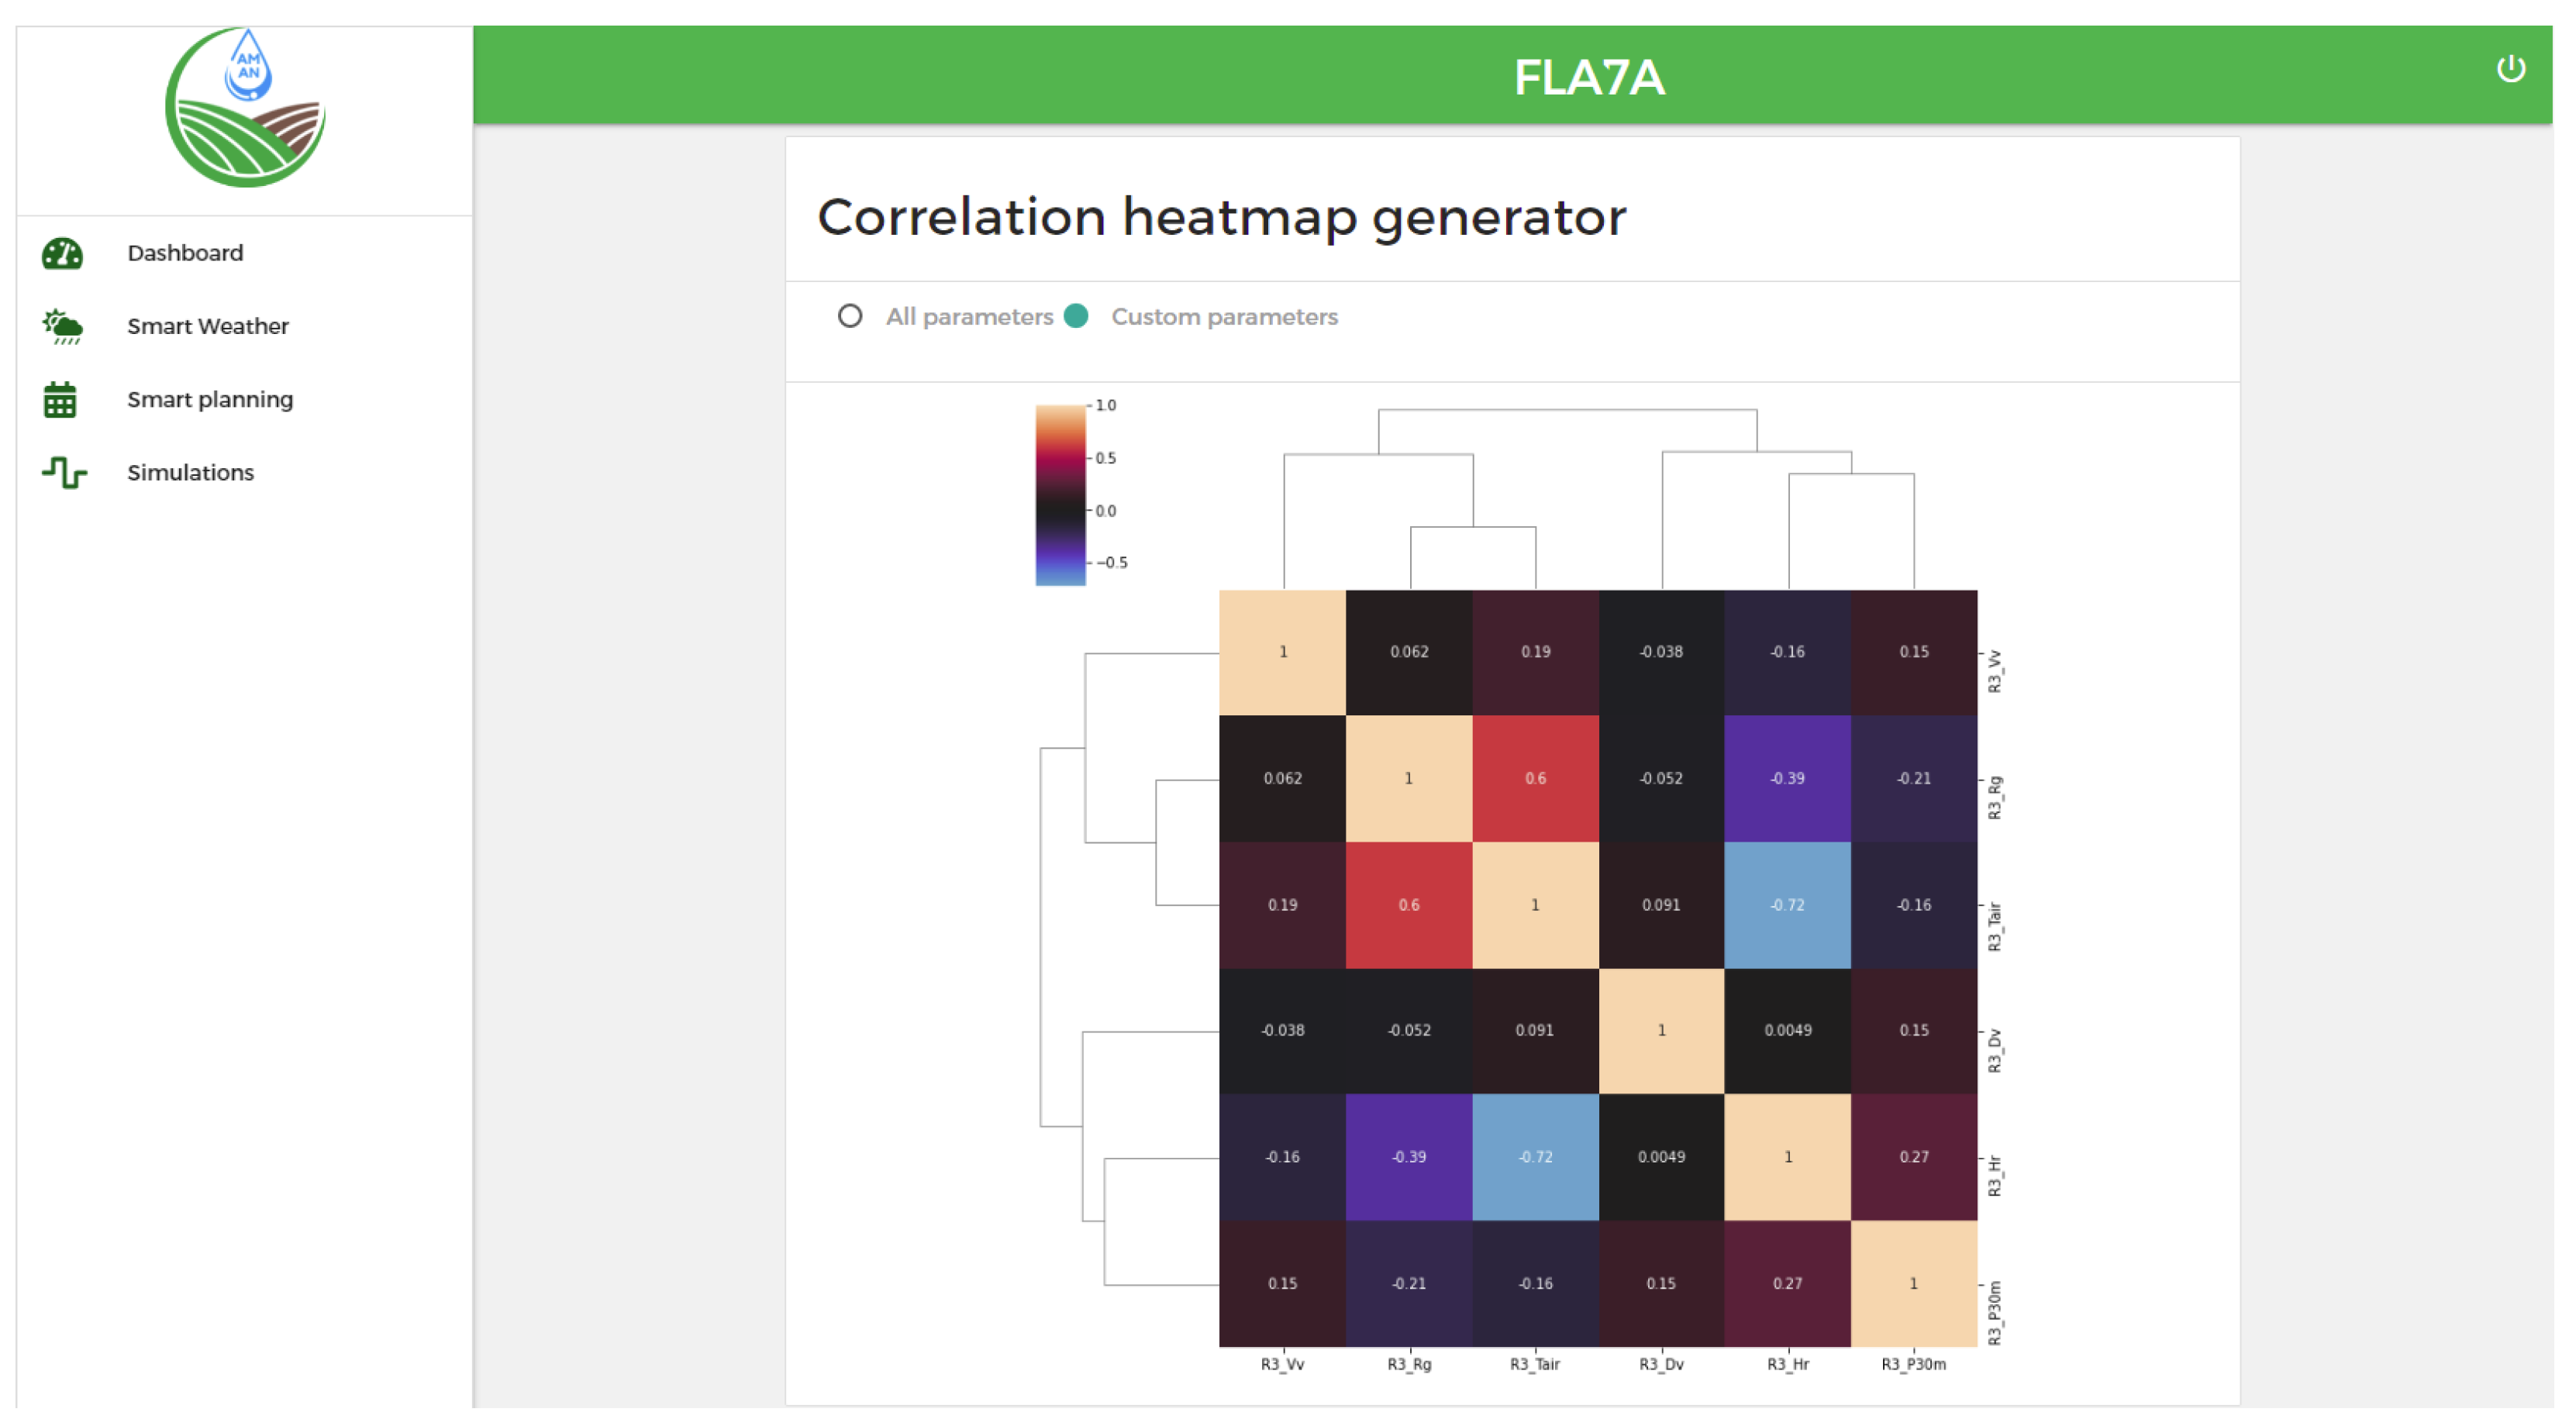
2.2.3. Weather Data Analysis and Visualization Service

This service provides multiple visualization options such as line charts for the evolution of weather time series and also provides data analysis of stored data. One example of such analysis is the generation of the Pearson correlation coefficient matrix calculated using Equation (3) which is then used to investigate the relationship between weather variables.
r = x i x ¯ y i y ¯ x i x ¯ 2 y i y ¯ 2
In the proposed platform, the user choose the target variables and the correlation matrix will then be generated automatically (Figure 4).
Additionally, the platform uses machine learning for modeling and estimation of important parameters used in agriculture such as the evapotranspiration. The flowchart for Figure 5 presents an approach that uses the FAO Penman-Monteith ET 0 [22] as a reference method to learn to estimate the reference evapotranspiration from raw station metrological data. Results of this approach are presented in Section 3.2.

3. Results and Discussion

3.1. Univariate Time Series Forecasting Service

Table 2 presents results for a one-year forecast of the meteorological time series (2020) given the historical data (from 2013 to 2019) at an hourly scale. The concerned parameters were: Air temperature (T a ), Global solar radiation R g , Relative humidity H r , and Wind speed.

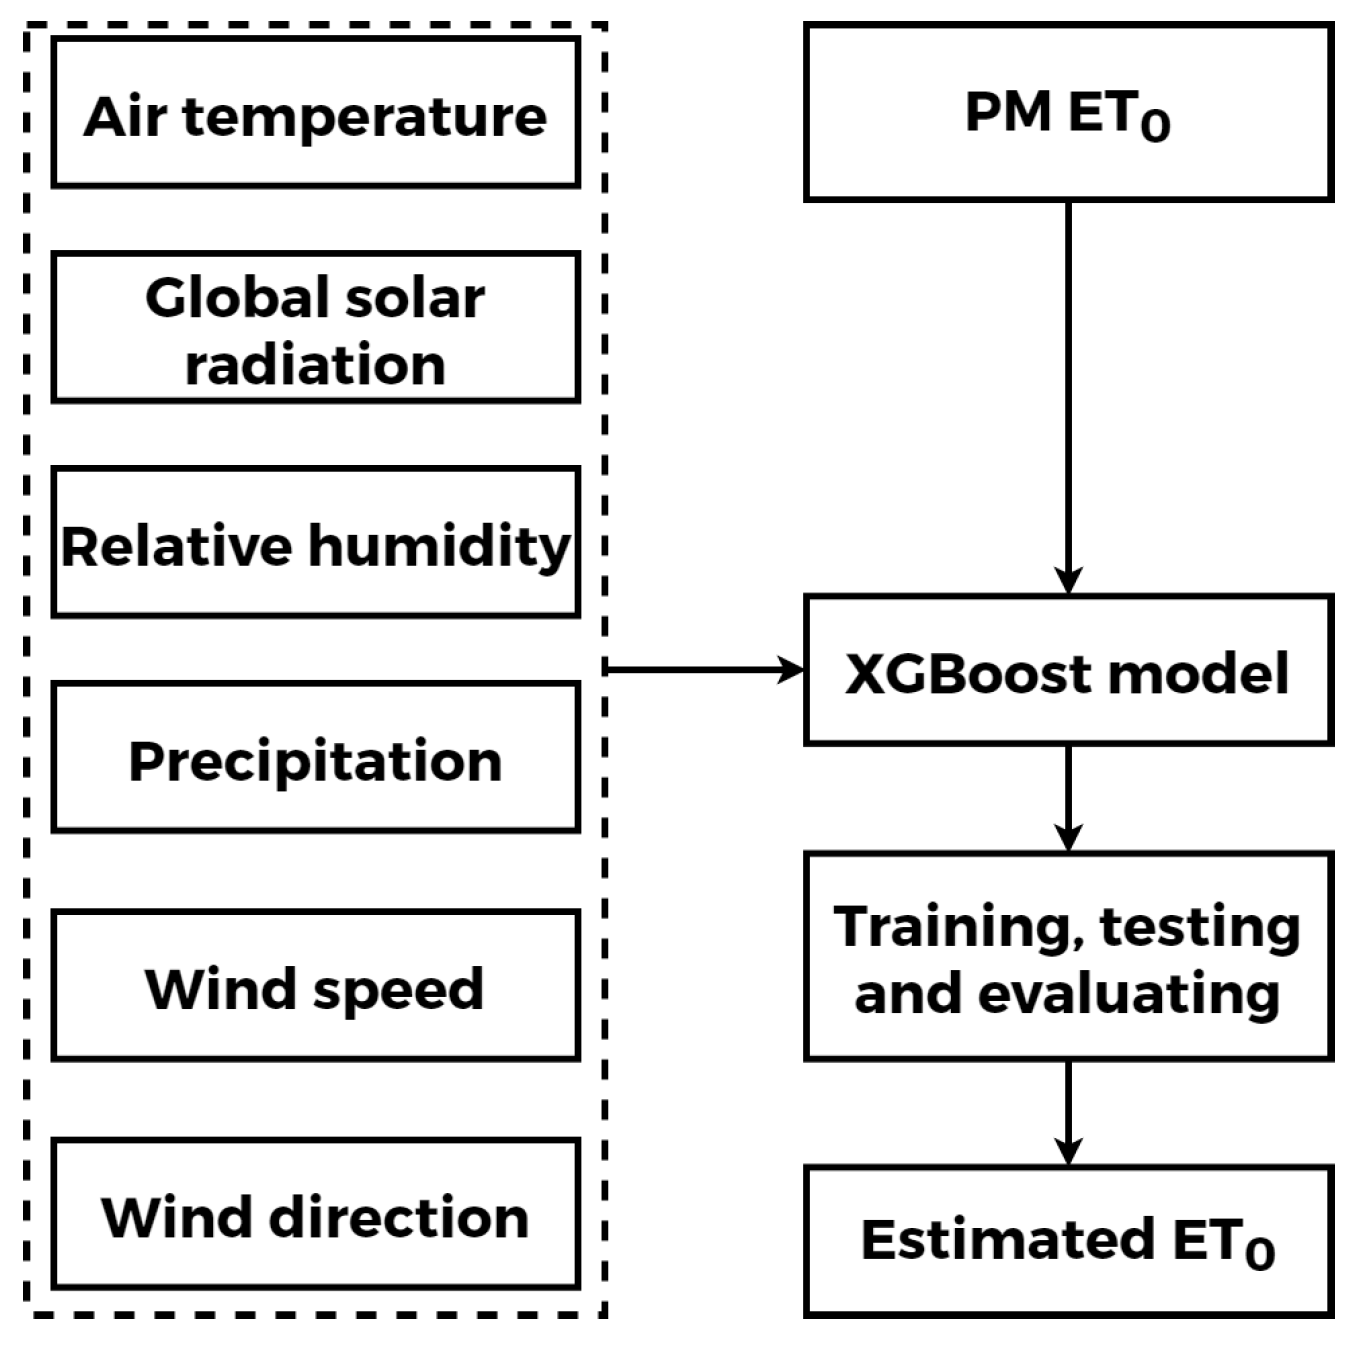
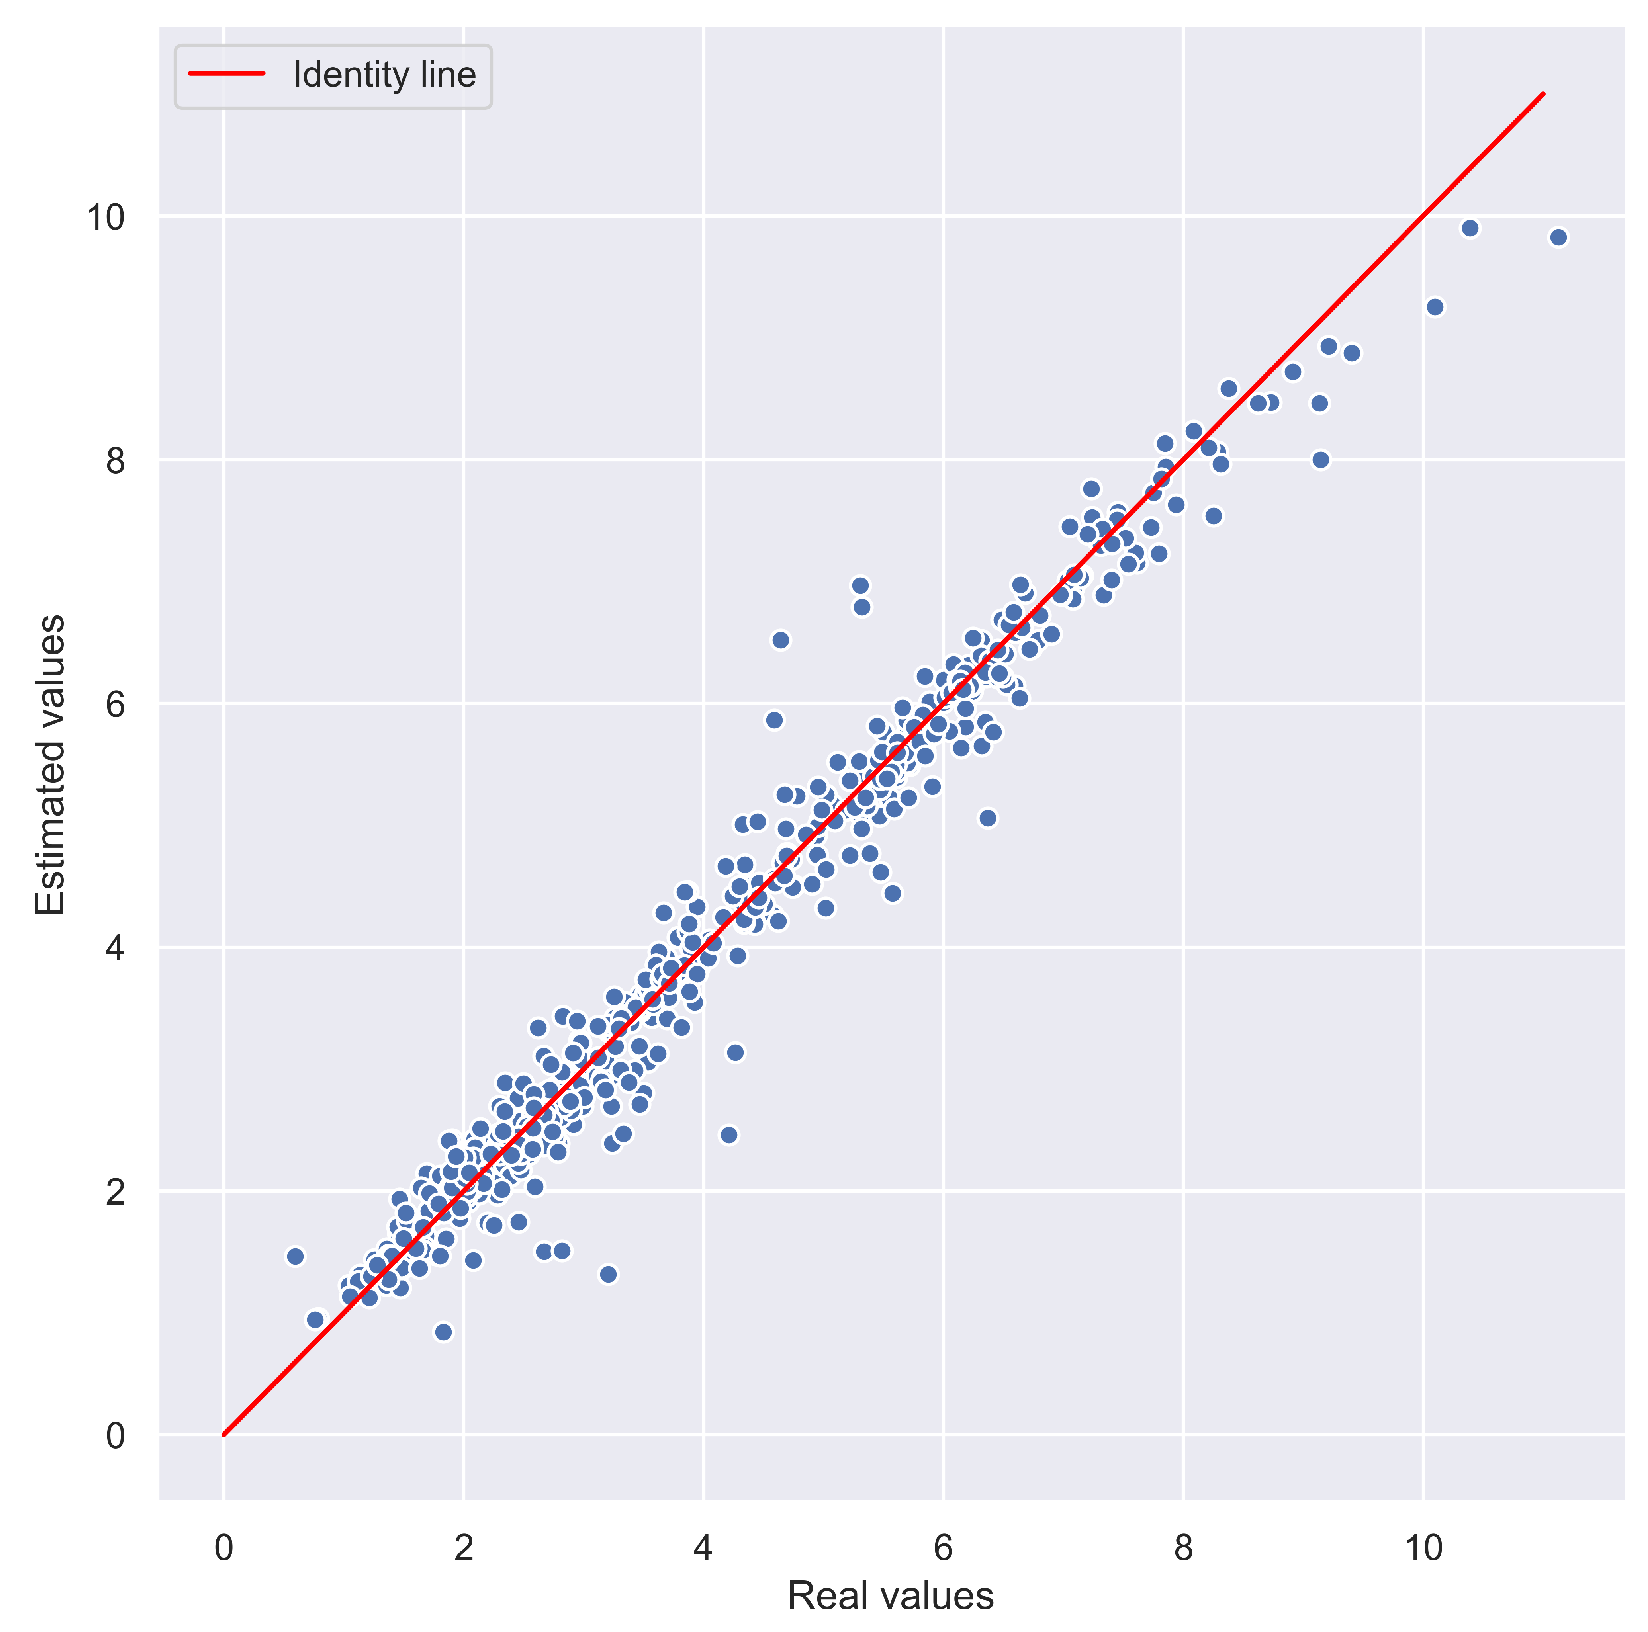
3.2. Estimation of Climatic Parameters Using Machine Learning

To estimate the ET 0 , the performance of the XGBoost [23] machine learning model was evaluated on the data available on the platform, which is used to generate the training (80%) and testing (20%) split sets. This model gives a high coefficient of determination R 2 = 0.96. This means that 96% ET 0 is explained by the trained model. In turn, the RMSE was 0.39. Also, Figure 6 shows a positive linear scatter which indicates a good fit for the model. Code implementation was done using the DST library [24].
Despite the good results obtained, more studies can be conducted to investigate different machine learning models for both forecasting and regression tasks and integrate them into the platform. In the same sense, current proposed services can be optimized and enriched depending on the challenges and problems faced in the deployment phase. In data storage, for example, other technologies can be investigated when it comes to scaling up the system or in dealing with batch processing tasks. A solution to investigate could be the Hadoop ecosystem (Spark, MapReduce, Hive, etc.).

4. Conclusions

In this paper, we proposed a platform based on artificial intelligence and big data analytics as a way to manage weather data efficiently to assist decision-making in agriculture. The platform offers various services for both farmers and policymakers such as weather data visualization, analysis and estimation. It was tested using data from the meteorological station installed in our study areas, covering the period between 2013 and 2020. The platform will be enriched in future work with other services related to implementing smart agricultural practices.

Supplementary Materials

The poster presentation can be downloaded at: https://www.mdpi.com/article/10.3390/IOCAG2022-12240/s1.

Author Contributions

Platform and machine learning models development, C.E.H. and S.B.; methodology, C.E.H., S.B., S.K. and A.C.; writing—original draft, C.E.H.; writing—review and editing, S.B., S.K. and A.C. All authors have read and agreed to the published version of the manuscript.

Funding

This research received no external funding.

Institutional Review Board Statement

Not applicable.

Informed Consent Statement

Not applicable.

Data Availability Statement

The data presented in this study are available on request from the corresponding author.

Acknowledgments

This study was supported by and conducted within the Center for Remote Sensing Applications (CRSA), at the Mohammed VI Polytechnic University (UM6P) in Morocco.

Conflicts of Interest

The authors declare that they have no known competing financial interests or personal relationships that could have appeared to influence the work reported in this paper.

References

  1. Wade, M.; Hoelle, J.; Patnaik, R. Impact of Industrialization on Environment and Sustainable Solutions—Reflections from a South Indian Region. IOP Conf. Ser. Earth Environ. Sci. 2018, 120, 012016. [Google Scholar] [CrossRef]
  2. Bongaarts, J. Human population growth and the demographic transition. Philos. Trans. R. Soc. B Biol. Sci. 2009, 364, 2985. [Google Scholar] [CrossRef] [PubMed] [Green Version]
  3. Frisvold, G.; Sanchez, C.; Gollehon, N.; Megdal, S.B.; Brown, P. Evaluating Gravity-Flow Irrigation with Lessons from Yuma, Arizona, USA. Sustainability 2018, 10, 1548. [Google Scholar] [CrossRef] [Green Version]
  4. Nafchi, R.A. Evaluation of the Efficiency of the Micro-irrigation Systems in Gardens of Chaharmahal and Bakhtiari Province of Iran. Int. J. Agric. Econ. 2021, 6, 106. [Google Scholar] [CrossRef]
  5. Math, R.K.M.; Dharwadkar, N.V. IoT Based low-cost weather station and monitoring system for precision agriculture in India. In Proceedings of the 2018 2nd International Conference on I-SMAC (IoT in Social, Mobile, Analytics and Cloud) (I-SMAC)I-SMAC (IoT in Social, Mobile, Analytics and Cloud) (I-SMAC), Palladam, India, 30–31 August 2018; pp. 81–86. [Google Scholar] [CrossRef]
  6. Majumdar, P.; Mitra, S. IoT and Machine Learning-Based Approaches for Real Time Environment Parameters Monitoring in Agriculture: An Empirical Review. In Agricultural Informatics: Automation Using the IoT and Machine Learning; Choudhury, A., Biswas, A., Prateek, M., Chakrabarti, A., Eds.; Scrivener Publishing LLC: Beverly, MA, USA, 2021; Chapter 5; pp. 89–115. [Google Scholar] [CrossRef]
  7. Kumar, S.; Ansari, M.A.; Pandey, S.; Tripathi, P.; Singh, M. Weather Monitoring System Using Smart Sensors Based on IoT. Lect. Notes Netw. Syst. 2020, 106, 351–363. [Google Scholar] [CrossRef]
  8. Kodali, R.K.; Mandal, S. IoT based weather station. In Proceedings of the 2016 International Conference on Control, Instrumentation, Communication and Computational Technologies (ICCICCT), Kumaracoil, India, 16–17 December 2016; pp. 680–683. [Google Scholar] [CrossRef]
  9. Mittal, Y.; Mittal, A.; Bhateja, D.; Parmaar, K.; Mittal, V.K. Correlation among environmental parameters using an online Smart Weather Station System. In Proceedings of the 2015 Annual IEEE India Conference (INDICON), New Delhi, India, 17–20 December 2015. [Google Scholar] [CrossRef]
  10. Djordjević, M.; Jovičić, B.; Marković, S.; Paunović, V.; Danković, D. A smart data logger system based on sensor and Internet of Things technology as part of the smart faculty. J. Ambient Intell. Smart Environ. 2020, 12, 359–373. [Google Scholar] [CrossRef]
  11. Djordjevic, M.; Dankovic, D. A smart weather station based on sensor technology. Facta Univ. Ser. Electron. Energetic 2019, 32, 195–210. [Google Scholar] [CrossRef] [Green Version]
  12. National Imagery and Mapping Agency. Department of Defense World Geodetic System 1984: Its Definition and Relationships with Local Geodetic Systems, 2nd ed.; National Imagery and Mapping Agency: St. Louis, MO, USA, 1991. [Google Scholar]
  13. Er-Raki, S.; Chehbouni, A.; Duchemin, B. Combining Satellite Remote Sensing Data with the FAO-56 Dual Approach for Water Use Mapping In Irrigated Wheat Fields of a Semi-Arid Region. Remote Sens. 2010, 2, 375–387. [Google Scholar] [CrossRef] [Green Version]
  14. Belaqziz, S.; Khabba, S.; Kharrou, M.H.; Bouras, E.H.; Er-Raki, S.; Chehbouni, A. Optimizing the Sowing Date to Improve Water Management and Wheat Yield in a Large Irrigation Scheme, through a Remote Sensing and an Evolution Strategy-Based Approach. Remote Sens. 2021, 13, 3789. [Google Scholar] [CrossRef]
  15. Er-Raki, S.; Chehbouni, A.; Guemouria, N.; Duchemin, B.; Ezzahar, J.; Hadria, R. Combining FAO-56 model and ground-based remote sensing to estimate water consumptions of wheat crops in a semi-arid region. Agric. Water Manag. 2007, 87, 41–54. [Google Scholar] [CrossRef] [Green Version]
  16. Tiles (C) Esri—Source: Esri, USGS | GEOMATIC, Esri, i-cubed, USDA, USGS, AEX, GeoEye, Getmapping, Aerogrid, IGN, IGP, UPR-EGP, © OpenStreetMap contributors, HERE, Garmin, FAO, NOAA, USGS | Earthstar Geographics, and the GIS User Community.
  17. Le Page, M.; Toumi, J.; Khabba, S.; Hagolle, O.; Tavernier, A.; Kharrou, M.H.; Er-Raki, S.; Huc, M.; Kasbani, M.; Moutamanni, A.E.; et al. A Life-Size and Near Real-Time Test of Irrigation Scheduling with a Sentinel-2 Like Time Series (SPOT4-Take5) in Morocco. Remote Sens. 2014, 6, 11182–11203. [Google Scholar] [CrossRef] [Green Version]
  18. Er-Raki, S.; Chehbouni, A.; Khabba, S.; Simonneaux, V.; Jarlan, L.; Ouldbba, A.; Rodriguez, J.C.; Allen, R. Assessment of reference evapotranspiration methods in semi-arid regions: Can weather forecast data be used as alternate of ground meteorological parameters? J. Arid Environ. 2010, 74, 1587–1596. [Google Scholar] [CrossRef] [Green Version]
  19. Taylor, S.J.; Letham, B. Forecasting at Scale. Am. Stat. 2018, 72, 37–45. [Google Scholar] [CrossRef]
  20. Hochreiter, S.; Schmidhuber, J. Long Short-Term Memory. Neural Comput. 1997, 9, 1735–1780. [Google Scholar] [CrossRef] [PubMed]
  21. El Hachimi, C.; Belaqziz, S.; Khabba, S.; Chehbouni, A. Towards precision agriculture in Morocco: A machine learning approach for recommending crops and forecasting weather. In Proceedings of the 2021 International Conference on Digital Age & Technological Advances for Sustainable Development (ICDATA), Marrakech, Morocco, 29–30 June 2021; pp. 88–95. [Google Scholar] [CrossRef]
  22. Penman, H.L. Natural evaporation from open water, hare soil and grass. Proc. R. Soc. Lond. A. Math. Phys. Sci. 1948, 193, 120–145. [Google Scholar] [CrossRef] [PubMed] [Green Version]
  23. Chen, T.; Guestrin, C. XGBoost: A scalable tree boosting system. In KDD ’16: Proceedings of the 22nd ACM SIGKDD International Conference on Knowledge Discovery and Data Mining, San Francisco, CA, USA, 13–17 August 2016; Association for Computing Machinery: New York, NY, USA, 2016; pp. 785–794. [Google Scholar] [CrossRef] [Green Version]
  24. El Hachimi, C.; Belaqziz, S.; Khabba, S.; Chehbouni, A. Data Science Toolkit: An all-in-one python library to help researchers and practitioners in implementing data science-related algorithms with less effort. Softw. Impacts 2022, 12, 100240. [Google Scholar] [CrossRef]
Figure 1. The location of the R3 district study area in Morocco [16].
Chemproc 10 00054 g001
Figure 2. Data analytics cycle.
Chemproc 10 00054 g002
Figure 3. The layered architecture of the platform.
Chemproc 10 00054 g003
Figure 4. A screenshot of the platform’s data analysis service.
Chemproc 10 00054 g004
Figure 5. The flowchart of ET 0 estimating using machine learning.
Chemproc 10 00054 g005
Figure 6. Scatter plot showing the relationship between real and estimated ET 0 .
Chemproc 10 00054 g006
Table 1. Meteorological station data description.
VariablesDescriptionUnit
R3_DvWind directionDegree
R3_HrRelative humidityNo unit
R3_RgGlobal solar radiationW m 2
R3_TairAir temperature°C
R3_VvWind speedm s 1
R3_P30mRainfallmm
Table 2. Performance of univariate forecasting service.
Metric / ParameterT a R g H r Wind Speed
R 2 0.820.830.480.18
RMSE3.61114.2316.730.94
Publisher’s Note: MDPI stays neutral with regard to jurisdictional claims in published maps and institutional affiliations.

