Proceeding Paper

Weed Detection in Rice Fields Using UAV and Multispectral Aerial Imagery †

by
Rhushalshafira Rosle
1,
Nursyazyla Sulaiman
1,
Nik Norasma Che′Ya
1,*,
Mohd Firdaus Mohd Radzi
1,
Mohamad Husni Omar
2,
Zulkarami Berahim
2,
Wan Fazilah Fazlil Ilahi
1,
Jasmin Arif Shah
1 and
Mohd Razi Ismail
2
1
Department of Agriculture Technology, Faculty of Agriculture, Universiti Putra Malaysia, Serdang 43400, Malaysia
2
Institute of Tropical Agriculture and Food Security, University Putra Malaysia, Serdang 43400, Malaysia
*
Author to whom correspondence should be addressed.
Presented at the 1st International Online Conference on Agriculture-Advances in Agricultural Science and Technology, 10–25 February 2022.
Chem. Proc. 2022, 10(1), 44; https://doi.org/10.3390/IOCAG2022-12519
Published: 1 July 2022

Abstract

:
Weeds are plants that compete for nutrients, space, and light and exert many harmful effects by reducing the quality and quantity of crops if the weed population is uncontrolled. The direct yield loss has been estimated to be within the range of 16–86%, depending on the type of rice culture, weed species, and environmental conditions. Currently, farmers apply herbicides at the same rate to control weeds. Excessive chemical usage will negatively affect the environment, crop productivity, and the economy. A map-based system can help in directing the herbicide sprayer to specific areas. Producing a weed map is very challenging due to the similarity of the crops and the weeds. Therefore, using UAVs and multispectral imagery solves the weed detection problem in a paddy field. The objective of this study project is to detect weeds in rice fields using a UAV and multispectral imagery. Multispectral imagery was used to identify the condition of the crops. It can be an indicator to determine weeds and paddy plants based on the spectral resolution in the imagery. This study was performed at Tunjang, Jitra, Kedah, which has a total area of 0.5 ha. The two types of data collections of this study are ground data and aerial data collection. Ground data were collected using the Soil Plant Analysis Development (SPAD) meter, which can read the chlorophyll value of the area. For aerial data, an unmanned aerial vehicle (UAV) was used, attached with a multispectral camera, Micasense, and a Red Green Blue (RGB) camera. Aerial data collection was conducted on the same day as ground data collection, on 30 June 2020 (the day after sowing (DAS) 34). A correlation between these two data was conducted. The study output is a weed map developed from the RGB image and multispectral imagery normalized difference vegetation index (NDVI) map. The correlation of the NDVI value with the UAV with SPAD data was weak. It has a positive, but not significant.

1. Introduction

Weeds are undesirable plants that develop within the field, which compete with crops for soil nutrients, water, space, canopy, and light [1]. Weeds can have a few negative results, such as crop yield misfortune, producing a considerable number of seeds in this manner, making a weed seed bank within the field, and contaminating grains during harvest if left unchecked. Weeds can also introduce diseases that can cause yield loss [2]. Therefore, weed management is critical for agricultural production [1]. Weed competition is one of the significant causes of yield loss. This is because it disrupts the growth of the paddy field by competing with the crops for water, light, nutrients, and space. Weeds can also increase production costs, trouble harvesting, deterioration of product quality, increment risk of pests and infections, and decrease in cultivated areas′ commercial value [3]. If the rice field is heavily infested with weeds, the yield drop is significant [4,5]. The direct yield loss has been estimated to be within the range of 16–86% depending on the type of rice culture, cultivar, weed species and density, cropping season, plant spacing, fertilizer rate, duration and time of weed infestation, and climatic and environmental conditions
Weed management is highly reliant on herbicides; however, other control measures can be integrated, including cultural, physical, biological, and mechanical methods. In Malaysia, weed management is mostly herbicide-based and costs around MYR 17.03 million annually on herbicides for rice alone and total of yield losses ranging from 10% to 35% have been recorded [6]. Therefore, if not controlled, weedy rice infestations also might reduce harvests by 80% [5]. Weeds′ spatial density is not uniform over the field, thereby driving the abuse of chemicals of environmental concern and the advancement of herbicide-resistant weeds [7].
Therefore, technological advancements have a significant impact on the efficiency of weed management, such as the use of unmanned aerial vehicles (UAVs) and satellite imagery, which have brought a colossal effect on-farm management [1]. UAVs can produce aerial images implanted with different data depending on the sensors utilized, such as multispectral camera, RGB camera, hyperspectral camera, and thermal sensor. UAVs have the capacity to cover large zones in a brief space of time and the payload capacity to carry optical sensors [8]. The images from UAVs and sensors later undergo processing to form an important feature that is understandable for the end-users. A map-based system created from UAV images can help to direct the herbicide sprayer to specific areas to overcome the afore-mentioned problems. Producing a weed map is very challenging due to the similarity of the crops and the weeds. Therefore, UAVs and multispectral imagery solve the weed practice application and yield problems. This study aims to detect weeds in rice fields using remote sensing multispectral imagery.

2. Unmanned Aerial Vehicle (UAV) and Weed Detection Using Multispectral Imagery

Unmanned aerial vehicle (UAV) remote sensing systems have become a popular topic worldwide because they are mobile, rapid, and economic [8]. Moreover, it has potential as an alternative given its low cost of operation in environmental monitoring and agriculture application. Drone imagery is valuable information in giving an exact estimate of loss [7]. In this case, the drone images can produce a weed map. Weeding imagery, timely weed detection, and rice or weed discrimination can decrease the weeding cost process.
Weeds compete with the actual crop for nutrients, light, moisture intensity, and gaseous exchange in the agricultural ecosystem, resulting in a decline in crop output and product quality [9]. Images acquired by unmanned aerial vehicles have proven their suitability for early weed detection in crops [10]. Remote sensing with unmanned aerial vehicles is considered a game-changer in precision farming because it offers a phenomenal spectral, spatial, and temporal resolution. Still, it can give point-by-point vegetation stature information and multi-angular perceptions [11]. The UAV can be effectively flown and maintained with small training, making it an excellent alternative for farmers looking to progress their farming by merging agriculture with remote sensing technology [12]. Therefore, UAV use will allow farmers to monitor their crop′s condition continually and compare the ground surveying for the validation process in an effective way [13]. Table 1 shows the advantages and limitations of different types of UAVs.
Weed management is one of the principal vital aspects of crop productivity, and finding its exact location has become a problem for farmers for several decades 15. Therefore, a particular weed treatment is essential in crop management related to crop health and yield. However, a key challenge is solid and precise weed location to lower the risk of harming surrounding plants. According to Osorio et al. [15] and Liu et al. [16], because the crop plants are small and have several traits that are similar to weeds, detecting them may be challenging. As a result, satellite photos are unable to give the necessary data. Unmanned aircraft systems (UASs) are a better option because they can be controlled remotely or automatically over short and long distances, capturing digital images at the height and frequency specified by the user, which varies depending on the type of UAV that operates the system.
These UAVs can also be equipped with multispectral cameras, which provide more information than an RGB digital image because they record spectral bands not visible to the human eye, such as near infrared (NIR), and provide data on things such as visible light reflectance and vegetation indices [15]. Multispectral imaging initiated by sensors compute reflected energy within several specific sections or are recognized as bands of the electromagnetic spectrum and utilized about tens of discrete spectral bands for image processing [17]. This multispectral image can be taken from a UAV at usually 60 and 70 m height, depending on the type of crops and location [18]. These images can later be processed using software such as ArcGIS to determine the exact spot of weeds within the area. Therefore, this technology can help farmers to overcome their weed problems in the field.

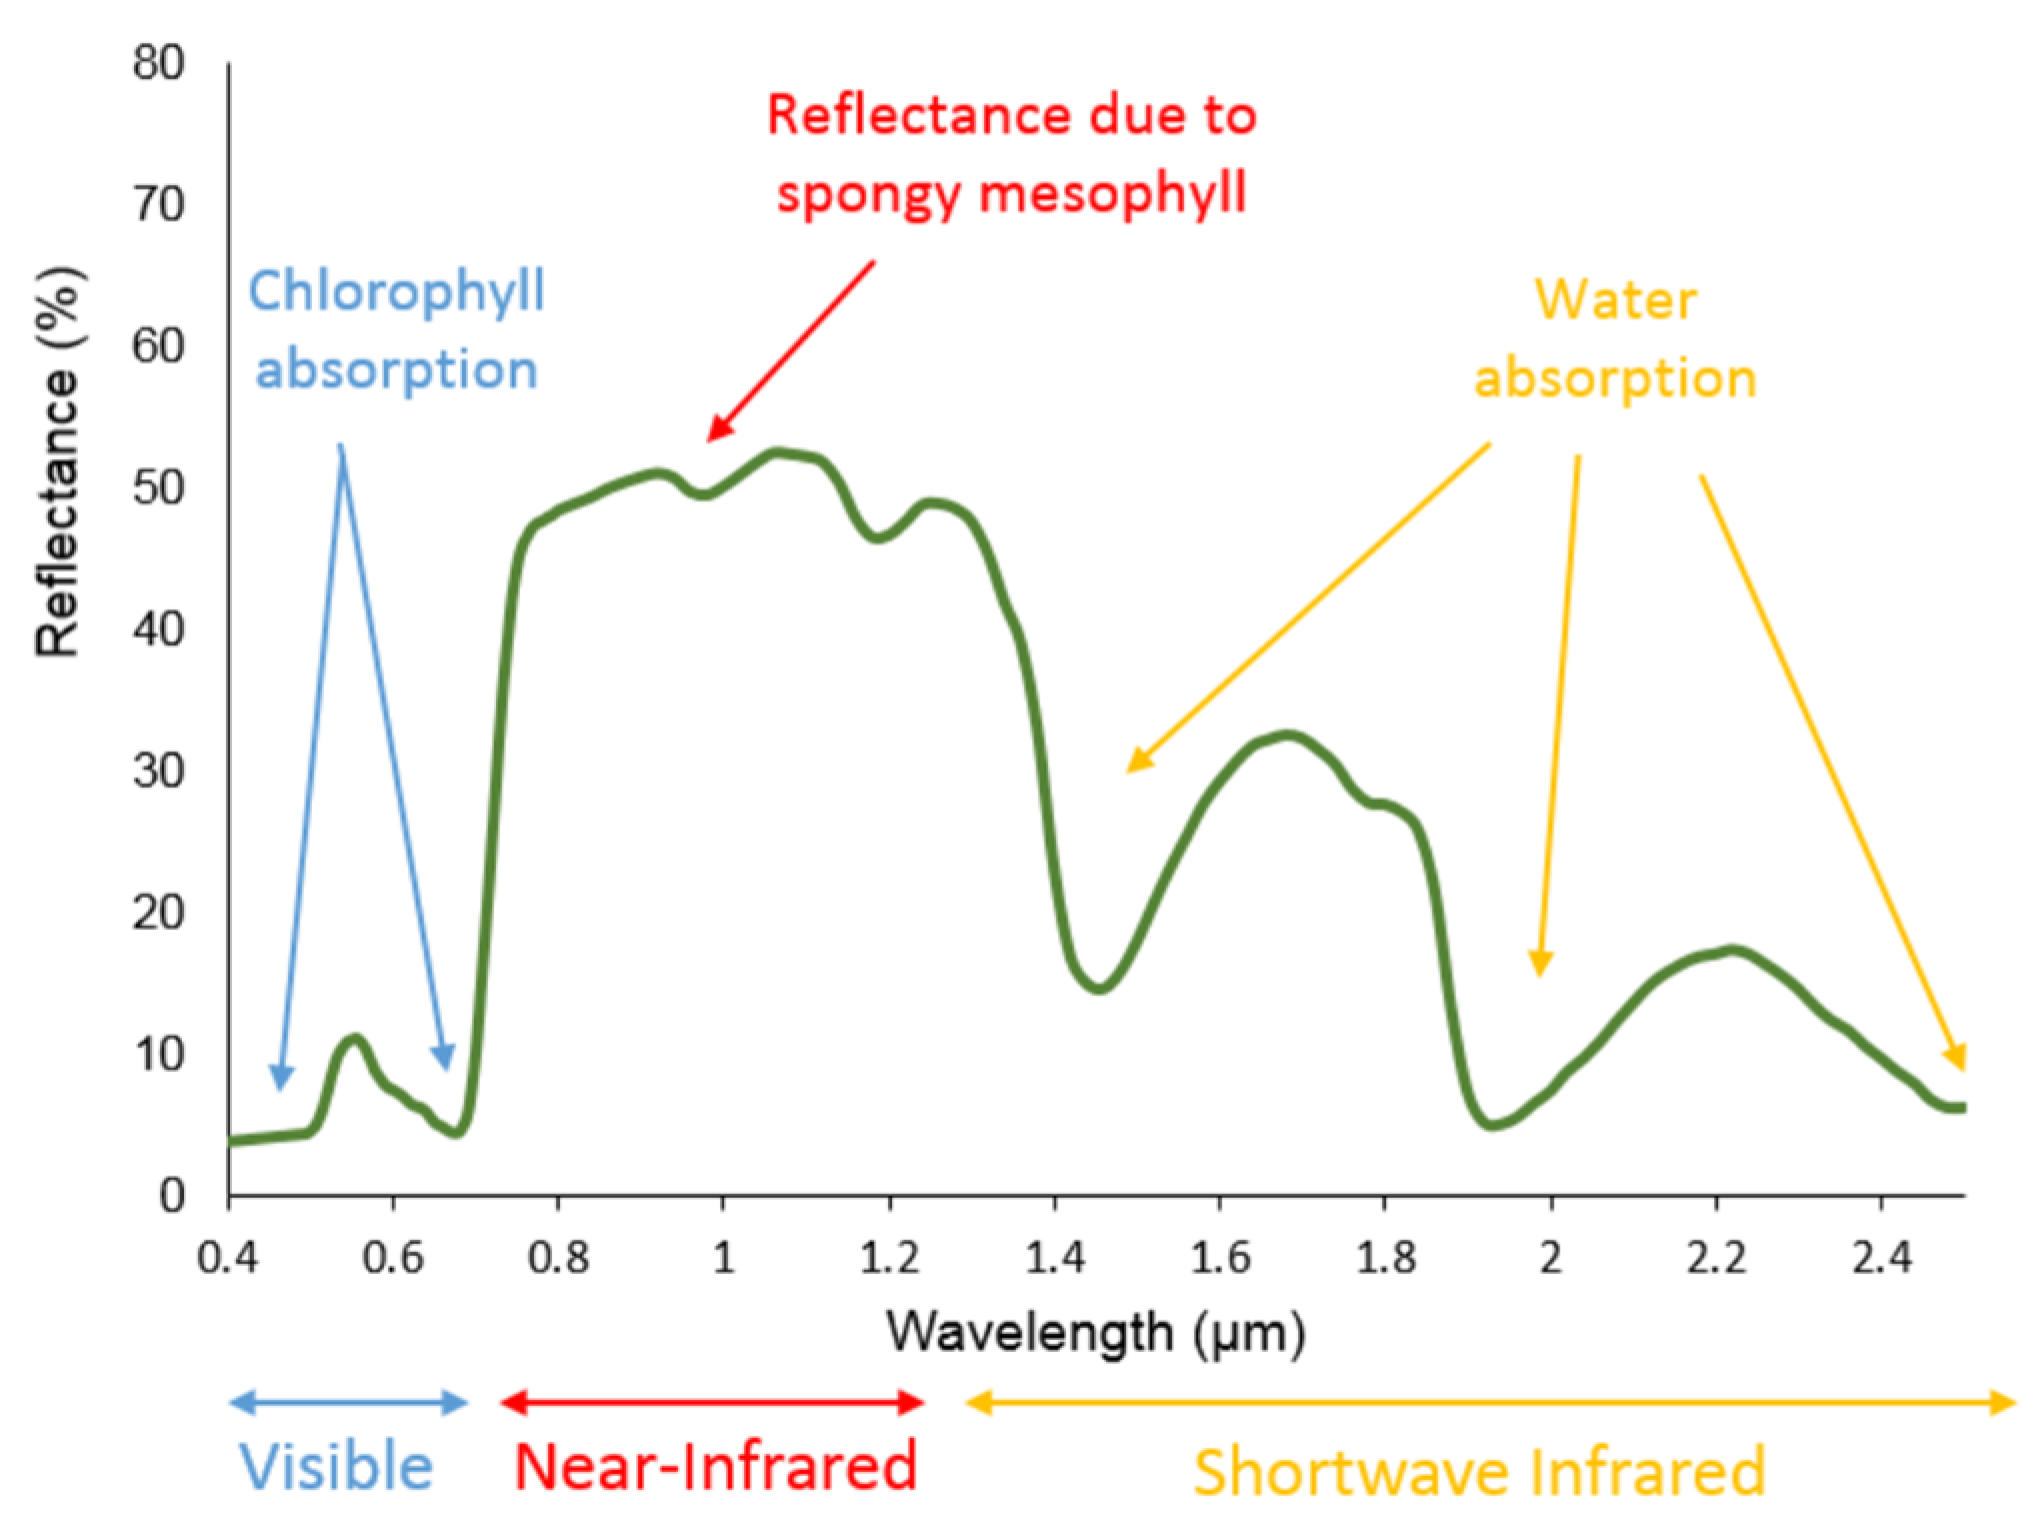
Spectral Reflectance of Vegetation and Vegetation Index

To detect and map weeds using remote sensing technologies, spectral reflectance differences between weeds and their surroundings must be identified, and the spatial and spectral resolution of remote sensing equipment must be sufficient to detect these differences [19]. Each object, such as plant, soil, and water, has a distinctive reflection rate and absorption of light energy radiated from the sun. Remote sensing can recognize the interactions between reflected, absorbed, and transmitted energy. This relationship between reflected, interested, and transmitted power can be utilized to decide the spectral signatures of individual plants. Every plant has a unique spectral signature. However, spectral reflectance curve design for each distinctive plant may have a comparable graph pattern across the visible spectrum until near-infrared. Figure 1 shows the vegetative spectral reflectance curve [20].
The majority of the plants assimilate blue and red bands and reflect green bands and NIR. The comparison or relationship between these reflectance values at distinctive wavelengths is called the vegetative index, which is commonly utilized to decide plant vigor. The most common vegetative index is the normalized difference vegetative index (NDVI). NDVI is one example of an index and can act as an indicator of plant vigor [21]. NDVI is used to determine the amount of vegetation in an area. NDVI compares the reflectance values of the red and NIR regions of the electromagnetic spectrum. The green leaves strongly absorb visible light (red wavelength), but highly reflect near-infrared wavelength light. This study shows that NDVI can be used to analyze any vegetative crops, and it is also closely related to SPAD value. The equation for the NDVI is:
NDVI = (NIR − R)/(NIR + R)
where NIR represents the reflectance value of the near-infrared band, and R is the reflectance value in the red band (Vergara-Díaz et al., 2016). NDVI creates a value range from +1.0 to −1.0. A high vegetation value will be within the field near 1.0, whereas the lowest vegetation value is within the range near 0 [22].

3. Materials and Methods

The study area for the project was in Lembaga Kemajuan Pertanian Muda MADA, Tunjang, Jitra, Kedah. The rice variety utilized in this study plot was PadiU Putra. PadiU Putra seeds were broadcasted and planted on 28 May 2020. The total area used for this project was 0.5 ha. The first data acquisition for this project was performed on 15 June 2020 (the day after sowing (DAS) 19) and the second one on 23 June 2020 (DAS 27).

3.1. Data Collections

3.1.1. Experimental Design

A total of 8 blocks were created from the study plot area. Two treatments were used and labeled T0 and T1, which indicate the control and fertilizer and herbicide, respectively. Eight random units were taken from each block for SPAD meter reading as ground data. So, there were 64 points because there were eight blocks with four replications and two types of treatment; hence, we created eight blocks of the complete experimental design.

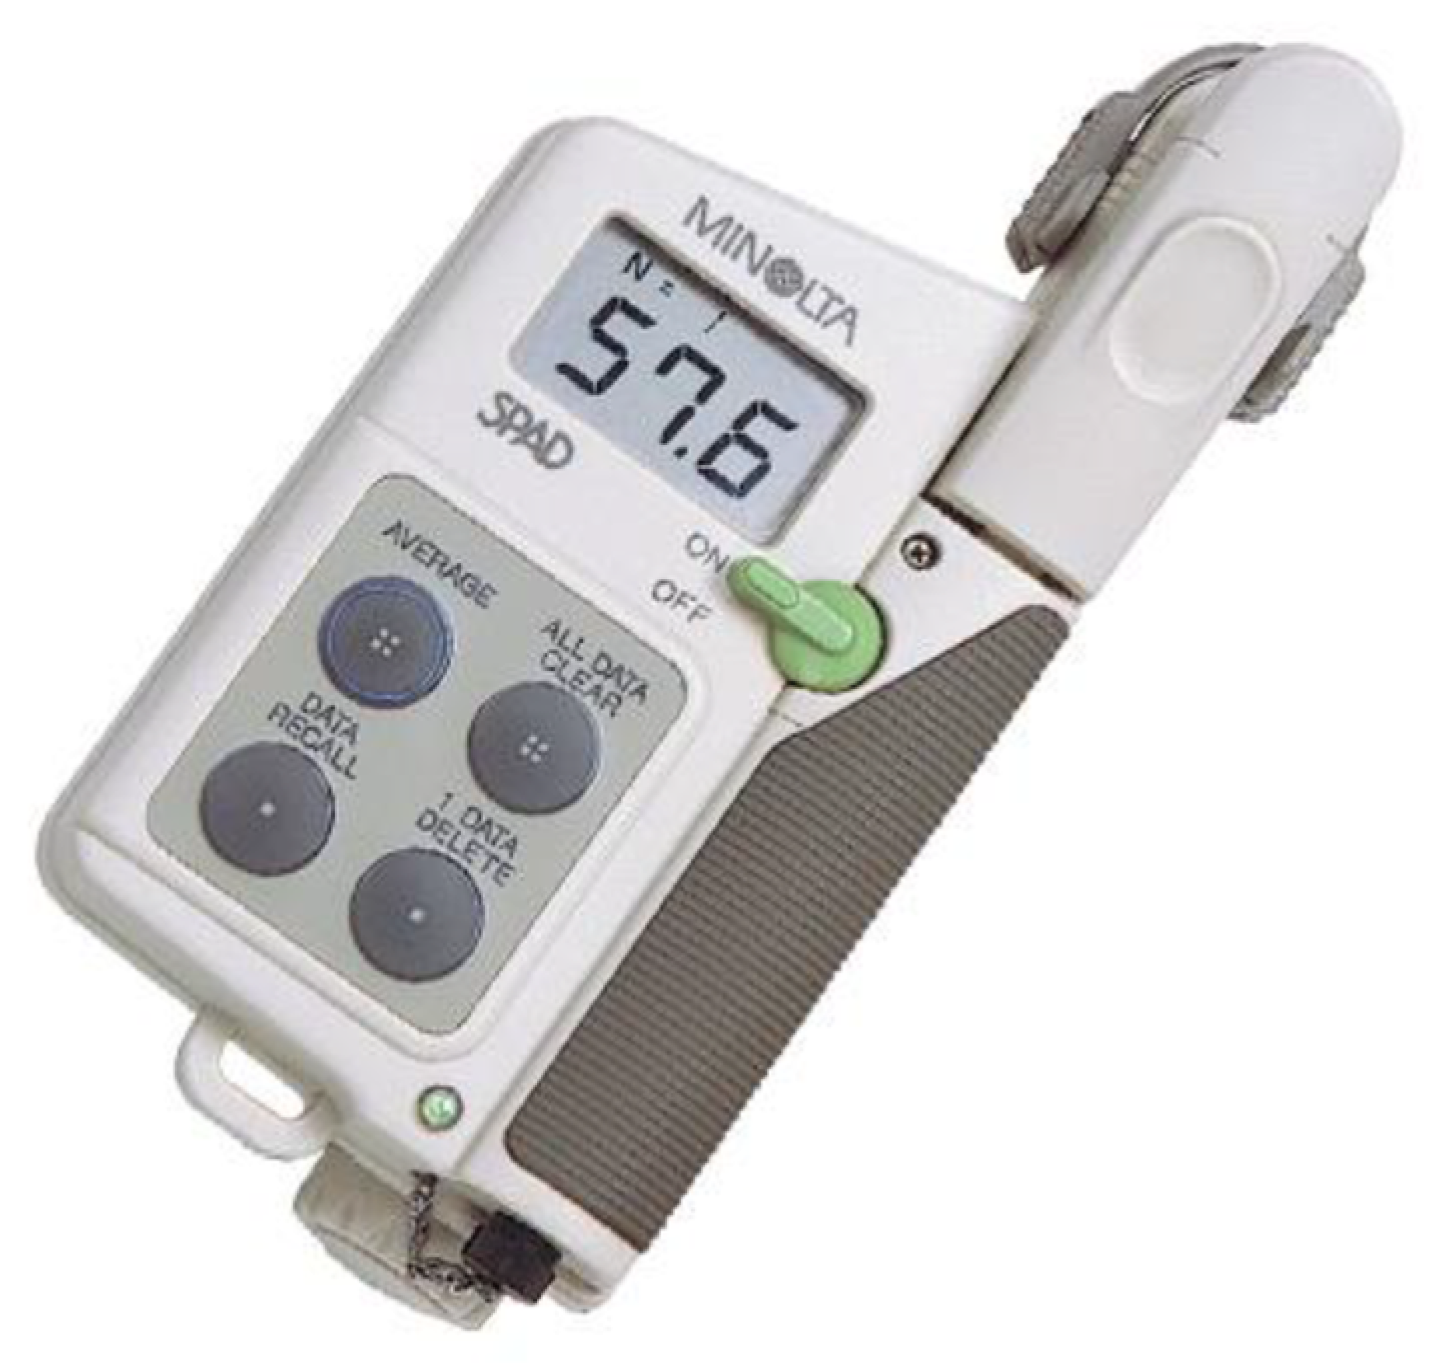
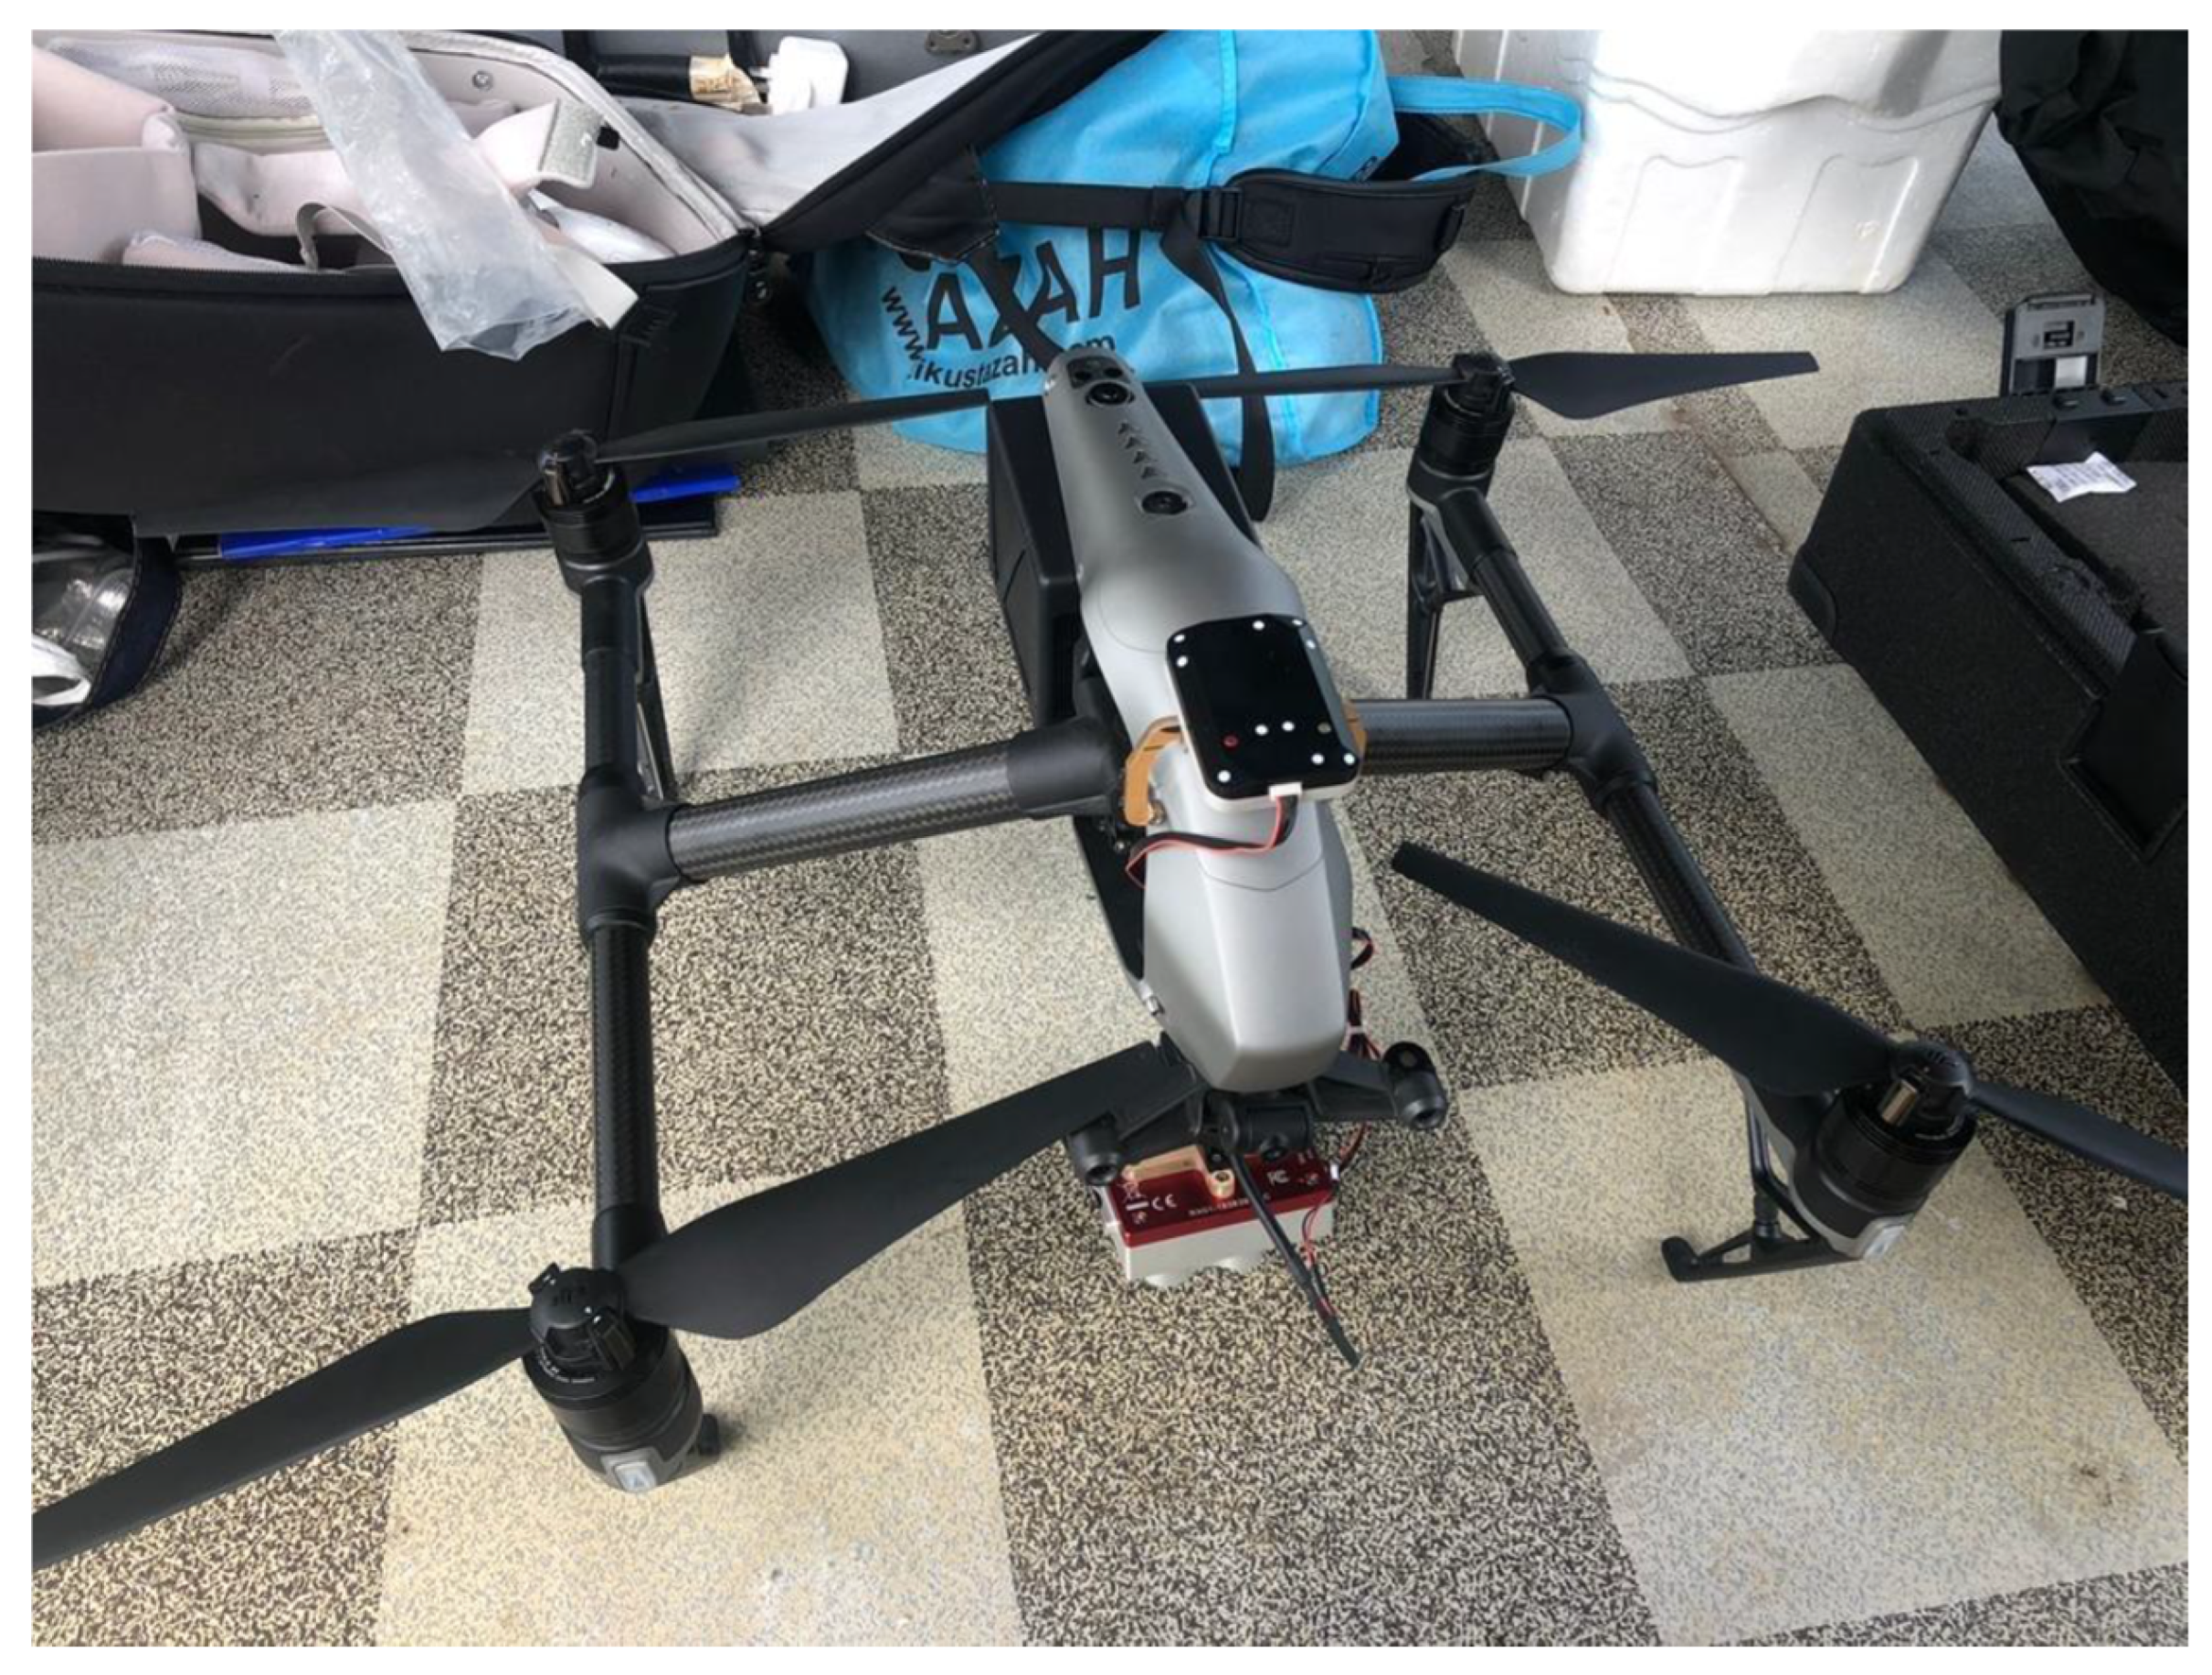
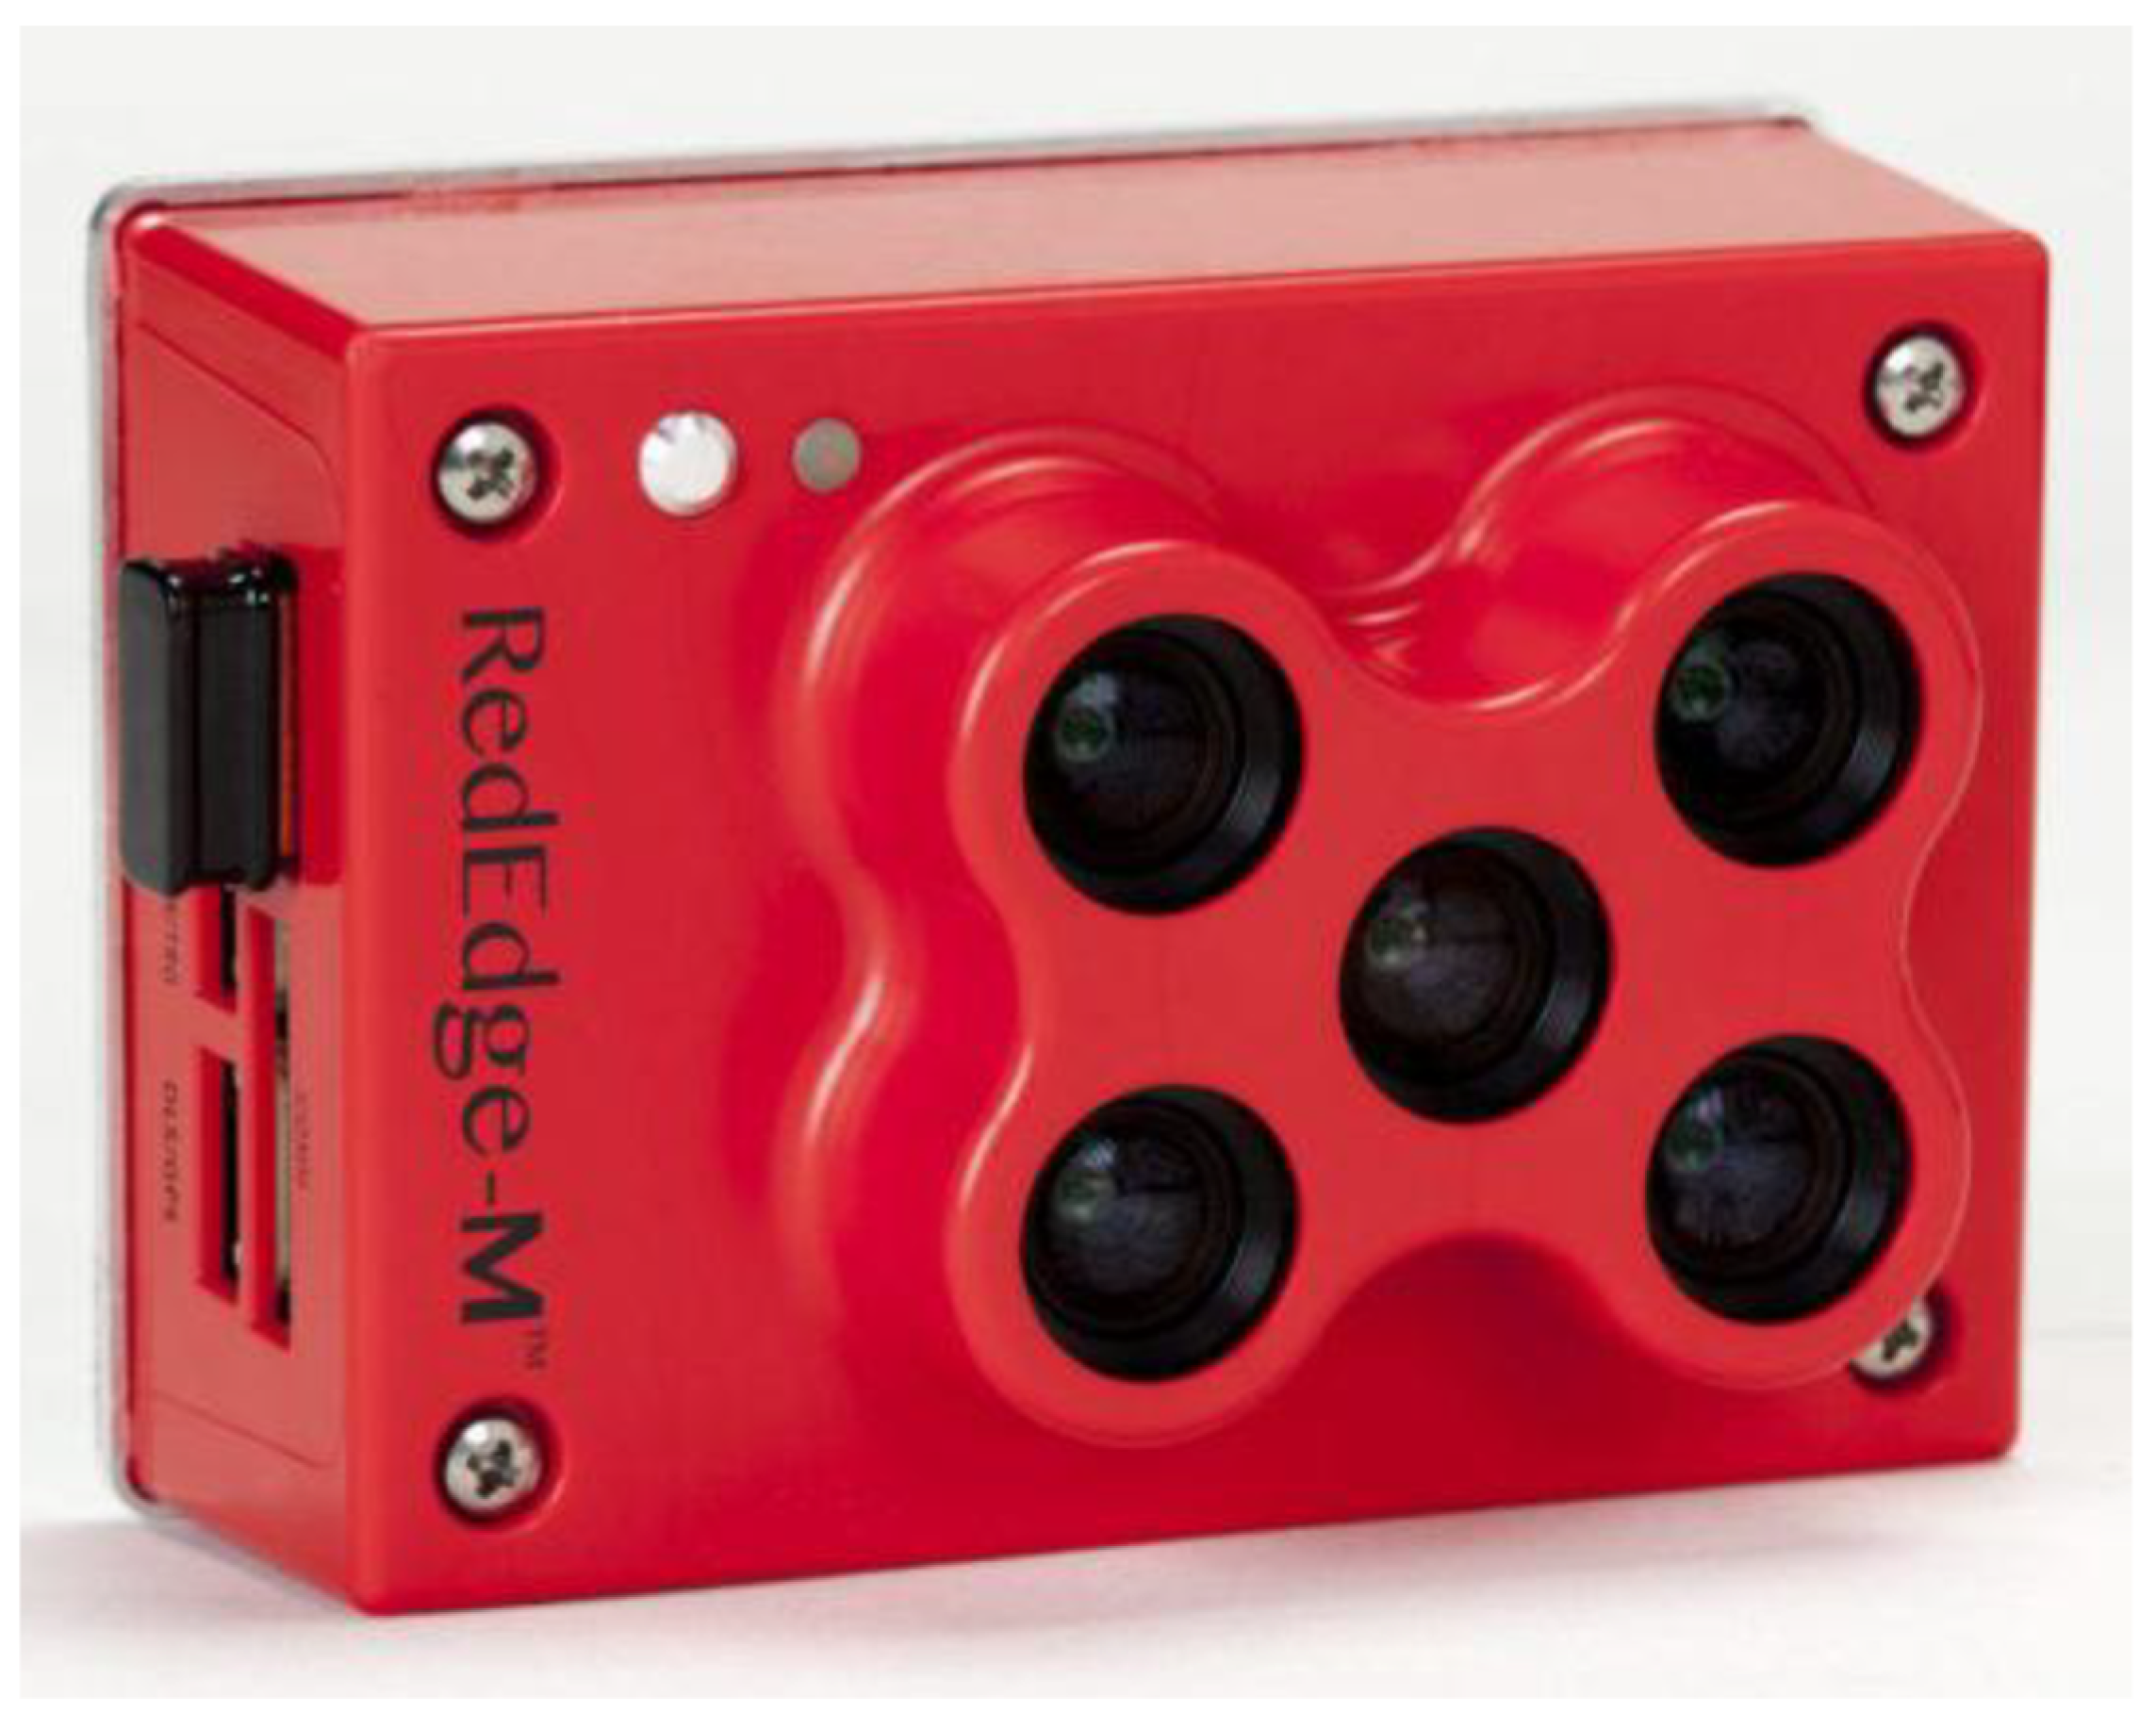
3.1.2. Ground and Aerial Imagery Data Collection

The data collection was taken on 30 June 2020 (the day after sowing (DAS) 34). One quadrant of 0.5 × 0.5 m was used to take randomly sampled data throughout the plots. The physiological data collection for each plot was the relative chlorophyll content (SPAD unit), weeds, and paddy (Figure 2). The tool used for this data collection was the SPAD Meter; SPAD 502 Plus Chlorophyll Meter.
Figure 3 shows the UAV model used for the aerial data collection. The UAV model used was DJI Inspire 2. The sensor used was a multispectral camera and RGB, Micasense RedEdge-M (Figure 4). This multispectral sensor can be utilized to obtain a comprehensive view of crop health, such as for species identification, weed detection, and crop health mapping. During one flight session, this sensor can capture five narrow high resolutions of the spectral band. Aerial data collection was performed on the same day as ground data collection on 30 June 2020 (the day after sowing (DAS) 34). The drone was flown at 60 m altitude at 10:00 a.m. with a spatial resolution of 1.8 cm (multispectral) and 7.95cm (RGB). Weather conditions were good during the data collection events.

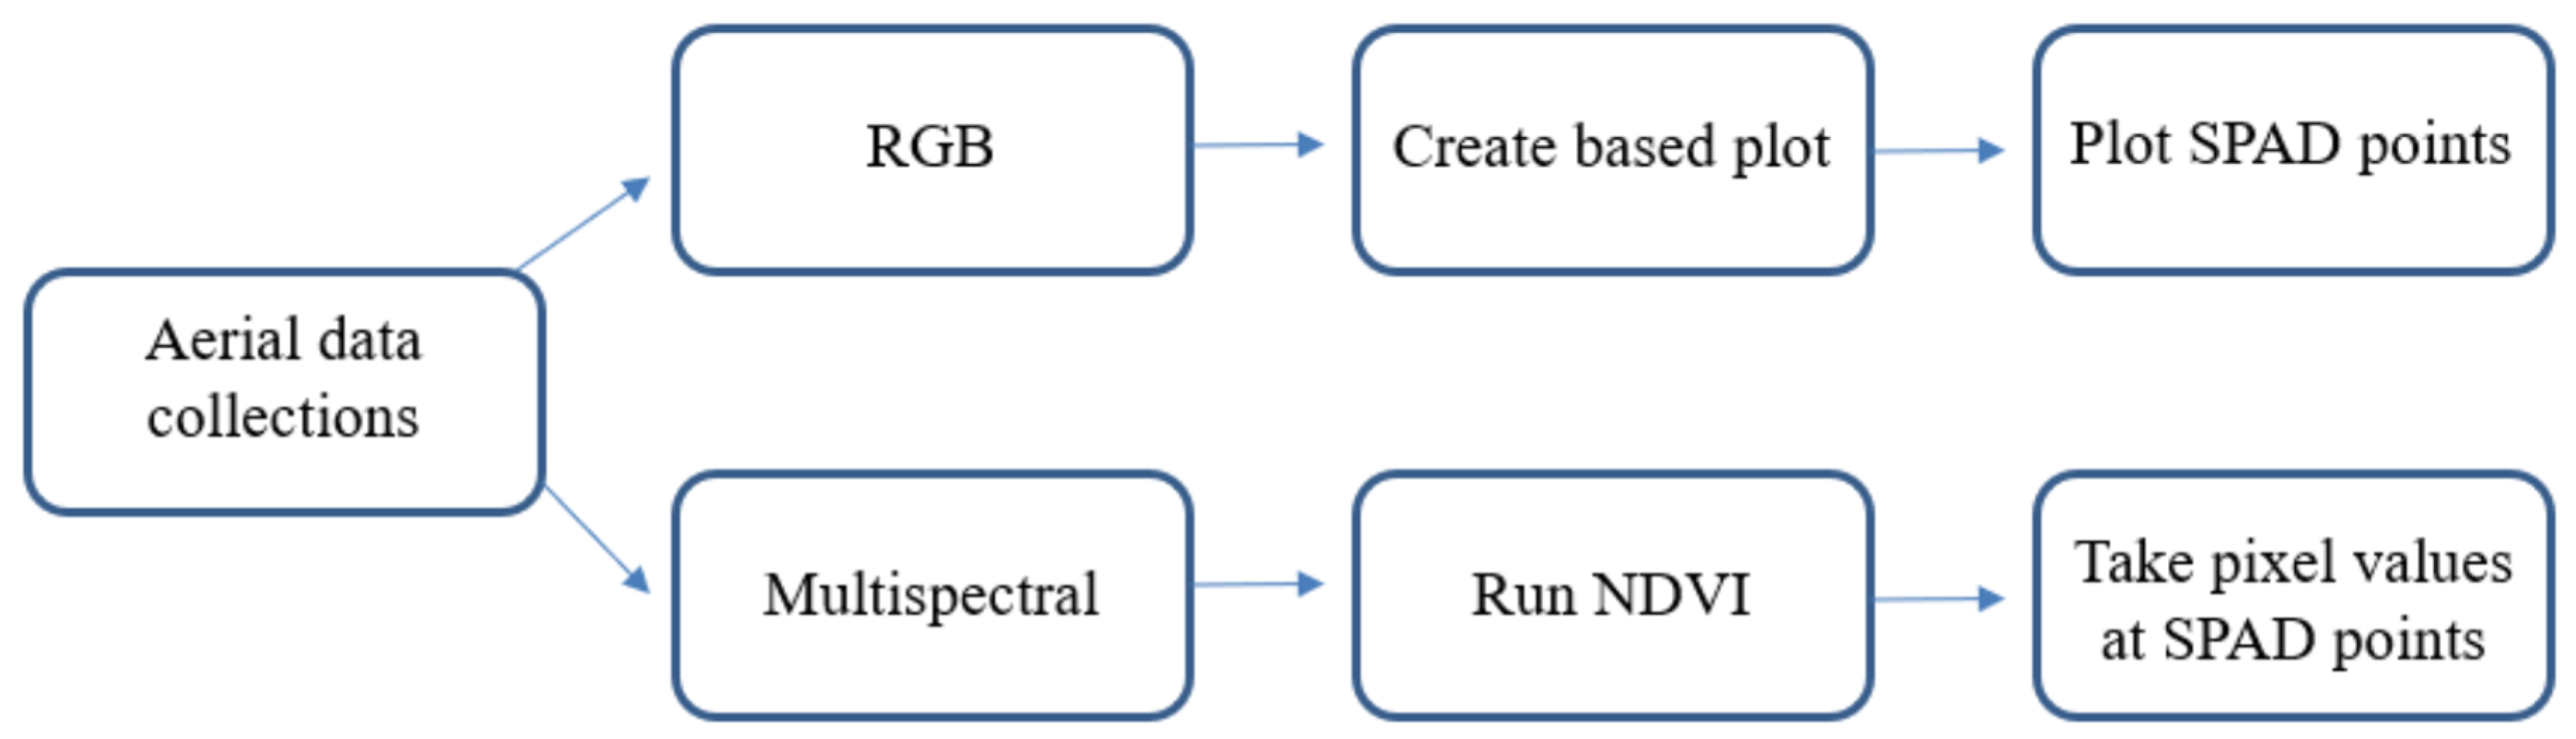
3.2. Image Processing and Analysis

Two types of images were obtained from the aerial imagery data collections: the RGB image and Multispectral image. The RGB image was used to make a based plot, while the multispectral image produced the NDVI map. The 8 points from each subplot were plotted in the RGB map. From the NDVI map, the pixel values for each SPAD point in the subplot were taken. Image processing was performed using ArcGIS software. Figure 5 shows the workflow of image processing.
A process called image classification was performed using the RGB image to develop a weed map. The objective of the classification process is to classify all pixels in a digital image into one of several land covers classes, or “subjects”. In this study, supervised image classification was performed to classify the paddy, weeds, and soil from the RGB image. Thirty samples were taken and merged using the ArcGIS training sample manager option for every type of class. The image must be well-zoomed and taken using a polygon drawing during the sample collection to ensure the correct pixel value was taken. The last step was to run the interactive supervised classification option, and a weed map was developed.
After both ground and aerial data were processed, the next step was to run the correlation between the two data. Statistical analysis involved three basic steps: taking out of pixel values according to subplot, calculating the average for each subplot, and running a correlation between the NDVI with SPAD data using Statistical Package for the Social Sciences (SPSS) software.

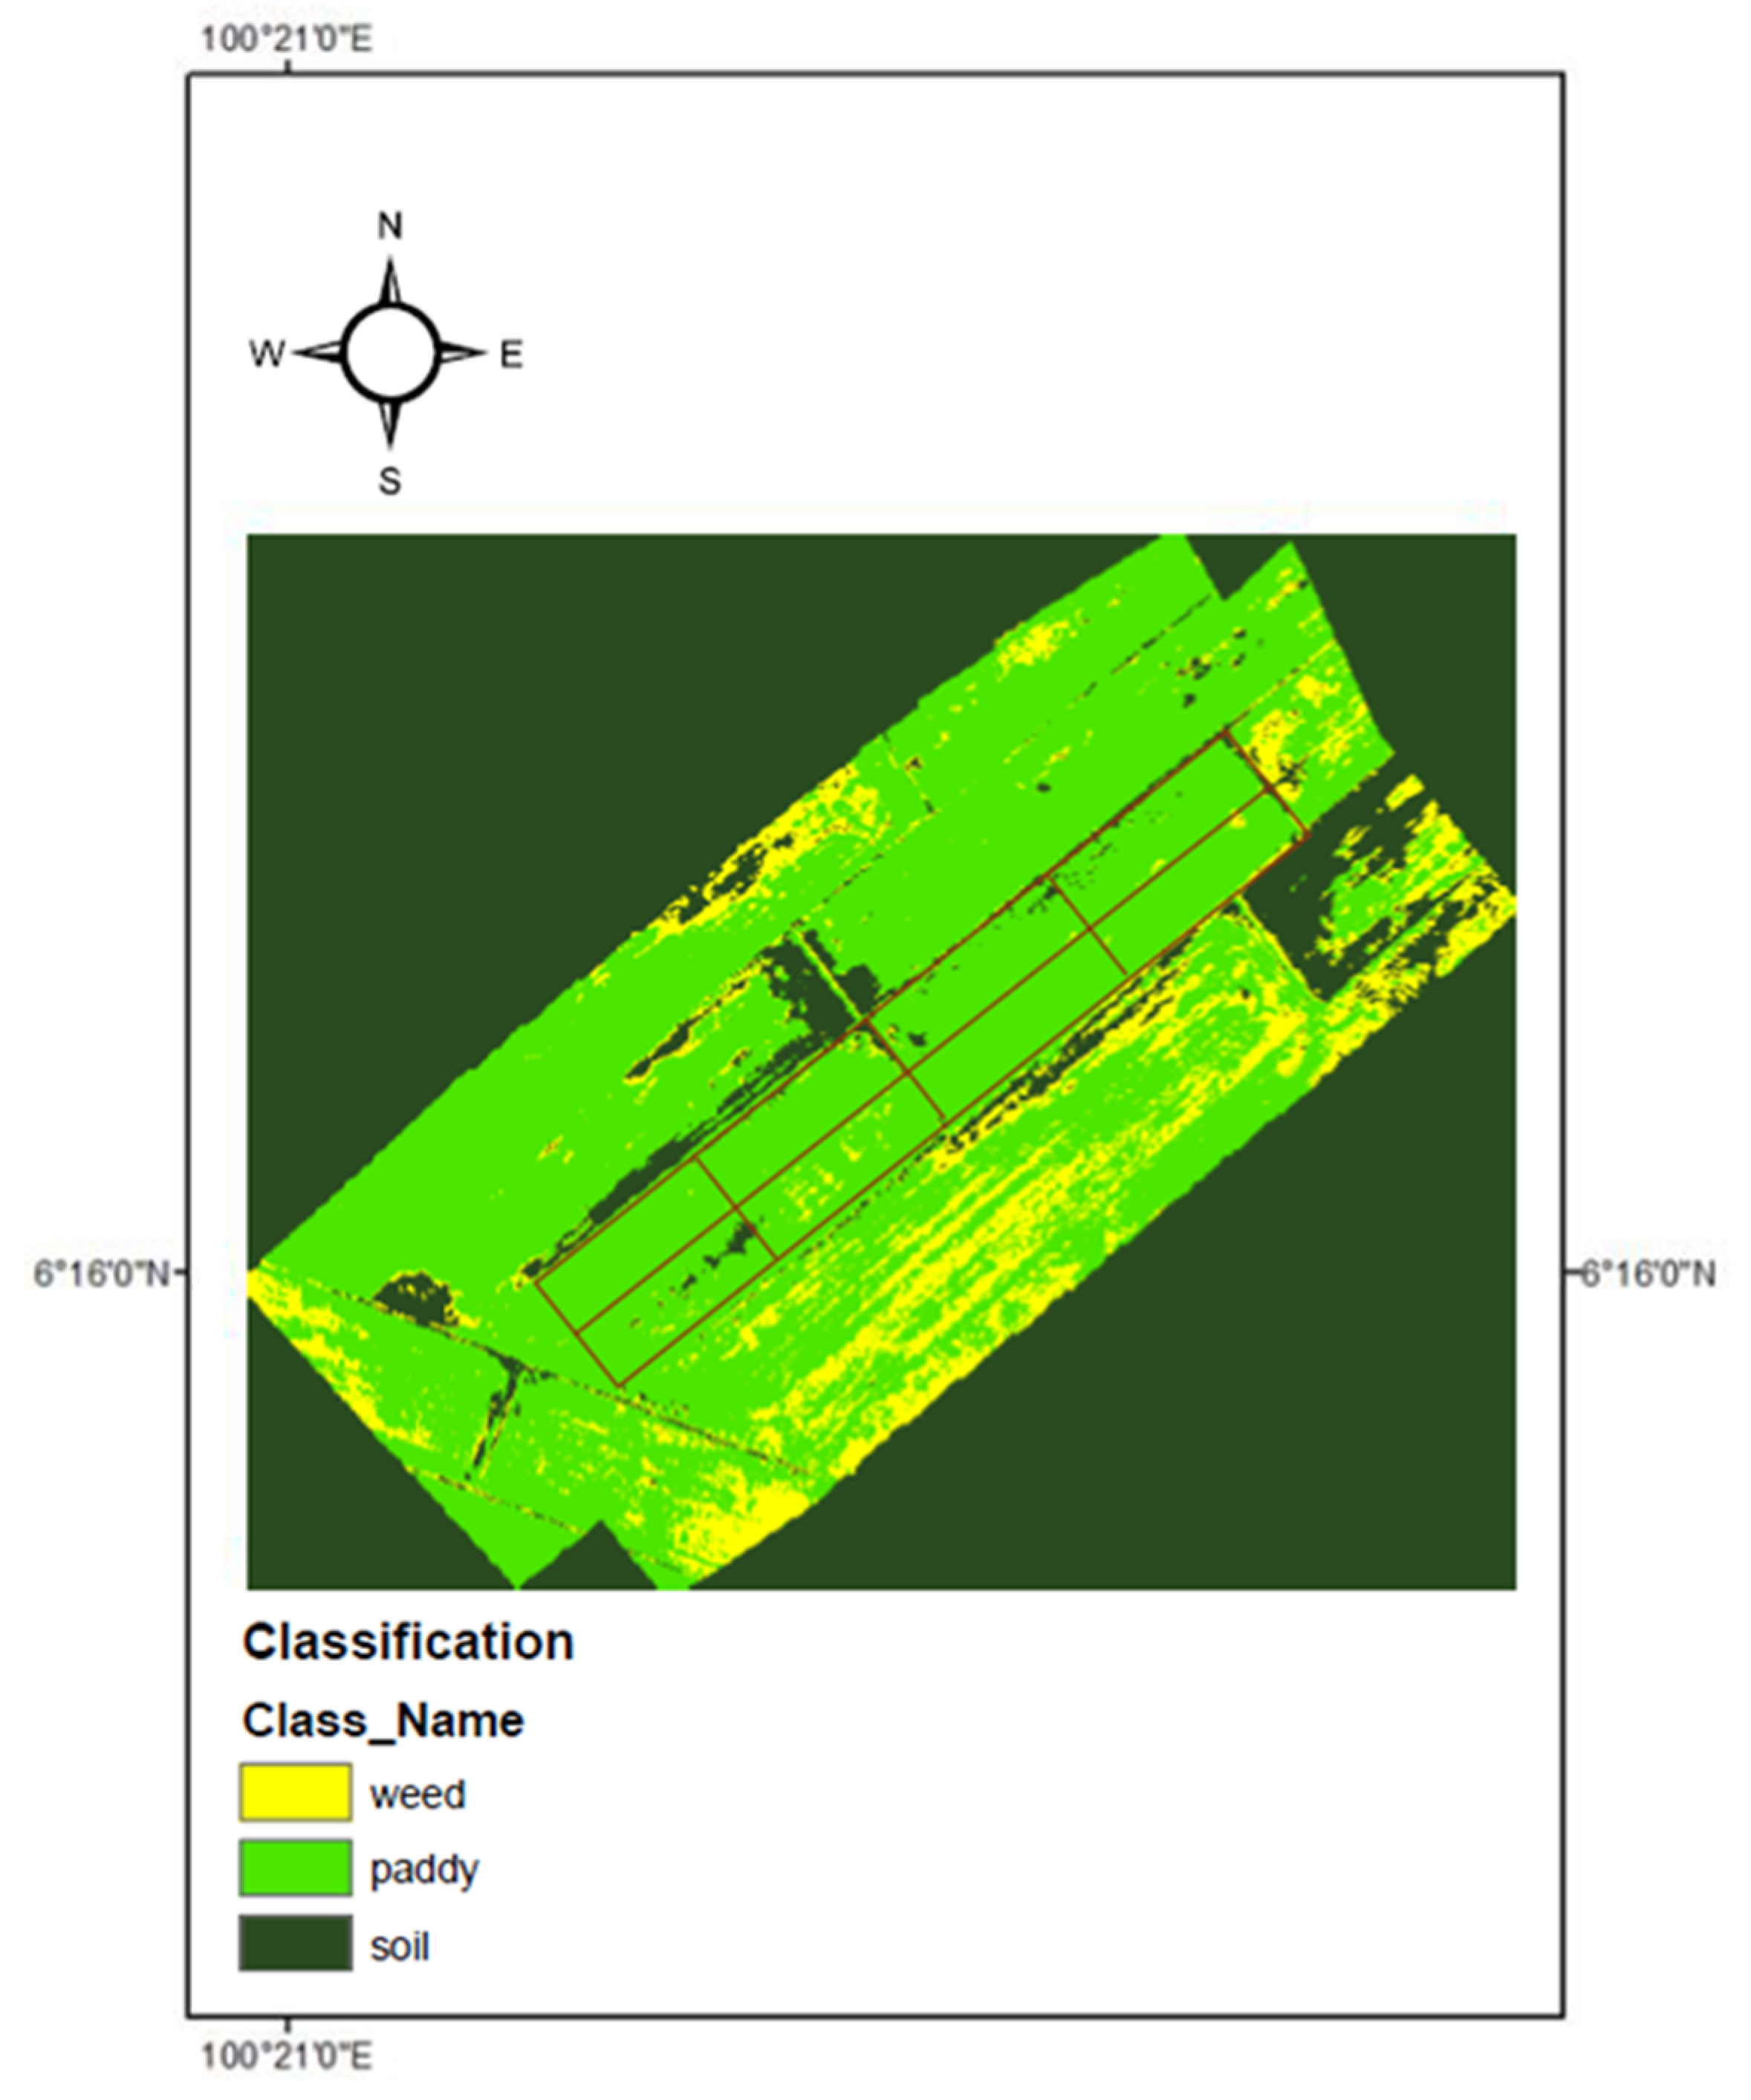
4. Results and Discussion
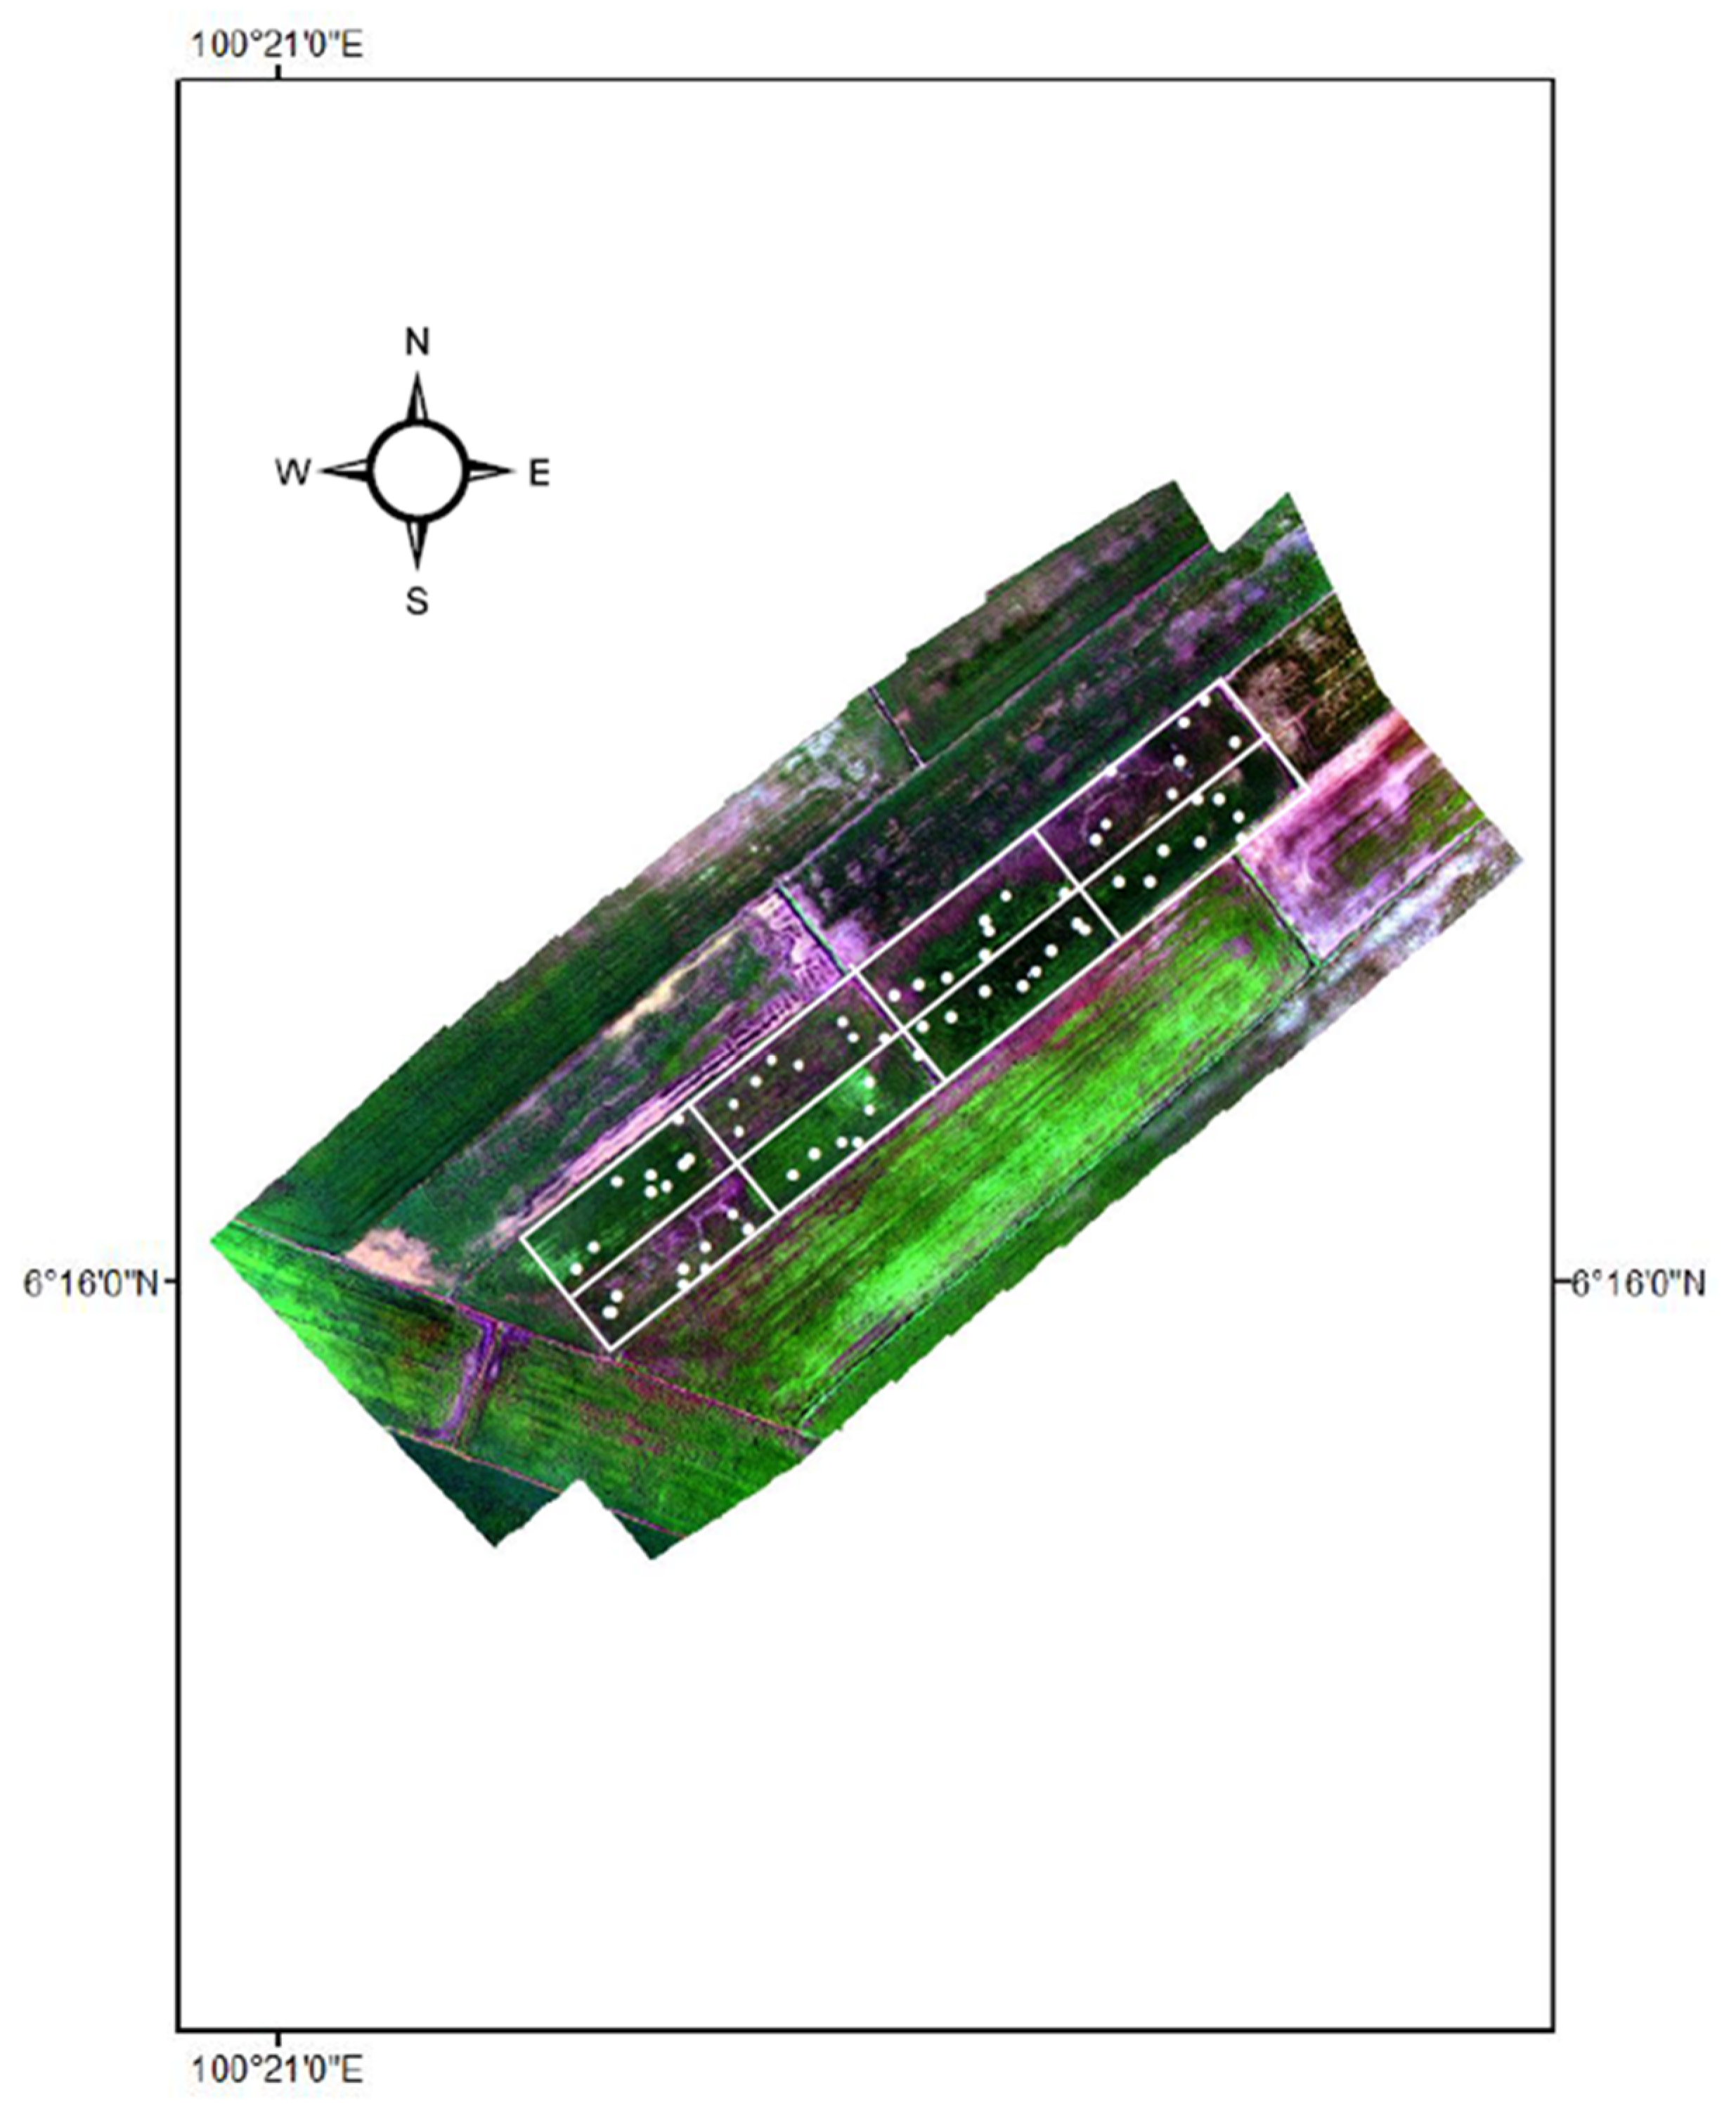
4.1. RGB Map

The plot′s boundary was digitized using ArcGIS software from the RGB image. The plot shows the actual representation of the study plot area. The eight SPAD points from each subplot were also pinpointed on the map. Figure 6 shows the result of the RGB map with the SPAD points in vector format. The NDVI map was generated using the algorithm (Equation (1)) in ArcGIS software from the multispectral image obtained. Figure 7 shows the NDVI map. From this NDVI map, the pixels values of the SPAD point were taken and recorded.
The green color represents the healthy plant zone, while the yellow represents the less healthy plant zone. The healthy vegetation tends to absorb light within the visible band and reflect most NIR light. Meanwhile, the unhealthy vegetation reflects less on NIR light and more on the visible band [21]. The red color represents low or no vegetation. For subplots that were treated with herbicide and fertilizer, only one plot was very healthy, and the rest were slightly healthy. Most subplots treated with no fertilizer and herbicide were healthy, and only one plot was not healthy. This result is also similar to the findings of Reinecke et al. [23], which was able to show the plot vegetations health. The weed map was produced by using the ArcGIS software. This map used supervised image classification tools in ArcGIS. Figure 8 shows the results of the weed map.
This map can precisely show the location of the weeds and the paddy. The yellow color indicates the weeds′ location, with light green for paddy and dark green for soil. For subplots treated with fertilizer and herbicide, most areas have very little or no weeds. Only one subplot with this treatment has an immediate amount of weeds. Most rooms have a little amount of weeds for subplots with no cure and act as a control. Only one subplot has a large amount of weeds.
Farmers can use this weed map as a guidance for spraying herbicide. It will help the farmers to cut costs for herbicides and save their time. By spraying herbicide in a precise location, it can also help to prevent the development of herbicide-resistant weeds. The results obtained in the study of López-Granados et al. [24] were also quite similar to those of this study. It was difficult to classify and separate the weeds and the paddy plants based on the spectral reflectance, shape, and texture due to both types of plants nearly having comparable features; hence, extra ground truth data would be required for a further research project to classify the weeds precisely.

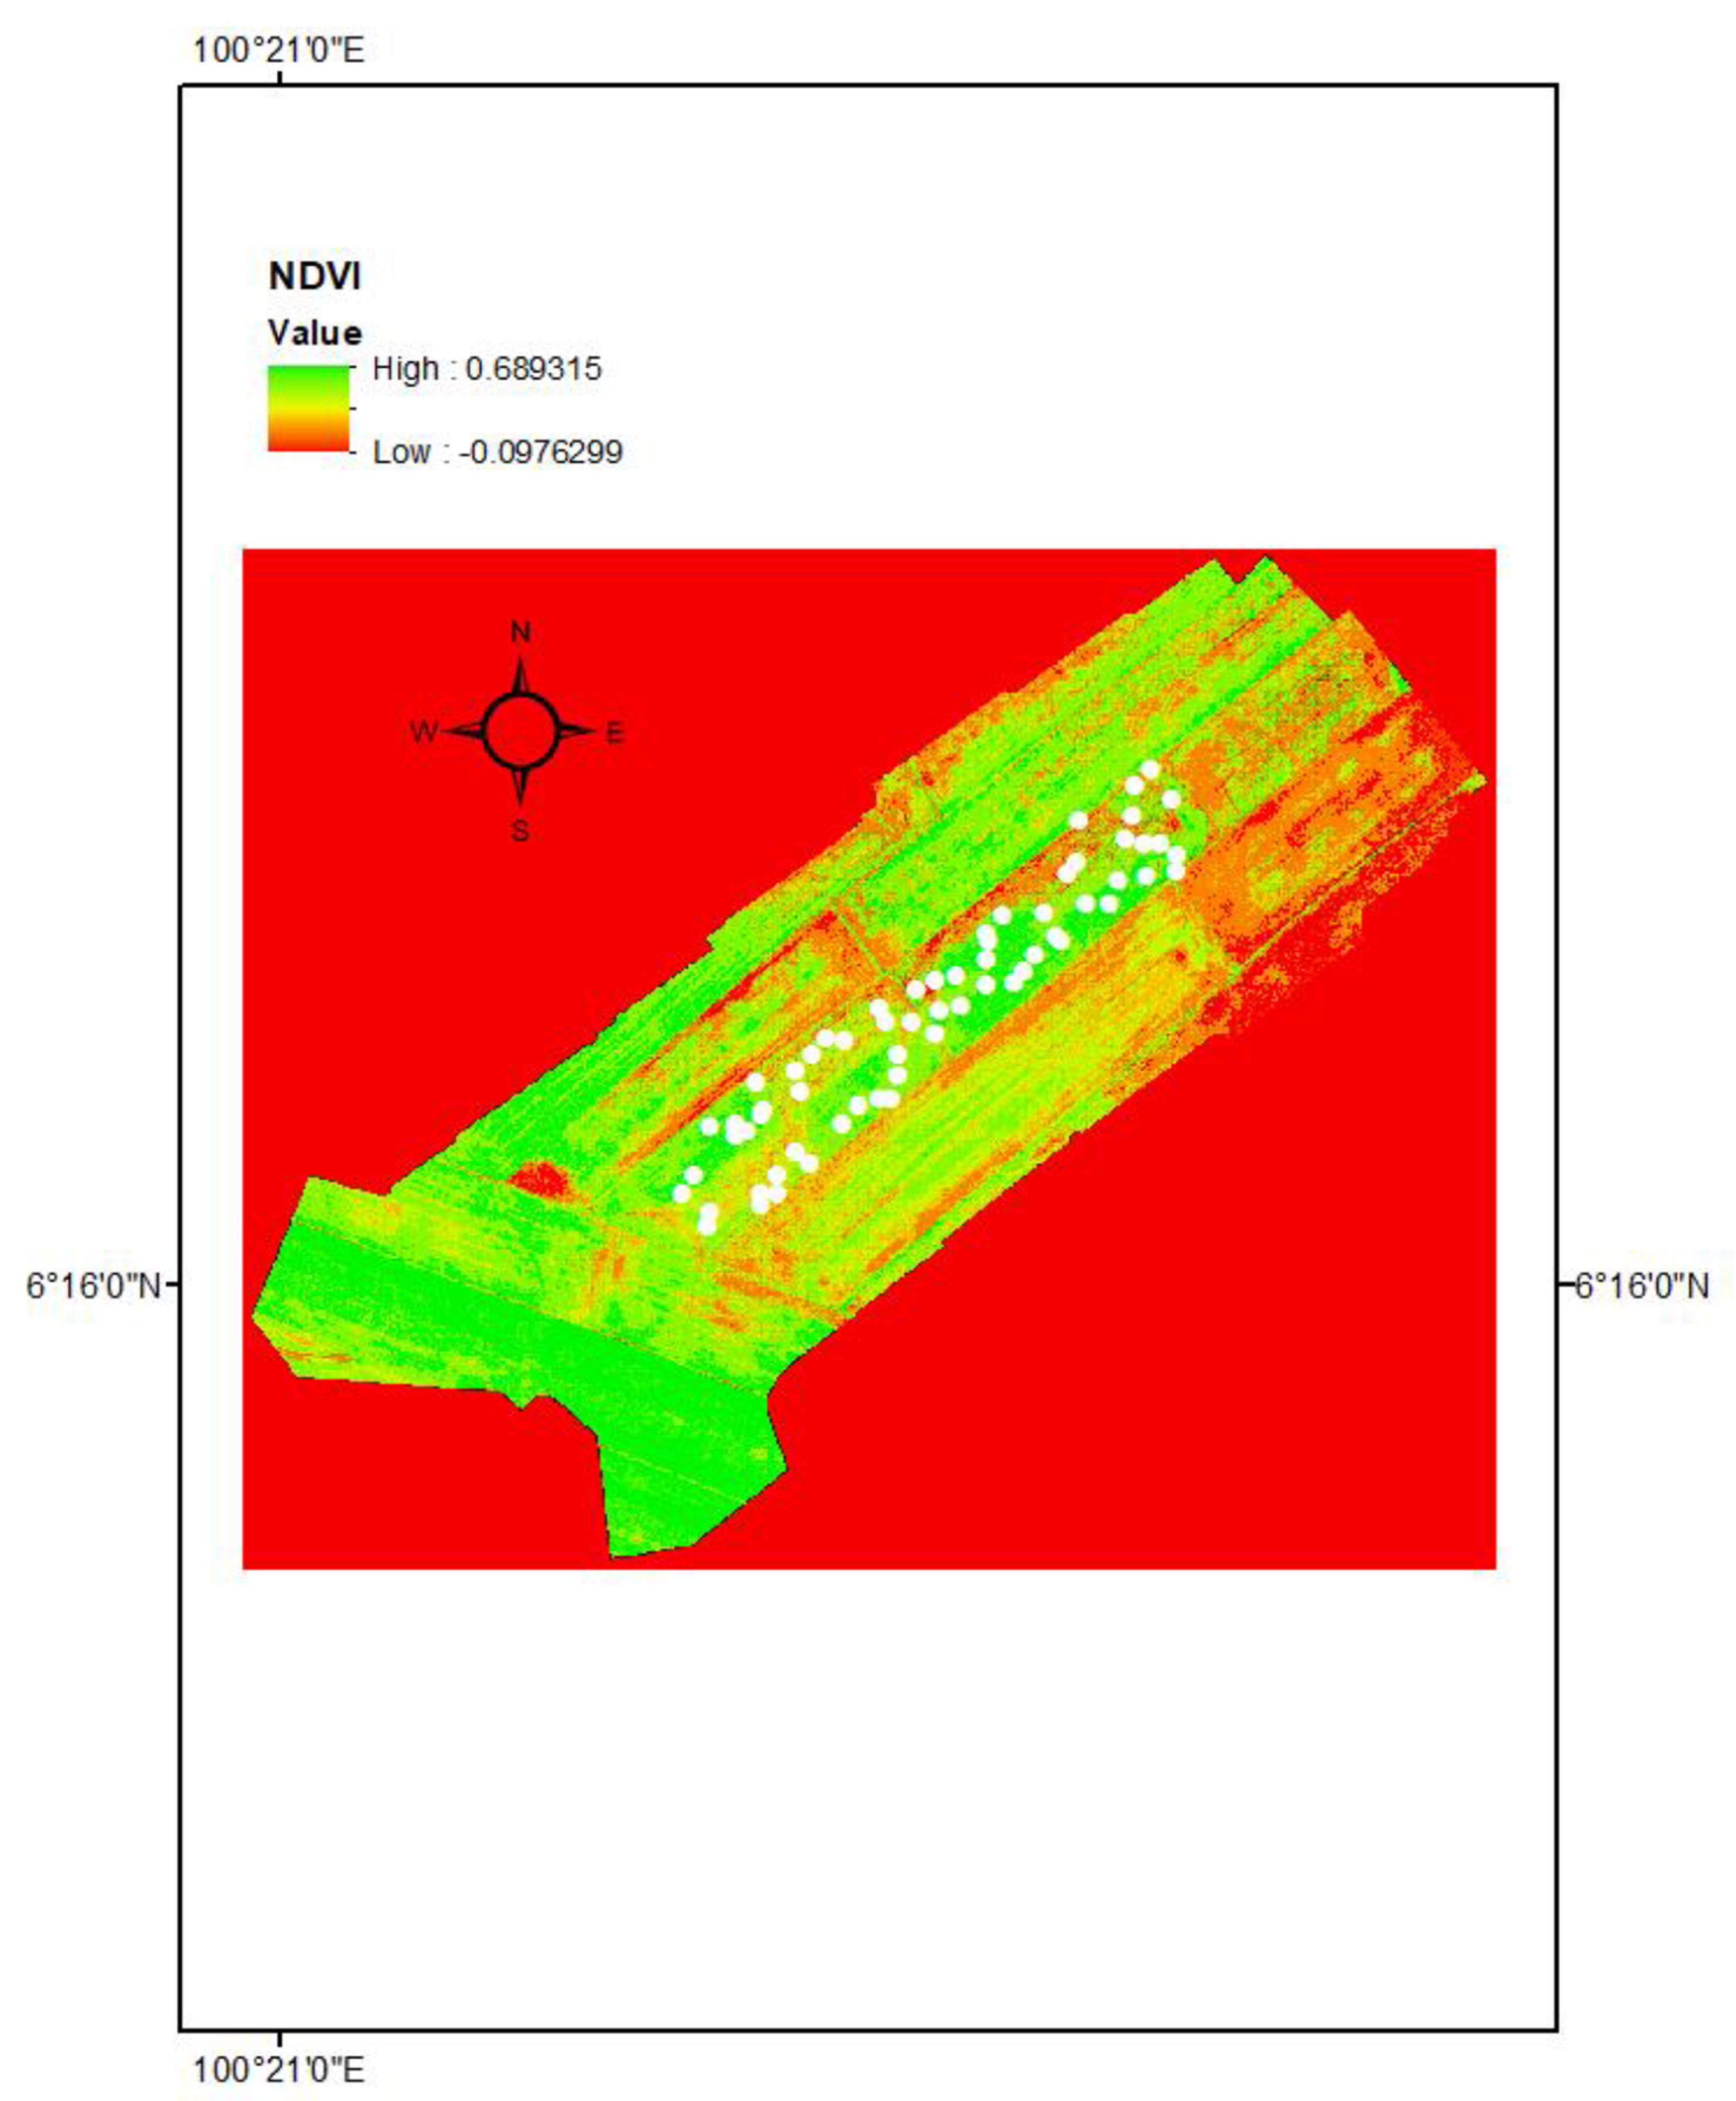
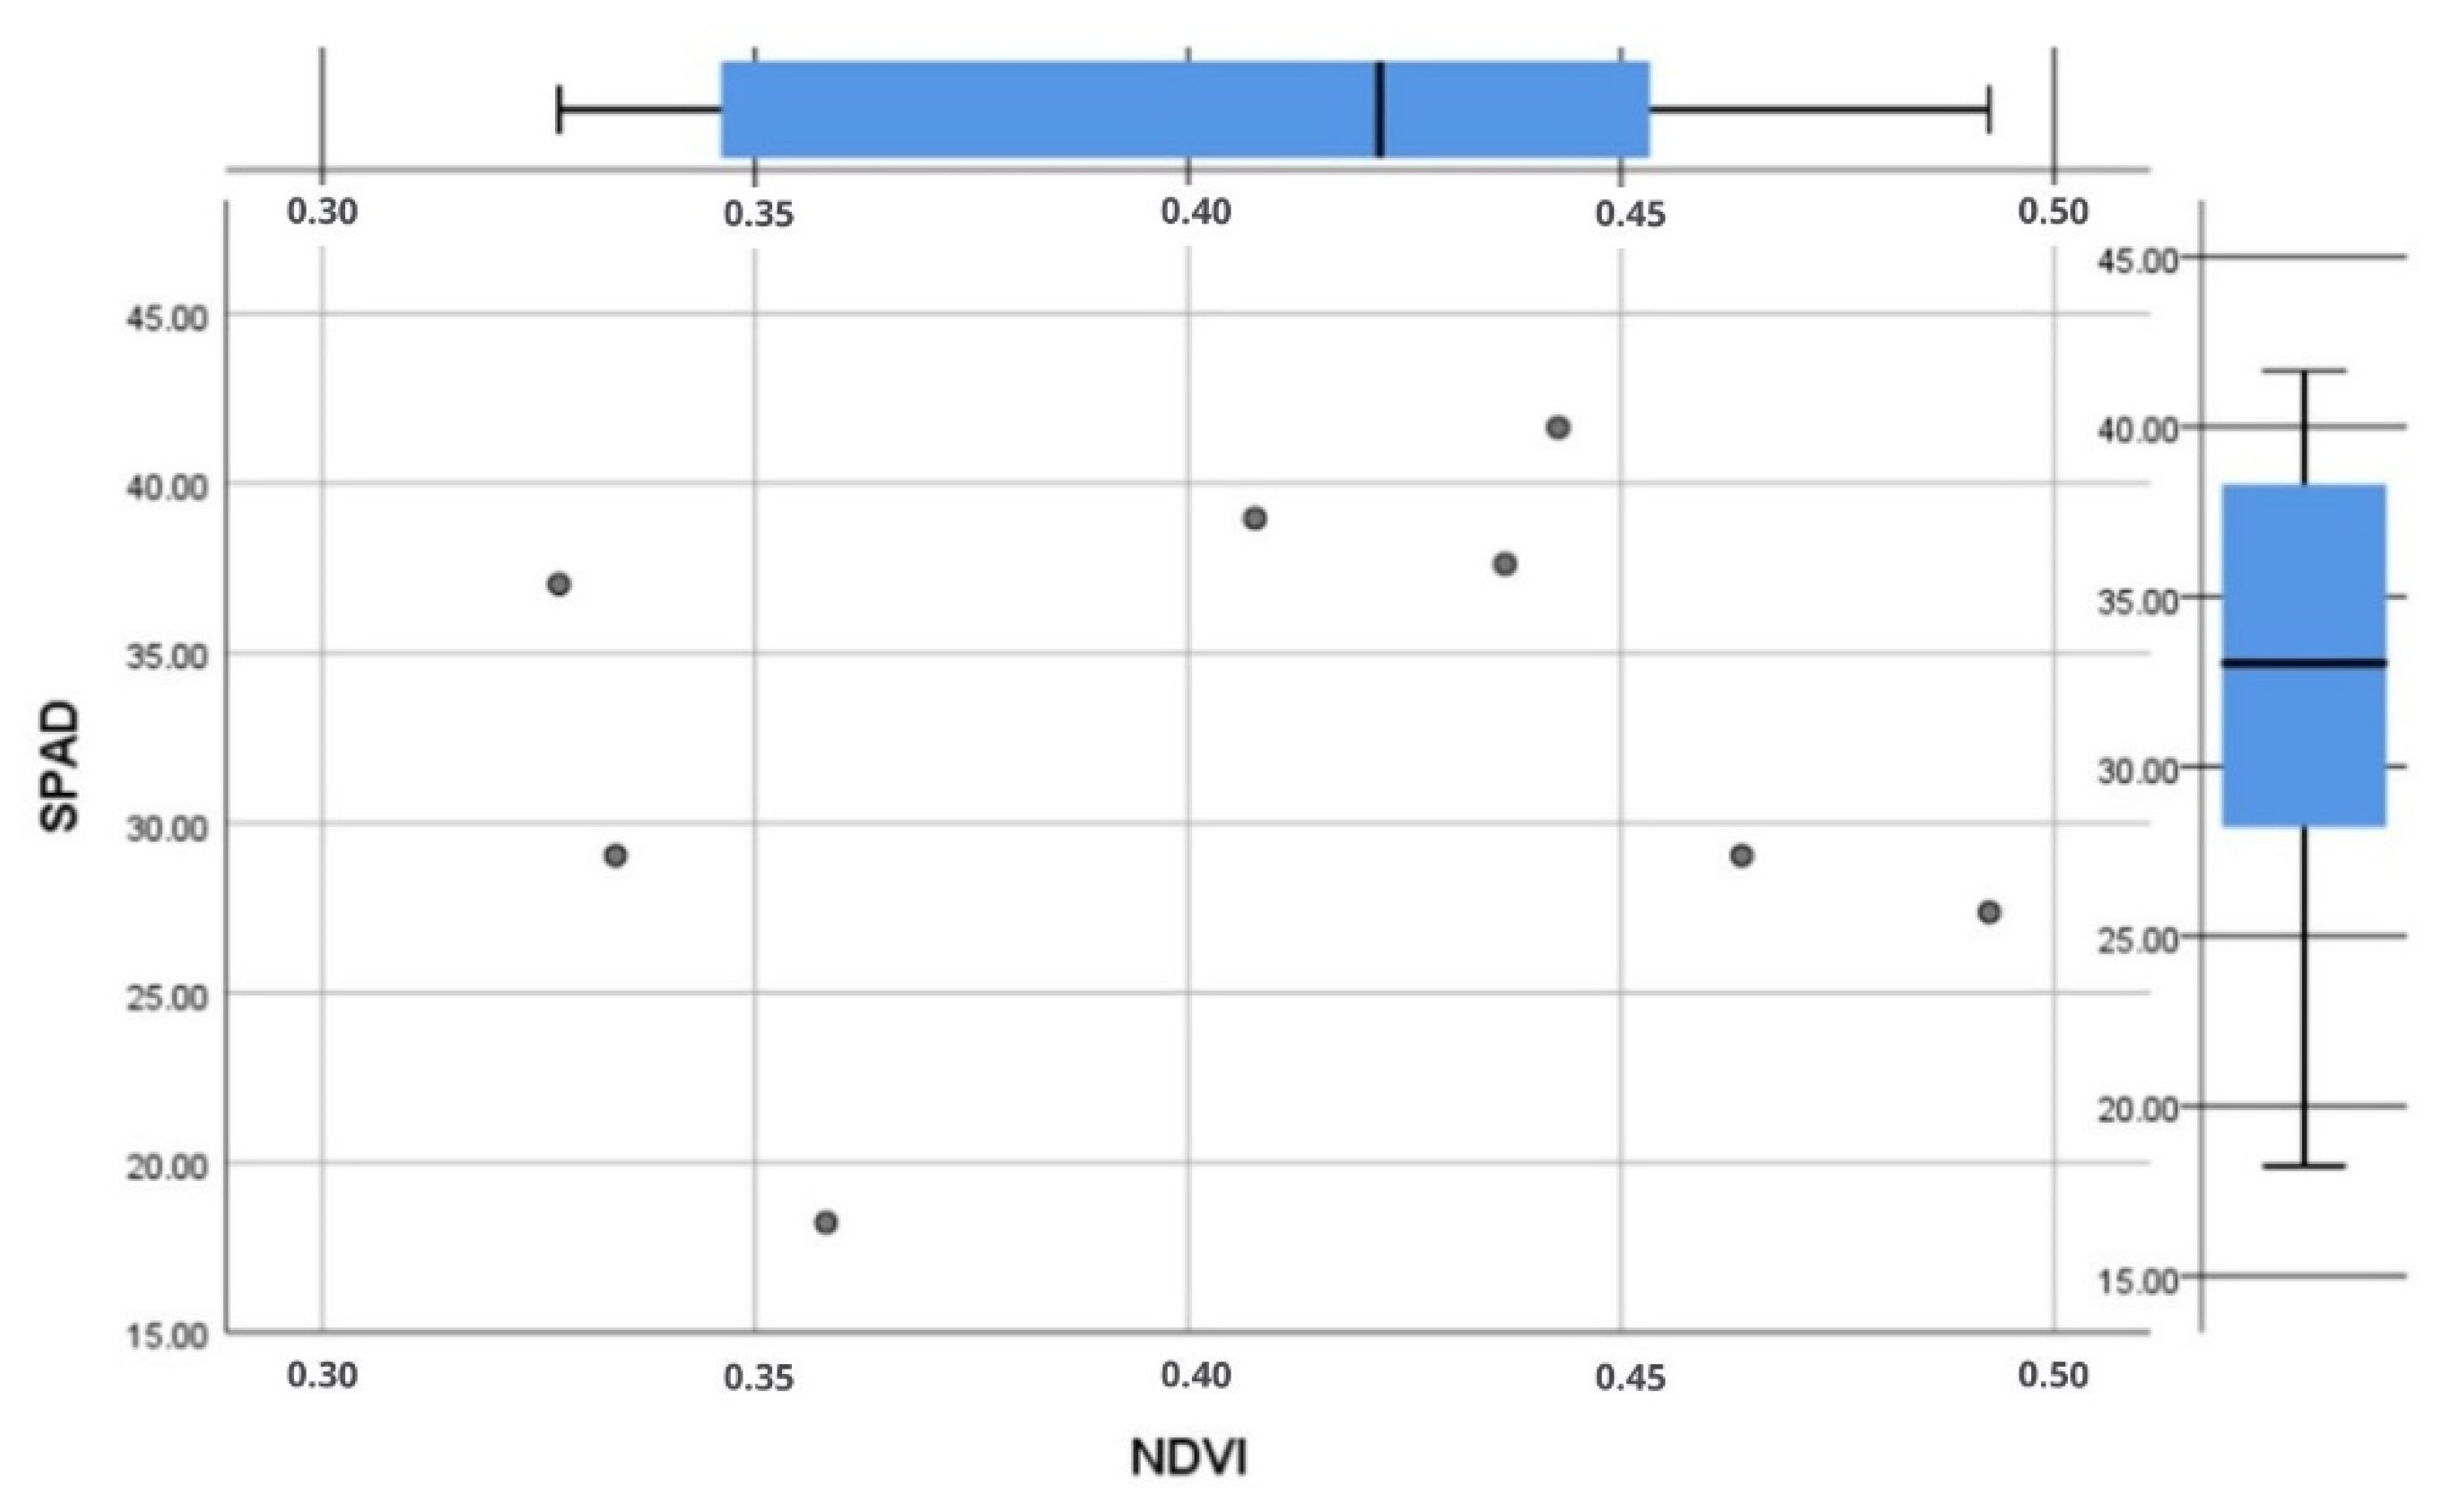
4.2. Correlation and Regression between SPAD and NDVI

After the values of SPAD points were taken from the NDVI map, the values were correlated with the ground SPAD points data values. This was performed using SPSS software. SPAD 502 plus Chlorophyll meter was used as the ground truth parameter that measured the nitrogen level. The correlation of the NDVI value from the UAV with SPAD data was weak. It has a positive, but not significant, value at α = 0.05 level (two-tailed). This may be due to the leaf area of the paddy being small. Hence, the soil has a significant share of reflectance that causes a low correlation with the NDVI values (Swain & Zaman, 2012). Other research, such as that of Islam et al. (2014), achieved a good correlation between SPAD and NDVI values. Table 2 shows the correlation table, while Figure 9 shows SPAD vs. NDVI values. The regression between SPAD and NDVI is shown in Table 3. This study showed that the SPAD value data were not well correlated, and it has no significant relationship with the aerial imagery NDVI values.

5. Conclusions

Weed detection utilizing visual ground observation is time-consuming, and it is not a simple assignment to monitor each portion of the paddy field, particularly for more extensive paddy areas. Therefore, the use of aerial imagery, such as UAV, can be one of the best alternative ways to detect weeds. This study explained the potential use of UAVs as a modern agriculture tool to observe weeds in the field. Although the correlation between the SPAD and the NDVI values was weak, UAV use in the rice field still can detect problem areas in a short time, instead of using the conventional method by frequently undertaking time-consuming ground detections.
This study successfully produced a weed map, which was the main objective, and an NDVI map, which contains a crop health of the area. This weed map can help farmers to detect the weed problems within the field and create decisions more successfully. It can also help the farmer considerably in terms of money and time and prevent herbicide-resistant weeds. The UAV and the multispectral sensor can be easily obtained from the market, offering considerable beneficial advantages to the farmers in the future. Farmers in Malaysia should learn and adapt these UAV technologies to help them to manage their farms better.

Author Contributions

Conceptualization, R.R., N.S. and M.F.M.R.; methodology, M.F.M.R.; software, M.H.O., Z.B. and R.R.; validation, N.N.C., J.A.S. and W.F.F.I.; formal analysis, R.R. and M.F.M.R.; investigation, M.H.O., R.R., Z.B. and M.F.M.R.; resources, M.R.I.; data curation, M.F.M.R.; writing—original draft preparation, R.R. and N.S.; writing—review and editing, N.N.C.; visualization, N.S.; supervision, N.N.C.; project administration, M.H.O. and Z.B.; funding acquisition, M.R.I. All authors have read and agreed to the published version of the manuscript.

Funding

This research received no external funding.

Institutional Review Board Statement

Not applicable.

Informed Consent Statement

Not applicable.

Data Availability Statement

Not applicable.

Acknowledgments

The authors would like to thank the Ministry of Higher Education Malaysia for providing research funds from the Long-Term Research Grant Food Security Niche Area LRGS/1/2019/UPM/01/2: Development of climate ready rice for sustaining food security in Malaysia (Vote: 5545000) and to Lembaga Kemajuan Pertanian Muda (MADA) for allowing us to use their platform by LRGS Climate Ready Rice.

Conflicts of Interest

The authors declare no conflict of interest.

References

  1. Rosle, R.; Che′Ya, N.N.; Ang, Y.; Rahmat, F.; Wayayok, A.; Berahim, Z.; Omar, M.H. Weed Detection in Rice Fields Using Remote Sensing Technique: A Review. Appl. Sci. 2021, 11, 10701. [Google Scholar] [CrossRef]
  2. Kawamura, K.; Asai, H.; Yasuda, T.; Soisouvanh, P.; Phongchanmixay, S. Discriminating crops/weeds in an upland rice field from UAV images with the SLIC-RF algorithm. Plant Prod. Sci. 2020, 24, 198–215. [Google Scholar] [CrossRef]
  3. Dos Santos Ferreira, A.; Freitas, D.M.; da Silva, G.G.; Pistori, H.; Folhes, M.T. Weed detection in soybean crops using ConvNets. Comput. Electron. Agric. 2017, 143, 314–324. [Google Scholar] [CrossRef]
  4. Jabran, K.; Uludag, A.; Chauhan, B.S. Sustainable Weed Control in Rice. In Weed Control: Sustainability, Hazards, and Risks in Cropping Systems Worldwide; CRC Press: Boca Raton, FL, USA, 2018; pp. 276–287. [Google Scholar] [CrossRef]
  5. Roslin, N.A.; Che′Ya, N.N.; Sulaiman, N.; Alahyadi, L.A.N.; Ismail, M.R. Mobile Application Development for Spectral Signature of Weed Species in Rice Farming. Pertanika J. Sci. Technol. 2021, 29, 2241–2259. [Google Scholar] [CrossRef]
  6. Dilipkumar, M.; Chuah, T.S.; Goh, S.S.; Sahid, I. Weed management issues, challenges, and opportunities in Malaysia. Crop Prot. 2020, 134, 104347. [Google Scholar] [CrossRef]
  7. Giacomo, R.; David, G. Unmanned Aerial Systems (UAS) in Agriculture: Regulations and Good Practices. In E-Agriculture in Action: Drones for Agriculture; FAO: Roma, Italy, 2017. [Google Scholar]
  8. Roslin, N.A.; Che′Ya, N.N.; Rosle, R.; Ismail, M.R. Smartphone Application Development for Rice Field Management Through Aerial Imagery and Normalised Difference Vegetation Index (NDVI) Analysis. Pertanika J. Sci. Technol. 2021, 29, 2. [Google Scholar] [CrossRef]
  9. Sulaiman, N.; Che′Ya, N.N.; Mohd Roslim, M.H.; Juraimi, A.S.; Mohd Noor, N.; Fazlil Ilahi, W.F. The Application of Hyperspectral Remote Sensing Imagery (HRSI) for Weed Detection Analysis in Rice Fields: A Review. Appl. Sci. 2022, 12, 2570. [Google Scholar] [CrossRef]
  10. De Castro, A.I.; Torres-Sánchez, J.; Peña, J.M.; Jiménez-Brenes, F.M.; Csillik, O.; López-Granados, F. An Automatic Random Forest-OBIA Algorithm for Early Weed Mapping between and within Crop Rows Using UAV Imagery. Remote Sens. 2018, 10, 285. [Google Scholar] [CrossRef] [Green Version]
  11. Maes, W.H.; Steppe, K. Perspectives for Remote Sensing with Unmanned Aerial Vehicles in Precision Agriculture. Trends Plant Sci. 2019, 24, 152–164. [Google Scholar] [CrossRef] [PubMed]
  12. Cano, E.; Horton, R.; Liljegren, C.; Bulanon, D.M. Comparison of Small Unmanned Aerial Vehicles Performance Using Image Processing. J. Imaging 2017, 3, 4. [Google Scholar] [CrossRef] [Green Version]
  13. Che′Ya, N.N. Site-Specific Weed Management Using Remote Sensing. Ph.D. Thesis, University of Queensland, St Lucia, Australia, 2016. [Google Scholar]
  14. Gago, J.; Douthe, C.; Coopman, R.; Gallego, P.P.; Ribas-Carbo, M.; Flexas, J.; Escalona, J.; Medrano, H. UAVs challenge to assess water stress for sustainable agriculture. Agric. Water Manag. 2015, 153, 9–19. [Google Scholar] [CrossRef]
  15. Osorio, K.; Puerto, A.; Pedraza, C.; Jamaica, D.; Rodríguez, L. A Deep Learning Approach for Weed Detection in Lettuce Crops Using Multispectral Images. AgriEngineering 2020, 2, 471–488. [Google Scholar] [CrossRef]
  16. Liu, T.; Li, R.; Zhong, X.; Jiang, M.; Jin, X.; Zhou, P.; Liu, S.; Sun, C.; Guo, W. Estimates of rice lodging using indices derived from UAV visible and thermal infrared images. Agric. For. Meteorol. 2018, 252, 144–154. [Google Scholar] [CrossRef]
  17. Roslim, M.H.M.; Juraimi, A.S.; Che′Ya, N.N.; Sulaiman, N.; Manaf, M.N.H.A.; Ramli, Z.; Motmainna, M. Using remote sensing and an unmanned aerial system for weed management in agricultural crops: A review. Agronomy 2021, 11, 1809. [Google Scholar] [CrossRef]
  18. Barrero, O.; Perdomo, S.A. RGB and multispectral UAV image fusion for Gramineae weed detection in rice fields. Precis. Agric. 2018, 19, 809–822. [Google Scholar] [CrossRef]
  19. Gibson, K.D.; Dirks, R.; Medlin, C.R.; Johnston, L. Detection of Weed Species in Soybean Using Multispectral Digital Images. Weed Technol. 2004, 18, 742–749. [Google Scholar] [CrossRef]
  20. Kamal, M.; Ningam, M.U.L.; Alqorina, F. The Effect of Field Spectral Reflectance Measurement Distance to the Spectral Reflectance of Rhizophora stylosa. IOP Conf. Ser. Earth Environ. Sci. 2017, 98, 012059. [Google Scholar] [CrossRef]
  21. Rosle, R.; Che′Ya, N.N.; Roslin, N.A.; Halip, R.M.; Ismail, M.R. Monitoring early stage of rice crops growth using normalized difference vegetation index generated from UAV. In IOP Conference Series: Earth and Environmental Science; IOP Publishing: Bristol, UK, 2019; Volume 355, p. 12066. [Google Scholar]
  22. Mahlein, A.-K. Precision agriculture and plant phenotyping are information- and technology-based domains with specific demands and challenges for. Plant Dis. 2016, 100, 241–251. [Google Scholar] [CrossRef] [PubMed] [Green Version]
  23. Reinecke, M.; Prinsloo, T. The influence of drone monitoring on crop health and harvest size. In 2017 1st International Conference on Next Generation Computing Applications (NextComp); IEEE: Piscataway, NJ, USA, 2017; pp. 5–10. [Google Scholar]
  24. López-Granados, F.; Torres-Sánchez, J.; Serrano-Pérez, A.; De Castro, A.I.; Mesas-Carrascosa, F.-J.; Peña, J.M. Early season weed mapping in sunflower using UAV technology: Variability of herbicide treatment maps against weed thresholds. Precis. Agric. 2016, 17, 183–199. [Google Scholar] [CrossRef]
Figure 1. Vegetative spectral reflectance curve.
Chemproc 10 00044 g001
Figure 2. SPAD 502 Plus Chlorophyl Meter.
Chemproc 10 00044 g002
Figure 3. DJI Inspire 2.
Chemproc 10 00044 g003
Figure 4. Micasense sensor.
Chemproc 10 00044 g004
Figure 5. Image processing workflow.
Chemproc 10 00044 g005
Figure 6. RGB map with the plot boundary and SPAD points in vector format.
Chemproc 10 00044 g006
Figure 7. NDVI map.
Figure 7. NDVI map.
Chemproc 10 00044 g007
Figure 8. Weed map.
Figure 8. Weed map.
Chemproc 10 00044 g008
Figure 9. SPAD vs. NDVI values.
Chemproc 10 00044 g009
Table 1. Advantages and limitations of different types of UAVs.
Type of UAVAdvantagesDisadvantagesSources
Fixed-wing
  • Simpler structure;
  • Longer flight duration at higher speeds;
  • Larger area coverage per flight;
  • Lower power consumption.
  • Low-resolution image;
  • Not able to hover;
  • Require specific runways.
[1,14]
Rotary wing
  • Able to fly and land vertically;
  • Their capacity to hover and perform agile maneuvering;
  • It is fully automated, which allows the drone to start and end at the launch point;
  • High-resolution image.
  • Lower flight duration;
  • Low payload capacity;
  • Lower flight speed;
  • Restricted area coverage per flight.
Table 2. Correlation table (α = 0.05).
SPADSPAD
SPADPearson Correlation10.129
Sig. (2-tailed) 0.760
N88
NDVIPearson Correlation10.129
Sig. (2-tailed)0.760
N88
Table 3. Regression Table.
RelationshipRegression EquationR-Square
SPAD and
NDVI values
y = 18.08x + 25.0010.0199
Publisher’s Note: MDPI stays neutral with regard to jurisdictional claims in published maps and institutional affiliations.

