
Characterization of a Triticum aestivum L. Experimental Field to Implement an Agronomic Biofortification Workflow †

 ,
,  ,
,  ,
,  ,
,  , , ,
, , ,  , , ,
, , ,  ,
, 
Abstract
:1. Introduction
2. Materials and Methods
2.1. Experimental Field
2.2. Soil Analyses
2.3. Statistical Analyses
3. Results
4. Discussion
5. Conclusions
Supplementary Materials
Author Contributions
Funding
Institutional Review Board Statement
Informed Consent Statement
Data Availability Statement
Acknowledgments
Conflicts of Interest
Abbreviations
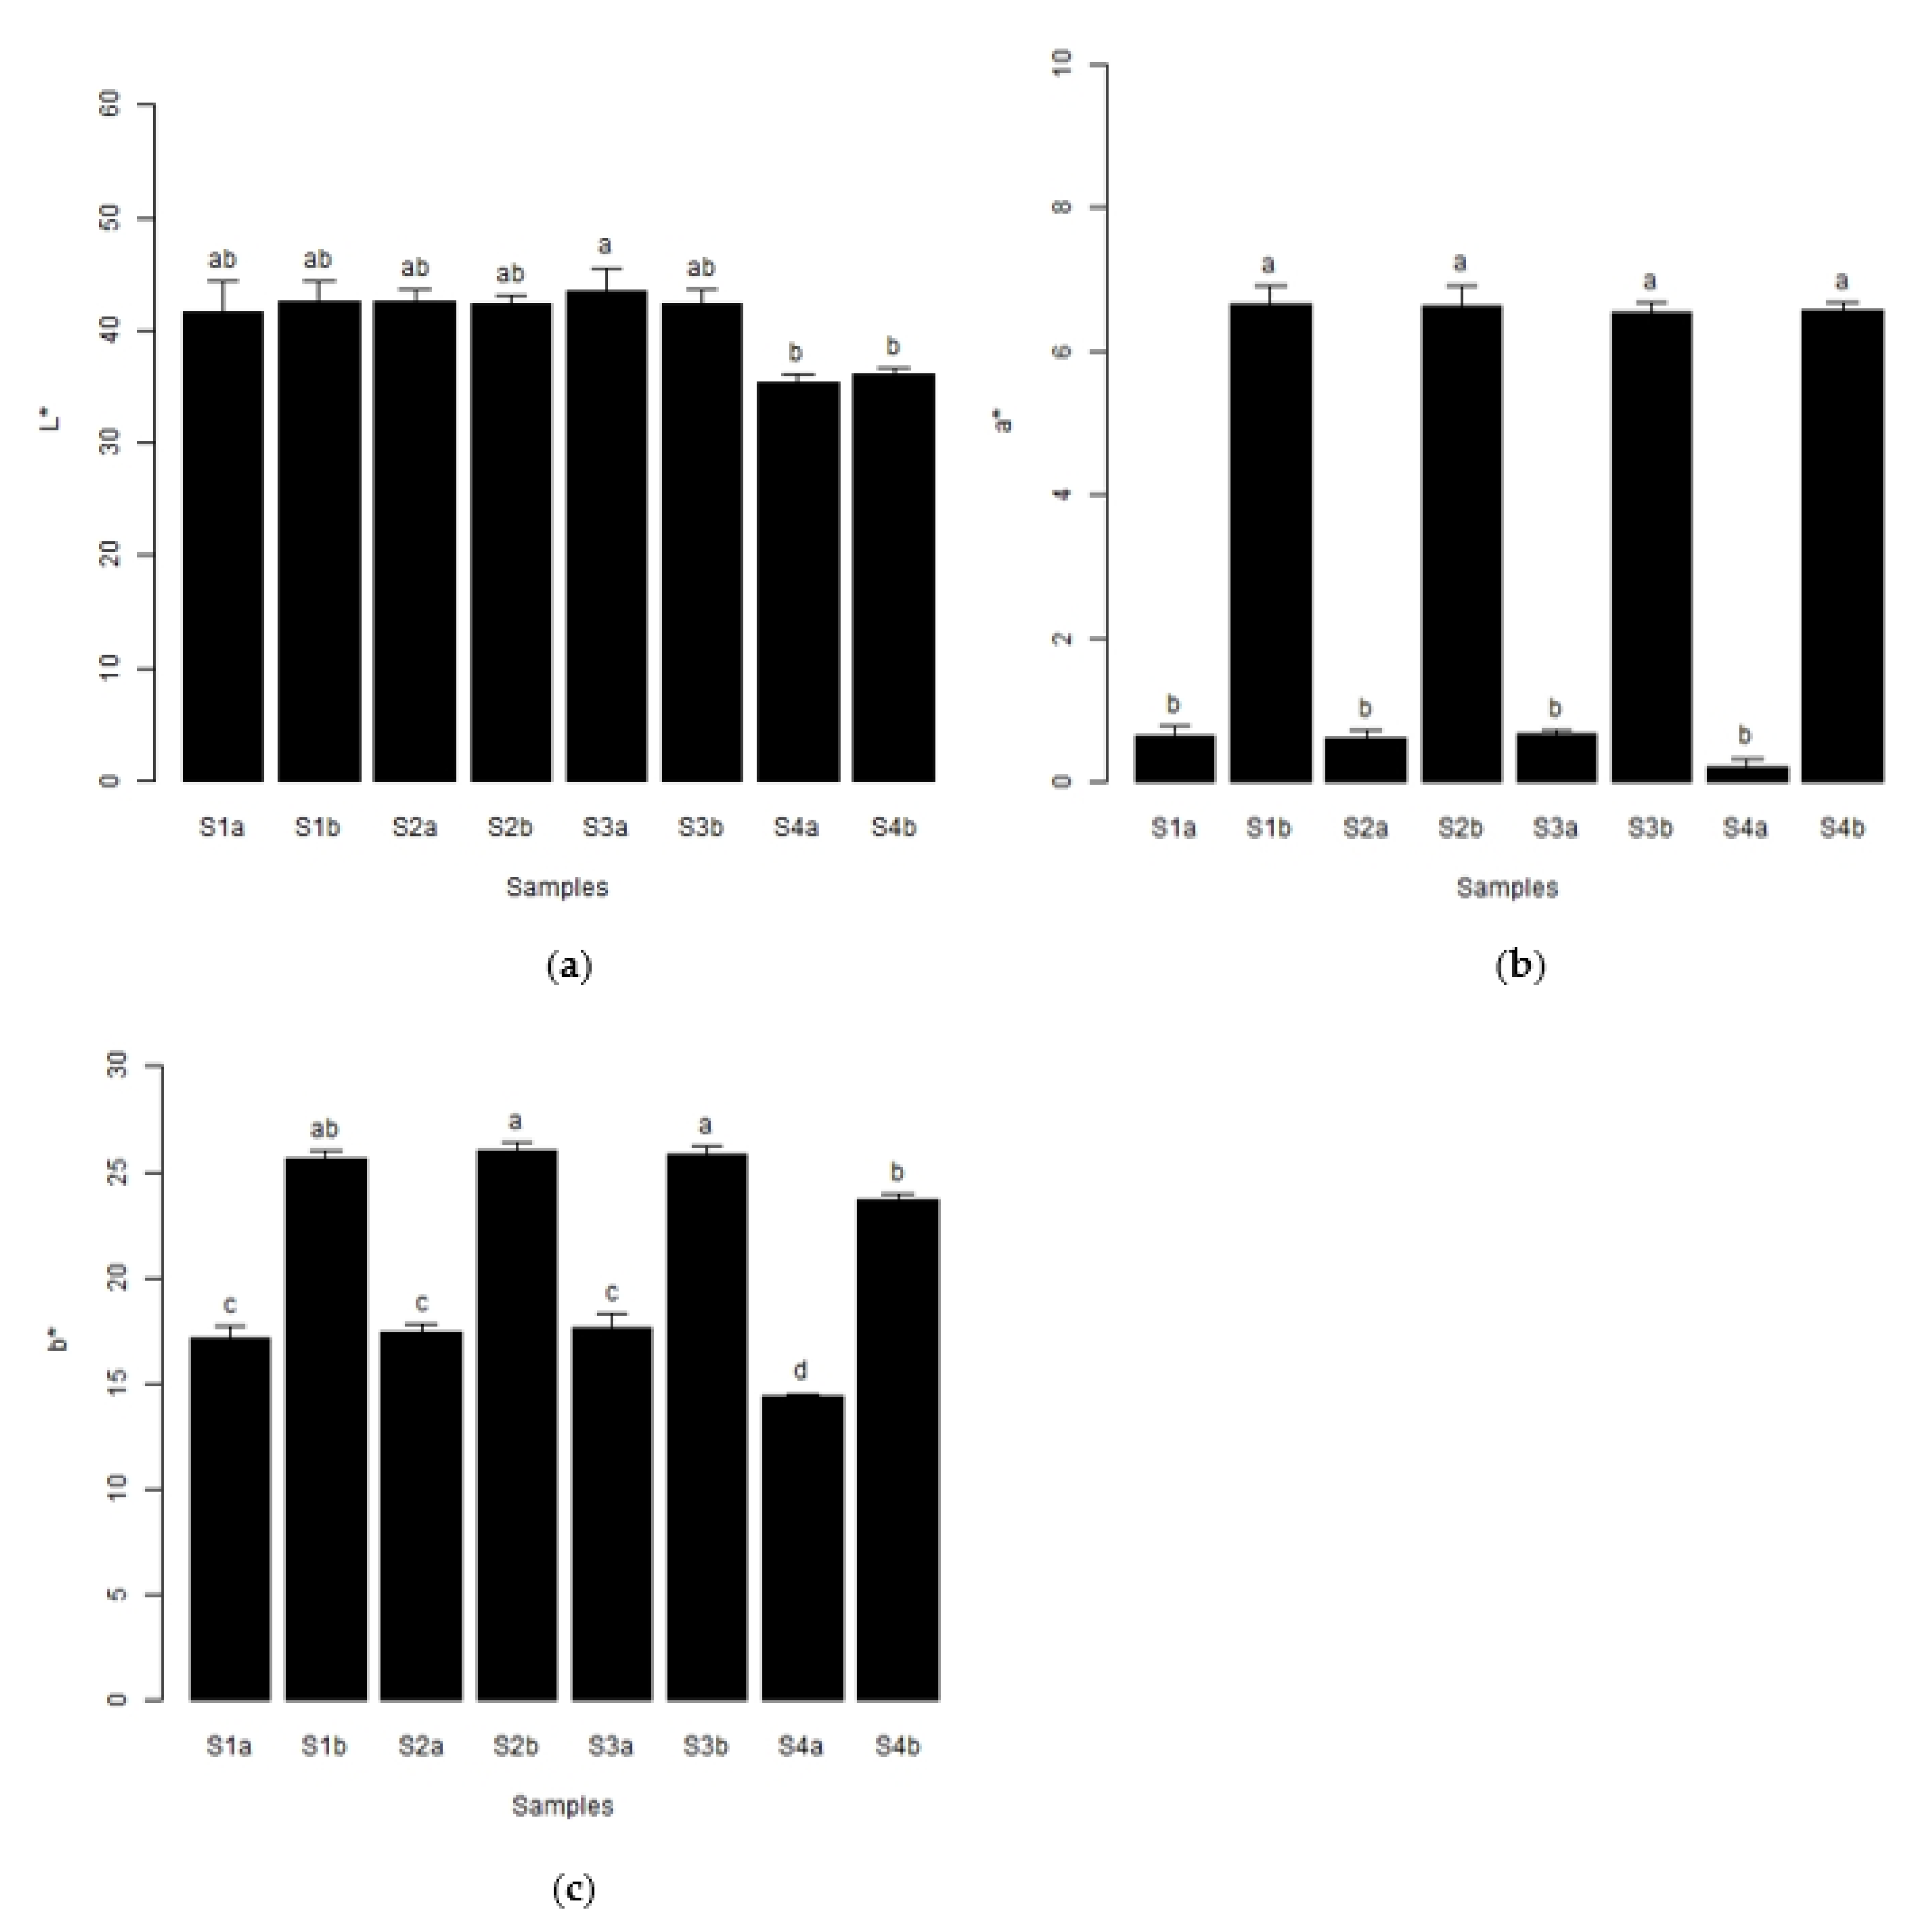
| S (1, 2, 3, and 4) | Soil samples collected from different places in the experimental field. |
| S (1, 2, 3, and 4) a | Soil samples before the analysis of organic matter content. |
| S (1, 2, 3, and 4) b | Soil samples after the analysis of organic matter content. |
References
- United Nations, Department of Economic and Social Affairs, Population Division. World Population Prospects 2019: Data Booklet; United Nations, Department of Economic and Social Affairs: New York, NY, USA, 2019; pp. 1–28. Available online: https://popula-tion.un.org/wpp/Publications/Files/WPP2019_DataBooklet.pdf (accessed on 10 January 2022).
- Bouis, H.E.; Saltzman, A. Improving nutrition through biofortification: A review of evidence from HarvestPlus, 2003 through 2016. Glob. Food Secur. 2017, 12, 49–58. [Google Scholar] [CrossRef] [PubMed]
- Food and Agriculture Organization of the United Nations (FAO)—FAO Cereal Supply and Demand Brief. Available online: http://www.fao.org/worldfoodsituation/csdb/en/ (accessed on 10 January 2022).
- Cerqueira, J.M.C. Estudo do Solo. In Solos e Clima em Portugal, 2nd ed.; Clássica Editora: Lisboa, Portugal, 2001; pp. 9–46. [Google Scholar]
- Coelho, A.R.F.; Lidon, F.C.; Pessoa, C.C.; Marques, A.C.; Luís, I.C.; Caleiro, J.; Simões, M.; Kullberg, J.; Legoinha, P.; Brito, M.; et al. Can foliar pulverization with CaCl2 and Ca(NO3)2 trigger Ca enrichment in Solanum tuberosum L. tubers? Plants 2021, 10, 245. [Google Scholar] [CrossRef] [PubMed]
- Marques, A.; Pessoa, C.; Daccak, D.; Luís, I.; Rita, F.; Coelho, A.; Caleiro, J.; Graça Brito, M.; Carlos Kullberg, J.; Scotti Campos, P.; et al. Precision Agriculture as input for the Rice Grain (Oryza sativa L.) Biofortification with Selenium. In Proceedings of the 1st International Electronic Conference on Agronomy, Basel, Switzerland, 3–17 May 2021. [Google Scholar] [CrossRef]
- Daccak, D.; Pessoa, C.C.; Coelho, A.R.F.; Luís, I.C.; Marques, A.C.; Simões, M.; Reboredo, F.; Pessoa, M.F.; Silva, M.M.; Galhano, C.; et al. Influence of Zinc Fertilization for Physical and Chemical Parameters and Sensory Properties of Grapes. In Proceedings of the 1st International Conference on Water Energy Food and Sustainability (ICoWEFS 2021), Leiria, Portugal, 10–12 May 2021; Springer: Cham, Switzerland, 2021. [Google Scholar] [CrossRef]
- Marschner, H. Zinc Uptake from Soils. In Zinc in Soils and Plants. Developments in Plant and Soil Sciences; Robson, A.D., Ed.; Springer: Dordrecht, The Netherlands, 1993; Volume 55, pp. 59–77. [Google Scholar] [CrossRef]
- Pagani, A.; Sawyer, J.E.; Mallarino, A. Site-Specific Nutrient Management: For Nutrient Management Planning to Improve Crop Production, Environmental Quality, and Economic Return. Extension and Outreach Publications, USA, 2013; p. 116. Available online: https://lib.dr.iastate.edu/ex-48tension_pubs/116 (accessed on 9 January 2022).
- El-Ramady, H.R.; Alshaal, T.A.; Amer, M.; Domokos-Szabolcsy, E.; Elhawat, J.; Prokisch, J.; Fári, M. Soil Quality and Plant Nutrition. In Sustainable Agriculture Reviews 14; Ozier-Lafontaine, H., Lesueur-Jannoyer, M., Eds.; Sustainable Agriculture Reviews; Springer: Cham, Switzerland, 2014; Volume 14, pp. 345–447. [Google Scholar] [CrossRef]
- Pendias, A.K. Trace Elements in Soils and Plants, 4th ed.; CRC Press: Boca Raton, FL, USA, 2011. [Google Scholar]


| Samples | pH (H2O) | Electrical Conductivity | Moisture Content | Organic Matter Content |
|---|---|---|---|---|
| µS·cm−1 | % | |||
| S1 | 7.06 ± 0.188 a | 271 ± 25.7 a | 11.5 ± 2.61 a | 7.11 ± 0.646 a |
| S2 | 6.77 ± 0.213 a | 361 ± 15.2 a | 15.3 ± 1.69 a | 4.44 ± 0.473 b |
| S3 | 6.76 ± 0.0613 a | 358 ± 44.3 a | 16 ± 0.445 a | 4.64 ± 0.136 b |
| S4 | 6.83 ± 0.0921 a | 313 ± 39.4 a | 17.3 ± 1.15 a | 5.31 ± 0.0463 b |
| Samples | S | K | Ca | Mn | Fe | Cu | Zn | Mg | P |
|---|---|---|---|---|---|---|---|---|---|
| % | mg·kg−1 | ||||||||
| S1 | 0.0195 ± 0.0005 ab | 0.0899 ± 0.004 a | 1.182 ± 0.053 a | 495 ± 59 a | 21759 ± 1895 a | 79.9 ± 1.9 b | 20.9 ± 1.3 b | <1500 | <200 |
| S2 | 0.0191 ± 0.001 b | 0.0841 ± 0.002 ab | 1.042 ± 0.063 ab | 446 ± 37 a | 21296 ± 1572 a | 91.2 ± 4.71 b | 22.1 ± 0.939 ab | ||
| S3 | 0.0218 ± 0.0005 a | 0.0835 ± 0.001 ab | 1.183 ± 0.053 a | 480 ± 42 a | 22408 ± 1424 a | 79.9 ± 4.81 b | 22.2 ± 1.12 ab | ||
| S4 | 0.0209 ± 0.0009 ab | 0.0755 ± 0.002 b | 0.9787 ± 0.026 b | 619 ± 59 a | 24311 ± 1010 a | 116 ± 1.88 a | 26.2 ± 0.885 a | ||
| (a) | (b) | ||||||||||||||
| S1 | Ca | K | S | Zn | Cu | Fe | Mn | S2 | Ca | K | S | Zn | Cu | Fe | Mn |
| Ca | 1 | 1 | 0.5 | −0.5 | −0.5 | −0.5 | −0.5 | Ca | 1 | 0.5 | −0.5 | −1 | −0.5 | −1 | −1 |
| K | 0.93 | 1 | 0.5 | −0.5 | −0.5 | −0.5 | −0.5 | K | −0.14 | 1 | −1 | −0.5 | 0.5 | −0.5 | −0.5 |
| S | 0.35 | −0.015 | 1 | −1 | −1 | −1 | −1 | S | 0.2 | −1 | 1 | 0.5 | −0.5 | 0.5 | 0.5 |
| Zn | −0.69 | −0.38 | −0.92 | 1 | 1 | 1 | 1 | Zn | −0.93 | −0.23 | 0.17 | 1 | 0.5 | 1 | 1 |
| Cu | −0.89 | −0.67 | −0.73 | 0.94 | 1 | 1 | 1 | Cu | −1 | 0.21 | −0.27 | 0.91 | 1 | 0.5 | 0.5 |
| Fe | −0.6 | −0.27 | −0.96 | 0.99 | 0.89 | 1 | 1 | Fe | −0.95 | −0.17 | 0.1 | 1 | 0.93 | 1 | 1 |
| Mn | −0.78 | −0.5 | −0.86 | 0.99 | 0.98 | 0.97 | 1 | Mn | −1 | 0.11 | −0.18 | 0.94 | 1 | 0.96 | 1 |
| (c) | (d) | ||||||||||||||
| S3 | Ca | K | S | Zn | Cu | Fe | Mn | S4 | Ca | K | S | Zn | Cu | Fe | Mn |
| Ca | 1 | 1 | −0.33 | −0.32 | −0.32 | 0.32 | 0.32 | Ca | 1 | 1 | −0.5 | −0.5 | −1 | 1 | 1 |
| K | 0.61 | 1 | −0.33 | −0.32 | −0.32 | 0.32 | 0.32 | K | 0.82 | 1 | −0.5 | −0.5 | −1 | 1 | 1 |
| S | −0.19 | −0.89 | 1 | 0.95 | 0.95 | 0.74 | 0.74 | S | 0.021 | −0.55 | 1 | −0.5 | 0.5 | −0.5 | −0.5 |
| Zn | −0.003 | −0.74 | 0.91 | 1 | 0.8 | 0.8 | 0.6 | Zn | −0.42 | 0.17 | −0.92 | 1 | 0.5 | −0.5 | −0.5 |
| Cu | −0.19 | −0.89 | 1 | 0.91 | 1 | 0.6 | 0.8 | Cu | −0.96 | −0.95 | 0.27 | 0.14 | 1 | −1 | −1 |
| Fe | 0.53 | −0.35 | 0.73 | 0.79 | 0.73 | 1 | 0.8 | Fe | 0.85 | 1 | −0.51 | 0.11 | −0.97 | 1 | 1 |
| Mn | 0.56 | −0.31 | 0.71 | 0.74 | 0.71 | 1 | 1 | Mn | 1 | 0.86 | −0.054 | −0.35 | −0.98 | 0.89 | 1 |
Publisher’s Note: MDPI stays neutral with regard to jurisdictional claims in published maps and institutional affiliations. |
© 2022 by the authors. Licensee MDPI, Basel, Switzerland. This article is an open access article distributed under the terms and conditions of the Creative Commons Attribution (CC BY) license (https://creativecommons.org/licenses/by/4.0/).
Share and Cite
Luís, I.C.; Marques, A.C.; Coelho, A.R.F.; Pessoa, C.C.; Daccak, D.; Patanita, M.; Dôres, J.; Almeida, A.S.; Silva, M.M.; Pessoa, M.F.; et al. Characterization of a Triticum aestivum L. Experimental Field to Implement an Agronomic Biofortification Workflow. Chem. Proc. 2022, 10, 33. https://doi.org/10.3390/IOCAG2022-12304
Luís IC, Marques AC, Coelho ARF, Pessoa CC, Daccak D, Patanita M, Dôres J, Almeida AS, Silva MM, Pessoa MF, et al. Characterization of a Triticum aestivum L. Experimental Field to Implement an Agronomic Biofortification Workflow. Chemistry Proceedings. 2022; 10(1):33. https://doi.org/10.3390/IOCAG2022-12304
Chicago/Turabian StyleLuís, Inês Carmo, Ana Coelho Marques, Ana Rita F. Coelho, Cláudia Campos Pessoa, Diana Daccak, Manuel Patanita, José Dôres, Ana Sofia Almeida, Maria Manuela Silva, Maria Fernanda Pessoa, and et al. 2022. "Characterization of a Triticum aestivum L. Experimental Field to Implement an Agronomic Biofortification Workflow" Chemistry Proceedings 10, no. 1: 33. https://doi.org/10.3390/IOCAG2022-12304