Article

Discrimination of Anari Cheese Samples in Comparison with Halloumi Cheese Samples Regarding the Origin of the Species by FTIR Measurements and Chemometrics

by
Maria Tarapoulouzi
* and
Charis R. Theocharis
*
Department of Chemistry, University of Cyprus, Leoforos Panepistimiou 1, 2109 Nicosia, Cyprus
*
Authors to whom correspondence should be addressed.
Analytica 2023, 4(3), 374-384; https://doi.org/10.3390/analytica4030027
Submission received: 25 July 2023 / Revised: 9 August 2023 / Accepted: 15 August 2023 / Published: 18 August 2023
(This article belongs to the Section Spectroscopy)

Abstract

:
Nowadays, adulteration of traditional food products is a very important field in the general food authenticity sector. Moreover, it is important to create databases with authentic traditional products. In Cyprus, research about the traditional dairy products is scarce. Anari is predominantly made from goat’s and sheep’s milk, but milk from cows can also be used. It is produced during the process of Halloumi cheese making. Classification of Halloumi and Anari cheese took place in two classes, thus per cheese type, and after that in milk species subclasses such as cow and goat-sheep origins for each cheese type. This research study aims to enlighten the field of food authenticity in terms of traditional Cypriot dairy products. The first step of the methodology is the freeze-drying process for lyophilization of samples. Forty-four samples have been analyzed thus far, including both Halloumi and Anari cheese. Measurements for each sample were obtained by using Fourier Transformed Infrared (FTIR) Spectroscopy. Interpretation of the extensive data was undertaken via Orthogonal Partial Least Squares-Discriminant Analysis (OPLS-DA), and through the SIMCA chemometrics package. Characterization of Anari cheese by applying FTIR took place. In terms of cheese type, Halloumi and Anari cheese samples were classified correctly. In addition, Anari samples were classified correctly regarding the milk species’ origin. The proposed experimental procedure along with chemometrics allow the detection of the milk species’ origin of traditional Anari samples, highlighting the importance of FTIR spectroscopy in combination with chemometrics in food authenticity. Creation of a database with Anari samples from Cyprus has started, and this is a very important step towards authenticity of traditional dairy products of Cyprus.

1. Introduction

Halloumi (Χαλλούμι) and Anari (Aναρή) cheeses are both Cypriot products. They are predominantly made from goat’s and sheep’s milk, but milk from cows can also be used. It is produced during the process of Halloumi cheese making. More particularly, Anari is formed by using the whey that remains as the residue from Halloumi manufacture. More fresh milk is added to the whey, and they are heated together until curds of Anari cheese are formed [1]. It is consumed in two forms: dry or fresh (soft) cheese.
Fresh Anari is white, soft with a mild and sweet creamy taste, while Halloumi is a firm, brined, slightly springy white cheese with a strong aroma [2]. When freshly made, Anari has a tender texture, high-moisture content, and is delicate in nature. It boasts a subtly sweet, slightly nutty taste and can be packaged in vacuum-sealed bags with a hint of salt or without. Anari cheese is commonly air-dried in specially designed rooms, transforming it into a firm, easily grated cheese. Dry Anari cheese has a consistent use in grated form, often utilized as a topping for pasta dishes or for thickening sauces. In addition, it finds application in crafting Flaounes (Φλαούνες), a traditional pastry by using both fresh and dried Anari, typically made during Orthodox Easter.
Moreover, Anari is similar with other whey cheeses, such as Myzithra or Mizithra, Anthotyros and Manouri, all originated from Greece. Anthotyros cheese has a solid, enclosed structure and offers a mild, pleasant flavor. Manouri, a whey cheese, is crafted in regions including Thessaly, Western, and Central Macedonia. It features a dense, enclosed composition with a rich taste highlighted by creamy, fatty undertones [3]. In addition, Anari also has similarities with Ricotta cheese, as they are both soft, white and whey cheeses with very similar texture [4]. It should be noted that the above-mentioned Anari cheese types, Anthotyros, Myzithra and Manouri have not been subject of academic scrutiny and spectroscopic analysis yet. Despite the considerable consumption of Anari cheese and its importance to the Cypriot economy, there are very limited publications in the literature. Recently, research related to Halloumi cheese authenticity has increased, as shown in Table 1. It is worth mentioning that in 2021, Halloumi eventually secured a Protected Designation of Origin (PDO) status. There are no studies related to Cypriot Anari cheese. Table 1 presents publications related to authenticity and quality control between 2000–2023 in terms of only chemical analytical techniques, thus excluding microbiological studies. We tried to present studies that either took place in Cyprus or in Greece, with the aim to enhance the data about Cypriot cheeses, and these are very limited.
Overall, 15 studies are presented in Table 1, and they are about Halloumi and Kefalotyri cheeses only. The studies could be divided into five categories; (a) Farming or feeding system, (b) Food technology, (c) Reduced fat products (Food innovation), (d) Food authenticity (Milk species’ origin), and (e) Food authenticity (Type of cheese). This study could belong in the last two categories. Recently, Halloumi was analyzed with the view of detecting adulteration—vis à vis species origin for the milk [5]. The outcome of that qualitative study was the classification of Halloumi samples in two groups: cow and goat–-sheep origin. In addition, comparison of Halloumi with similar cheeses (e.g., Kefalotyri) was also undertaken to see whether these can be distinguished from Halloumi as well as milk origin [6].
Subsequently, so far, we have not analyzed Anari, which is not a competitor of Halloumi as there are the other cheeses studied, i.e., Kefalotyri and Cheddar [7], but Anari is produced in parallel with Halloumi and can be considered a by-product. Therefore, any adulteration in one will also affect the other. Therefore, Halloumi and Anari cheeses must be studied more and, of course, by following the PDO criteria for Halloumi cheese. The present paper aims to fill that gap in the scientific literature, in the context of increasing interest in assessing the adulteration of traditional dairy products in Cyprus, so that detection of adulterations or mislabeling is of great interest in terms of the protection of consumers, as well as safeguarding the economic interests of producers. A traditional food or product shows the history, the culture, and several geographical characteristics of the place of its origin. More specifically, the goal of this study was firstly to distinguish Halloumi and Anari cheese samples, thus discrimination based on the type of cheese; an approach similar to those [7], applied in the past for Cheddar and Kefalotyri, which aimed at deconstructing their unique recipes. In addition, a second goal of the study described hereafter is to determine adulterations in Anari cheese based on milk species’ origin. It was considered very interesting to check whether in the cow’s and goat-sheep’s origins are discriminated for both cheese categories, Halloumi and Anari. To our knowledge this is the first study related to Halloumi and Anari cheeses in terms of discriminant analysis and authenticity.
Table 1. Research studies about Cyprus cheese products that took place between 2000–2023 regarding authenticity based on chemical analytical techniques, thus excluding any studies containing any (micro)biological analyses, as well as sensory analyses were not presented.
Type of CheeseCheese CharacteristicsStudied Parameter(s)Analytical Technology(ies)Source
Farming Or Feeding System
Halloumi cheeseBovine, caprine and ovine milk and retail Halloumi cheese Effect of farming system (organic vs. conventional) and season on composition, fatty acid and protein profileGC-MS, NMR[8]
Halloumi cheeseGoat milk and Halloumi cheesesMajor and trace elements in grazing plants, goat milk and Halloumi cheese originating from three different areas in CyprusICP-AES[9]
Halloumi cheeseFresh Halloumi cheese made from either bovine milk or a mixture of ovine and caprine milksDetermination of forage-based terpenes and related compounds that could be associated with flavor in free-range Halloumi cheese.GC-MS[10]
Halloumi cheeseFresh and mature, ovine or bovine Halloumi cheeses Free volatile fatty acid content and sensory characteristicsGC[11]
Food technology
Halloumi cheese-Examination of the effects of the two cooking times on the chemical and sensory characteristics, the textural properties and the volatile compounds of the cooked cheese curds of Halloumi cheese after increasing the amount of cooking timeChemical analyses:
-pH-meter,
-calcium, sodium, potassium and magnesium contents by atomic absorption spectrophotometer,
-potassium and sodium: by a flame photometer
analysis of volatile compounds: GC-MS
Hunter color values L, a and b were determined by using the colorimeter
[12]
Halloumi cheeseOvine Halloumi cheese samples were made in Greece. Changes of organic acids, volatile aroma compounds and sensory characteristics of Halloumi cheese during storage in brine [Chemical analysis took place 1 day after preparation and following 15, 30, and 45 days of brine preservation (∼10% NaCl) at 4 °C]Lactose and organic acids: HPLC equipped with a refractive index detector detector
Volatile compounds: headspace system coupled to a GC/MS-Q
Free fatty acids: GC equipped with an on-column injector and a flame ionization detector
[13]
Halloumi cheeseReduced-fat Halloumi type cheeses from ovine milk containing 1.8% fatComparison of two methods of making reduced-fat ovine Halloumi type cheesePhysicochemical analyses of cheeses (calcium, sodium, potassium and magnesium contents): atomic absorption spectrophotometer
Physicochemical Analyses of Milk (fat, protein, lactose, ash, total solids and pH): Milkoscan apparatus and pH meter
[14]
Halloumi cheeseBovine Halloumi cheeseFat and protein content, texture profile, sensory characteristics to study the effects of modifying the fat-to-protein ratioFat content—infrared analyzer
Protein content—Kjeldahl method
Texture—meltability
[15]
Food authenticity
Halloumi cheeseHalloumi cheese made from pure ovine milk, pure caprine milk or mixtures containing 15 or 30% caprine milk were produced in GreeceInvestigation of rheological, physicochemical and organoleptic characteristicsPhysicochemical analyses
-total nitrogen, soluble nitrogen: Kjeldatherm KT 20s digestion and Vapotest 30 distillation systems equipped with an endpoint titrator.
-calcium content: atomic absorption spectrophotometer
[16]
Halloumi cheeseMilk and fresh Halloumi cheese samples from various milk speciesDiscrimination of samples based on milk species’ originFTIR[5]
Halloumi cheeseHalloumi cheese samples collected at the European marketMolecular markers in the finished Halloumi to reveal the addition of skim milk powder and calcium caseinate to cheese milkLysinoalanine and furosine: HPLC system equipped with a UV detector
The formation of lactosylated casein was tested by CZE
[17]
Halloumi cheeseHalloumi cheese made from ovine milk or made from mixtures of milk from different species Detection of caprine casein in ovine Halloumi cheesecation-exchange HPLC[18]
Halloumi cheeseDifferent percentages of cow’s, ewe’s, and goat’s milk were manufactured in CyprusDetection of milk mixtures in Halloumi cheese [Samples were taken at 0 d and after 40 d of ripening]Capillary electrophoresis[1]
Halloumi and Kefalotyri cheeseVarious milk species’ origin for both cheese types Investigation of discrimination of different types of cheese with similar external characteristics, based on spectroscopical technologiesFTIR and 1H-NMR[6]
Kefalotyri cheeseVarious combinations of milk species’ origin of Kefalotyri cheese samplesDiscrimination of different types of cheese samples based on spectroscopical technologiesFTIR and 1H-NMR[7]
Abbreviations: CZE: capillary zone electrophoresis, FTIR: Fourier transformed infrared spectroscopy, GC: gas chromatography, GC-MS: gas chromatography—mass spectrometry, GC/MS-Q: gas chromatography—mass spectrometry Q-Orbitrap, HPLC: high-performance liquid chromatography, ICP-AES: inductively coupled plasma–atomic emission spectroscopy, NMR: nuclear magnetic resonance, 1H-NMR: proton nuclear magnetic resonance.

2. Materials and Methods

2.1. Samples Preparation

Pre-treatment of 18 fresh Halloumi and 26 fresh Anari cheese samples with different trademarks, from all over Cyprus was undertaken. The samples were obtained from both industrial mass production enterprises as well as homemade artisanal producers in 2017 (thus, before certification of PDO status for Halloumi cheese). Freeze drying was the first step of the methodology with 5- and 6-h treatment for Halloumi and Anari cheese, respectively, using a Christ Alpha 1–2 freeze drier (Martin Christ Gefriertrocknungsanlagen GmbH, Osterode am Harz, Germany). The condenser temperature was 233 K and the final pressure in the drying chamber was 3 mPa. Matured (dry) samples were not chosen for this study to avoid any discrepancies related to cheese ripening. All Halloumi cheese samples were previously studied by [5], thus they constitute a well-known database for this study.

2.2. Fourier Transformed Infrared Spectroscopy (FTIR)

Fourier transformed infrared spectroscopy (FTIR) spectra were taken in three replicates with the conditions described elsewhere [5,6] by using a Shimadzu Fourier Transform—8900 Spectrometer instrument employing a KBr beam splitter. Samples were recorded as pressed KBr pellets. Spectra were obtained in the wavenumber range from 4000 to 400 cm−1 at a normal resolution of 8 cm−1 and with 20 co-added scans. The samples were recorded against a background of air to minimize the interference due to carbon dioxide and water vapor in the atmosphere. FTIR measurements were normalized by using standard deviation to reduce the influence of different scaling.

2.3. Data Analysis

The normalized data were subjected to analysis of variance. Data analysis took place using SIMCA chemometric software (version 15.0.2, Umetrics, Umea, Sweden). Since all the variables were the same (i.e., spectroscopic measurements), centering and auto scaling to unit variance was used which is the SIMCA default choice. The supervised method OPLS-DA was applied to detect the patterns that best discriminate between the pre-defined groups. Chemometric interpretation of the data (variables) revealed that only the subregions 3000–2800 and 1700–1090 cm−1 from FTIR spectra were important to proceed with, and they correspond to the presence of lipids and polysaccharides and the occurrence of proteins [19].
Training and test sets were used to validate the OPLS-DA model of this study. The samples of the training and test sets were randomly selected, and they were containing 80 and 20% of the total number of samples, respectively. The group separation in the model was determined by calculating the 95% confidence interval. Q2 value of OPLS-DA model was the indication of robustness of classification. A misclassification table was produced to check the % correct classification of the OPLS-DA model. Permutation testing was conducted to check the quality of the model. CV-ANOVA testing was used to assess statistical significance of all OPLS models.

3. Results

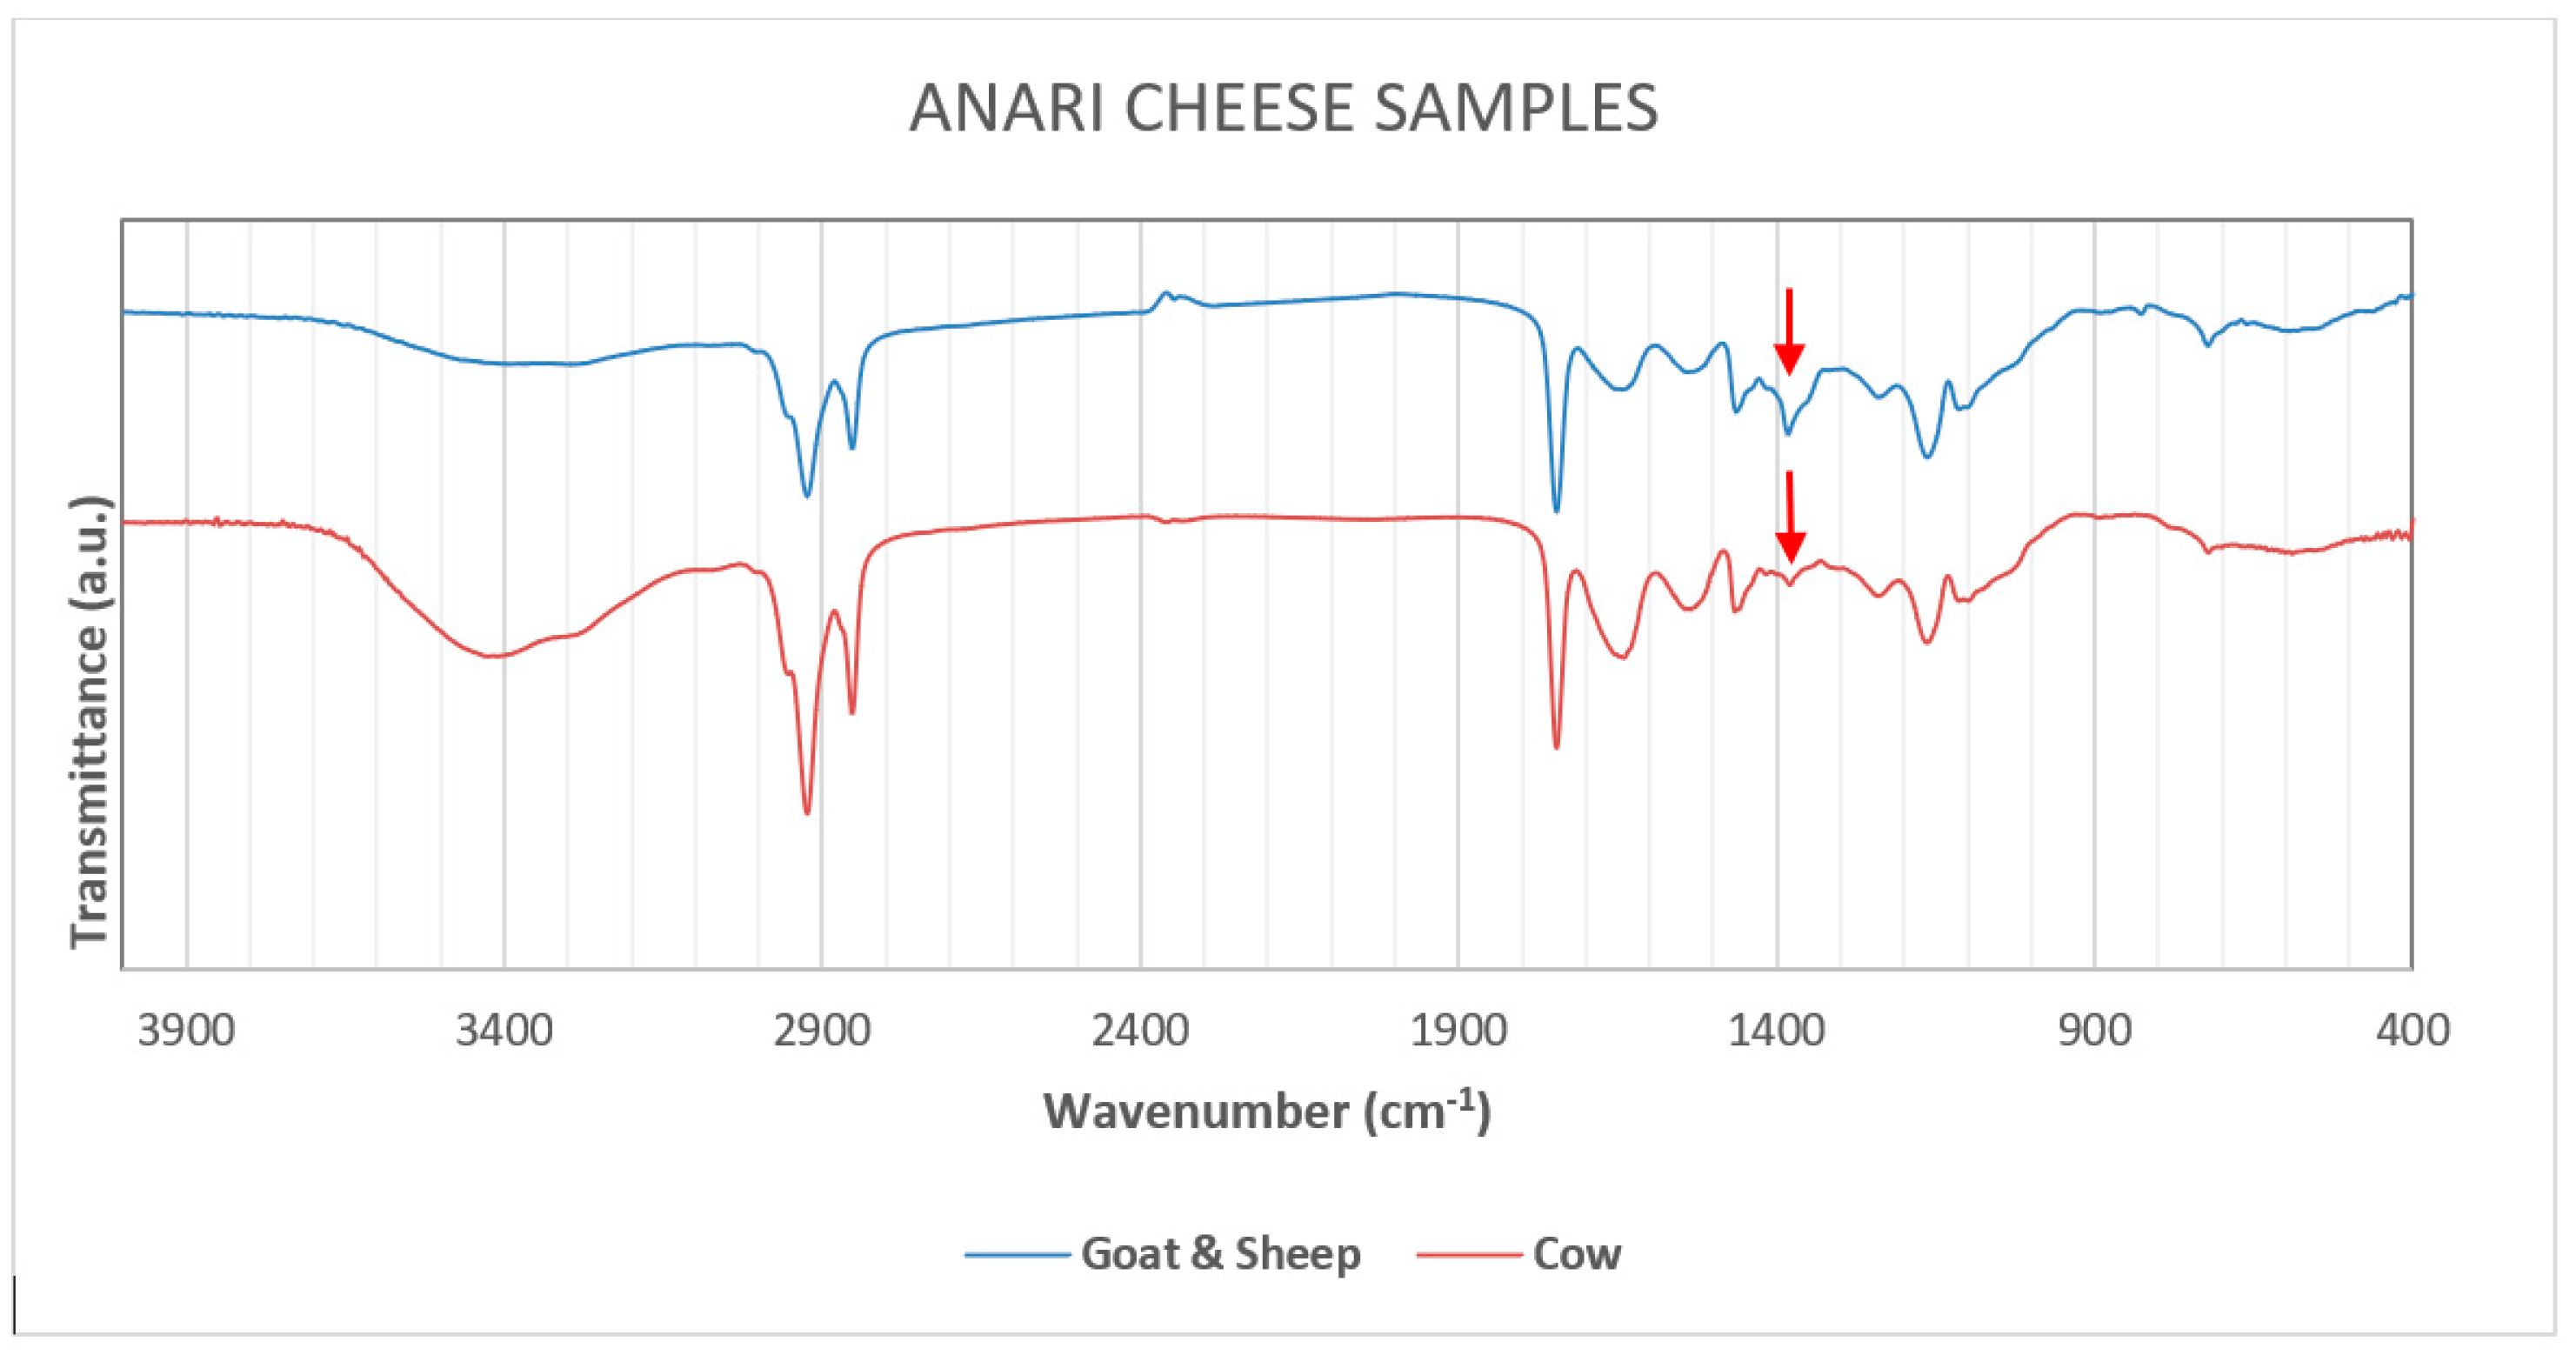
3.1. Characterisation of Anari Cheese

To our knowledge this is the first time that characterization of Anari cheese took place by using FTIR, with a similar methodology applied on Halloumi cheese in [5]. The supervised method OPLS-DA was used, and chemometric interpretation of the data (variables) revealed that only the subregions 3000–2800 and 1700–1090 cm−1 from FTIR spectra were important to proceed with. FTIR spectra of representative samples of the Anari cheese database regarding species’ origin are shown in Figure 1.
Based on Figure 1, a clear difference in relative peak intensities between 1400–1300 cm−1 are characteristic of amide III proteins. As it was expected, this subregion was necessary during chemometric discrimination of Anari cheese samples regarding milk species’ origin. Other important intensities were observed at 1150–1200 (–NH2, –COH and C–C), 1650–1550 (C=O/C–N/N–H, amides I and II) and 2930–1745 cm−1 (C=O fat) [13,18]. Ricciardi et al. [19] studied the FTIR spectra of Ricotta cheese, and they identify the occurrence of proteins at 1700–1600 cm−1, and at 1300–600, 1750 and 3000–2800 cm−1 the presence of lipids and polysaccharides.
As stated above, Halloumi cheese characterization was undertaken by Tarapoulouzi et al. [5] and based on that, from the data outputs of the study, it can be stated that the correlation with the respective Anari cheese samples seem to be very different. This explains the excellent discrimination between Halloumi and Anari samples that will be shown in the following part. Subsequently, after studying the important features of Anari cheese, chemometrics were applied to produce a model that correctly classifies the different samples.

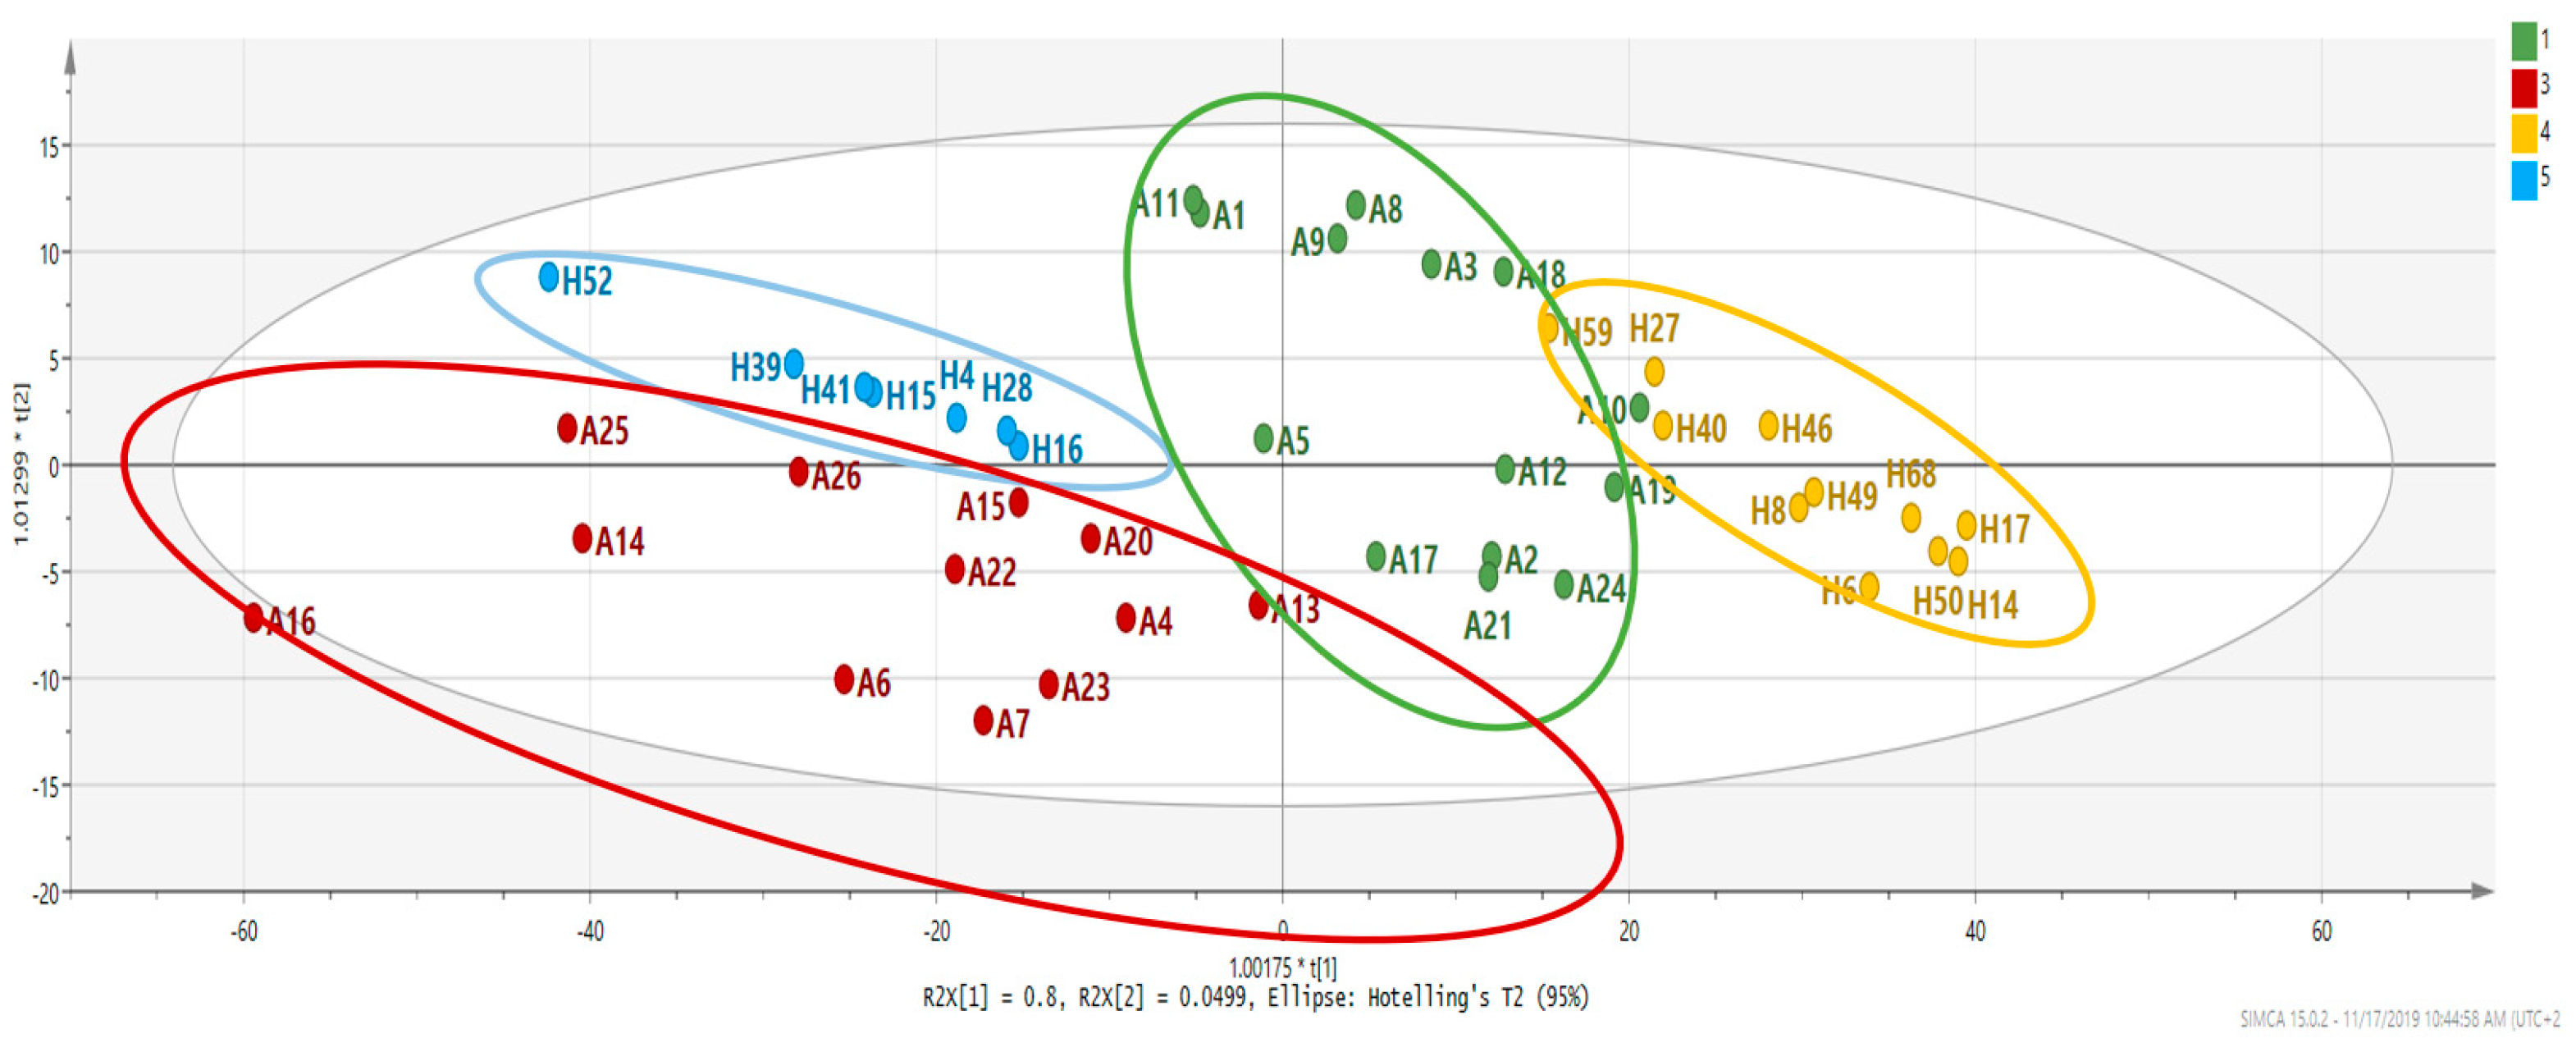
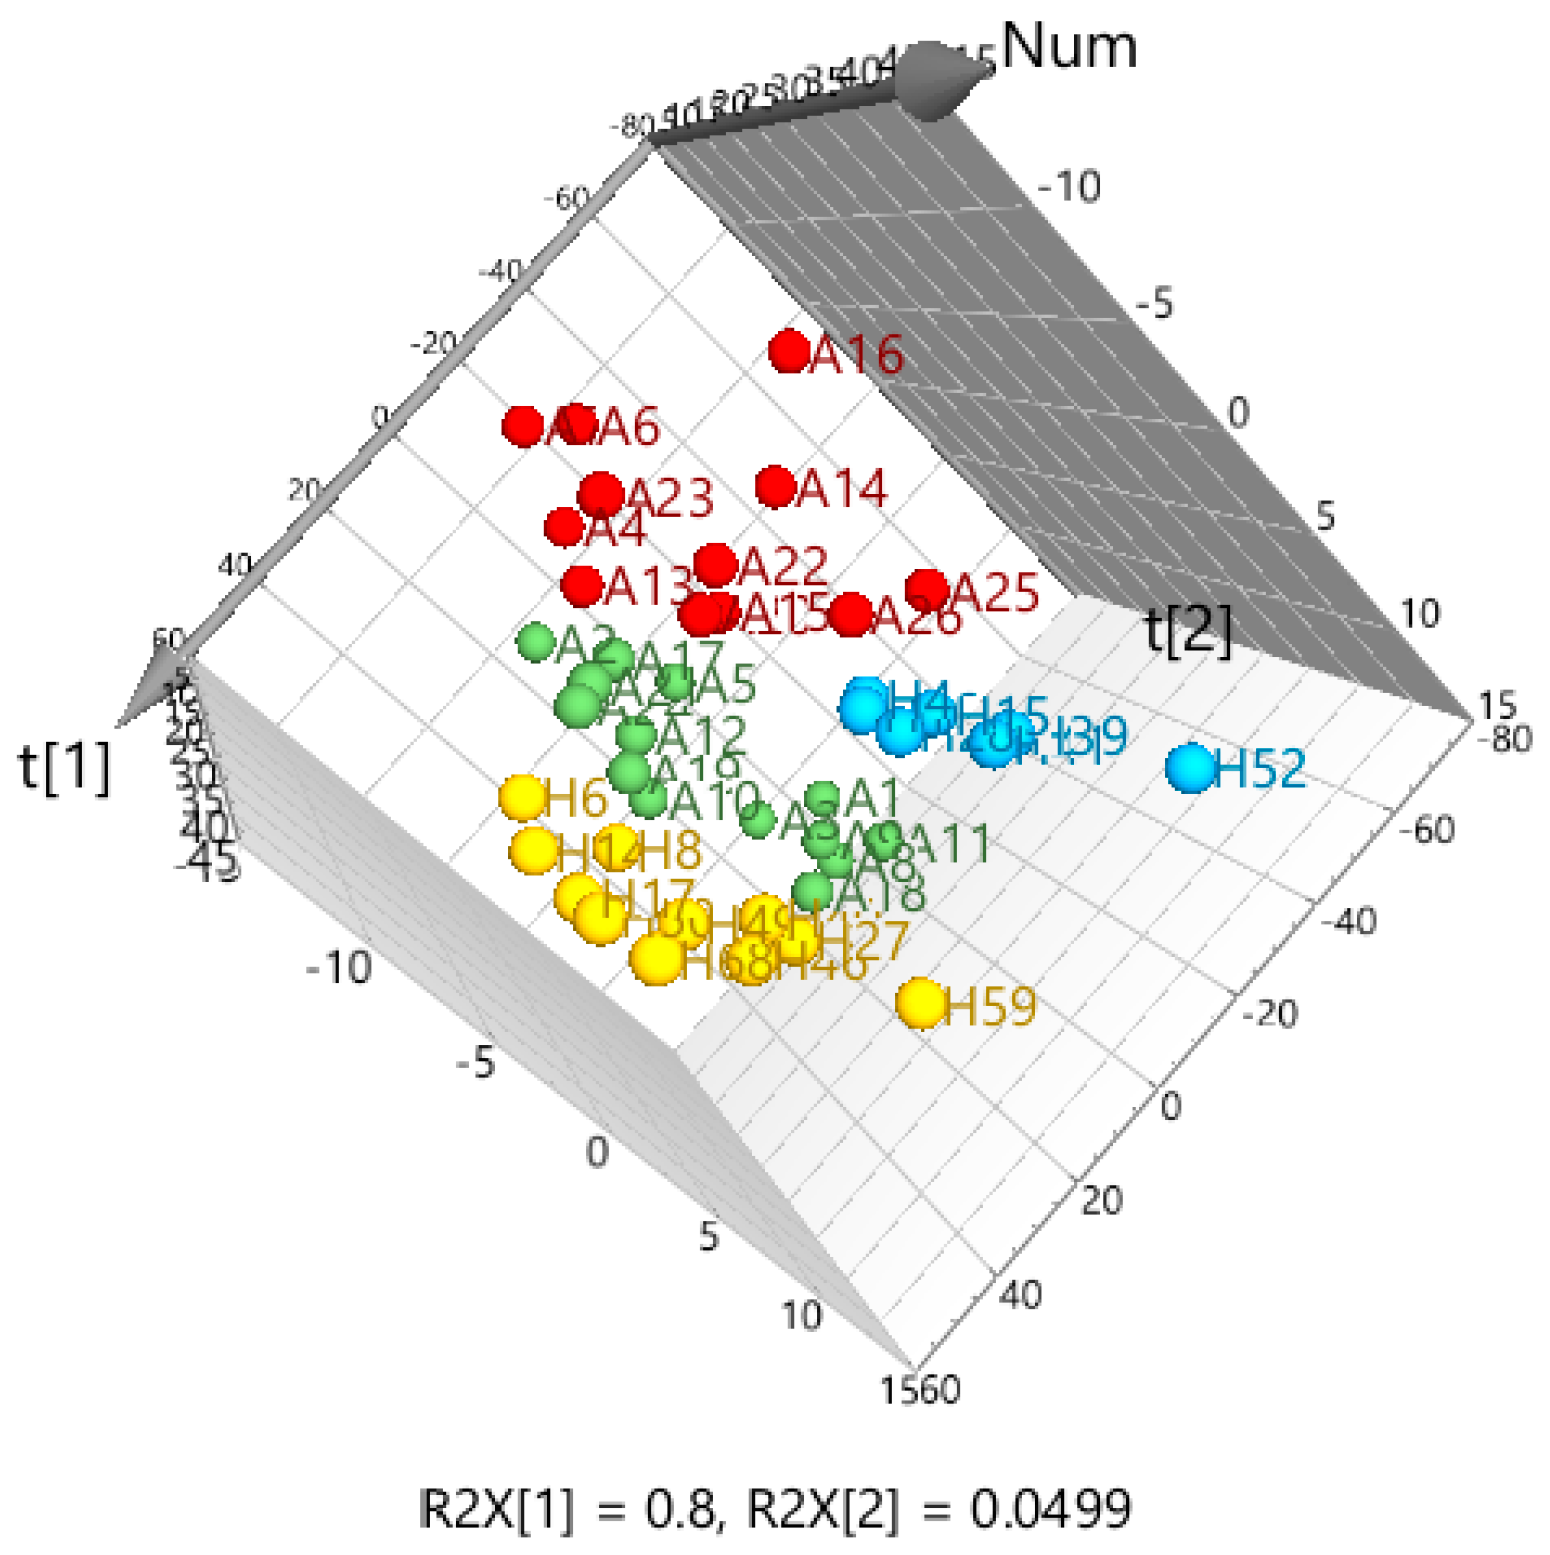
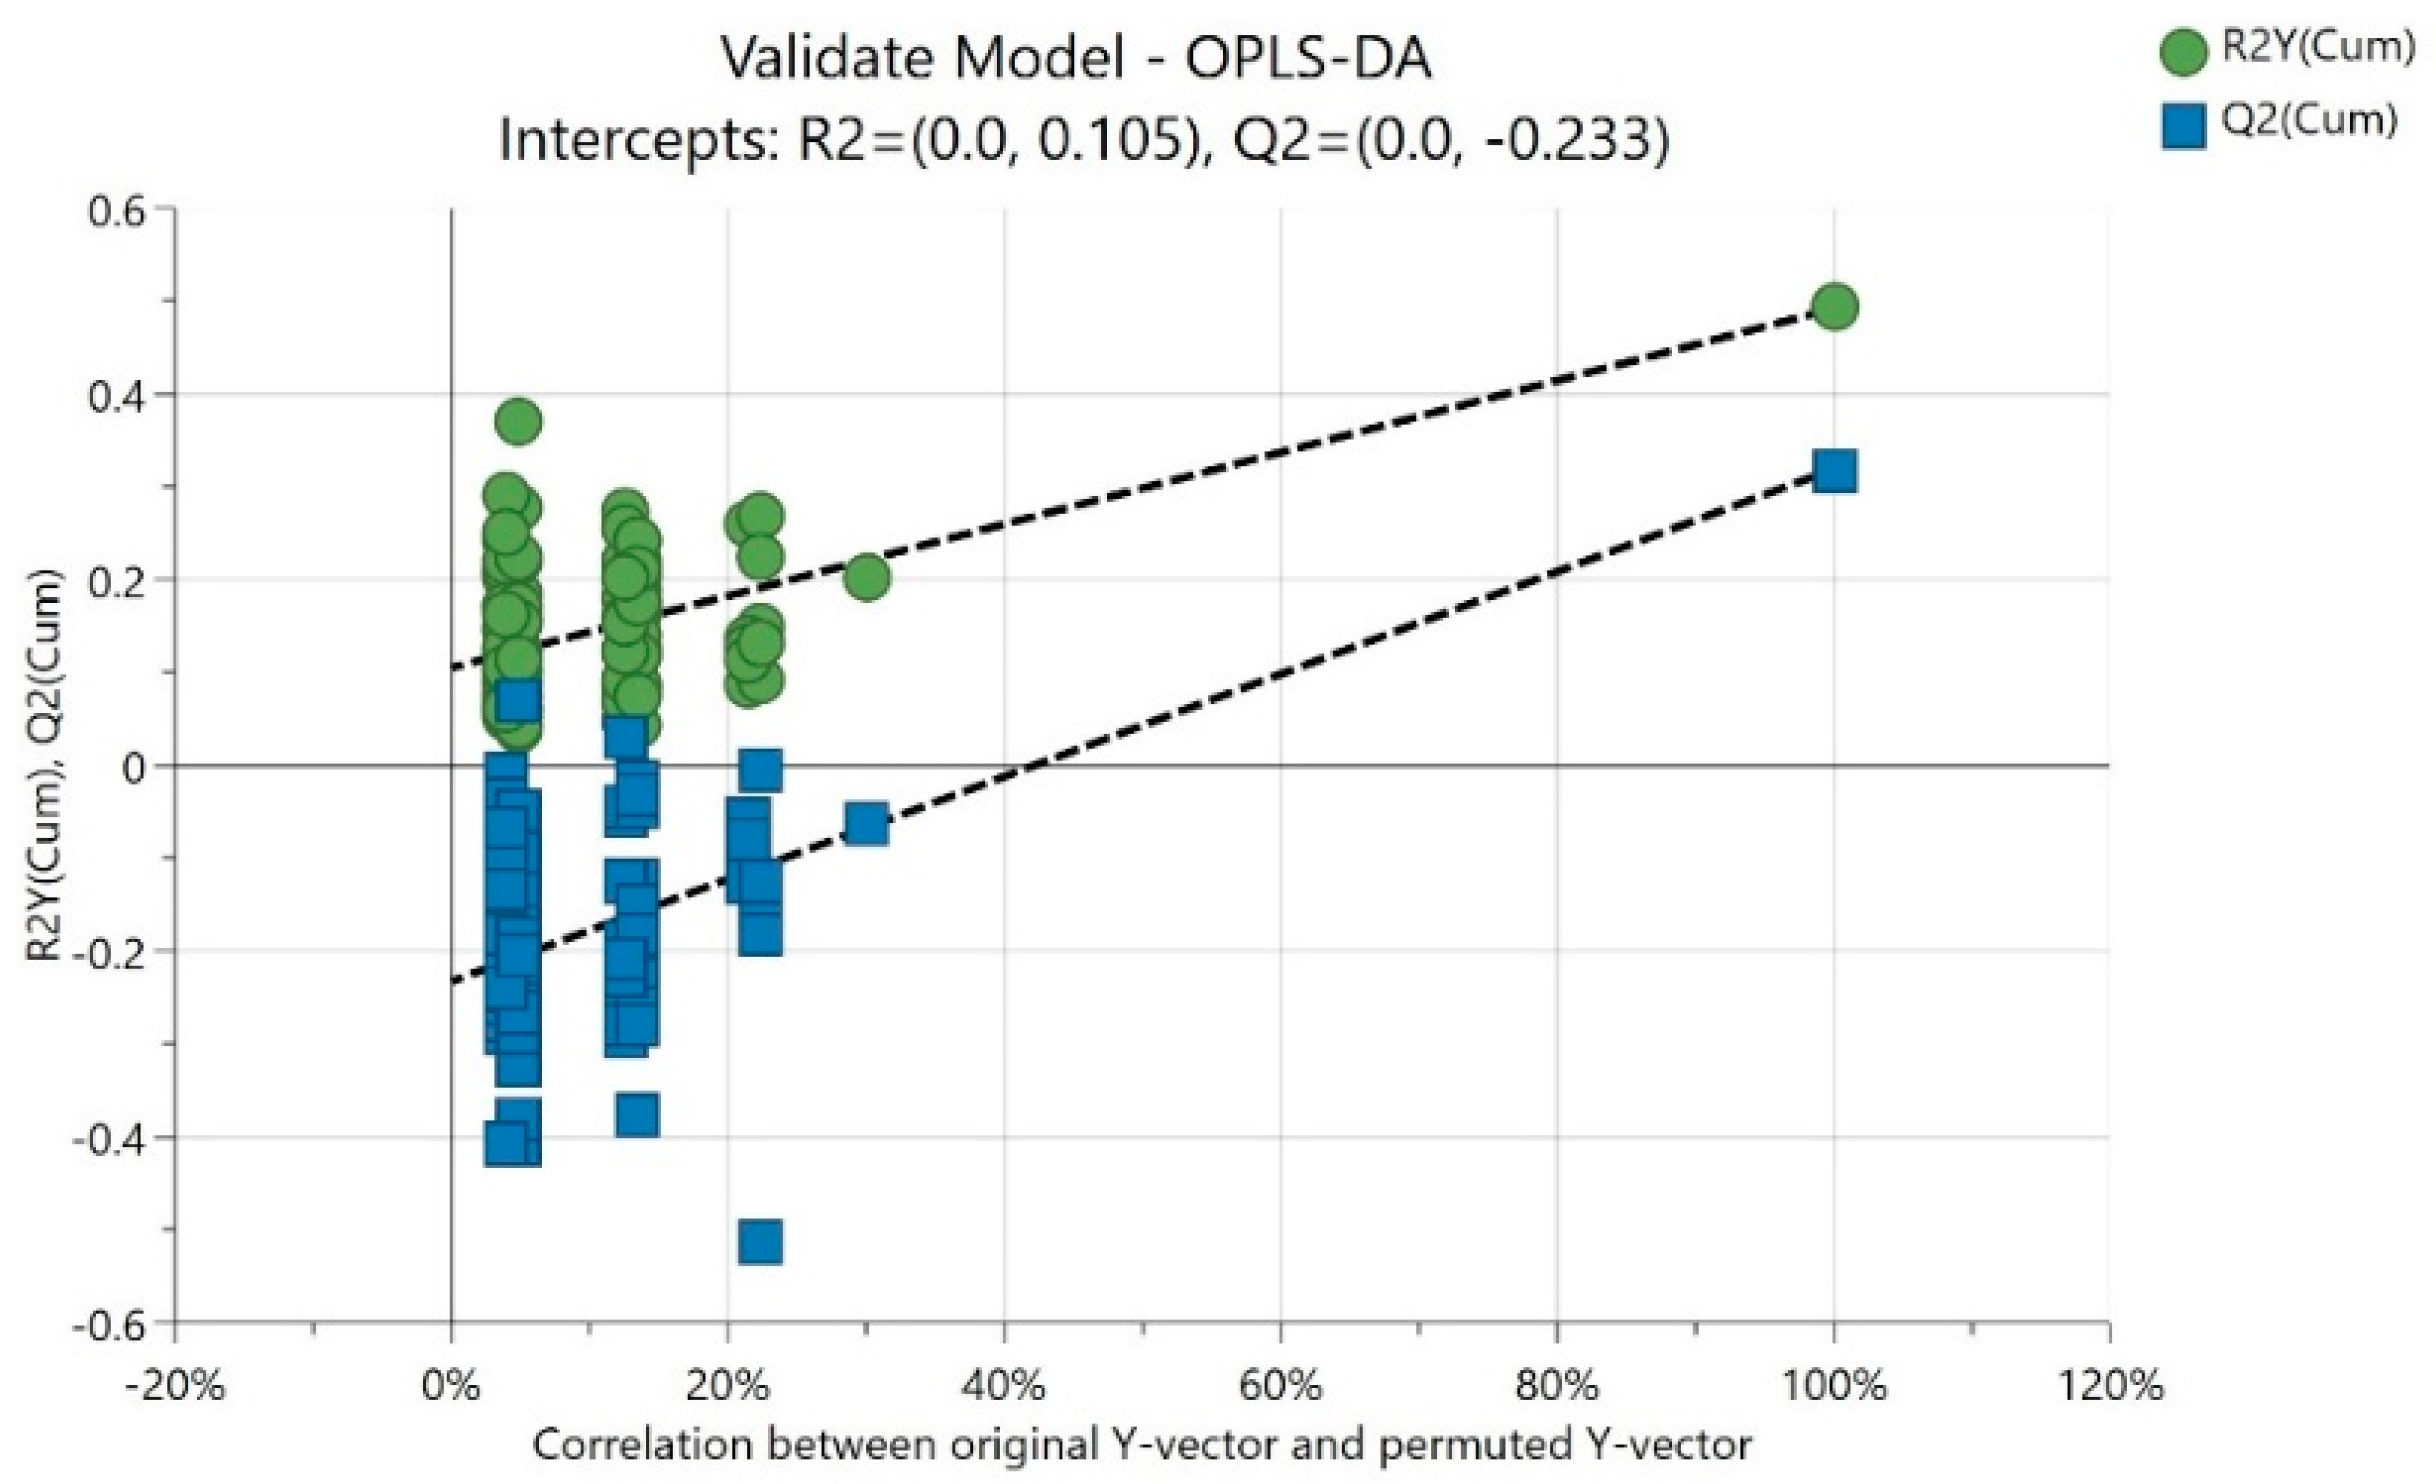
3.2. Discrimination of Samples with Chemometric Interpretation

Chemometric interpretation of the FTIR data was necessary to reduce the huge load of spectral data obtained by FTIR, to extract the most important subregions and then to produce a robust model as a database for future studies. The most important variables for this model were the ranges 3000–2800 and 1700–1090 cm−1 from the FTIR spectra. The produced model is illustrated in Figure 2. R2X(cum) = 0.994, R2Y(cum) = 0.873 and Q2(cum) = 0.736 were extracted by using four components. The OPLS-DA score plot shows that cow origin cheese products occupy the left side of the score plot and the goat and sheep origin cheese products at the opposite part, thus clearly distinguishing them in the two sides was noted regarding the different cheese type.
The samples are classified into four groups: Goat and Sheep origin Anari (GSA), Cow origin Anari (CA), Goat and Sheep origin Halloumi (GSH) and Cow origin Halloumi (CH) cheese samples, which proves that even if geographical origin of the samples was the same (since milk origin was the same in most cases), Halloumi and Anari cheese are two different cheese types with different recipes with different spectroscopically characteristics, as shown in Figure 2. Further to this, a misclassification table was produced, showing 95.45% total success of correct classification, while the low Fischer value of 5.3 × 10⁻¹⁹ emphasizes the statistical importance of the model, as shown in Table 2. In addition, 3D presentation of the four classes is depicted in Figure 3, highlighting the good classification among the groups.
The permutation test in Figure 4 shows that the model can explain 100% the total variance of the data array. As expected, original Y-variable possesses much higher Q2 and R2 compared to permuted ones and the p-value was lower than 0.01. Model significance is inferred from the degree of vertical separation between the null distribution (leftmost) and the true R2 and Q2 values (rightmost). Training (Figure 5a) and test (Figure 5b) sets were used to validate the result of the study.

4. Discussion

An authentic item demonstrates the accuracy of information outlined on its label and adheres to established regulations. Products like cheese, which possess a high value, intricate processing, and a multifaceted supply chain involving multiple phases, are susceptible to adulteration—a pressing concern due to its potential to jeopardize product quality, consumer safety, and satisfaction. Ensuring the genuineness of cheese has emerged as a significant issue for the food industry, researchers, and consumers alike. Over the past few decades, instances of adulteration and deviations from standards have been reported across various dairy products, encompassing powdered milk, milk species, cheese whey, butter, fermented milk, and cheeses. Irrespective of the type of adulteration, verifying cheese authenticity entails tasks such as pinpointing its origin, investigating the causes of adulteration, analyzing added substances, and confirming the maturation stages [20].
Fourier Transform Infrared (FTIR) spectroscopy is a powerful analytical technique that is widely used in the food industry for the determination of various parameters such as food composition, quality, and authenticity. FTIR spectroscopy is a fast, low-cost, green and no sample pretreatment required technique and these advantages make it very popular for research applications. In combination with chemometrics, they have gained significant attention as a potential tool for cheese authenticity analysis, and they can be a useful tool for the detection of fraudulent practices in the dairy industry and for ensuring the authenticity of cheese products [6,21,22,23,24,25].
The application of chemometrics in combination with spectroscopy has provided powerful tools for cheese authenticity [20]. Orthogonal Projections to Latent Structures Discriminant Analysis (OPLS-DA) is a supervised chemometric technique that is commonly used for classification and discrimination tasks in the analysis of complex datasets, including those generated by spectroscopic techniques like FTIR. OPLS-DA is an extension of Partial Least Squares Discriminant Analysis (PLS-DA), which is also a supervised method that is commonly used for classification tasks in spectroscopic data analysis. OPLS-DA is similar to PLS-DA in that it uses a combination of spectral information and class information to create a predictive model that can be used to classify new samples based on their spectral characteristics. However, OPLS-DA adds an additional step to the analysis that involves the extraction of orthogonal (uncorrelated) components that capture variation in the data that is not related to class labels. This orthogonalization step helps to remove any variation in the data that is not related to class labels, which can improve the predictive ability of the model and make it more robust to overfitting compared to PLS-DA [24,26].
To provide a critical discussion of the results of the proposed study, similarities and differences from other published studies should be highlighted to successfully judge the outcomes. As mentioned above, this is the first study related to Anari cheese in terms of discriminant analysis and authenticity, as well as the first time Anari cheese was studied with FTIR spectroscopy. In the context of cheese technology, Kaminarides et al. [27] evaluated the effect of thermophilin T, previously produced in fermented milk used in Myzithra preparation, on the microbiological and physicochemical characteristics of cheese. Ricotta, which is also similar to Anari cheese, was studied by Ricciardi et al. [19] in terms of the effect of pulsed light on microbial inactivation and sensory properties of fresh ricotta cheese. They conducted FTIR measurements among others, and the obtained spectra were like those measured in this study. Their findings, i.e., FTIR spectra, provide a significant new goal to compare Ricotta with Anari cheese as a future study.

5. Conclusions

This study confirms the originality of both Cypriot cheese products, Halloumi and Anari, postulating that both cheeses are correctly classified based on cheese type. Through this study, Anari received significant scientific attention. The analysis methods, which were applied here, clearly distinguish the samples in terms of different cheese types. In addition, correct discrimination took place regarding the milk species’ origin for each cheese category, therefore, a combination of FTIR with chemometrics demonstrated great potential for adulteration detection in Anari as well as Halloumi cheese, regarding the milk species’ origin. Overall, OPLS-DA is a useful chemometric technique for the analysis of complex datasets. It can be used for classification and discrimination tasks in a variety of applications, including food authenticity analysis.
Future studies aim to analyze Anari samples compared to Mizithra and Manouri cheese products from Greece and Ricotta from Italy to classify them regarding geographical origin and/or cheese type. Therefore, Anari samples must be tested in parallel with those similar cheese types to confirm its uniqueness. Creation of a database with Anari samples from Cyprus has started and this is a very important step towards authenticity of traditional dairy products of Cyprus. More emphasis and further study must be dedicated to traditional cheese products, like Halloumi and Anari, to avoid any likelihood of fraud and highlight their authenticity.

Author Contributions

Conceptualization, M.T. and C.R.T.; methodology, C.R.T.; software, M.T. and C.R.T.; validation, M.T. and C.R.T.; resources, C.R.T.; writing—original draft preparation, M.T.; writing—review and editing, C.R.T.; visualization, M.T. and C.R.T.; supervision, C.R.T. All authors have read and agreed to the published version of the manuscript.

Funding

This research received no external funding.

Data Availability Statement

Not applicable.

Conflicts of Interest

The authors declare no conflict of interest.

References

  1. Recio, I.; Garcia-Risco, M.R.; Amigo, L.; Molina, E.; Ramos, M.; Martín-Álvarez, P.J. Detection of milk mixtures in Halloumi cheese. J. Dairy Sci. 2004, 87, 1595–1600. [Google Scholar] [CrossRef] [PubMed]
  2. Kalli, N.; Kyriakidou, P. Quality and safety of products of animal origin and consumers attitudes: Cyprus perspective. In Consumer Attitudes to Food Quality Products; Springer: Berlin/Heidelberg, Germany, 2013; pp. 261–268. [Google Scholar]
  3. Bintsis, T.; Papademas, P. Sustainable Approaches in Whey Cheese Production: A Review. Dairy 2023, 4, 249–270. [Google Scholar] [CrossRef]
  4. Raphaelides, S.N.; Antoniou, K.D.; Vasilliadou, S.; Georgaki, C.; Gravanis, A. Ripening effects on the rheological behaviour of Halloumi cheese. J. Food Eng. 2006, 76, 321–326. [Google Scholar] [CrossRef]
  5. Tarapoulouzi, M.; Kokkinofta, R.; Theocharis, C.R. Chemometric analysis combined with FTIR spectroscopy of milk and Halloumi cheese samples according to species’ origin. Food Sci. Nutr. 2020, 8, 3262–3273. [Google Scholar] [CrossRef] [PubMed]
  6. Tarapoulouzi, M.; Theocharis, C.R. Discrimination of Cheddar, Kefalotyri, and Halloumi cheese samples by the chemometric analysis of Fourier transform infrared spectroscopy and proton nuclear magnetic resonance spectra. J. Food Process Eng. 2022, 45, e13933. [Google Scholar] [CrossRef]
  7. Tarapoulouzi, M.; Theocharis, C.R. Discrimination of Cheddar and Kefalotyri cheese samples: Analysis by chemometrics of proton-NMR and FTIR spectra. J. Agric. Sci. Technol. 2019, 9, 347–355. [Google Scholar] [CrossRef]
  8. Tzamaloukas, O.; Neofytou, M.C.; Simitzis, P.E.; Miltiadou, D. Effect of Farming System (Organic vs. Conventional) and Season on Composition and Fatty Acid Profile of Bovine, Caprine and Ovine Milk and Retail Halloumi Cheese Produced in Cyprus. Foods 2021, 10, 1016. [Google Scholar] [CrossRef]
  9. Osorio, M.T.; Koidis, A.; Papademas, P. Major and trace elements in milk and Halloumi cheese as markers for authentication of goat feeding regimes and geographical origin. Int. J. Dairy Technol. 2015, 68, 573–581. [Google Scholar] [CrossRef]
  10. Papademas, P.; Robinson, R.K. Some volatile plant compounds in Halloumi cheeses made from ovine or bovine milk. LWT-Food Sci. Technol. 2002, 35, 512–516. [Google Scholar] [CrossRef]
  11. Papademas, P.; Robinson, R.K. A comparison of the chemical, microbiological and sensory characteristics of bovine and ovine Halloumi cheese. Int. Dairy J. 2000, 10, 761–768. [Google Scholar] [CrossRef]
  12. Kaminarides, S.; Litos, I.; Massouras, T.; Georgala, A. The effect of cooking time on curd composition and textural properties of sheep Halloumi cheese. Small Rumin. Res. 2015, 125, 106–114. [Google Scholar] [CrossRef]
  13. Kaminarides, S.; Stamou, P.; Massouras, T. Changes of organic acids, volatile aroma compounds and sensory characteristics of Halloumi cheese kept in brine. Food Chem. 2007, 100, 219–225. [Google Scholar] [CrossRef]
  14. Kaminarides, S. Comparison of two methods of making reduced-fat ovine Halloumi type cheese. J. Hell. Vet. Med. Soc. 2018, 69, 1125–1134. [Google Scholar] [CrossRef]
  15. Theophilou, P.; Wilbey, R.A. Effects of fat on the properties of halloumi cheese. Int. J. Dairy Technol. 2007, 60, 1–4. [Google Scholar] [CrossRef]
  16. Kaminarides, S.; Rogoti, E.; Mallatou, H. Comparison of the characteristics of halloumi cheese made from ovine milk, caprine milk or mixtures of these milks. Int. J. Dairy Technol. 2000, 53, 100–105. [Google Scholar] [CrossRef]
  17. Pellegrino, L.; Cattaneo, S.; Masotti, F.; Psathas, G. Detection of milk powder and caseinates in Halloumi cheese. J. Dairy Sci. 2010, 93, 3453–3460. [Google Scholar] [CrossRef]
  18. Moatsou, G.; Hatzinaki, A.; Psathas, G.; Anifantakis, E. Detection of caprine casein in ovine Halloumi cheese. Int. Dairy J. 2004, 14, 219–226. [Google Scholar] [CrossRef]
  19. Ricciardi, F.E.; Plazzotta, S.; Conte, A.; Manzocco, L. Effect of pulsed light on microbial inactivation, sensory properties and protein structure of fresh ricotta cheese. LWT 2021, 139, 110556. [Google Scholar] [CrossRef]
  20. Silva, L.K.; Santos, L.S.; Ferrão, S.P. Application of infrared spectroscopic techniques to cheese authentication: A review. Int. J. Dairy Technol. 2022, 75, 490–512. [Google Scholar] [CrossRef]
  21. Ayvaz, H.; Mortas, M.; Dogan, M.A.; Atan, M.; Yildiz Tiryaki, G.; Karagul Yuceer, Y. Near-and mid-infrared determination of some quality parameters of cheese manufactured from the mixture of different milk species. J. Food Sci. Technol. 2021, 58, 3981–3992. [Google Scholar] [CrossRef]
  22. Ozturk, M.; Dogan, M.A.; Menevseoglu, A.; Ayvaz, H. Infrared spectroscopy combined with chemometrics as a convenient method to detect adulterations in cooking/stretching process in commercial cheese. Int. Dairy J. 2022, 128, 105312. [Google Scholar] [CrossRef]
  23. Tolentino, I.C.d.S.A.; de Jesus, J.C.; Conceição, D.G.; Onelli, R.R.V.; Reis, L.C.C.; Santos, L.S.; Ferrão, S.P.B. Use of MIR spectroscopy associated with chemometric techniques to verify the authenticity of prato cheese. Int. Dairy J. 2023, 142, 105643. [Google Scholar] [CrossRef]
  24. Tsagkaris, A.S.; Kalogiouri, N.; Hrbek, V.; Hajslova, J. Spelt authenticity assessment using a rapid and simple Fourier transform infrared spectroscopy (FTIR) method combined to advanced chemometrics. Eur. Food Res. Technol. 2023, 249, 441–450. [Google Scholar] [CrossRef]
  25. Yaman, H.; Aykas, D.P.; Rodriguez-Saona, L.E. Monitoring Turkish white cheese ripening by portable FT-IR spectroscopy. Front. Nutr. 2023, 10, 126. [Google Scholar] [CrossRef] [PubMed]
  26. Tarapoulouzi, M.; Mironescu, M.; Drouza, C.; Mironescu, I.D.; Agriopoulou, S. Insight into the Recent Application of Chemometrics in Quality Analysis and Characterization of Bee Honey during Processing and Storage. Foods 2023, 12, 473. [Google Scholar] [CrossRef] [PubMed]
  27. Kaminarides, S.; Aktypis, A.; Koronios, G.; Massouras, T.; Papanikolaou, S. Effect of ‘in situ’produced bacteriocin thermophilin T on the microbiological and physicochemical characteristics of Myzithra whey cheese. Int. J. Dairy Technol. 2018, 71, 213–222. [Google Scholar] [CrossRef]
Figure 1. FTIR spectra of representative samples of Anari cheese database regarding species’ origin. Red arrows show the most important difference in relative peak intensities.
Analytica 04 00027 g001
Figure 2. OPLS-DA score scatter plot (t2/t1) from modelling of Anari cheese and Halloumi cheese samples, regarding species’ origin, where 1 = Goat and Sheep origin Anari (GSA), (2 = does not exist), 3 = Cow origin Anari (CA), 4 = Goat and Sheep origin Halloumi (GSH) and 5 = Cow origin Halloumi (CH) cheese samples.
Analytica 04 00027 g002
Figure 3. 3D score scatter plot (t2/t1/Num) for the OPLS-DA model, where green = Goat and Sheep origin Anari (GSA), (2 = does not exist), red = Cow origin Anari (CA), yellow = Goat and Sheep origin Halloumi (GSH) and blue = Cow origin Halloumi (CH) cheese samples.
Analytica 04 00027 g003
Figure 4. Random permutation test with 100 permutations for the OPLS-DA model.
Analytica 04 00027 g004
Figure 5. (a) Training set; (b) test set, where 1 = Goat and Sheep origin Anari (GSA), 3 = Cow origin Anari (CA), 4 = Goat and Sheep origin Halloumi (GSH) and 5 = Cow origin Halloumi (CH) cheese samples.
Analytica 04 00027 g005
Table 2. Misclassification table from OPLS-DA modelling, where 1 = Goat and Sheep origin Anari (GSA), (2 = does not exist), 3 = Cow origin Anari (CA), 4 = Goat and Sheep origin Halloumi (GSH) and 5 = Cow origin Halloumi (CH) cheese samples.
MembersCorrect1—GSA3—CA4—GSH5—CH
1—GSA1492.86%13010
3—CA12100%01200
4—GSH1190.91%10100
5—CH7100%0007
Total4495.45%1412117
Fisher’s prob.5.3 × 10−19
Disclaimer/Publisher’s Note: The statements, opinions and data contained in all publications are solely those of the individual author(s) and contributor(s) and not of MDPI and/or the editor(s). MDPI and/or the editor(s) disclaim responsibility for any injury to people or property resulting from any ideas, methods, instructions or products referred to in the content.

