Article

Compatibility Study between Fenbendazole and Polymeric Excipients Used in Pharmaceutical Dosage Forms Using Thermal and Non-Thermal Analytical Techniques

by
Gilberto S. N. Bezerra
*,
Vicente F. Moritz
,
Tielidy A. de M. de Lima
,
Declan M. Colbert
,
Joseph Geever
and
Luke Geever
*
PRISM Research Institute, Technological University of the Shannon: Midlands Midwest, University Road, N37HD68 Athlone, Ireland
*
Authors to whom correspondence should be addressed.
Analytica 2022, 3(4), 448-461; https://doi.org/10.3390/analytica3040031
Submission received: 25 October 2022 / Revised: 29 November 2022 / Accepted: 7 December 2022 / Published: 12 December 2022
(This article belongs to the Special Issue New Analytical Techniques and Methods in Pharmaceutical Science)

Abstract

:
The body of work described in this research paper evaluates the compatibility between Fenbendazole (Fen), which is a broad-spectrum anthelmintic with promising antitumor activity, and three polymeric excipients commonly applied in pharmaceutical dosage forms. The assessment of binary mixtures was performed by differential scanning calorimetry and thermogravimetric analysis/derivative thermogravimetry to predict physical and/or chemical interactions, followed by X-ray diffraction spectroscopy (XRD), Fourier transform infrared spectroscopy (FTIR), and high-performance liquid chromatography (HPLC) to confirm or exclude any interactions. Thermal studies suggested the presence of interactions between Fen and P 407, PCL, and PLA. To validate these data, XRD showed that Fen is compatible with PCL and PLA, suggesting some interaction with P 407. FTIR demonstrated that PCL and PLA can establish physical interactions with Fen; moreover, it suggested that P 407 interacts not only physically but also chemically, which was later proved by HPLC to be only new intermolecular interactions. This work supports the further application of P 407, PCL, and PLA for the development of new medicinal and veterinary formulations containing Fen, since they do not affect the physical and chemical characteristics of the active ingredient and consequently its bioavailability and therapeutic efficacy.

1. Introduction

Methyl N-(6-phenylsulfanyl-1H-benzimidazol-2-yl)carbamate or Fenbendazole (Fen) is a member of the benzimidazole family [1]. Fen has a broad spectrum of activities including antiparasitic [2], fungicidal [3], antiviral [4], and, particularly, antitumor [5], demonstrating a promising effect against different types of cancer, such as skin [6], prostate [7], and kidney [8], with potential application in medicinal and veterinary formulations.
Pharmaceutical dosage forms consist of APIs (active pharmaceutical ingredients) and suitable excipients, which must be pharmacologically inert, physically and chemically compatible, non-toxic, and not affect the drug’s bioavailability [9]. Hence, the first step for the development of a pharmaceutical formulation should be a preformulation study, which predicts possible incompatibilities between the API and excipients, investigating potential physical and chemical interactions that can compromise the stability, safety, and efficacy of the final product [10]. Furthermore, the U.S. Food and Drug Administration has launched new regulations establishing drug-excipient compatibility studies as vital for the approval of new formulations [11].
Based on the variety of polymers available and under development, the screening and selection of polymers compatible with the API can be challenging. Therefore, new, fast and reliable analytical techniques are required to identify suitable polymeric excipients for a new formulation as they play roles such as binders, lubricants, suspending, fillers, solubility enhancers, and stabilizing agents, among other functions [12].
The assessment of binary mixtures using thermoanalytical techniques to predict physical and/or chemical interactions between the API and excipients has been extensively reported [10,13,14,15]. Differential scanning calorimetry (DSC) and thermogravimetric analysis (TGA) have been the most applied techniques for this purpose. Even though the association of data collected from two thermal techniques such as DSC and TGA enables better characterisation of the events related to a sample, this interpretation must be supported by other analytical techniques, such as X-ray diffraction spectroscopy (XRD), Fourier transformed infrared spectroscopy (FTIR), and high-performance liquid chromatography (HPLC). These techniques have been widely applied to confirm or exclude the events suggested by thermal studies [10,13,14,15,16,17,18,19].
Moreover, the application of analytical techniques to quickly and efficiently predict incompatibilities between the API and excipients have a direct impact on the pharmaceutical research and development sectors, avoiding trial and error, preventing raw material wastage, reducing the time required for the development of new formulations, and, consequently, decreasing costs [20]. Shakar et al. [19] during the development of a solid dosage form found a low dissolution profile to bisoprolol fumarate and suspected there was some chemical interaction between the API and the disintegrating agents. After HPLC and DSC analysis, they identified that bisoprolol is incompatible with sodium starch glycolate and croscarmellose sodium, which could have been predicted if a prior compatibility study was performed.
To the best of our knowledge, there are very few studies predicting physical and/or chemical interactions between Fen and polymeric excipients commonly applied in pharmaceutical dosage forms [17,21]. Therefore, this work aims to study the compatibility between Fen and three polymeric excipients widely applied in drug delivery, namely P 407, PCL, and PLA, using thermal (DSC and TGA/DTG), spectroscopic (XRD and FTIR), and chromatographic (HPLC) techniques. This work is expected to guide the development of new medicinal and veterinary formulations, mainly generic ones, for those in which a careful selection of excipients is required.

2. Materials and Methods

2.1. Materials

Fen was purchased from Molekula (Darlington, UK), Tri-block copolymer of poly(ethylene oxide)-poly(propylene oxide)-poly(ethylene oxide) (Kolliphor® P 407 Geismar—P 407, Mw 12,000 g mol−1) was obtained from BASF (Burgbernheim, Germany), Polycaprolactone (CAPA® 6506—PCL, Mw 50,000 g mol−1) was supplied by Perstorp (Warrington, UK), and Poly(lactic acid) (Ingeo® 2003D—PLA, Mw 180,477 g mol−1) was purchased from NatureWorks (Minnetonka, MN, USA). All other chemicals and reagents were of analytical reagent grade. The chemical structures of Fen and the polymeric excipients used in this study are shown in Figure 1.

2.2. Binary Mixtures

Binary mixtures between Fen and each polymeric excipient were prepared in a 1:1 (w/w) ratio with the components mixed using a pestle and mortar. This ratio was chosen to maximize the probability of observing potential interactions [22].

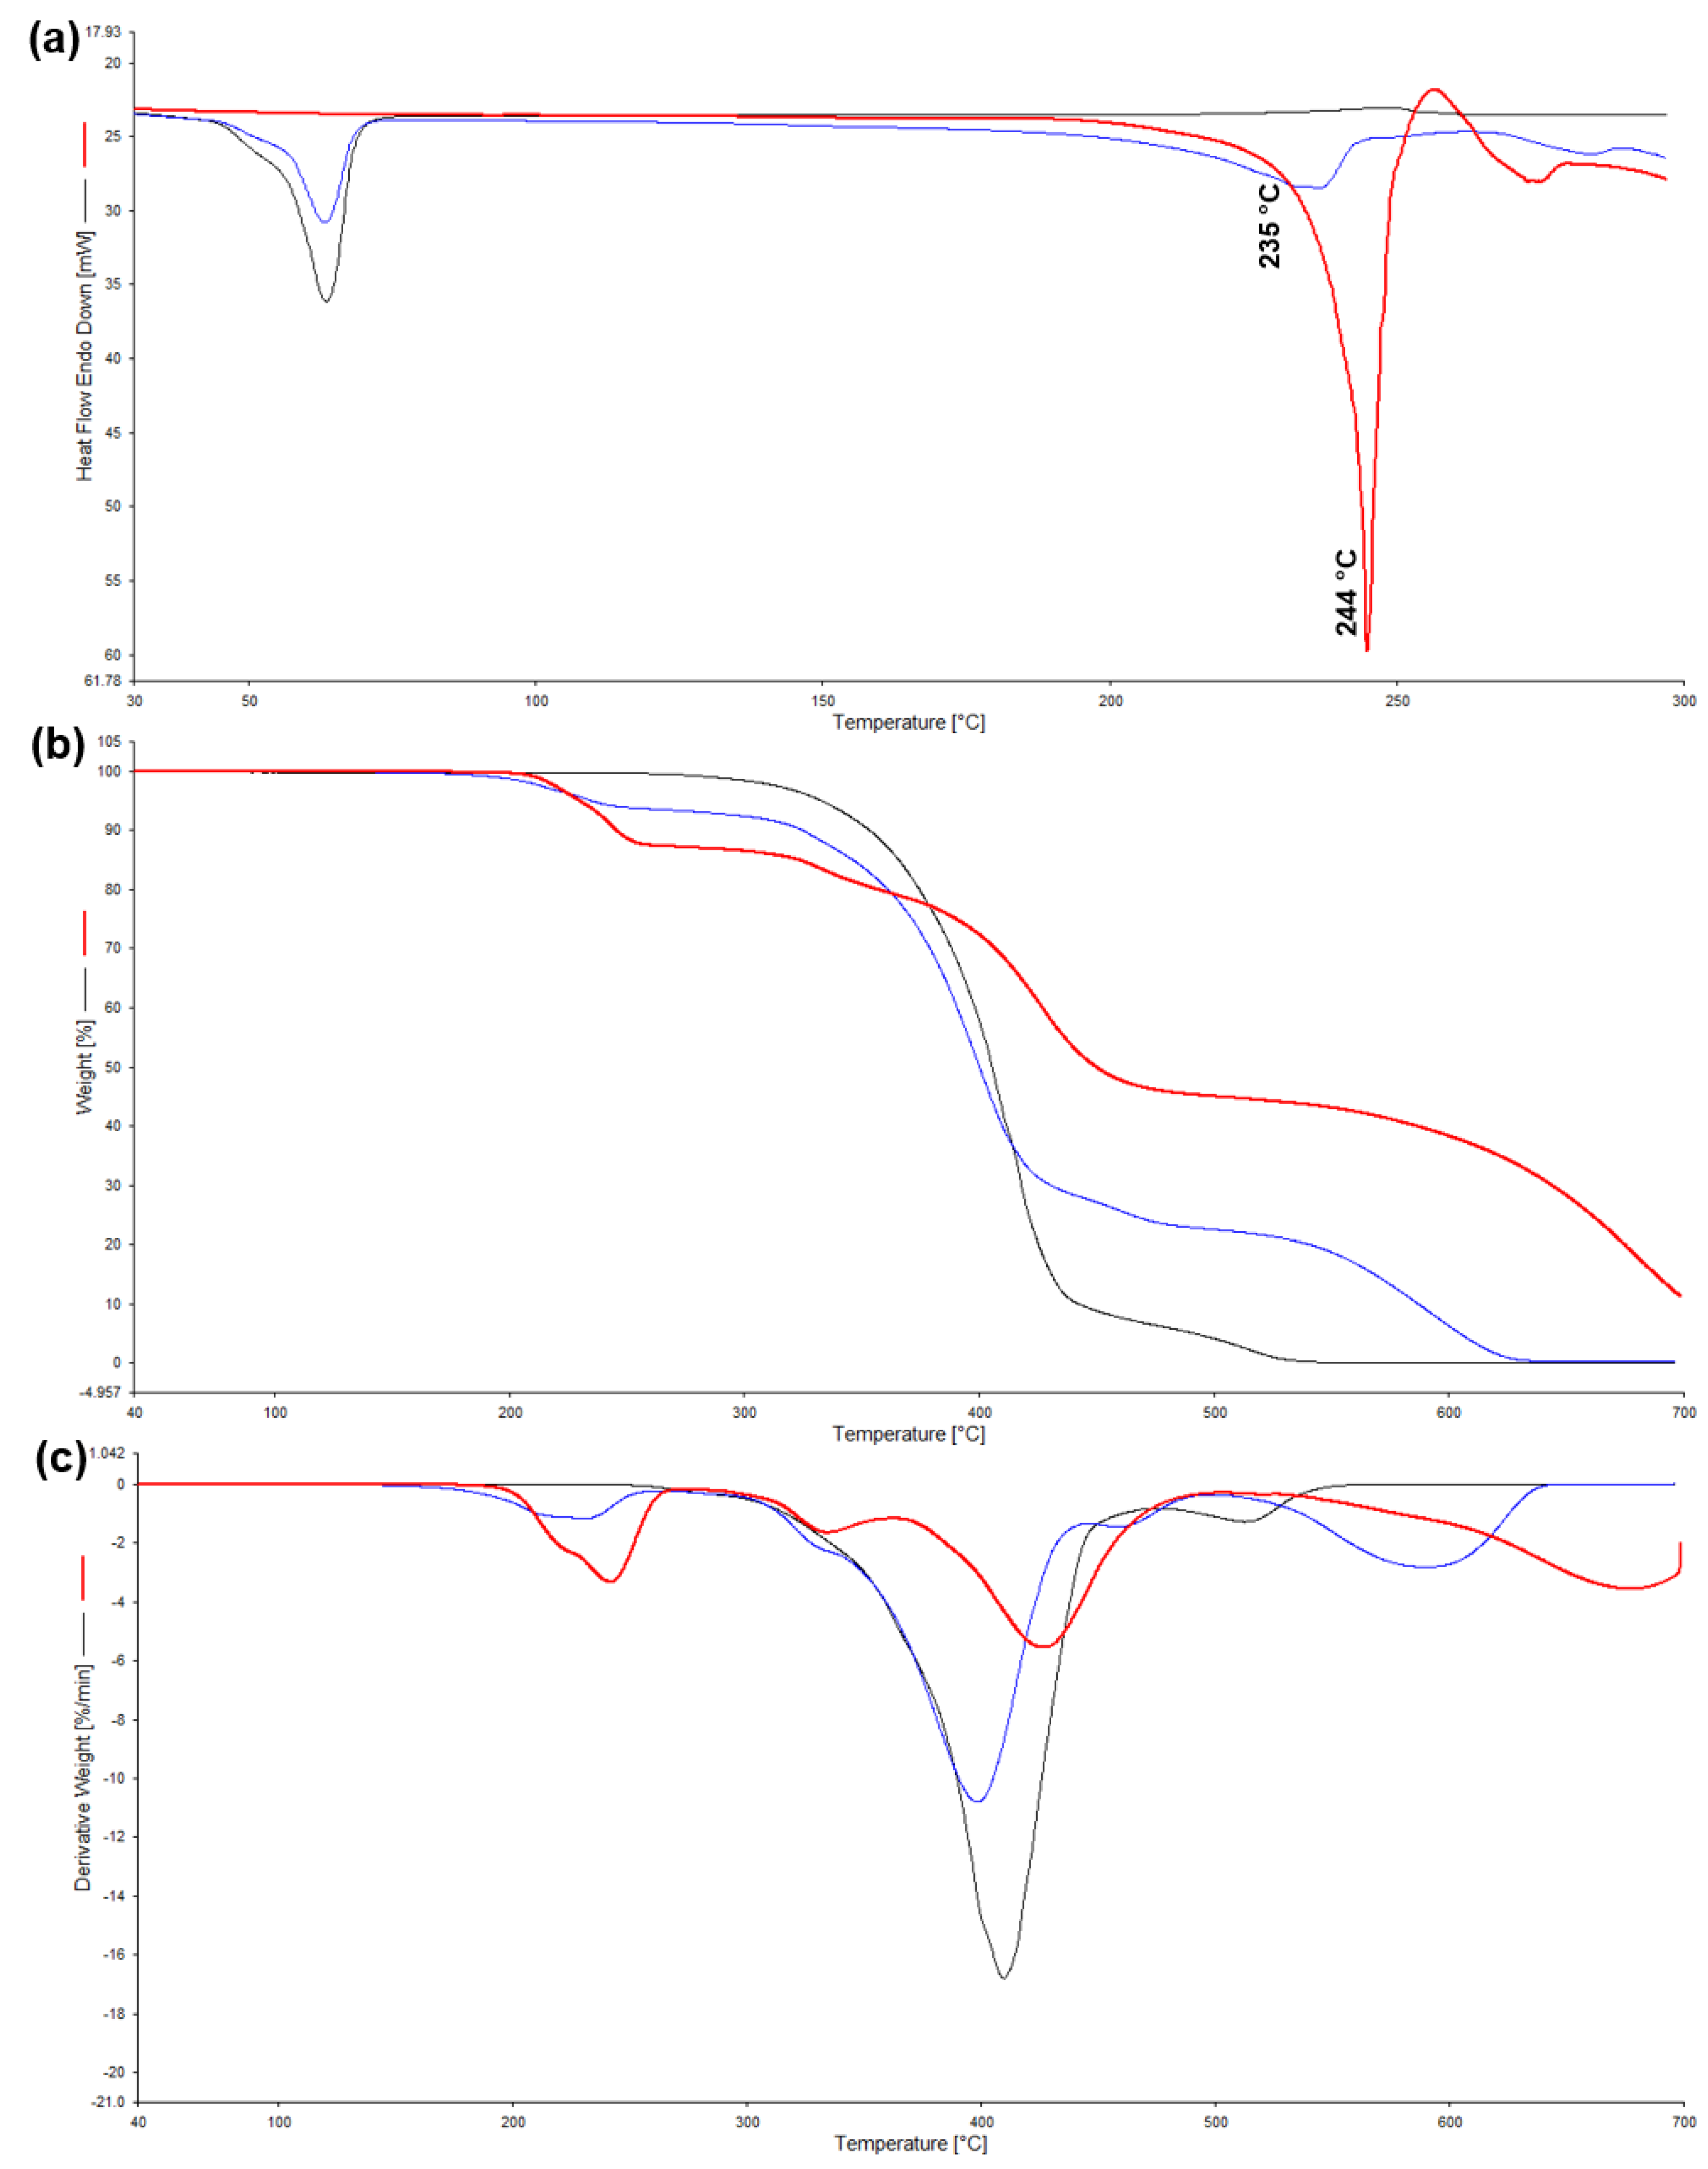
2.3. Thermal Analyses—DSC and TGA/DTG

DSC curves were obtained using a Pyris 6 DSC (PerkinElmer, Waltham, MA, USA). Fen thermal characterisation was performed in triplicate using between 6 and 8 mg of the sample in lid-sealed aluminium pans, under a nitrogen atmosphere with a flow of 30 mL min−1 and a heating rate of 10 °C min−1 from 40 to 300 °C. Calorimetric curves of neat polymers and binary mixtures were performed using between 6 and 8 mg of the sample in lid-sealed aluminium pans, under a nitrogen atmosphere with a flow of 30 mL min−1 and a heating rate of 10 °C min−1 from 30 to 300 °C.
TGA curves were obtained using a Pyris 1 TGA (PerkinElmer, Waltham, MA, USA). Fen was analysed in triplicate using 10 mg of the sample in aluminium pans, under a nitrogen atmosphere with a flow of 20 mL min−1 and a heating rate of 10 °C min−1 from 40 to 700 °C. Thermogravimetric curves of neat polymers and binary mixtures were performed using 10 mg of the sample in aluminium pans, under a nitrogen atmosphere with a flow of 20 mL min−1 and a heating rate of 10 °C min−1 from 40 to 700 °C.
DSC and TGA/DTG measurements were performed using Pyris—Instrument Managing Software (PerkinElmer, Waltham, MA, USA).

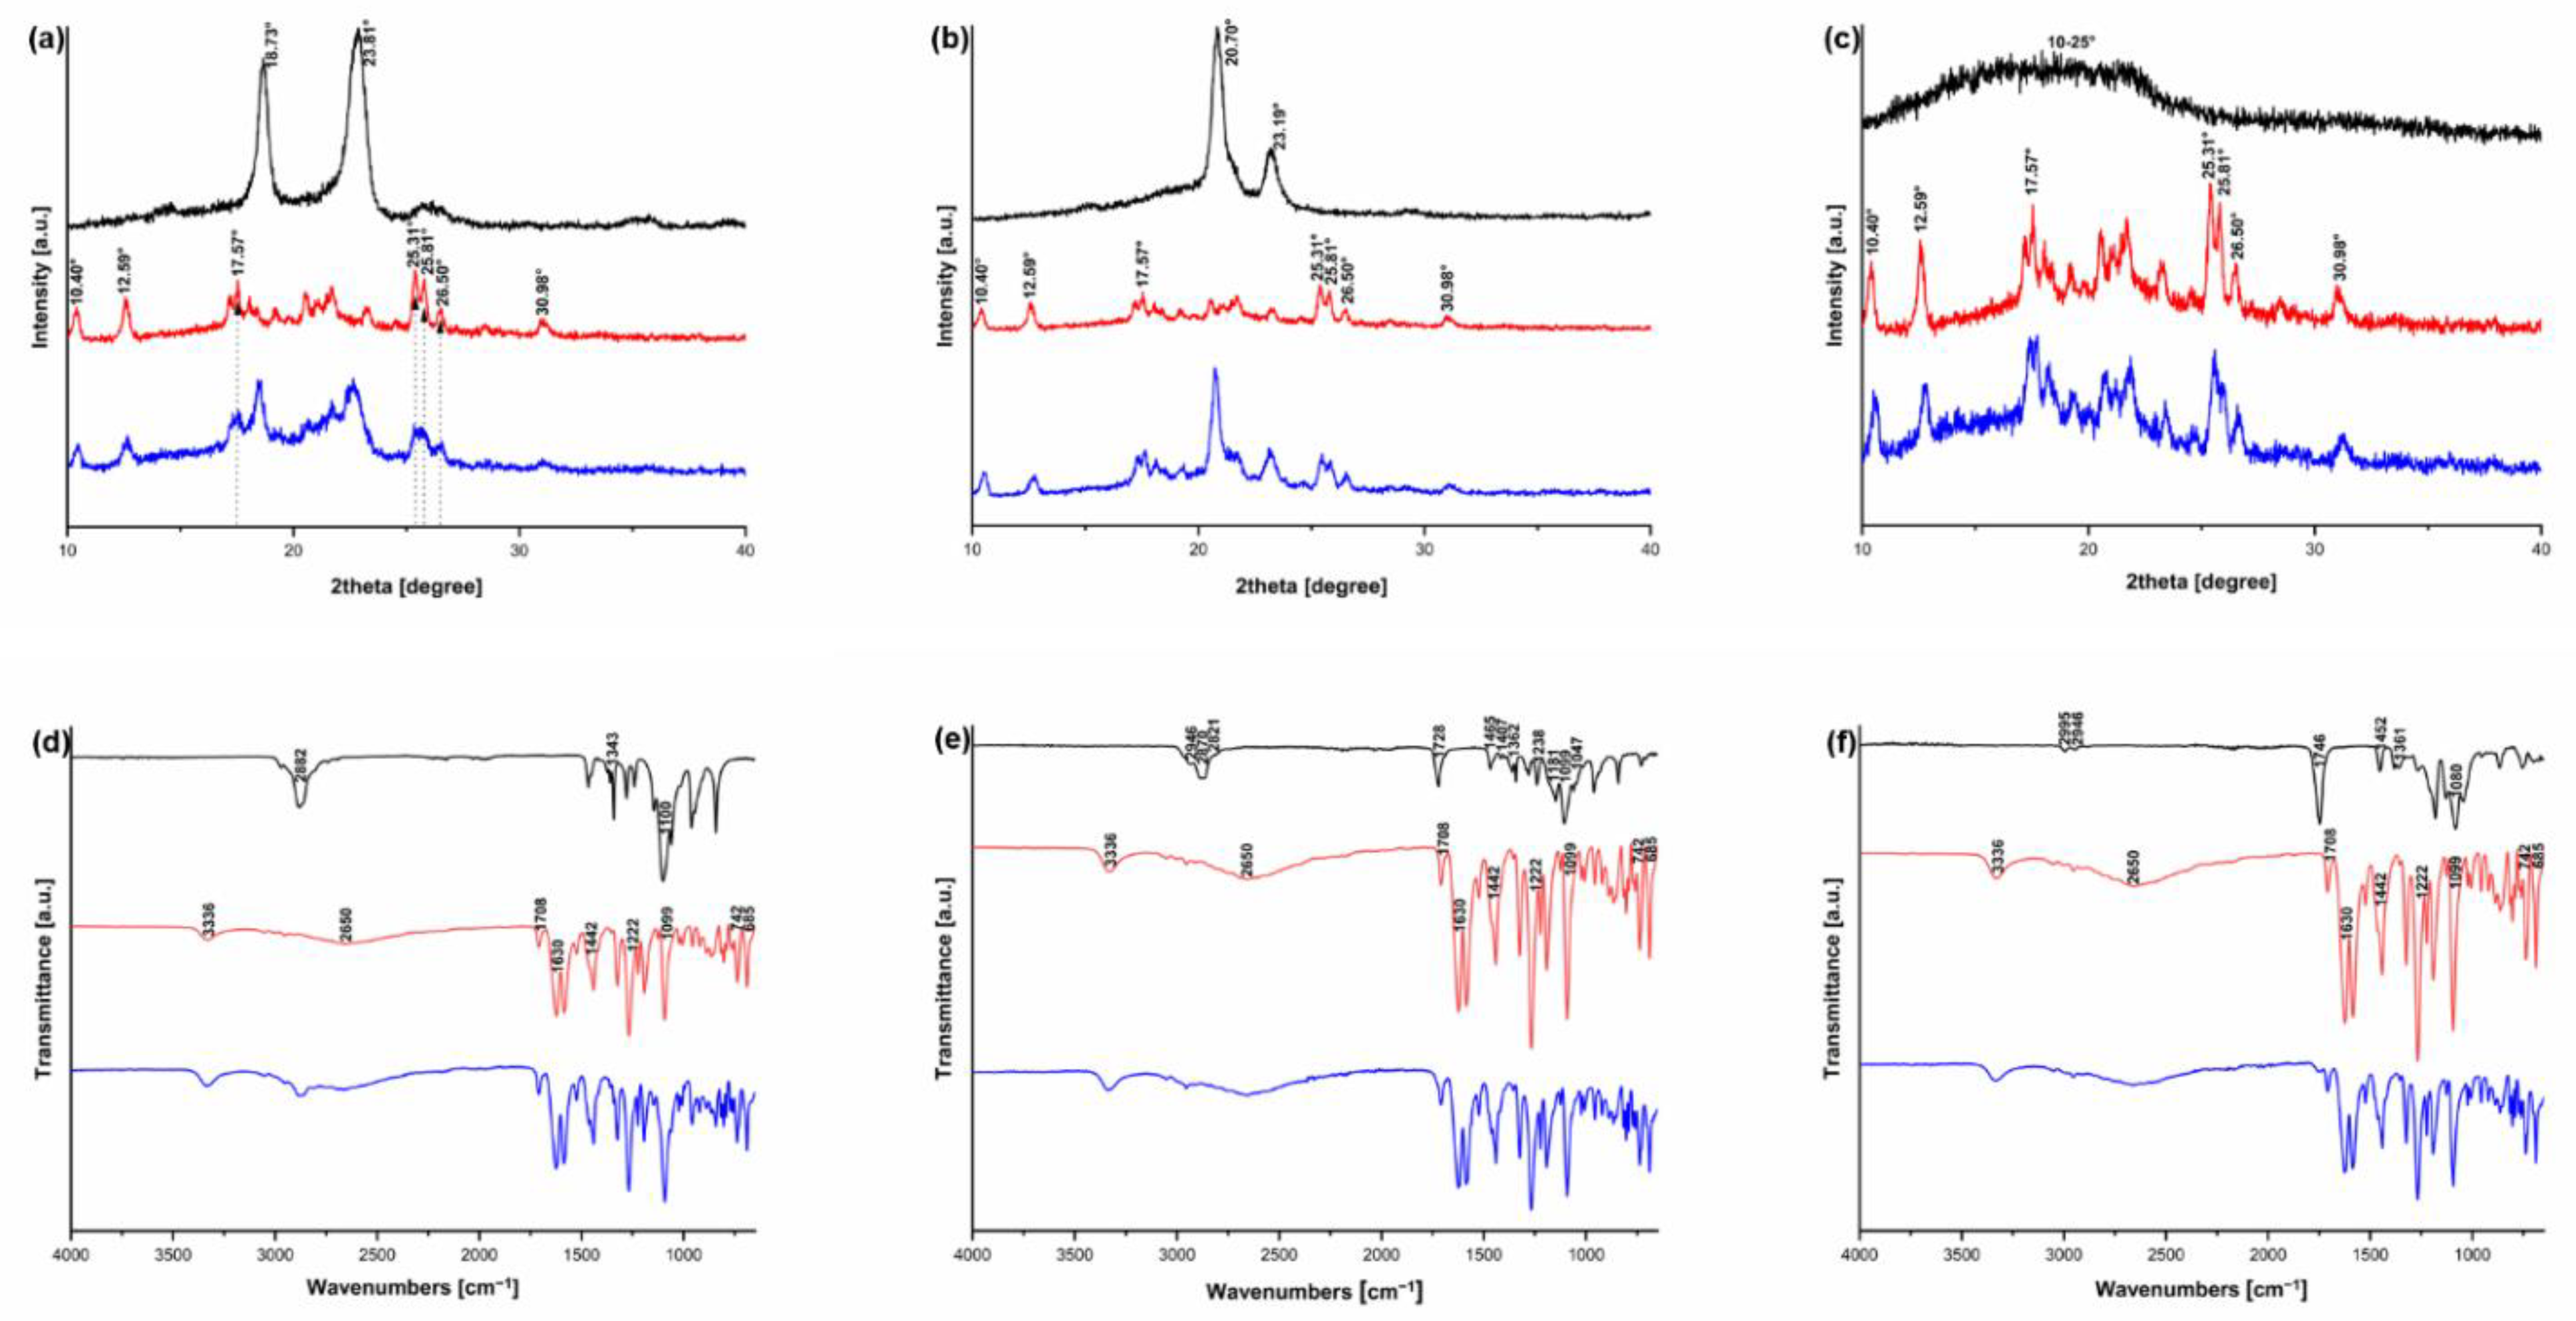
2.4. X-ray Diffraction Spectroscopy

Diffractograms were obtained using a Siemens D500 X-ray powder diffractometer (Karlsruhe, Germany) with Cu radiation (λ = 0.15418 nm). The 2θ (theta) range applied for the test was 10° to 80°.

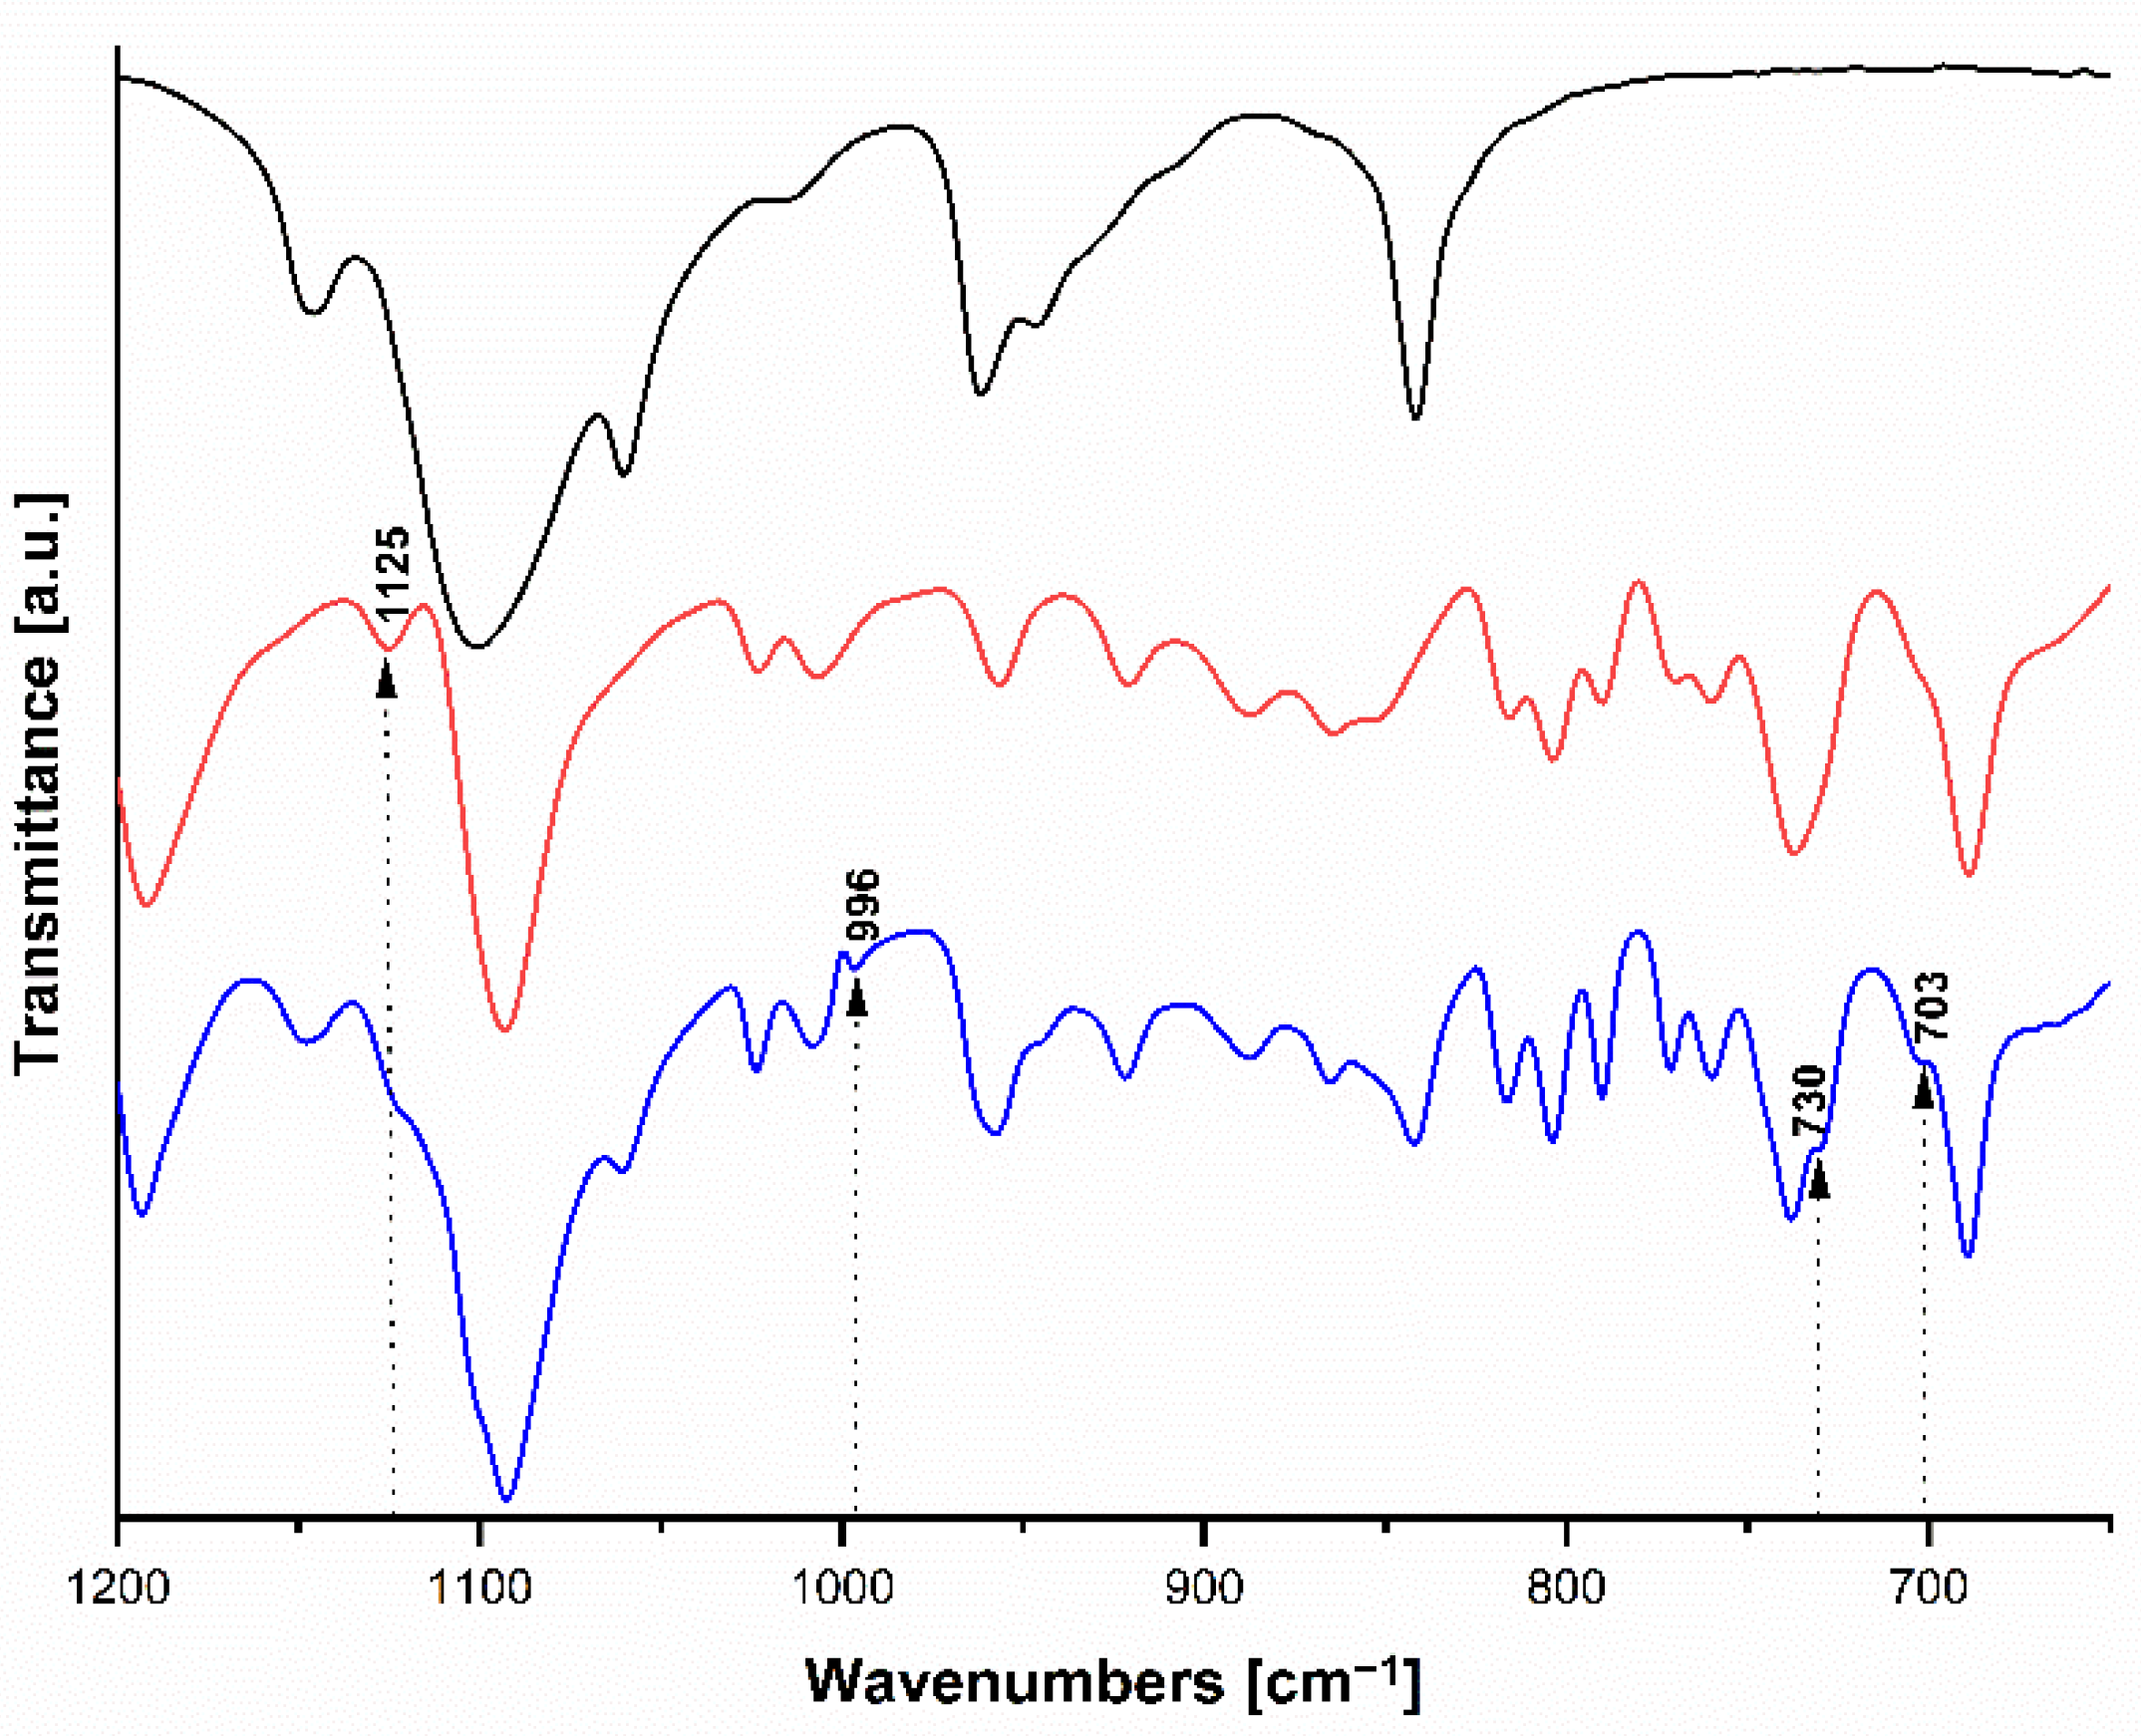
2.5. Fourier Transform Infrared Spectroscopy

Attenuated total reflectance Fourier transform infrared spectroscopy (ATR-FTIR) of the samples was carried out on a Perkin Elmer Spectrum (Waltham, MA, USA), with 4 scans per sample, in the spectral range from 650 to 4000 cm−1, and a fixed universal compression force of 85 N.

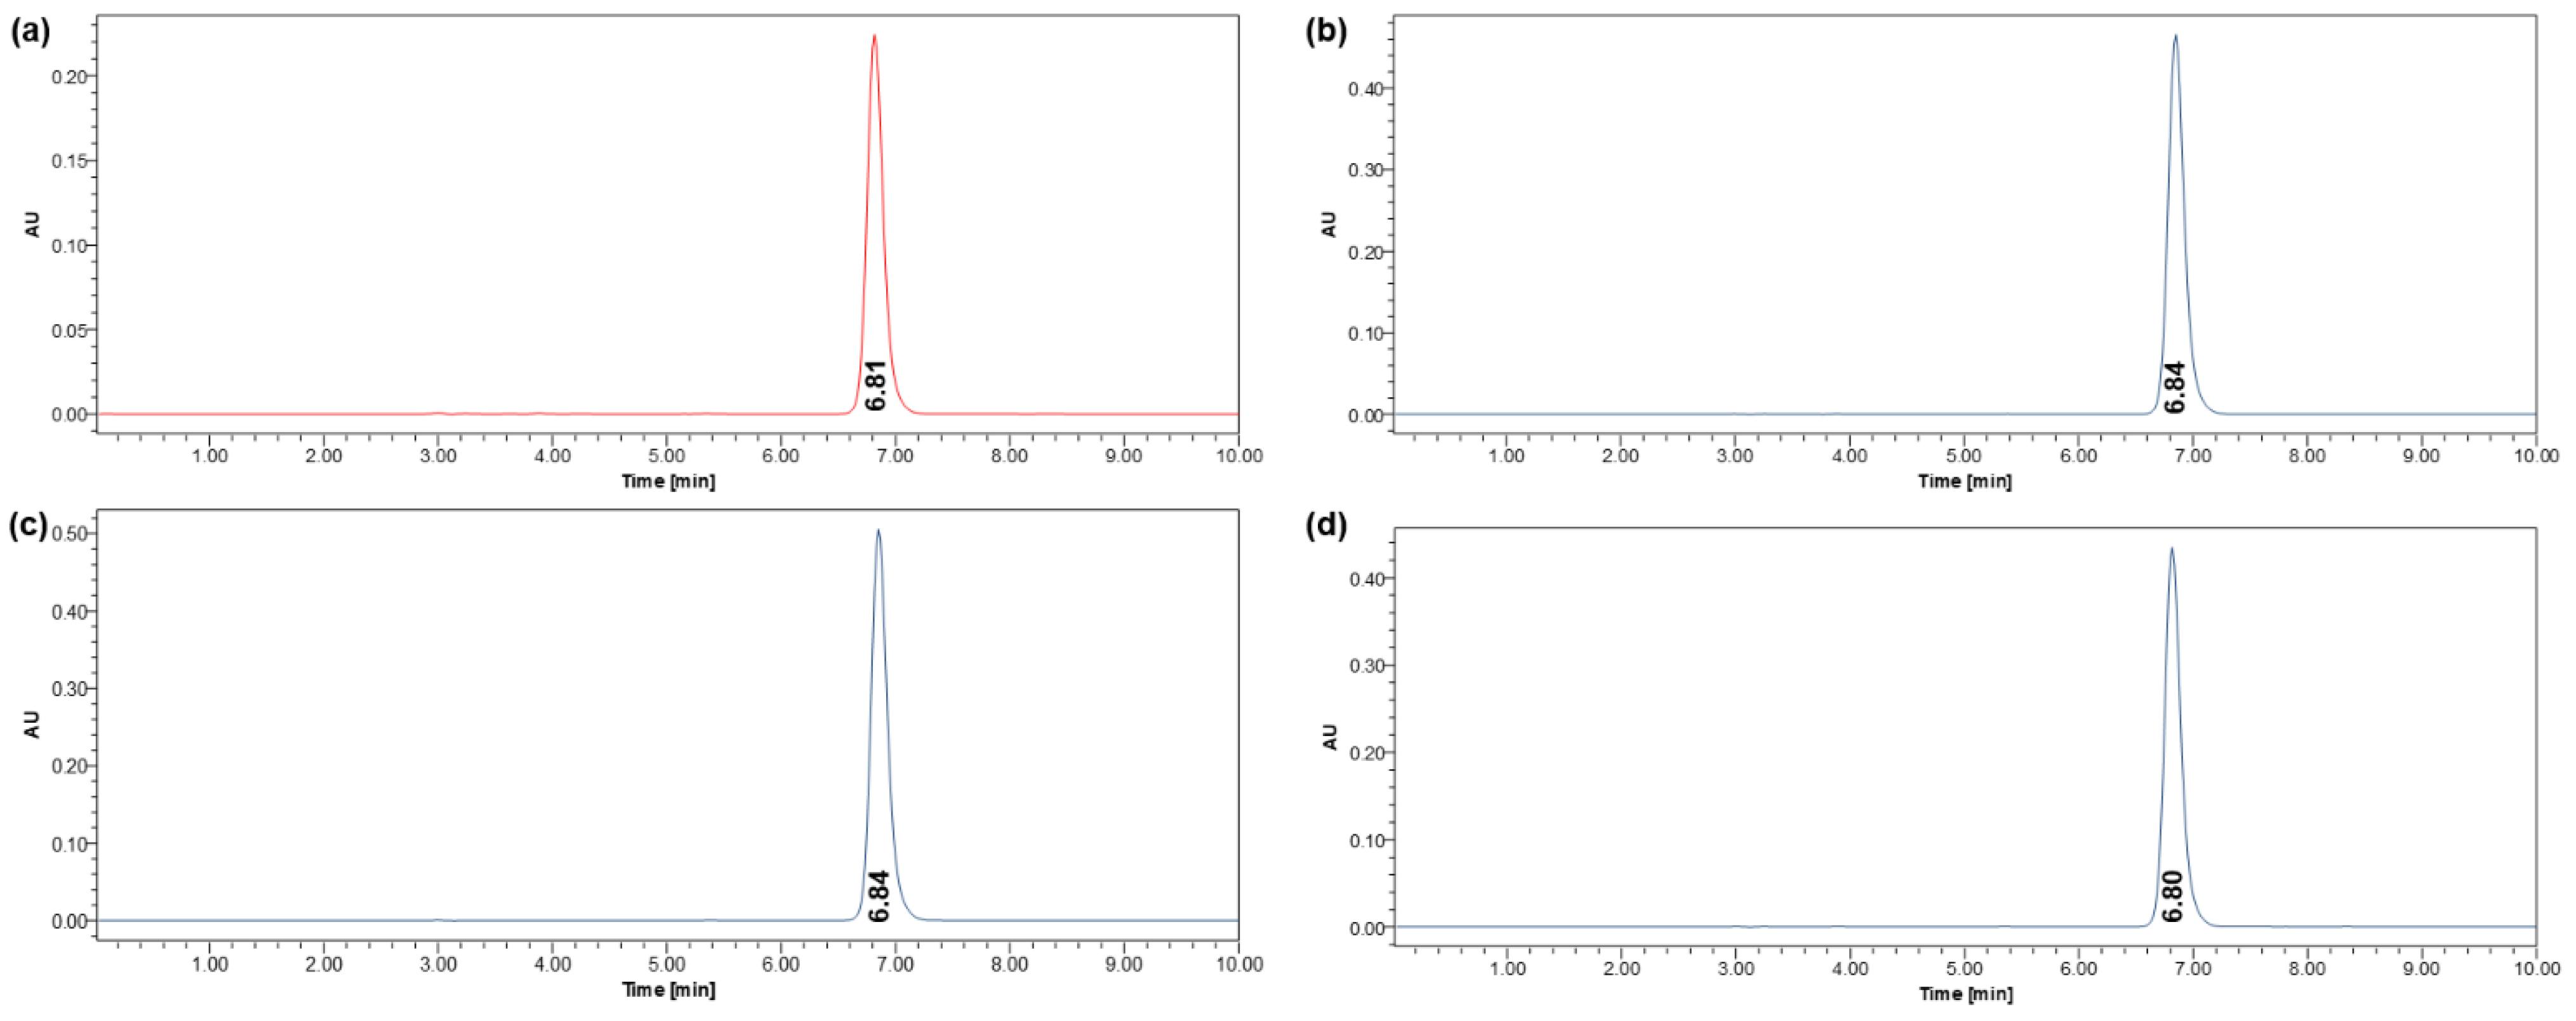
2.6. High-Performance Liquid Chromatography

HPLC analysis was carried out using a system consisting of a Waters Alliance e2695 separations module combined with a Waters 2487 dual λ absorbance detector (Waters Chromatography Ireland Ltd., Dublin, Ireland). The chromatographic analyses of neat Fen and binary mixtures were performed using the protocol published by Ali et al. [23] with minor modifications. A Thermo Scientific®BDS Hypersil C8 column (250 mm × 4.60 mm, 5 µm) (Fisher Scientific Ireland Ltd., Dublin, Ireland) maintained at ambient temperature was used as the stationary phase. The mobile phase consisted of methanol and 0.025 M monopotassium phosphate (70:30 v/v) adjusted to pH 3.20 using ortho-phosphoric acid, filtered, and degassed. A flow rate of 1 mL min−1 was maintained during the procedure, the detector was set at 288 nm, and the sample injection volume was 10 µL. Further analyses were performed using Empower software.

3. Results

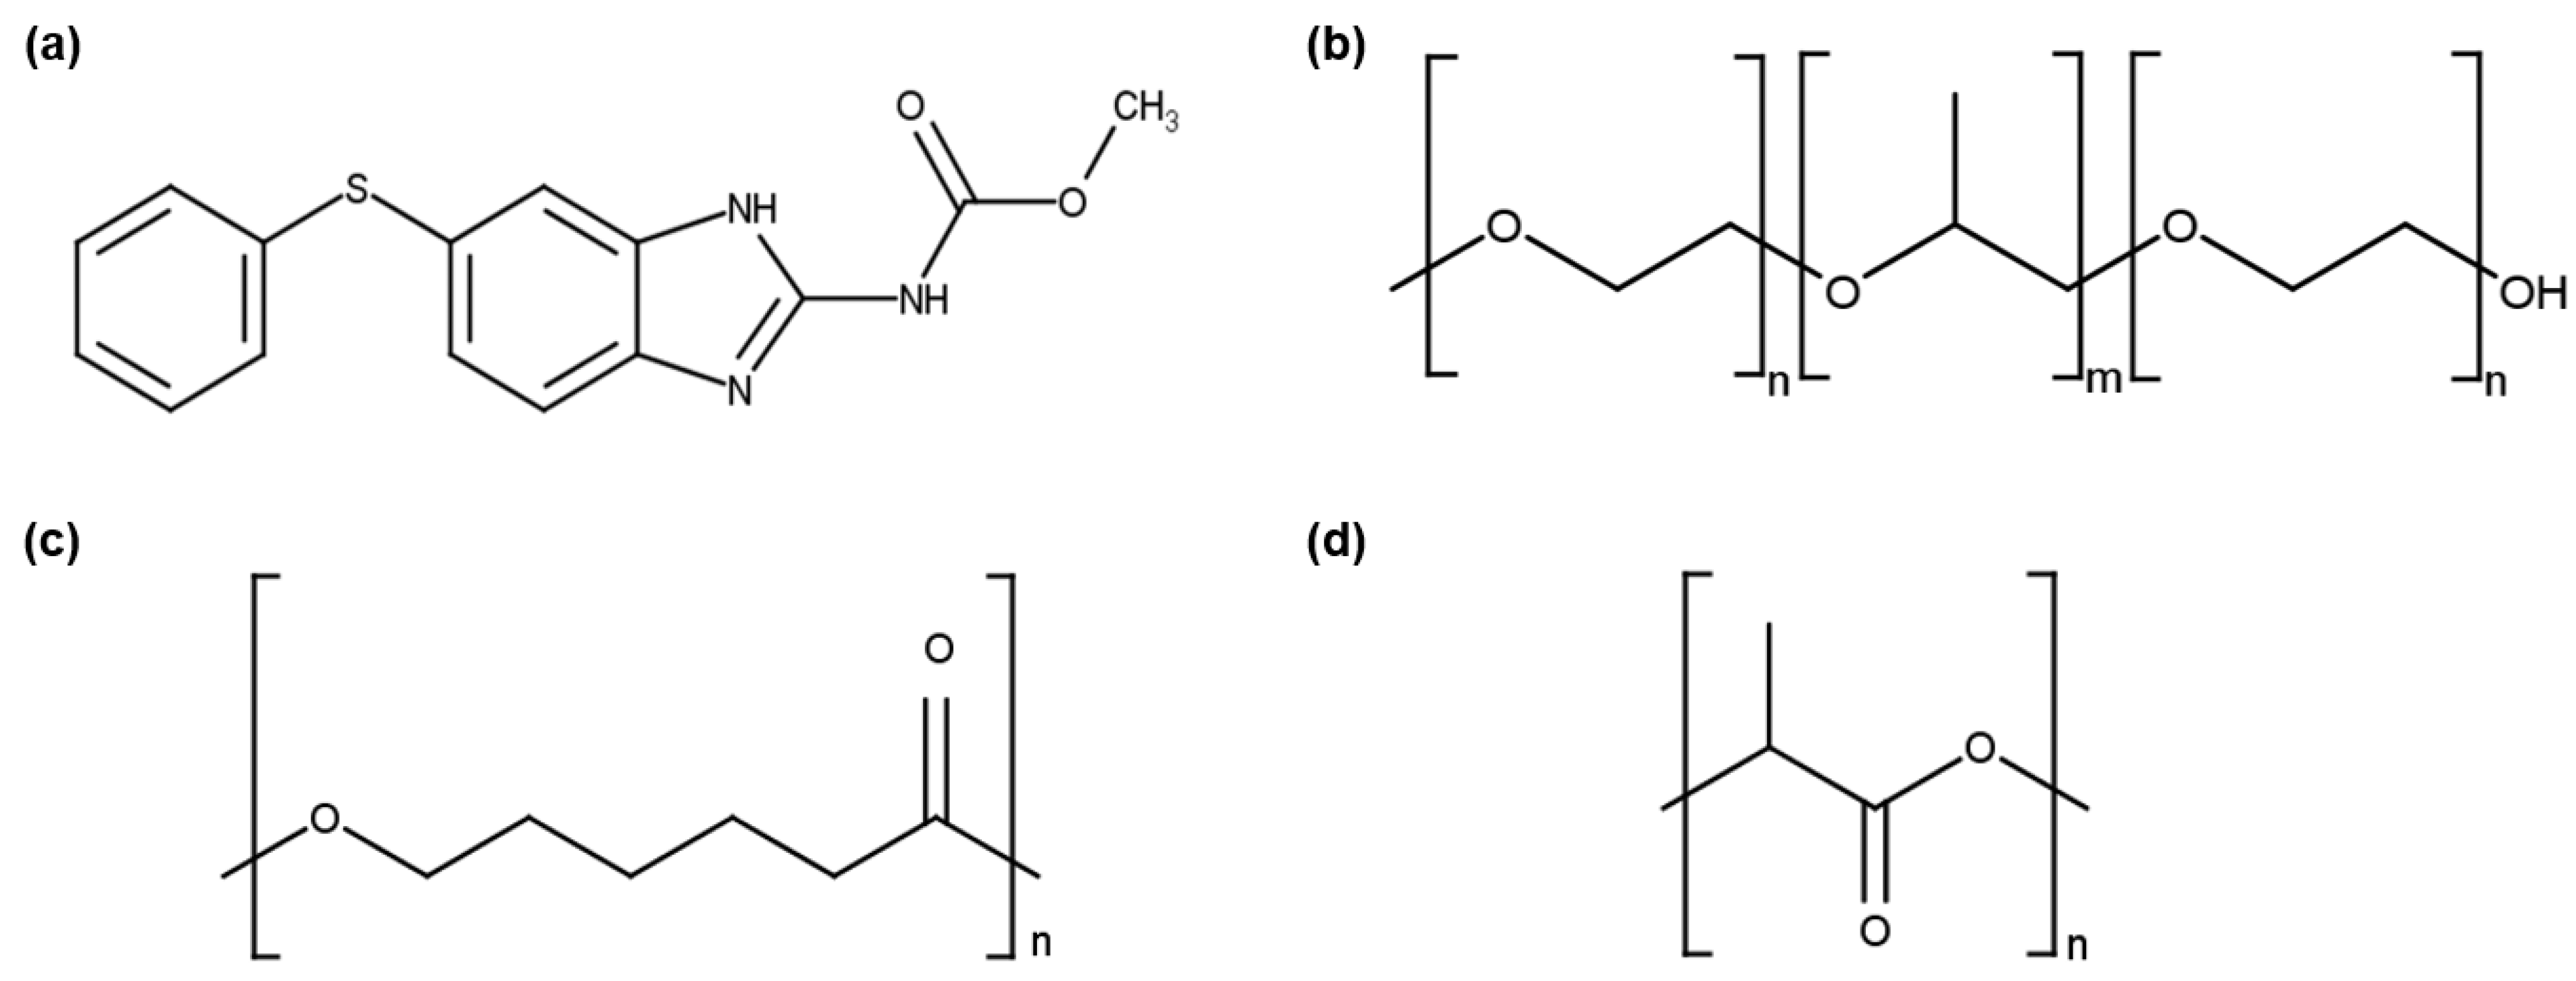
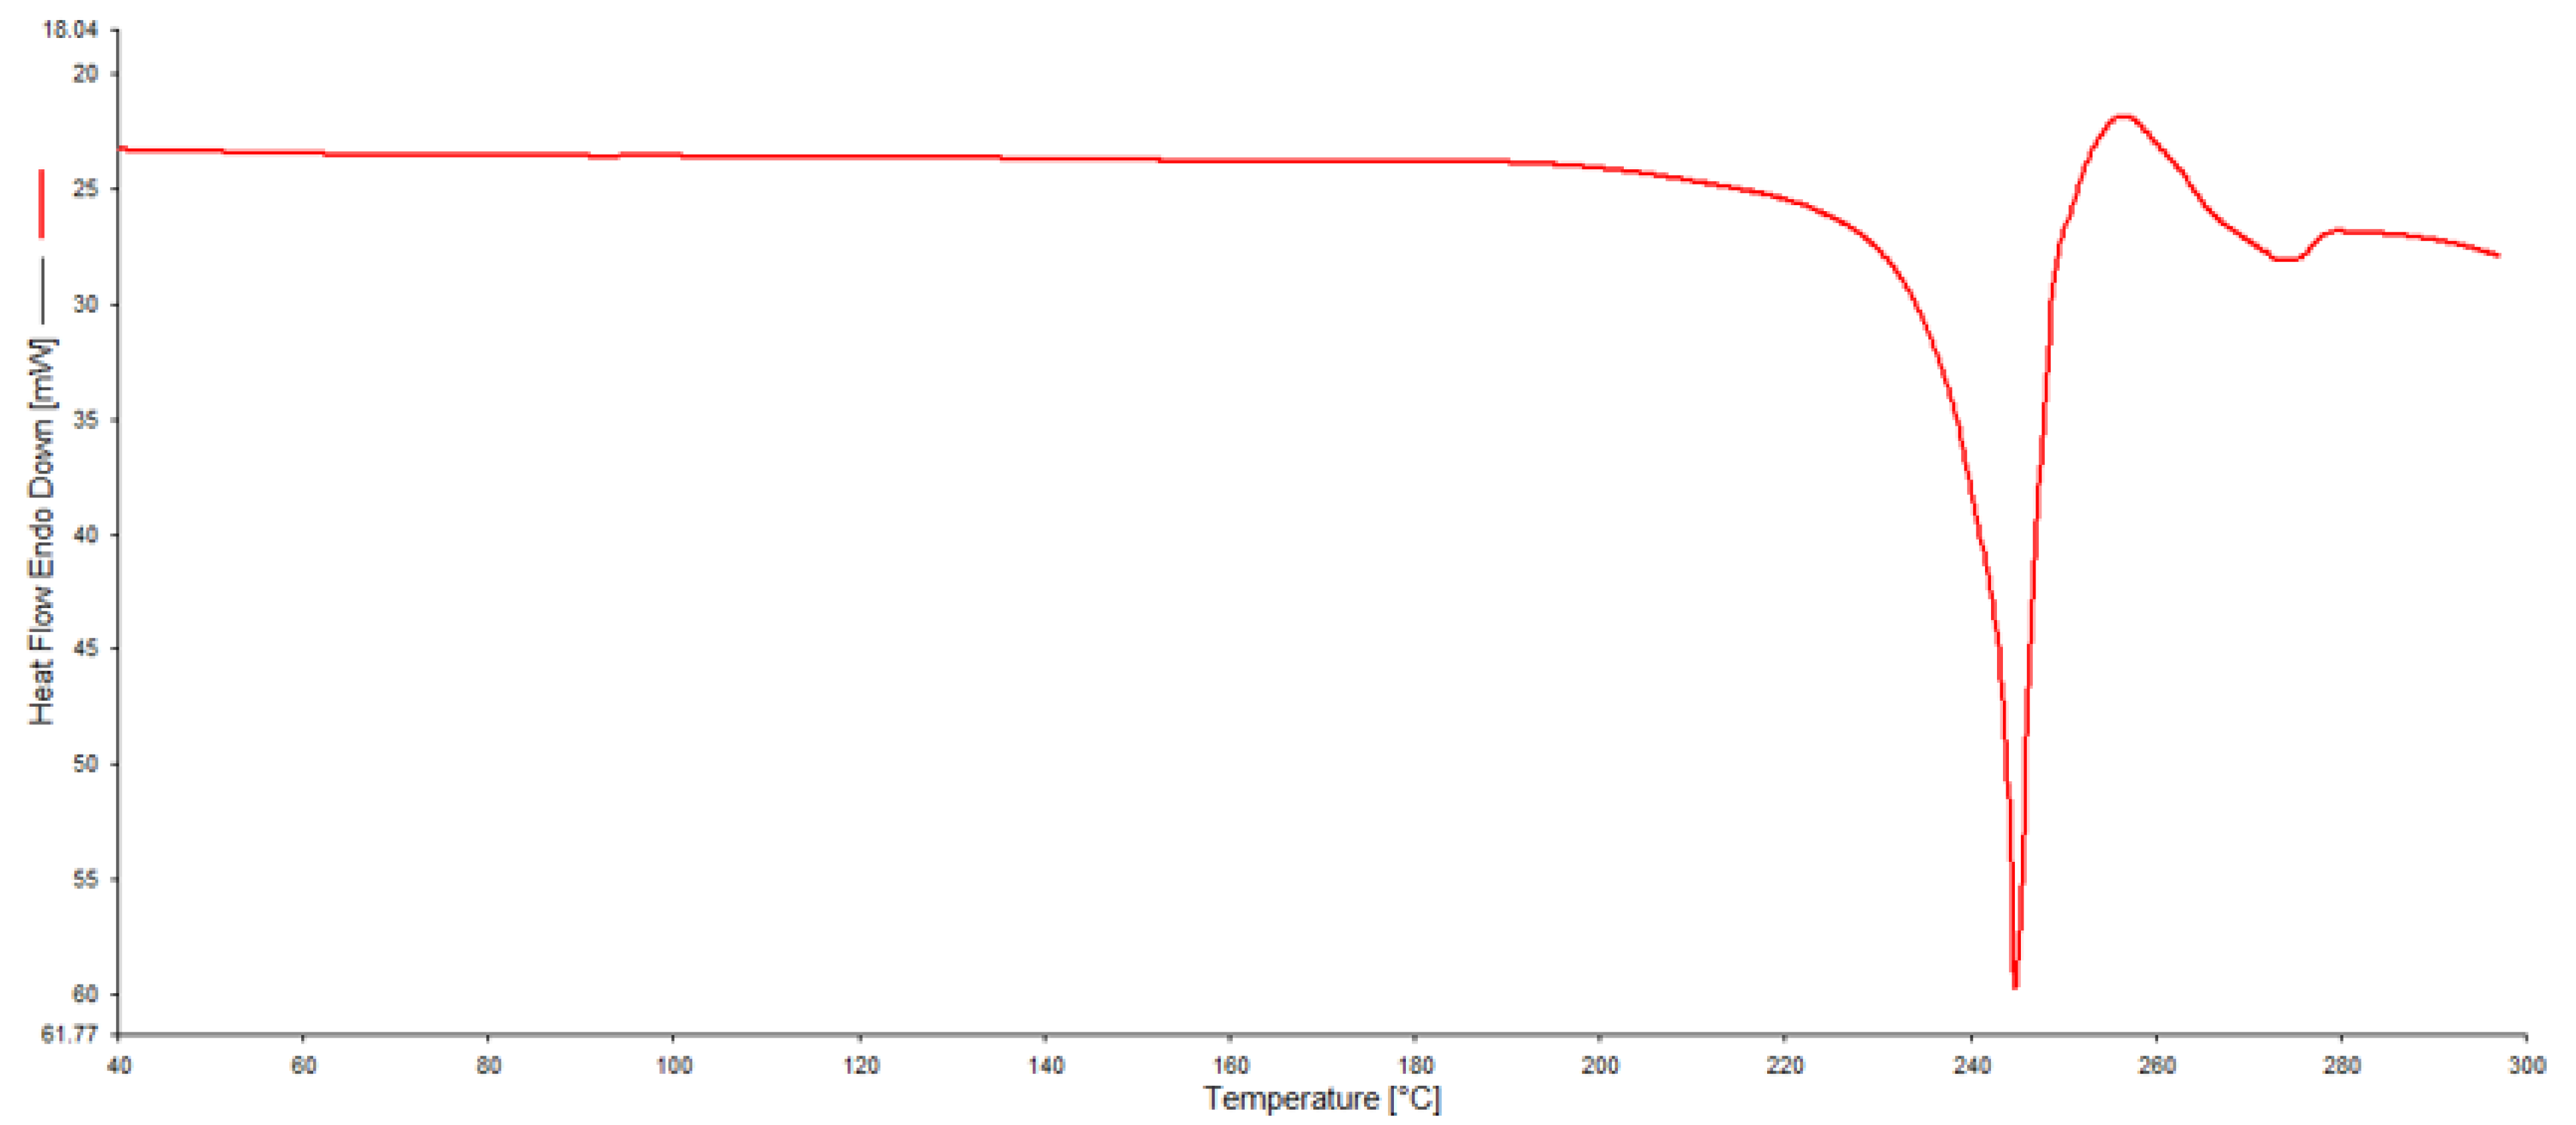
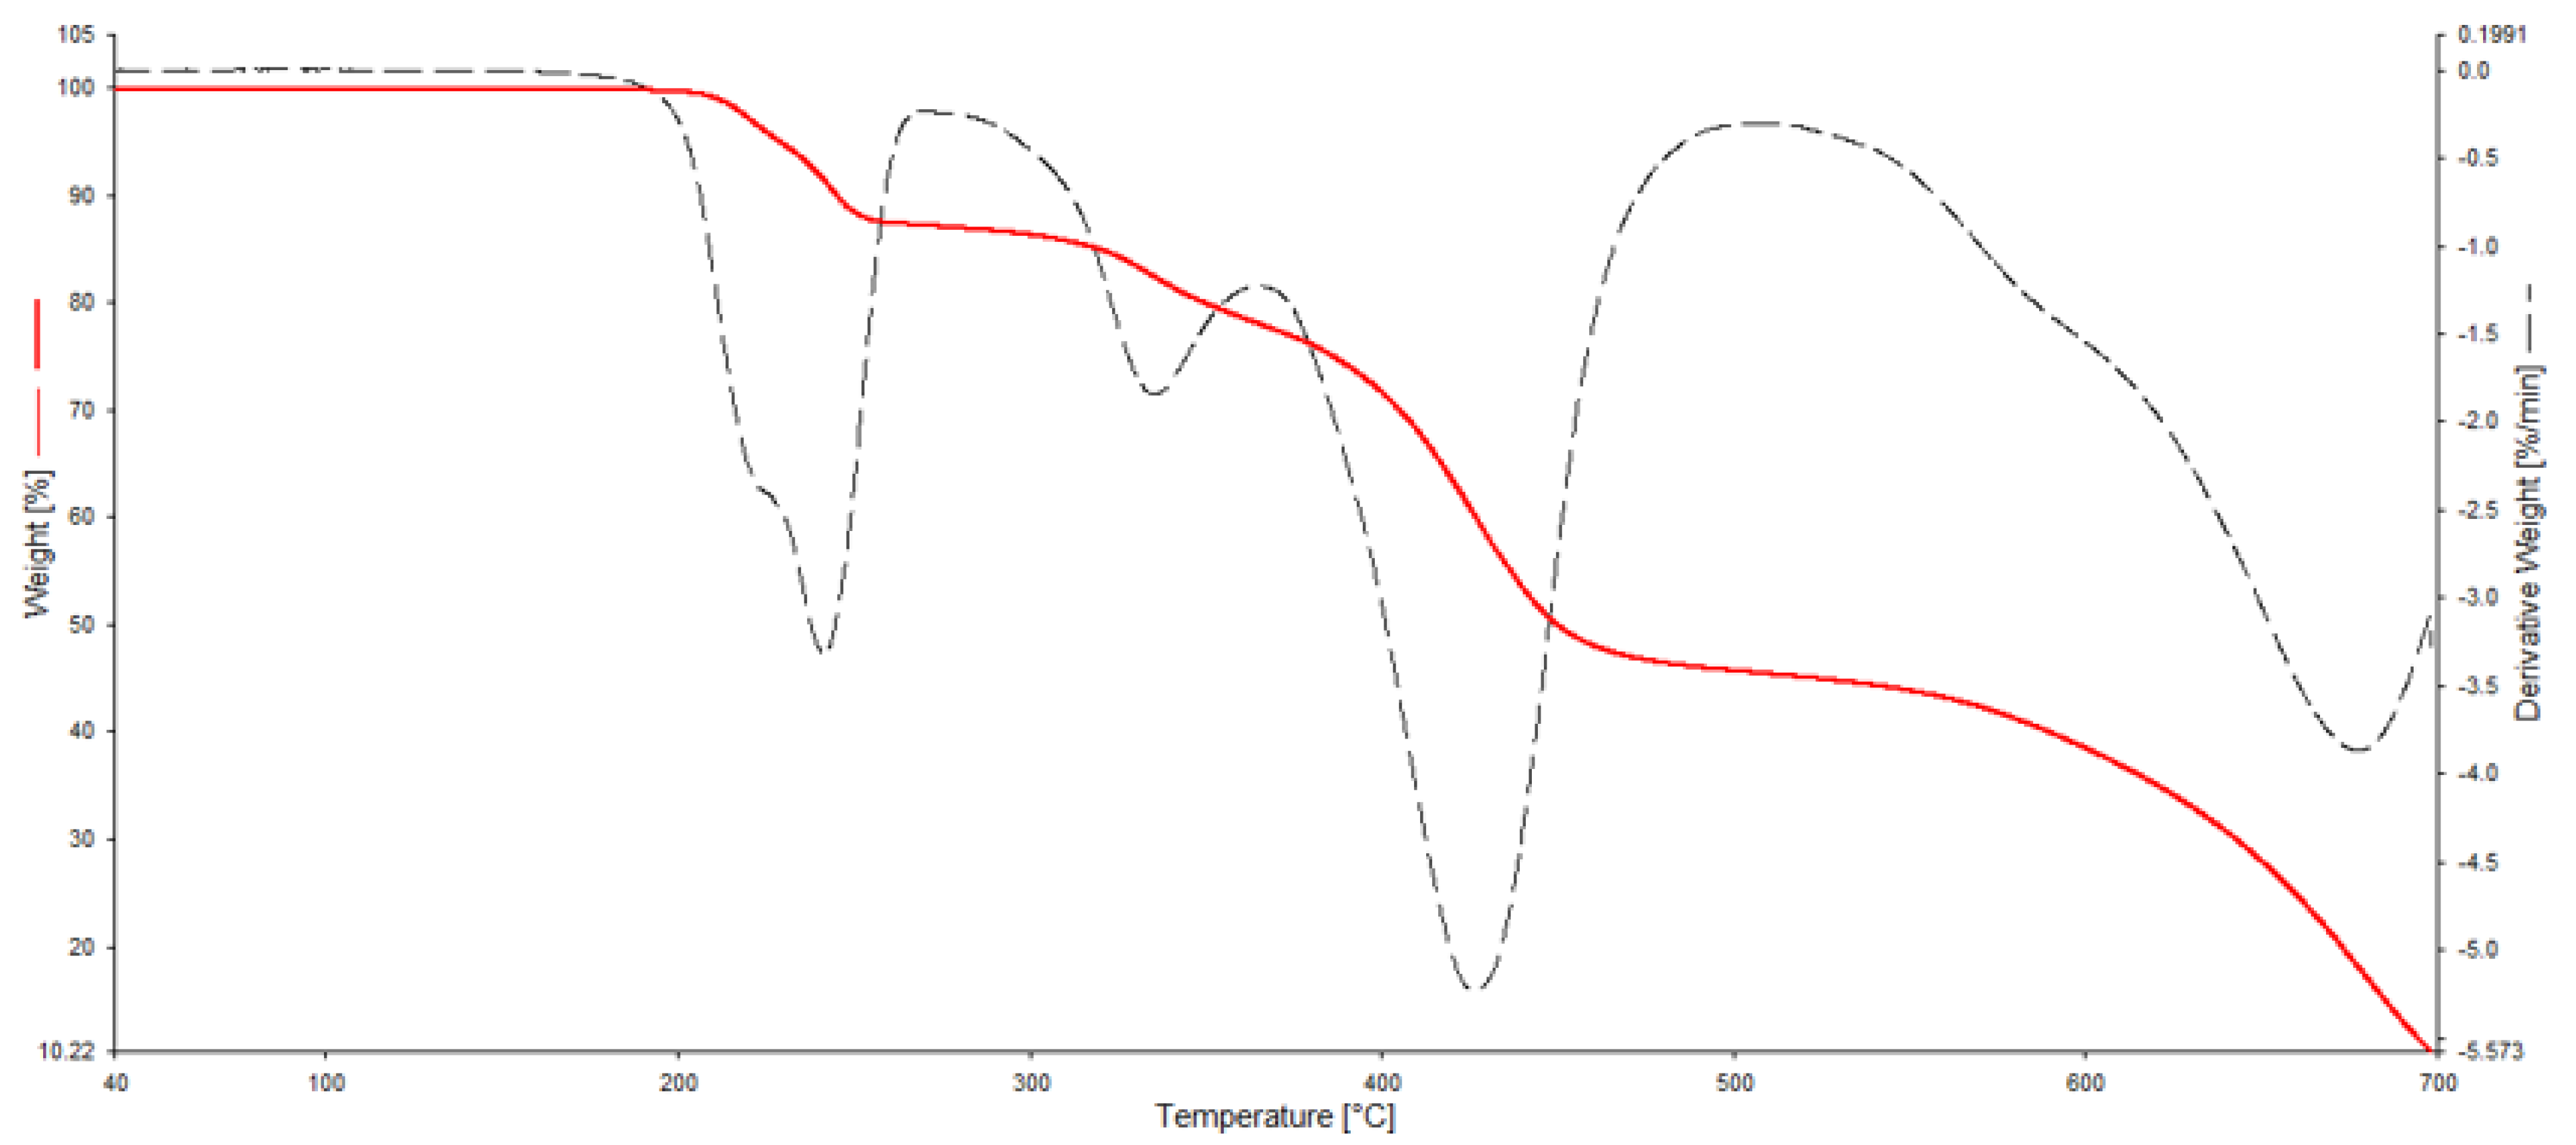
3.1. Thermal Characterisation of Fenbendazole

Figure 2 shows the DSC curves of Fen characterised by a sharp endothermic peak at 244 °C (ΔH = 252 J g−1) corresponding to the melting point, followed by decomposition at 271 °C (ΔH = 27 J g−1). Though the literature reports the same calorimetric pattern of melting followed by decomposition [24], there is a lack of consensus about the Fen melting temperature (Tm) because it relies on the heating rate applied, nitrogen flow rate, and other parameters. For instance, Attia et al. [25] identified the melting peak of Fen at 230 °C, Rodrigues et al. [26] at 214 °C, and Melian et al. [21] at 210 °C.
In Figure 3, the TGA/DTG curves demonstrate that Fen is stable below 164 °C followed by four main stages of degradation. The first stage of mass loss is from 164 to 269 °C (∆m = 13%) with Tpeak DTG = 241 °C, the second is from 270 to 357 °C (∆m = 8%) with Tpeak DTG = 334 °C, the third is from 358 to 506 °C (∆m = 34%) with Tpeak DTG = 428 °C, and the last is from 507 to 700 °C (∆m = 34%) with Tpeak DTG = 672 °C. The difference in mass loss (∆m = 11%) corresponds to the carbonaceous residue. Similar results were described in the literature by Attia et al. [25]. They described that Fen is stable up to 179 °C followed by four stages of mass loss. The first stage is between 179 and 245 °C (∆m = 10%) characterised by the loss of the sulphur atom, the second is between 245 and 345 °C (∆m = 10%) represented by the loss of CH3O, the third is between 345 and 461 °C (∆m = 35%) associated with the loss of C6H5 and CO molecules, and the last one is between 461 and 746 (∆m = 43%) represented by the loss of the C7H5N3 molecule.
After the API thermal characterisation, it is reasonable to evaluate its physical and chemical interactions with the polymeric excipients since the incompatibility between them can affect the pharmaceutical dosage form properties, and, consequently, the therapeutic efficacy [14]. Therefore, it is required to analyse the DSC and TGA/DTG curves of each neat ingredient followed by their comparison with the curves of the binary mixtures to identify possible alterations of the API thermal behaviour.

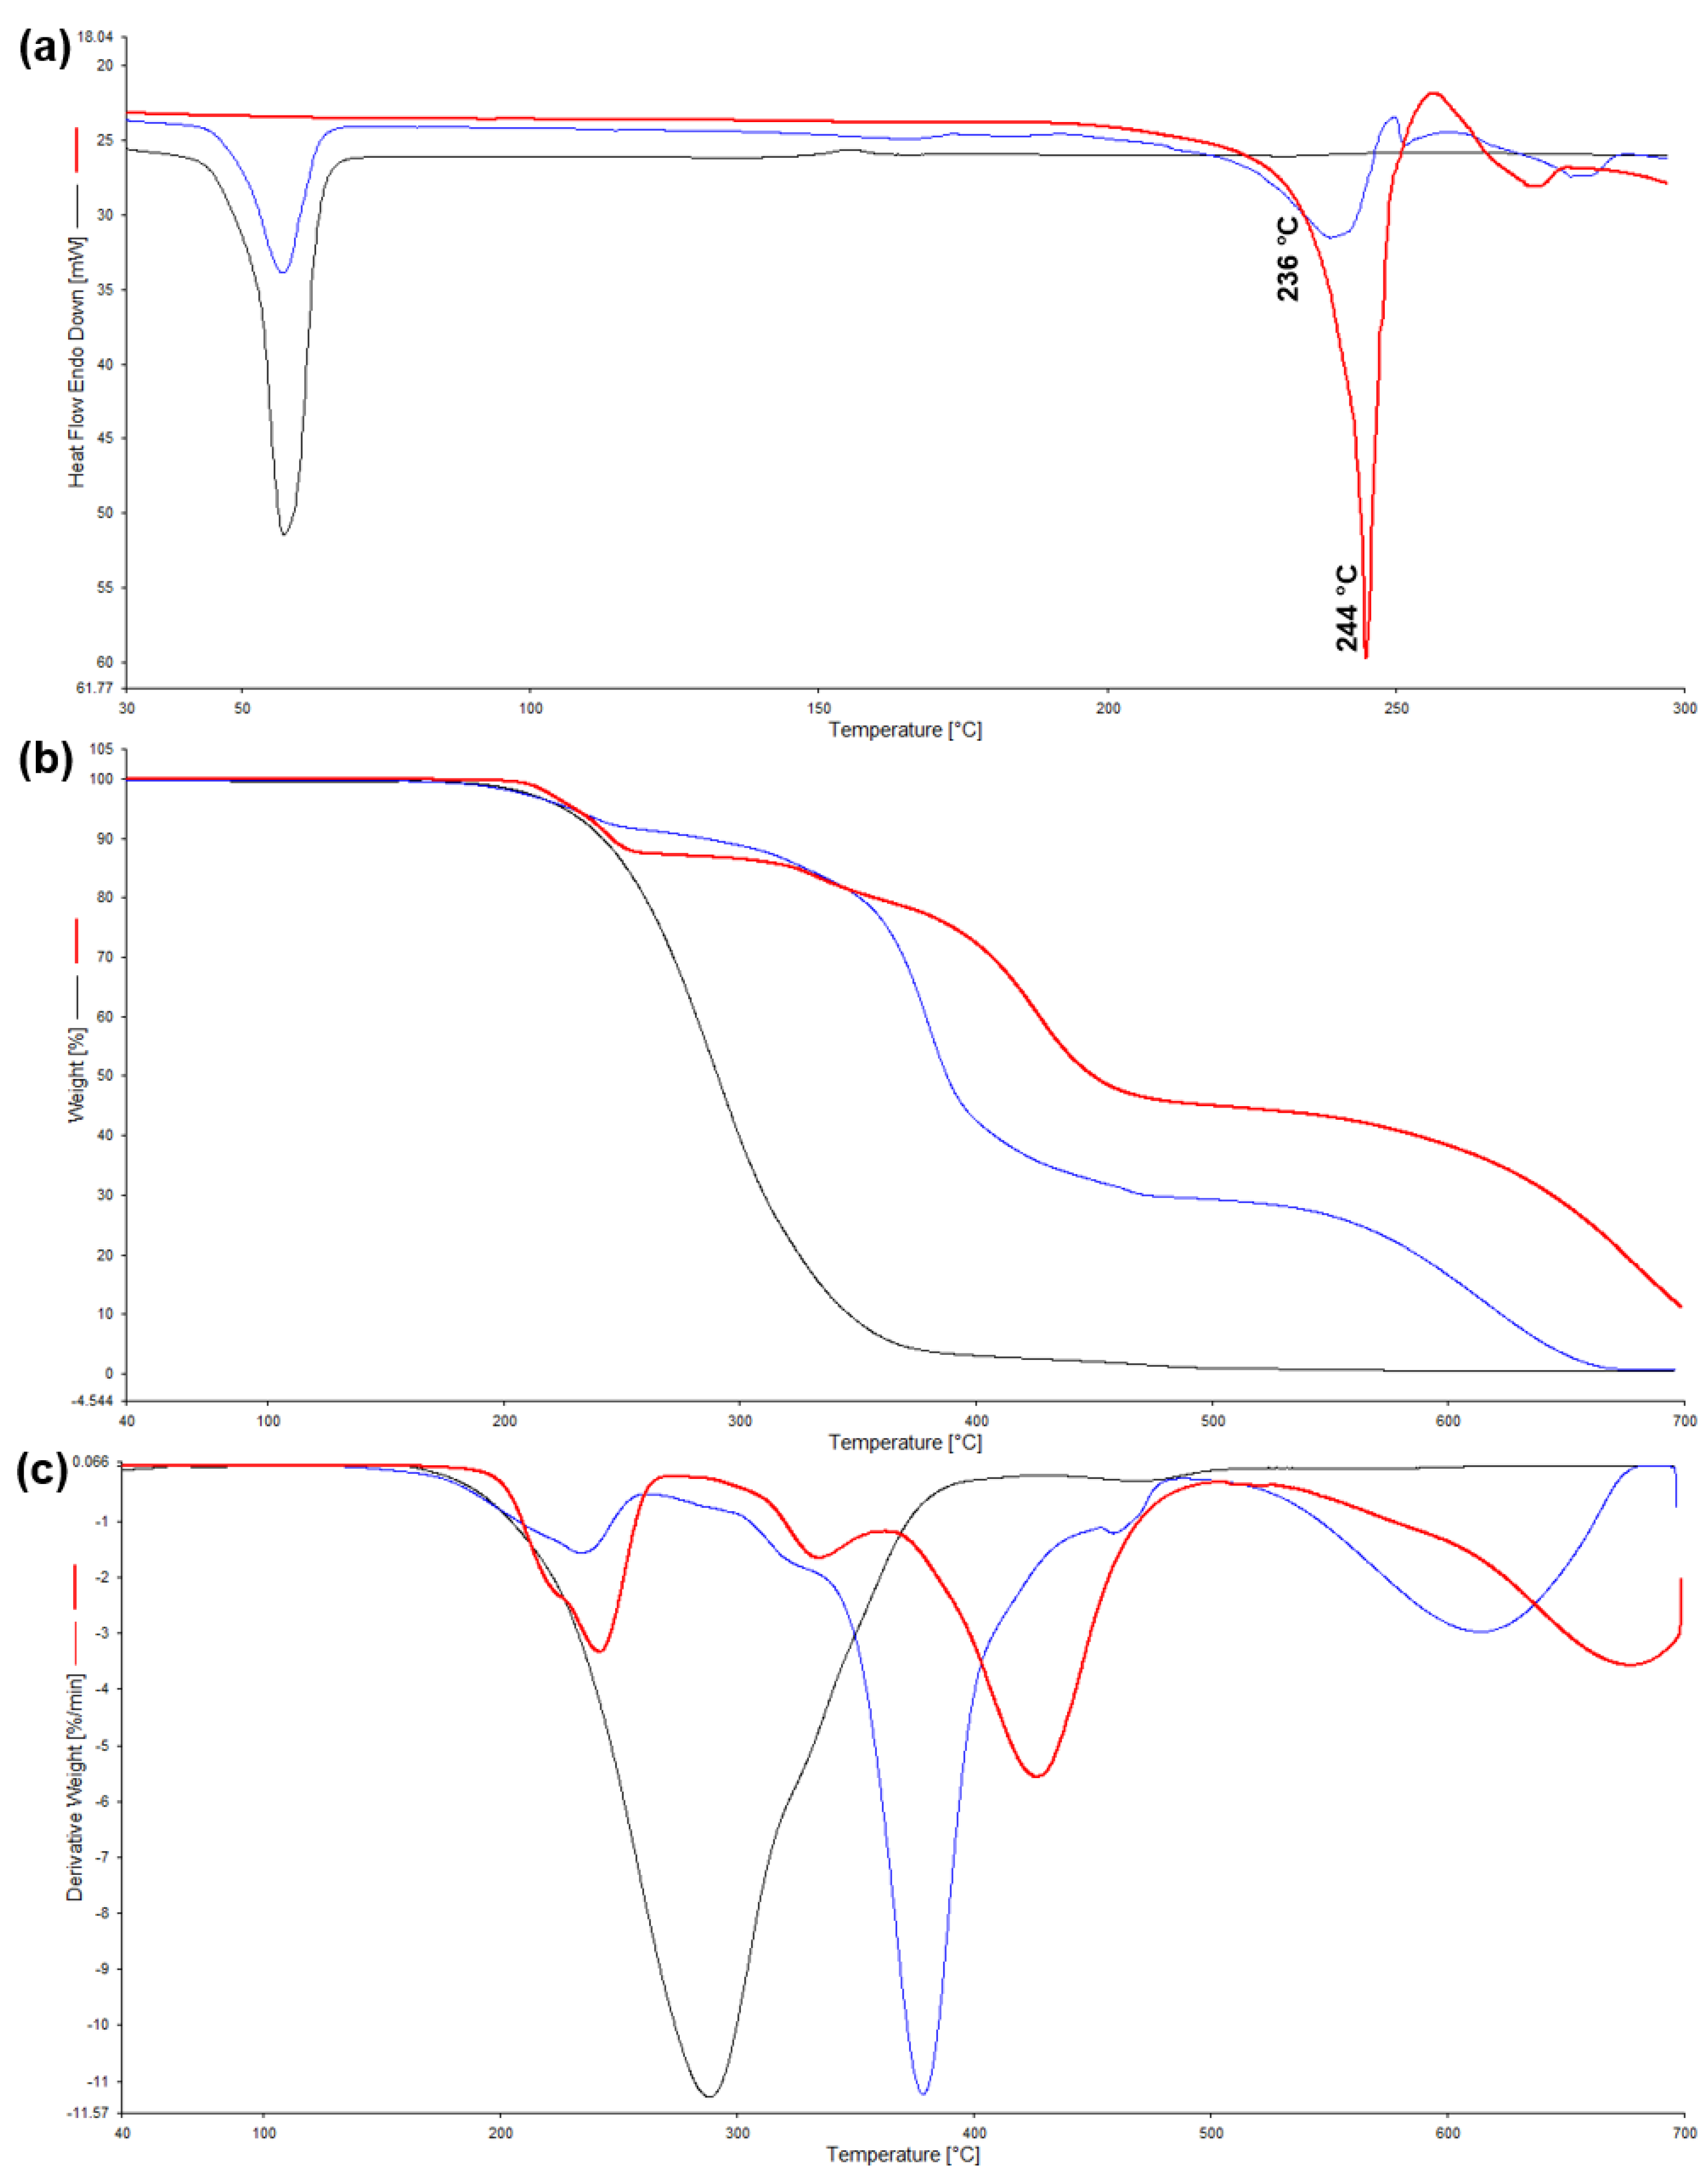
3.2. Thermal Analysis of the Physical Mixtures by DSC and TGA/DTG

Figure 4, Figure 5 and Figure 6 show the calorimetric and thermogravimetric curves of neat Fen, neat polymeric excipients, and physical mixtures with all the thermal events numerically described in Table 1.
In general, the calorimetric curve of Fen displays a well-defined endothermic peak characteristic of fusion at 244 °C (ΔH = 252 J g−1). Hence, any displacement or disappearance of this peak and/or a degree of variation in enthalpy values can indicate either physical or chemical interactions [13,17].
P 407 (Figure 4a) shows a single endothermic peak characteristic of the polymer melting at 57 °C (ΔH = 185 J g−1), which matches with another study [27]. The calorimetric curve of the physical mixture shows three endothermic peaks at 58 °C (ΔH = 88 J g−1), 236 °C (ΔH = 46 J g−1), and 283 °C (ΔH = 17 J g−1), with an expressive reduction of Fen melting peak anticipated by 8 °C. The TGA curve (Figure 4b) demonstrates a decrease of Fen thermal stability from 164 to 142 °C, representing 22 °C. Kolašinac et al. [27] studied physical mixtures between poloxamer 407 and desloratadine; they reported that the polymer melting point remained unchanged but the desloratadine melting peak shifted to a lower temperature, suggesting an interaction between them.
PCL (Figure 5a) displays a single endothermic peak characteristic of the polymer melting at 63 °C (ΔH = 112 J g−1), which agrees with the literature [28]. The DSC curve of the binary mixture displays three endothermic peaks at 62 °C (ΔH = 54 J g−1), 235 °C (ΔH = 71 J g−1), and 283 °C (ΔH = 12 J g−1), with reduction of Fen melting peak and anticipation of 9 °C. The thermogravimetric curve (Figure 5b) shows a decrease in Fen thermal stability of 24 °C from 164 to 140 °C. In another study conducted by Yoganathan and Mammucar [29], they also reported a shift of the ibuprofen melting point when loaded in PCL, but their TGA analysis showed no alteration of the drug thermal degradation.
PLA (Figure 6a) demonstrates a glass transition (Tg) at 63 °C followed by a melting peak at 152 °C (ΔH = 48 J g−1) as described in other studies [30,31,32]. The calorimetric curve of the physical mixture presents three endothermic peaks at 148 °C (ΔH = 3 J g−1), 232 °C (ΔH = 100 J g−1), and 250 °C (ΔH = 2 J g−1) followed by not only a reduction of Fen melting peak but also an anticipation of 12 °C. The thermogravimetric curve (Figure 6b) displays an increase in Fen thermal stability of 9 °C from 164 to 173 °C. Li et al. [31], who studied PLA and dexamethasone, also reported a decrease in the API melting point, but it did not affect the drug properties.
After analysing the calorimetric curves, we can see that all physical mixtures display three endothermic peaks; the first one is attributed to the respective polymer melting transition, the second to Fen melting point, and the third is characteristic of decomposition. All polymeric excipients under study had some impact on Fen thermal behaviour, which can be mainly described as follows: (i) shifting the melting point, (ii) decreasing the melting peak area and height becoming broadened and lowered, and (iii) reducing the enthalpy of fusion. This is an indication of interaction between Fen and each polymeric excipient, but it must be studied by other analytical techniques, such as XRD, FTIR, and HPLC, to confirm or exclude it.

3.3. Physical and Chemical Analysis of the Mixtures by XRD, FTIR, and HPLC

To further investigate any possible interactions between Fen and each polymeric excipient, XRD, FTIR and HPLC were employed in this study through qualitative analyses to obtain more information to support the DSC and TGA/DTG results.
The results obtained from Fen diffractogram (Figure 7) reveal its crystalline characteristics with seven well-evidenced peaks appearing at 2θ = 10.40, 12.59, 17.57, 25.31, 25.81, 26.50, and 30.98° with similar results found in the literature [21,33]. After analysing each neat polymeric excipient, their diffractograms revealed the following: P 407 displayed two main signals at 2θ = 18.73 and 23.81° (Figure 7a) [21]; PCL exhibited two peaks at 2θ = 20.70 and 23.19° (Figure 7b) [34]; and PLA showed a broad diffraction peak associated with its amorphous regions at 2θ = 10–25°, which likely covered up the crystalline domains’ peaks (Figure 7c), as the DSC analysis proved the existence of crystallinity due to the appearance of the polymer melting peak at 152 °C [35].
X-ray diffraction patterns obtained from the physical mixtures are virtually the simple superposition of the patterns corresponding to the crystalline phase of each component of the mixture. Despite not seeing any additional crystalline peak, P 407 led to a reduction of some of the main diffraction peaks of the API, such as 2θ = 17.57, 25.31, 25.81 and 26.50°, which indicates some type of interaction between them. Therefore, further investigation with FTIR is required to exclude any incompatibility since there is the possibility of a chemical interaction happening between the amorphous regions of the components, which would not be noticeable by XRD.
The FTIR spectrum of Fen was confirmed by comparison with SpectraBase—Wiley (43210-67-9), which allowed the identification of its absorption bands. Figure 7 shows the main infrared signals characteristic of Fen at 3336 cm−1 assigned to the (N-H) stretching mode from the carbamate group, 1630 cm−1 attributed to the (N-H) bending and the (C-N) stretching modes, 742 cm−1 assigned to the (phenyl), and 685 cm−1 attributed to the (benzenethiol) [21,36,37,38]. Other less relevant infrared signals are described in the literature such as 3050–2954 cm−1 attributed to the (C-H) tension mode, 2650 cm−1 assigned to the (N-H) stretching mode of the benzimidazole ring, 1708 cm−1 attributed to the (C=O) stretching vibrations of the carbamate carbonyl, 1442 cm−1 assigned to the (C-N), 1222 cm−1 attributed to the (C-O), and 1099 cm−1 attributed to the phenyl-(o) [36,37].
After analysing the infrared profile of Fen, we studied the spectrum of each polymeric excipient to compare them to the spectra of their physical mixtures. The P 407 spectrum (Figure 7d) demonstrates three main infrared signals identified by (C-H) stretching aliphatic at 2882 cm−1, (in-plane O-H) bending at 1343 cm−1, and (C-O) stretching at 1100 cm−1 [39]. The PCL spectrum (Figure 7e) can be characterised by (CH2) vibrations at 2946, 2870, and 2821 cm−1, (C=O) vibrations with a sharp intense peak at 1728 cm−1, (CH2) bending vibrations at 1465, 1407, and 1362 cm−1, (COO) vibrations at 1238 and 1181 cm−1, as well as (C-O) vibrations at 1099 and 1047 cm−1 [40]. The PLA spectrum (Figure 7f) can be identified by stretching frequencies of (C=O) at 1746 cm−1, (CH3) asymmetric at 2995 cm−1, (CH3) symmetric at 2946 cm−1, (C-O) at 1080 cm−1, and bending frequencies for (CH3) asymmetric at 1452 cm−1 and (CH3) symmetric at 1361 cm−1 [41].
All the exclusive signals responsible for characterising the API were present without the appearance of new ones for the binary mixtures of Fen with PCL and PLA. In general, any decrease of the components’ main peaks can be a consequence of dilution, mainly when working with a drug and polymer ratio of 1:1; furthermore, subtle differences between spectra can indicate the presence of intermolecular interactions between Fen and each polymeric excipient, which is a characteristic of physical interactions [27].
By evaluating the whole spectrum of the physical mixture between Fen and P 407 (Figure 8), we identified the disappearance of a signal at 1125 cm−1, the appearance of a new one at 996 cm−1, followed by two small “shoulders” at 730 and 703 cm−1. These two small “shoulders” were present in the spectra of all physical mixtures, but the literature describes these signals at 730 cm−1 as the in-plane bending mode (C=O) [42] and 703 cm−1 as the carbon out-of-plane bending vibration mode of benzene [43], which clearly are physical interactions. Nevertheless, P 407 was the only polymer missing a signal, more specifically the one at 1125 cm−1, which the literature suggests to be interpreted as asymmetric (C-O-C) stretching vibrations or (C-N) stretching mode representing a physical interaction, followed by the presence of a new signal at 996 cm−1, which is suggestive of a chemical interaction [42].
Melian et al. [21] evaluated the mixture between Fen and P 407, analysing their most relevant signals and reporting no visible alteration suggestive of a chemical interaction. Contrastingly, Kolašinac et al. [27] described that the spectra of the physical mixture between desloratadine and P 407 are largely similar to the spectra of each component with subtle differences, indicating the existence of intermolecular interactions between them probably due to the formation of hydrogen bonds characterising a physical interaction. In another study, Pezzoli el at. [44] attributed the appearance of a new band in the spectra of their formulations to the occurrence of new intermolecular interactions. Thus, this new band in the spectra of our physical mixture between Fen and P 407 can very likely be justified by the establishment of new intermolecular interactions between drug–polymer.
In a preformulation study conducted by Siahi et al. [45], HPLC proved to be an efficient qualitative method to confirm the incompatibility between Methyldopa and some pharmaceutical excipients through the presence of a new peak in the chromatograms of the binary mixtures. Figure 9 shows the HPLC chromatogram of neat Fen (a) followed by binary mixtures of Fen and P 407 (b), PCL (c), and PLA (d). HPLC endorses the thermal and spectroscopic assays indicating the compatibility of the API with PCL, PLA, as well as P 407 without the appearance of new peaks that could support the possibility of chemical interactions.
Therefore, it can be concluded that the thermal, spectroscopic, and chromatographic assays reported here attest to the physical and chemical compatibility of Fen with P 407, PCL, and PLA.

4. Conclusions

Thermoanalytical techniques such as DSC and TGA/DTG with the support of XRD, FTIR, and HPLC have proved herein to be fast and efficient methods for predicting physical and/or chemical interactions between Fen and polymeric excipients.
Thermal studies suggested the possibility of interactions between Fen and the polymeric excipients due to their capacity of shifting the Fen melting point, decreasing the melting peak area and height, and reducing the enthalpy of fusion, which can be attributed to the capacity of the polymers to dissolve part of the Fen crystalline structure during DSC measurements or even due to the heterogeneity in the small samples [13]. To validate these data, XRD analysis showed that Fen is compatible with PCL and PLA since its main diffraction peaks remained unchanged in the physical mixture, but it suggested some interaction with P 407. FTIR proved that PCL and PLA do not have any incompatibility that can compromise Fen properties. On the other hand, P 407 demonstrated a physical interaction with Fen possibly by hydrogen bonds and/or hydrophobic interactions; furthermore, we suspected a chemical interaction between them due to the appearance of a new signal, which was later proved by HPLC to be only new intermolecular interactions.
In general, a physical interaction can result in polymorphism formation, change the polymorphic form, and lead to the API solubilization with the excipient creating intermolecular interactions between their functional groups; nevertheless, it is not considered an incompatibility if the excipient does not change the physical-chemical properties of the API [10].
Thus, these results support the further application of P 407, PCL, and PLA in the development of medicinal and veterinary formulations containing Fen since they do not affect the physical and chemical characteristics of the active ingredient, and consequently its bioavailability and therapeutic efficacy. Moreover, this preformulation study using thermal and non-thermal analytical techniques can be a starting tool for the screening of other suitable polymeric excipients for the development of new pharmaceutical formulations to carry Fen, particularly generic ones, for those in which a careful selection of excipients is required.

Author Contributions

Conceptualization, G.S.N.B.; methodology, G.S.N.B.; formal analysis, G.S.N.B. and V.F.M.; investigation, G.S.N.B.; resources, J.G. and L.G.; data curation, G.S.N.B. and V.F.M.; writing—original draft preparation, G.S.N.B.; writing—review and editing, G.S.N.B., V.F.M. and T.A.d.M.d.L.; visualization, G.S.N.B., V.F.M. and T.A.d.M.d.L.; supervision, D.M.C., J.G. and L.G.; project administration, G.S.N.B., D.M.C., J.G. and L.G.; funding acquisition, G.S.N.B., D.M.C., J.G. and L.G. All authors have read and agreed to the published version of the manuscript.

Funding

This research was funded by the Irish Research Council (IRC), grant number GOIPG/2022/1734 and the President Seed Fund from TUS: Midlands and Midwest, grant number PA01007.

Acknowledgments

The authors would like to express their gratitude to Daniel Pádraig Fitzpatrick for his support with the FTIR, Lynn Louis for her assistance with the HPLC as well as the technical support of the staff from the Centre for Industrial Services Design (CISD) and Applied Polymer Technologies (APT).

Conflicts of Interest

The authors declare no conflict of interest.

References

  1. National Center for Biotechnology Information. PubChem Compound Summary for CID 3334, Fenbendazole. 2021. Available online: https://pubchem.ncbi.nlm.nih.gov/compound/Fenbendazole (accessed on 1 August 2022).
  2. Goossens, E.; Dorny, P.; Vercammen, F.; Vercruysse, J. Field evaluation of the efficacy of fenbendazole in captive wild ruminants. Vet. Record 2005, 157, 582–586. [Google Scholar] [CrossRef] [PubMed]
  3. de Oliveira, H.C.; Joffe, L.S.; Simon, K.S.; Castelli, R.F.; Reis, F.C.G.; Bryan, A.M.; Borges, B.S.; Medeiros, L.C.S.; Bocca, A.L.; Del Poeta, M.; et al. Fenbendazole controls in vitro growth, virulence potential, and animal infection in the Cryptococcus model. Antimicrob. Agents Chemother. 2020, 64, 1–14. [Google Scholar] [CrossRef] [PubMed]
  4. Chang, L.; Zhu, L. Dewormer drug fenbendazole has antiviral effects on BoHV-1 productive infection in cell cultures. J. Vet. Sci. 2020, 21, 1–10. [Google Scholar] [CrossRef] [PubMed]
  5. Duan, Q.; Liu, Y.; Rockwell, S. Fenbendazole as a potential anticancer drug. Anticancer Res. 2013, 33, 355–362. [Google Scholar]
  6. Movahedi, F.; Gu, W.; Soares, C.P.; Xu, Z.P. Encapsulating Anti-Parasite Benzimidazole Drugs into Lipid-Coated Calcium Phosphate Nanoparticles to Efficiently Induce Skin Cancer Cell Apoptosis. Front. Nanotechnol. 2021, 3, 1–13. [Google Scholar] [CrossRef]
  7. Aycock-Williams, A.; Pham, L.; Liang, M.; Adisetiyo, H.A.; Geary, L.A.; Cohen, M.B.; Casebolt, D.B.; Roy-Burman, P. Effects of fenbendazole and vitamin E succinate on the growth and survival of prostate cancer cells. J. Cancer Res. Exp. Oncol. 2011, 3, 115–121. [Google Scholar]
  8. Chiang, R.S.; Syed, A.B.; Wright, J.L. Fenbendazole Enhancing Anti-Tumor Effect: A Case Series. Clin. Oncol. Case Rep. 2021, 4, 2–5. [Google Scholar]
  9. Shaikh, R.; O’Brien, D.P.; Croker, D.M.; Walker, G.M. The development of a pharmaceutical oral solid dosage forms. Comput. Aided Chem. Eng. 2018, 41, 27–65. [Google Scholar]
  10. Bezerra, G.S.N.; Pereira, M.A.V.; Ostrosky, E.A.; Barbosa, E.G.; de Moura, F.V.; Ferrari, M.; Aragão, C.F.S.; Gomes, A.P.B. Compatibility study between ferulic acid and excipients used in cosmetic formulations by TG/DTG, DSC and FTIR. J. Therm. Anal. Calorim. 2017, 127, 1683–1691. [Google Scholar] [CrossRef]
  11. U.S. Department of Health and Human Services Food and Drug Administration. ICH Q8(R2) Pharmaceutical Development. Workshop Qual. By Des. Pharm. 2009, 8, 28. [Google Scholar]
  12. Thakkar, R.; Thakkar, R.; Pillai, A.; Ashour, E.A.; Repka, M.A. Systematic screening of pharmaceutical polymers for hot melt extrusion processing: A comprehensive review. Int. J. Pharm. 2020, 576, 118989. [Google Scholar] [CrossRef] [PubMed]
  13. Tiţa, B.; Fuliaş, A.; Bandur, G.; Marian, E.; Tiţa, D. Compatibility study between ketoprofen and pharmaceutical excipients used in solid dosage forms. J. Pharm. Biomed. Anal. 2011, 56, 221–227. [Google Scholar] [CrossRef] [PubMed]
  14. Pereira, M.A.V.; Fonseca, G.D.; Silva-Júnior, A.A.; Fernandes-Pedrosa, M.F.; De, M.; Barbosa, E.G.; Gomes, A.P.B.; dos Santos, K.S.C.R. Compatibility study between chitosan and pharmaceutical excipients used in solid dosage forms. J. Therm. Anal. Calorim. 2014, 116, 1091–1100. [Google Scholar] [CrossRef]
  15. De Barros Lima, Í.P.; Lima, N.G.P.B.; Barros, D.M.C.; Oliveira, T.S.; Mendonҫa, C.M.S.; Barbosa, E.G.; Raffin, F.N.; de Lima e Moura, T.F.A.; Gomes, A.P.B.; Ferrari, M.; et al. Compatibility study between hydroquinone and the excipients used in semi-solid pharmaceutical forms by thermal and non-thermal techniques. J. Therm. Anal. Calorim. 2015, 120, 719–732. [Google Scholar] [CrossRef]
  16. Matos, A.P.S.; Costa, J.S.; Boniatti, J.; Seiceira, R.C.; Pitaluga, A.; Oliveira, D.L.; Viçosa, A.L.; Holandino, C. Compatibility study between diazepam and tablet excipients: Infrared spectroscopy and thermal analysis in accelerated stability conditions. J. Therm. Anal. Calorim. 2017, 127, 1675–1682. [Google Scholar] [CrossRef]
  17. Bezerra, G.S.N.; Colbert, D.M.; O’Donnell, C.; Cao, Z.; Geever, J.; Geever, L. Compatibility Study Between Fenbendazole and Poly(Ethylene Oxide) with Application in Solid Dispersion Formulations Using Hot-Melt Extrusion. J. Pharm. Innov. 2022, 1–13. [Google Scholar] [CrossRef]
  18. Tita, I.C.; Lupa, L.; Tita, B.; Stan, R.L.; Vicas, L. Compatibility Studies of Valsartan with Different Pharmaceutical Excipients. Rev. Chim 2019, 70, 2590–2600. Available online: https://revistadechimie.ro/Articles.asp?ID=7386 (accessed on 1 September 2022).
  19. Shakar AA, M.; Hossain, M.J.; Kayesh, R.; Rahman, A.; Sultan, M.Z. Incompatibility of Bisoprolol Fumarate with Some Super-disintegrating Agents. Br. J. Pharm. Res. 2015, 5, 137–145. [Google Scholar] [CrossRef]
  20. Patel, P. Preformulation Studies: An Integral Part of Formulation Design. In Pharmaceutical Formulation Design—Recent Practices; IntechOpen: London, UK, 2020; pp. 1–19. [Google Scholar]
  21. Melian, M.E.; Munguía, A.B.; Faccio, R.; Palma, S.; Domínguez, L. The Impact of Solid Dispersion on Formulation, Using Confocal Micro Raman Spectroscopy as Tool to Probe Distribution of Components. J. Pharm. Innov. 2018, 13, 58–68. [Google Scholar] [CrossRef]
  22. Chadha, R.; Bhandari, S. Drug-excipient compatibility screening-Role of thermoanalytical and spectroscopic techniques. J. Pharm. Biomed. Anal. 2014, 87, 82–97. [Google Scholar] [CrossRef]
  23. Ali, O.T.; Hassan, W.S.; Khayyat, A.N.; Almalki, A.J.; Sebaiy, M.M. HPLC Determination of Imidazoles with Variant Anti-Infective Activity in Their Dosage Forms and Human Plasma. Molecules 2020, 26, 129. [Google Scholar] [CrossRef]
  24. Food and Agriculture Organization of the United Nations. Residues of Some Veterinary Drugs in Foods and Animals 1998. Available online: http://www.fao.org/food/food-safety-quality/scientific-advice/jecfa/jecfa-vetdrugs/details/en/c/26/ (accessed on 1 August 2022).
  25. Attia, A.K.; Saad, A.S.; Alaraki, M.S.; Elzanfaly, E.S. Study of thermal analysis behavior of fenbendazole and rafoxanide. Adv. Pharm. Bull. 2017, 7, 329–334. [Google Scholar] [CrossRef] [PubMed] [Green Version]
  26. Rodrigues, L.N.C.; Tavares, A.C.M.; Ferreira, B.T.; Reis, A.K.C.A.; Katiki, L.M. Inclusion complexes and self-assembled cyclodextrin aggregates for increasing the solubility of benzimidazoles. Braz. J. Pharm. Sci. 2019, 55. [Google Scholar] [CrossRef] [Green Version]
  27. Kolašinac, N.; Kachrimanis, K.; Homšek, I.; Grujić, B.; Urić, Z.; Ibrić, S. Solubility enhancement of desloratadine by solid dispersion in poloxamers. Int. J. Pharm. 2012, 436, 161–170. [Google Scholar] [CrossRef]
  28. Woodruff, M.A.; Hutmacher, D.W. The return of a forgotten polymer—Polycaprolactone in the 21st century. Prog. Polym. Sci. 2010, 35, 1217–1256. [Google Scholar] [CrossRef] [Green Version]
  29. Yoganathan, R.; Mammucari, R.; Foster, N.R. Impregnation of Ibuprofen into Polycaprolactone using supercritical carbon dioxide. J. Phys. Conf. Ser. 2010, 2015, 1–5. [Google Scholar] [CrossRef]
  30. Cipriano, T.F.; Da Silva, A.L.N.; Da Fonseca Thomé Da Silva, A.H.M.; De Sousa, A.M.F.; Da Silva, G.M.; Rocha, M.G. Thermal, rheological and morphological properties of poly(Lactic Acid) (PLA) and talc composites. Polimeros 2014, 24, 276–282. [Google Scholar]
  31. Li, D.; Guo, G.; Fan, R.; Liang, J.; Deng, X.; Luo, F.; Qian, Z. PLA/F68/Dexamethasone implants prepared by hot-melt extrusion for controlled release of anti-inflammatory drug to implantable medical devices: I. Preparation, characterization and hydrolytic degradation study. Int. J. Pharm. 2013, 441, 365–372. [Google Scholar] [CrossRef]
  32. Backes, E.H.; de Pires, L.N.; Costa, L.C.; Passador, F.R.; Pessan, L.A. Analysis of the degradation during melt processing of pla/biosilicate® composites. J. Compos. Sci. 2019, 3, 52. [Google Scholar] [CrossRef] [Green Version]
  33. Bezerra, G.S.N.; de Lima, T.A.M.; Colbert, D.M.; Geever, J.; Geever, L. Formulation and Evaluation of Fenbendazole Extended-Release Extrudes Processed by Hot-Melt Extrusion. Polymers 2022, 14, 4188. [Google Scholar] [CrossRef]
  34. Balu, R.; Sampath Kumar, T.S.; Ramalingam, M.; Ramakrishna, S. Electrospun polycaprolactone/Poly(1,4-butylene adipate-co-polycaprolactam) blends: Potential biodegradable scaffold for bone tissue regeneration. J. Biomater. Tissue Eng. 2011, 1, 30–39. [Google Scholar] [CrossRef]
  35. Tanase-Opedal, M.; Espinosa, E.; Rodríguez, A.; Chinga-Carrasco, G. Lignin: A biopolymer from forestry biomass for biocomposites and 3D printing. Materials 2019, 12, 3006. [Google Scholar] [CrossRef] [Green Version]
  36. Soto, C.; Otipka, R.; Contreras, D.; Yáñez, J.; Toral, M.I. Co-determination of two antiparasitics drugs by derivative spectrophotometry and its photodegradation studies. J. Chil. Chem. Soc. 2013, 58, 1824–1829. [Google Scholar] [CrossRef] [Green Version]
  37. Surov, A.O.; Vasilev, N.A.; Vener, M.V.; Parashchuk, O.D.; Churakov, A.V.; Magdysyuk, O.V.; Perlovich, G.L. Pharmaceutical Salts of Fenbendazole with Organic Counterions: Structural Analysis and Solubility Performance. Cryst. Growth Des. 2021, 21, 4516–4530. [Google Scholar] [CrossRef]
  38. Esfahani, M.K.M.; Alavi, S.E.; Cabot, P.J.; Islam, N.; Izake, E.L. Pegylated mesoporous silica nanoparticles (Mcm-41): A promising carrier for the targeted delivery of fenbendazole into prostrate cancer cells. Pharmaceutics 2021, 13, 1605. [Google Scholar] [CrossRef] [PubMed]
  39. Garala, K.; Joshi, P.; Patel, J.; Ramkishan, A.; Shah, M. Formulation and evaluation of periodontal in situ gel. Int. J. Pharm. Investig. 2013, 3, 29. [Google Scholar] [CrossRef] [PubMed] [Green Version]
  40. Chakrapani, V.Y.; Gnanamani, A.; Giridev, V.R.; Madhusoothanan, M.; Sekaran, G. Electrospinning of Type I Collagen and PCL Nanofibers Using Acetic Acid. J. Appl. Polym. Sci. 2012, 125, 3221–3227. [Google Scholar] [CrossRef]
  41. Chieng, B.W.; Ibrahim, N.A.; Yunus, W.M.Z.W.; Hussein, M.Z. Poly(lactic acid)/poly(ethylene glycol) polymer nanocomposites: Effects of graphene nanoplatelets. Polymers 2014, 6, 93–104. [Google Scholar] [CrossRef] [Green Version]
  42. Panicker, C.Y.; Varghese, H.T.; Narayana, B.; Divya, K.; Sarojini, B.K.; War, J.A.; Alsenoy, C.V.; Fun, H.K. FT-IR, NBO, HOMO-LUMO, MEP analysis and molecular docking study of Methyl N-({[2-(2-methoxyacetamido)-4-(phenylsulfanyl)phenyl]amino}[(methoxycarbonyl) imino]methyl)carbamate. Spectrochim. Acta Part A Mol. Biomol. Spectrosc. 2015, 148, 29–42. [Google Scholar] [CrossRef]
  43. Mohan, S.; Sundaraganesan, N.; Mink, J. FTIR and Raman studies on benzimidazole. Spectrochim. Acta Part A Mol. Spectrosc. 1991, 47, 1111–1115. [Google Scholar] [CrossRef]
  44. Pezzoli, R.; Hopkins, M.; Direur, G.; Gately, N.; Lyons, J.G.; Higginbotham, C.L. Micro-injection moulding of poly(Vinylpyrrolidone-vinyl acetate) binary and ternary amorphous solid dispersions. Pharmaceutics 2019, 11, 240. [Google Scholar] [CrossRef] [Green Version]
  45. Siahi, M.R.; Rahimi, S.; Monajjemzadeh, F. Analytical investigation of the possible chemical interaction of methyldopa with some reducing carbohydrates used as pharmaceutical excipients. Adv. Pharm. Bull. 2018, 8, 657–666. [Google Scholar] [CrossRef]
Figure 1. Chemical structures of (a) Fen, (b) P 407, (c) PCL, and (d) PLA designed using MarvinSketch 15.4.6.
Analytica 03 00031 g001
Figure 2. DSC curve of Fen at a heating rate of 10 °C min1.
Analytica 03 00031 g002
Figure 3. TGA/DTG curves of Fen at a heating rate of 10 °C min1.
Analytica 03 00031 g003
Figure 4. Thermal behaviour of P 407—DSC (a), TGA (b), and DTG (c) at a heating rate of 10 °C min−1. Fen (red), neat polymer (black), and physical mixture (blue).
Analytica 03 00031 g004
Figure 5. Thermal behaviour of PCL—DSC (a), TGA (b), and DTG (c) at a heating rate of 10 °C min−1. Fen (red), neat polymer (black), and physical mixture (blue).
Analytica 03 00031 g005
Figure 6. Thermal behaviour of PLA—DSC (a), TGA (b), and DTG (c) at a heating rate of 10 °C min−1. Fen (red), neat polymer (black), and physical mixture (blue).
Analytica 03 00031 g006
Figure 7. XRD shows the main diffraction peaks characteristic of neat Fen followed by physical mixtures between Fen and (a) P 407, (b) PCL, and (c) PLA. FTIR shows the main signals characteristic of neat Fen followed by physical mixtures between fen and (d) P 407, (e) PCL, and (f) PLA. Fen (red), neat polymers (black), and physical mixtures (blue).
Analytica 03 00031 g007
Figure 8. Spectral comparison among Fen (red), neat P 407 (black), and physical mixture between Fen and P 407 (blue) to pinpoint the disappearance and appearance of new peaks in the mixture spectrum.
Analytica 03 00031 g008
Figure 9. HPLC chromatogram of (a) neat Fen—retention time: 6.81, followed by physical mixtures between Fen and (b) P 407—6.84 min, (c) PCL—6.84 min, and (d) PLA—6.80 min.
Analytica 03 00031 g009
Table 1. Thermoanalytical data of neat excipients and physical mixtures between Fen + polymeric excipients 1:1 (w/w) at a heating rate of 10 °C min1.
DSCTGADTG
ExcipientsTransitionTonset [°C]Tm [°C]ΔH [J g−1]T [°C] am [%]Tpeak [°C]
P 4071st Endo5157185
146–39896288
PCL1st Endo5563112
233–47092409
471–5476514
PLA1st Endo14515248
286–41198378
Physical mixturesTransitionTonset [°C]Tm [°C]ΔH [J g−1]T [°C] am [%]Tpeak [°C]
Fen + P 4071st Endo525888
2nd Endo21923646142–30111233
3rd Endo26828317302–3395319
340–48052378
481–70028615
Fen + PCL1st Endo566254
2nd Endo21723571140–2746230
3rd Endo26828312275–43363398
434–4976462
498–70022591
Fen + PLA1st Endo1431483
2nd Endo225232100173–2342216
3rd Endo2462502235–2592239
260–44978320
450–70015604
aT ranges between Tonset and Tendset.
Publisher’s Note: MDPI stays neutral with regard to jurisdictional claims in published maps and institutional affiliations.

