Communication

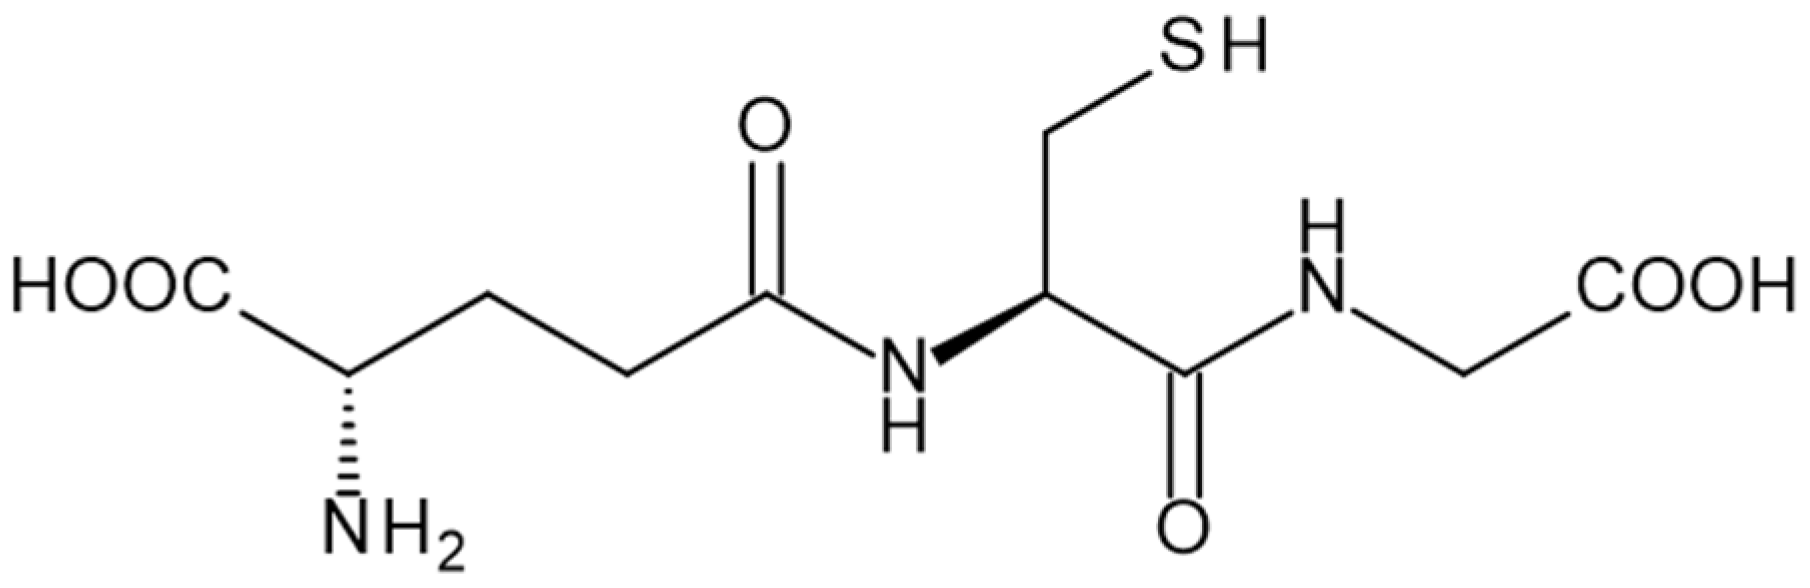
General Applicability of High-Resolution Continuum-Source Graphite Furnace Molecular Absorption Spectrometry to the Quantification of Oligopeptides Using the Example of Glutathione

by
Daniel Baecker
1,* and
Sebastian Guenther
2
1
Department of Pharmaceutical/Medicinal Chemistry, Institute of Pharmacy, University of Greifswald, Friedrich-Ludwig-Jahn-Straße 17, 17489 Greifswald, Germany
2
Department of Pharmaceutical Biology, Institute of Pharmacy, University of Greifswald, Friedrich-Ludwig-Jahn-Straße 17, 17489 Greifswald, Germany
*
Author to whom correspondence should be addressed.
Analytica 2022, 3(1), 24-35; https://doi.org/10.3390/analytica3010003
Submission received: 25 November 2021 / Revised: 3 January 2022 / Accepted: 10 January 2022 / Published: 16 January 2022
(This article belongs to the Special Issue New Analytical Techniques and Methods in Pharmaceutical Science)

Abstract

:
This communication introduces the first-time application of high-resolution continuum-source molecular absorption spectrometry (HR CS MAS) for the quantification of a peptide. The graphite furnace technique was employed and the tripeptide glutathione (GSH) served as a model compound. Based on measuring sulfur in terms of carbon monosulfide (CS), a method was elaborated to analyze aqueous solutions of GSH. The most prominent wavelength of the CS molecule occurred at 258.0560 nm and was adduced for monitoring. The methodological development covered the optimization of the pyrolysis and vaporization temperatures. These were found optimally to be 250 °C and 2250 °C, respectively. Moreover, the effect of modifiers (zirconium, calcium, magnesium, palladium) on the absorption signals was investigated. The best results were obtained after permanent coating of the graphite tube with zirconium (total amount of 400 μg) and adding a combination of palladium (10 µL, 10 g L−1) and calcium (2 µL, 1 g L−1) as a chemical modifier to the probes (10 µL). Aqueous standard samples of GSH were used for the calibration. It showed a linear range of 2.5–100 µg mL−1 sulfur contained in GSH with a correlation coefficient R2 > 0.997. The developed method exhibited a limit of detection (LOD) and quantification (LOQ) of 2.1 µg mL−1 and 4.3 µg mL−1 sulfur, respectively. The characteristic mass accounted for 5.9 ng sulfur. The method confirmed the general suitability of MAS for the analysis of an oligopeptide. Thus, this study serves as groundwork for further development in order to extend the application of classical atomic absorption spectrometry (AAS).

1. Introduction

Peptides generally play essential roles in life sciences, for instance in the discovery of drugs such as synthetic peptide vaccines [1]. The increasing interest in peptides is accompanied by the demand for analytical techniques to investigate the biological behavior of pharmacologically active peptides. The revival of old analytical techniques may open novel possibilities for the analysis of peptide therapeutics or peptides participating in the metabolism of new drugs. The oligopeptide glutathione (GSH, Figure 1) is also important for drug metabolism and frequently applied as a model compound [2]. GSH is a tripeptide comprising the amino acids l-cysteine (Cys), l-glutaminic acid (Glu) and glycin (Gly). Conspicuously, it is the gamma carboxyl group of Glu that is linked to Cys, while the carboxyl group of Cys forms a conventional peptide bond with Gly (γ-Glu-Cys-Gly). Reduced GSH is abundant in mammalian cells at concentrations in the low micromolar range (between 0.1 and 15 mmol L−1) [3] and is critical for the maintenance of the intracellular redox homeostasis [4]. Upon oxidation of GSH, the respective dimer glutathione disulfide (GSSG) is formed. Because of its reducing property, which depends on the sulfhydryl residue of Cys, GSH serves as an antioxidant, both directly and as a co-substrate for various redox enzymes, and is thus protective against oxidative stress. The depletion of GSH promotes oxidative stress, which participates in the pathogenesis of several diseases such as Alzheimer’s and Parkinson disease or cancer [5,6].
The importance of GSH in redox biology also leads to growing interest in analytical methods for its detection [7]. The analytical assessment of GSH in biological systems is challenging, mainly due to its polar character and the limited chemical stability. Capillary electrophoresis (CE) and high-performance liquid chromatography (HPLC) represent the most commonly applied techniques for the quantification of GSH. Compared to HPLC, CE would appear easier to use, less time consuming and less expensive since it requires fewer derivatizations [8]. In contrast, chemical modification is necessary in the HPLC analysis of GSH to allow for absorption or fluorescence detection. For example, the Cys of GSH is often reacted with the non-fluorescent monobromobimane to yield a fluorescent GSH adduct, which greatly increases sensitivity while limiting further autoxidation [9]. Moreover, the redox activity of GSH can be employed in terms of quantification by electrochemical analysis [8]. The monitoring of GSH was even facilitated by small-angle X-ray scattering [10]. Nevertheless, GSH is not accessible by UV-Vis and fluorescence spectroscopic methods directly as GSH lacks an appropriate chromophore or fluorophore [11].
Molecular absorption spectrometry (MAS) represents a spectroscopic technique that principally can be exploited for the determination of an oligopeptide such as GSH without derivatization. Since the advancement of high-resolution continuum-source MAS (HR CS MAS), it is feasible to quantify non-metals such as sulfur [12]. In recent years, much effort has been made to develop methods that assess sulfur primarily based on the absorption of the diatomic molecule carbon monosulfide (CS) [13,14,15]. Several approaches report on the quantification of Cys in terms of MAS [16,17,18,19]. Thus, it appeared promising to quantify the tripeptide GSH in a similar manner. However, to the best of our knowledge, this has not been reported on so far. Generally, the utilization of MAS to study sulfur-containing compounds would appear to be mainly limited to inorganic compounds and small organic molecules. Proteins can be quantified by a wide variety of analytical methods, also by spectroscopic methods [20,21,22]. Until now, the analysis of oligopeptides through the use of MAS is lacking. However, the indirect quantification of a peptide aiming at an intrinsic heteroatom, such as the sulfur of cysteine or methionine, would seem suitable [23].
Hence, the aim of this current investigation was to ascertain the principal applicability of MAS to the quantification of peptides as part of the research trend to extend the application of classical atomic absorption spectrometry (AAS). The present endeavor was exemplarily demonstrated by the measurement of sulfur in GSH.

2. Materials and Methods

2.1. Chemicals

Ultrapure water obtained from an ELGA Purelab flex system (Veolia, London, UK) was used throughout the investigations. L-Gluthathione (reduced) and the zirconium AAS standard solution were purchased from Carl Roth (Karlsruhe, Germany); palladium acetate was from Sigma-Aldrich (Steinheim, Germany); calcium nitrate, magnesium nitrate hexahydrate and suprapure nitric acid (65%) were from Merck (Darmstadt, Germany); and acetic acid was from Walter-CMP (Kiel, Germany).
The zirconium solution (Zr 1 g L−1) served as a permanent modifier, whereas solutions of calcium nitrate in acetic acid (Ca 1 g L−1), magnesium nitrate (Mg 1 g L−1) and palladium acetate (Pd 10 g L−1) in nitric acid (15%) were used as chemical modifiers.
Aqueous samples of GSH were prepared by dissolving an appropriate amount of GSH in ultrapure water, then diluting to the working concentrations with pure water. The solutions were prepared fresh every day.
Urine samples were provided by a male volunteer. According to the ethical review committee of the University of Greifswald, no ethical vote was mandatory for the particular usage of the samples as part of the current study.

2.2. Instrumentation

All the measurements were performed with a high-resolution continuum-source atomic absorption spectrometer of the contrAA 700 series (Analytik Jena, Jena, Germany) based on the graphite furnace (GF) technique.
Pyrolytically coated standard graphite tubes with a platform (Analytik Jena) were inserted into the electrothermally, transversely heated graphite furnace and served as the atomizer. The spectrometer was equipped with an MPE 60 graphite furnace auto sampler (Analytik Jena) to directly inject the liquid samples stored in 1.5 mL polystyrole sample cups (Sarstedt, Nürmbrecht, Germany) onto the platform of the tubes. The continuum light source ranging from 185 nm to 900 nm was provided by a xenon short-arc lamp. The high resolution is based on a double monochromator with a quartz prism pre-monochromator, an echelle grating monochromator and a linear charge couple device array detector. Argon (Air Liquide, Düsseldorf, Germany) was employed as a protective and purge gas. The spectrometer was controlled with the software ASpect CS, version 2.2.2.0 (Analytik Jena).

2.3. HR CS MAS Procedure

Prior to first use, the platform of the tubes was impregnated with the zirconium solution. Zirconium is well known to serve as a permanent modifier for graphite furnaces [24]. Therefore, a volume of 40 µL of the zirconium standard solution (Zr 1 g L−1) was injected directly onto the platform, followed by running a temperature program (Table 1), as suggested before, for the deposition of zirconium onto platforms [19]. This operation was conducted ten times, thus obtaining a total amount of 400 µg of the zirconium modifier on the platform.
The quantification of sulfur was based on measuring the integrated absorption of the diatomic molecule CS at the wavelength of 258.0560 nm using three pixels. The time-temperature furnace program finally developed in this study and utilized for the measurements is given below.

3. Results

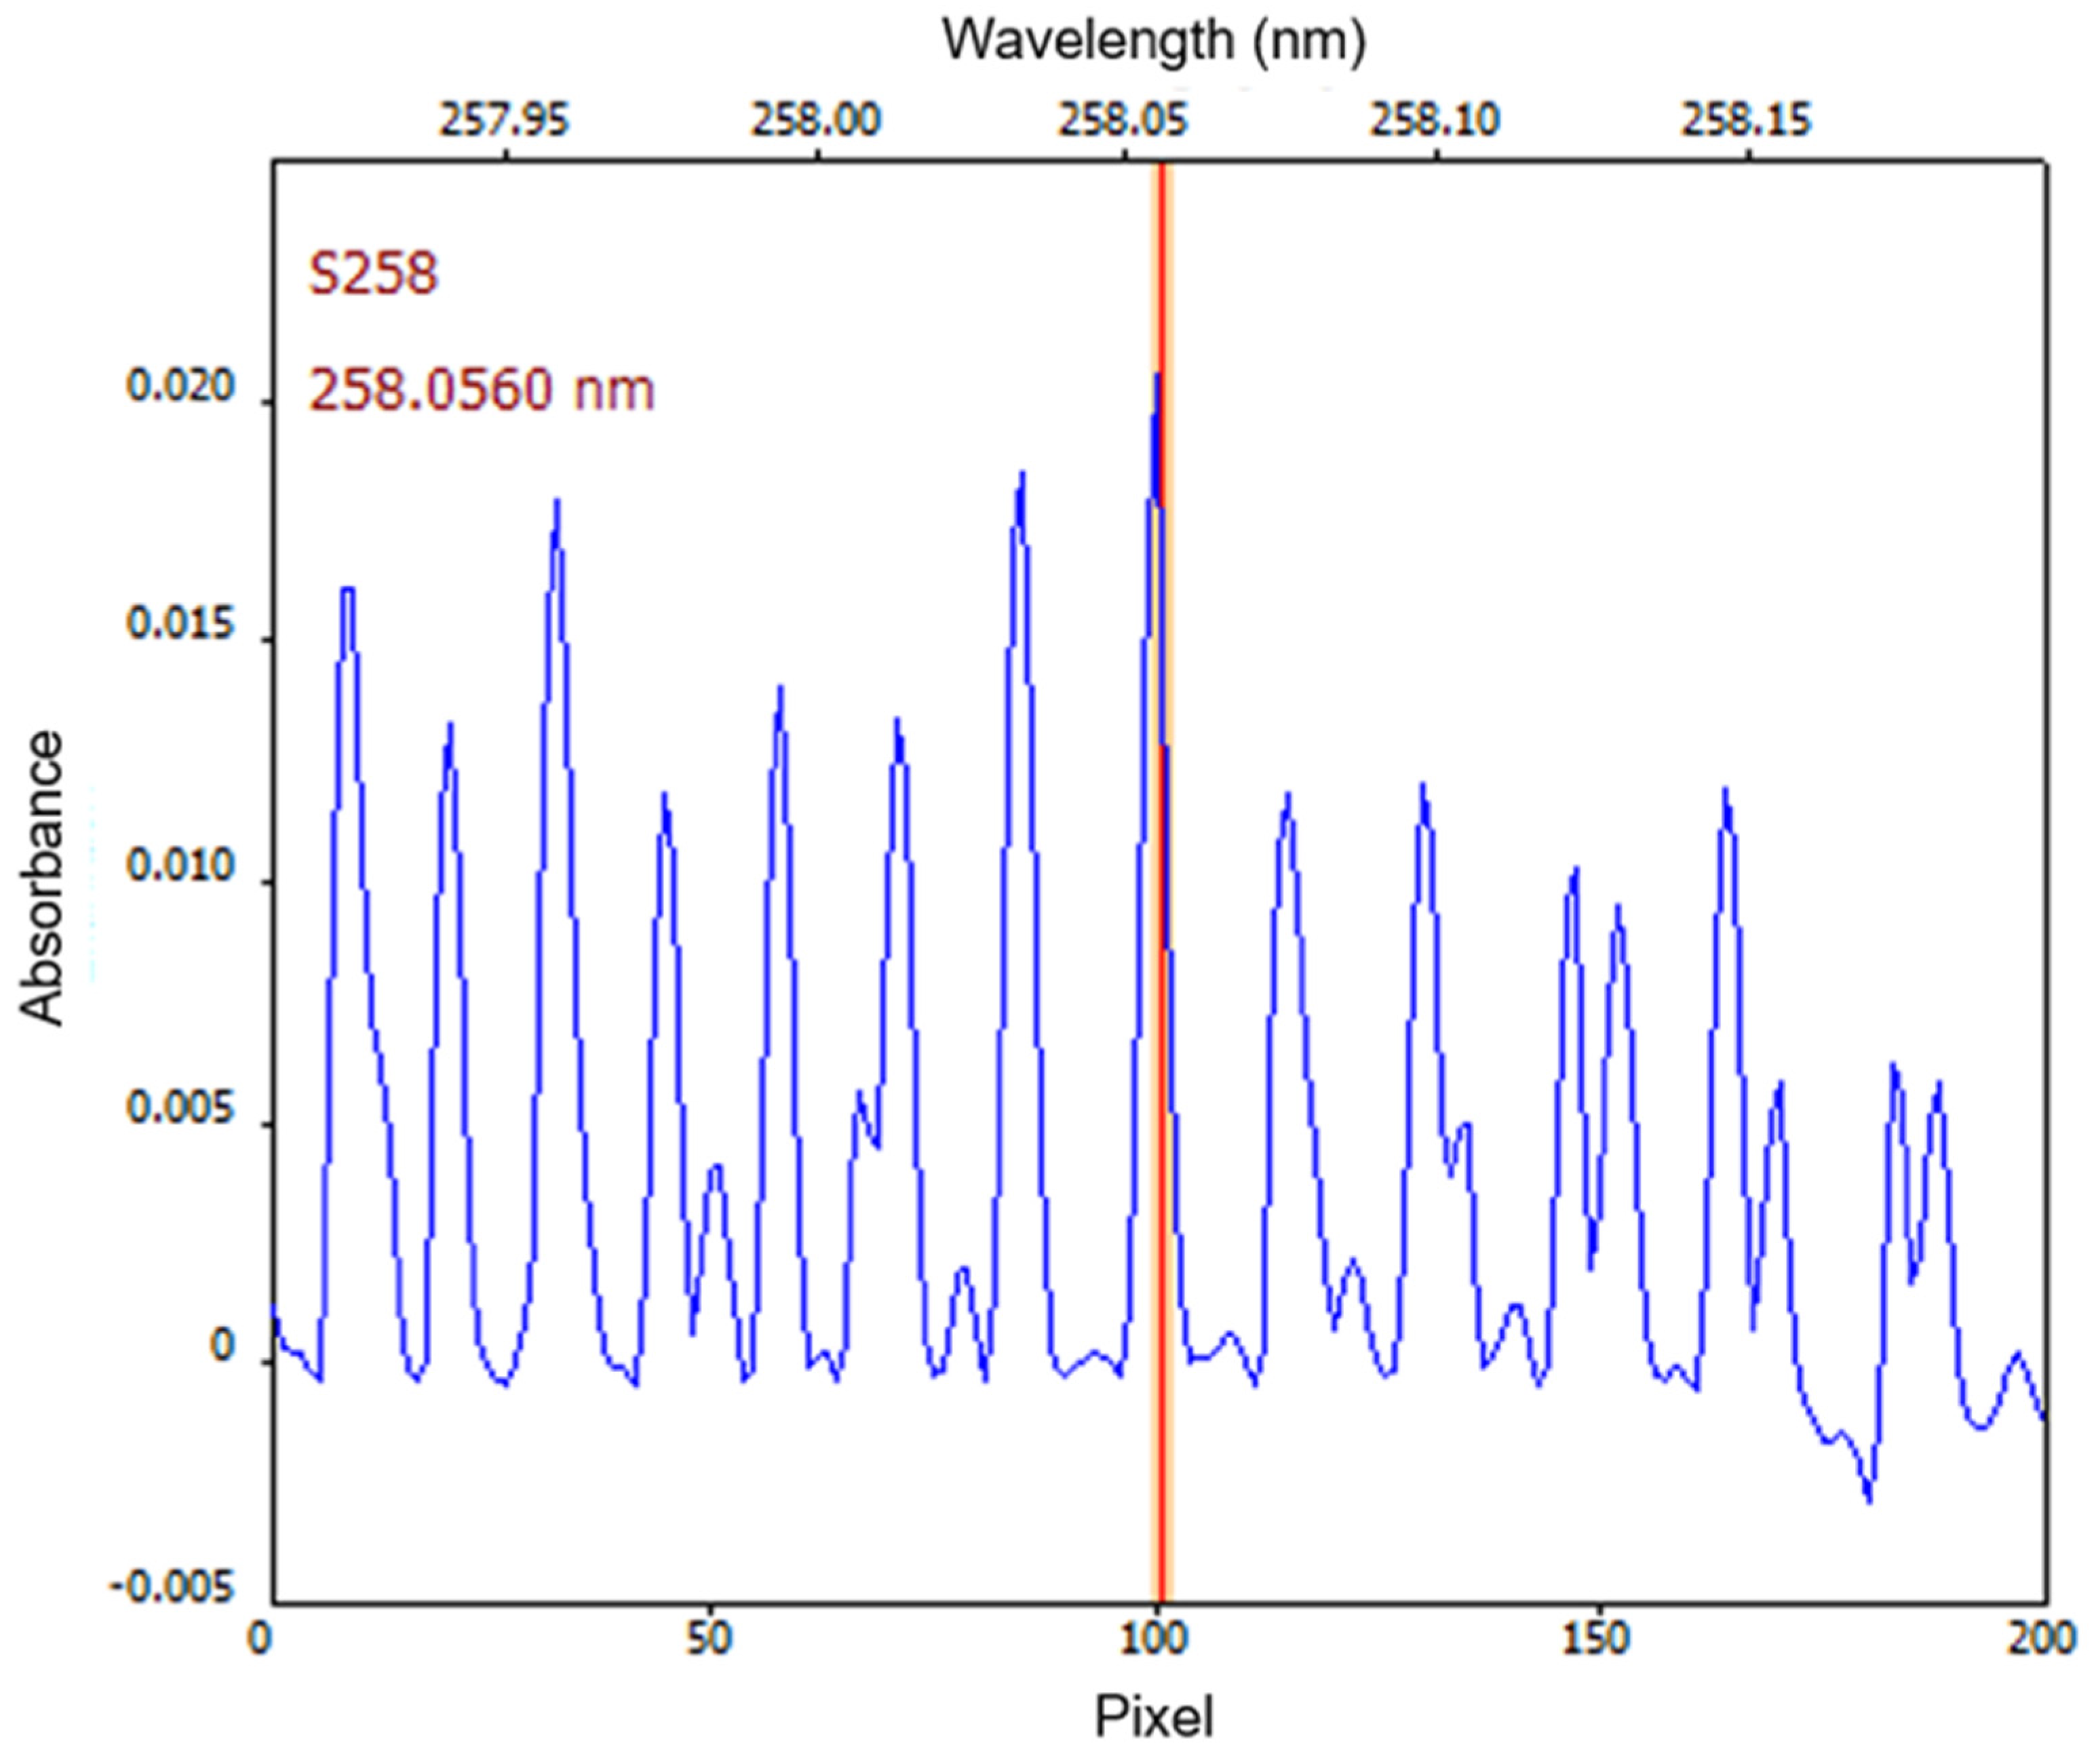
3.1. Selection of the Diatomic Molecule

Several diatomic molecules of sulfur, such as aluminum sulfide and tin sulfide as well as germanium monosulfide and indium monosulfide, were used for the determination of sulfur employing MAS [13]. However, the diatomic molecule CS represents the most commonly adduced molecule for the determination of sulfur based on MAS. The advantages of CS cover its high sensitivity and its ready generation in the graphite tube without the requirement to use an additional molecule-forming reagent [25].
The diatomic molecule CS exhibits distinct molecular absorption at a wavelength of about 258 nm. This absorption belongs to the molecular band system of CS (Δν = 0 vibrational sequence, X1Σ+ → A1Π electronic transition), which is related to sharp absorption bands caused by rotational transitions [12,14,26]. The wavelength of 258.0560 nm was revealed to be most suitable for the assessment of CS. Therefore, this wavelength was already used in a variety of former investigations [27,28,29,30]. It was also selected for the current study with respect to the wavelength-resolved absorbance spectrum of CS around the band head at 258.0560 nm (Figure 2).

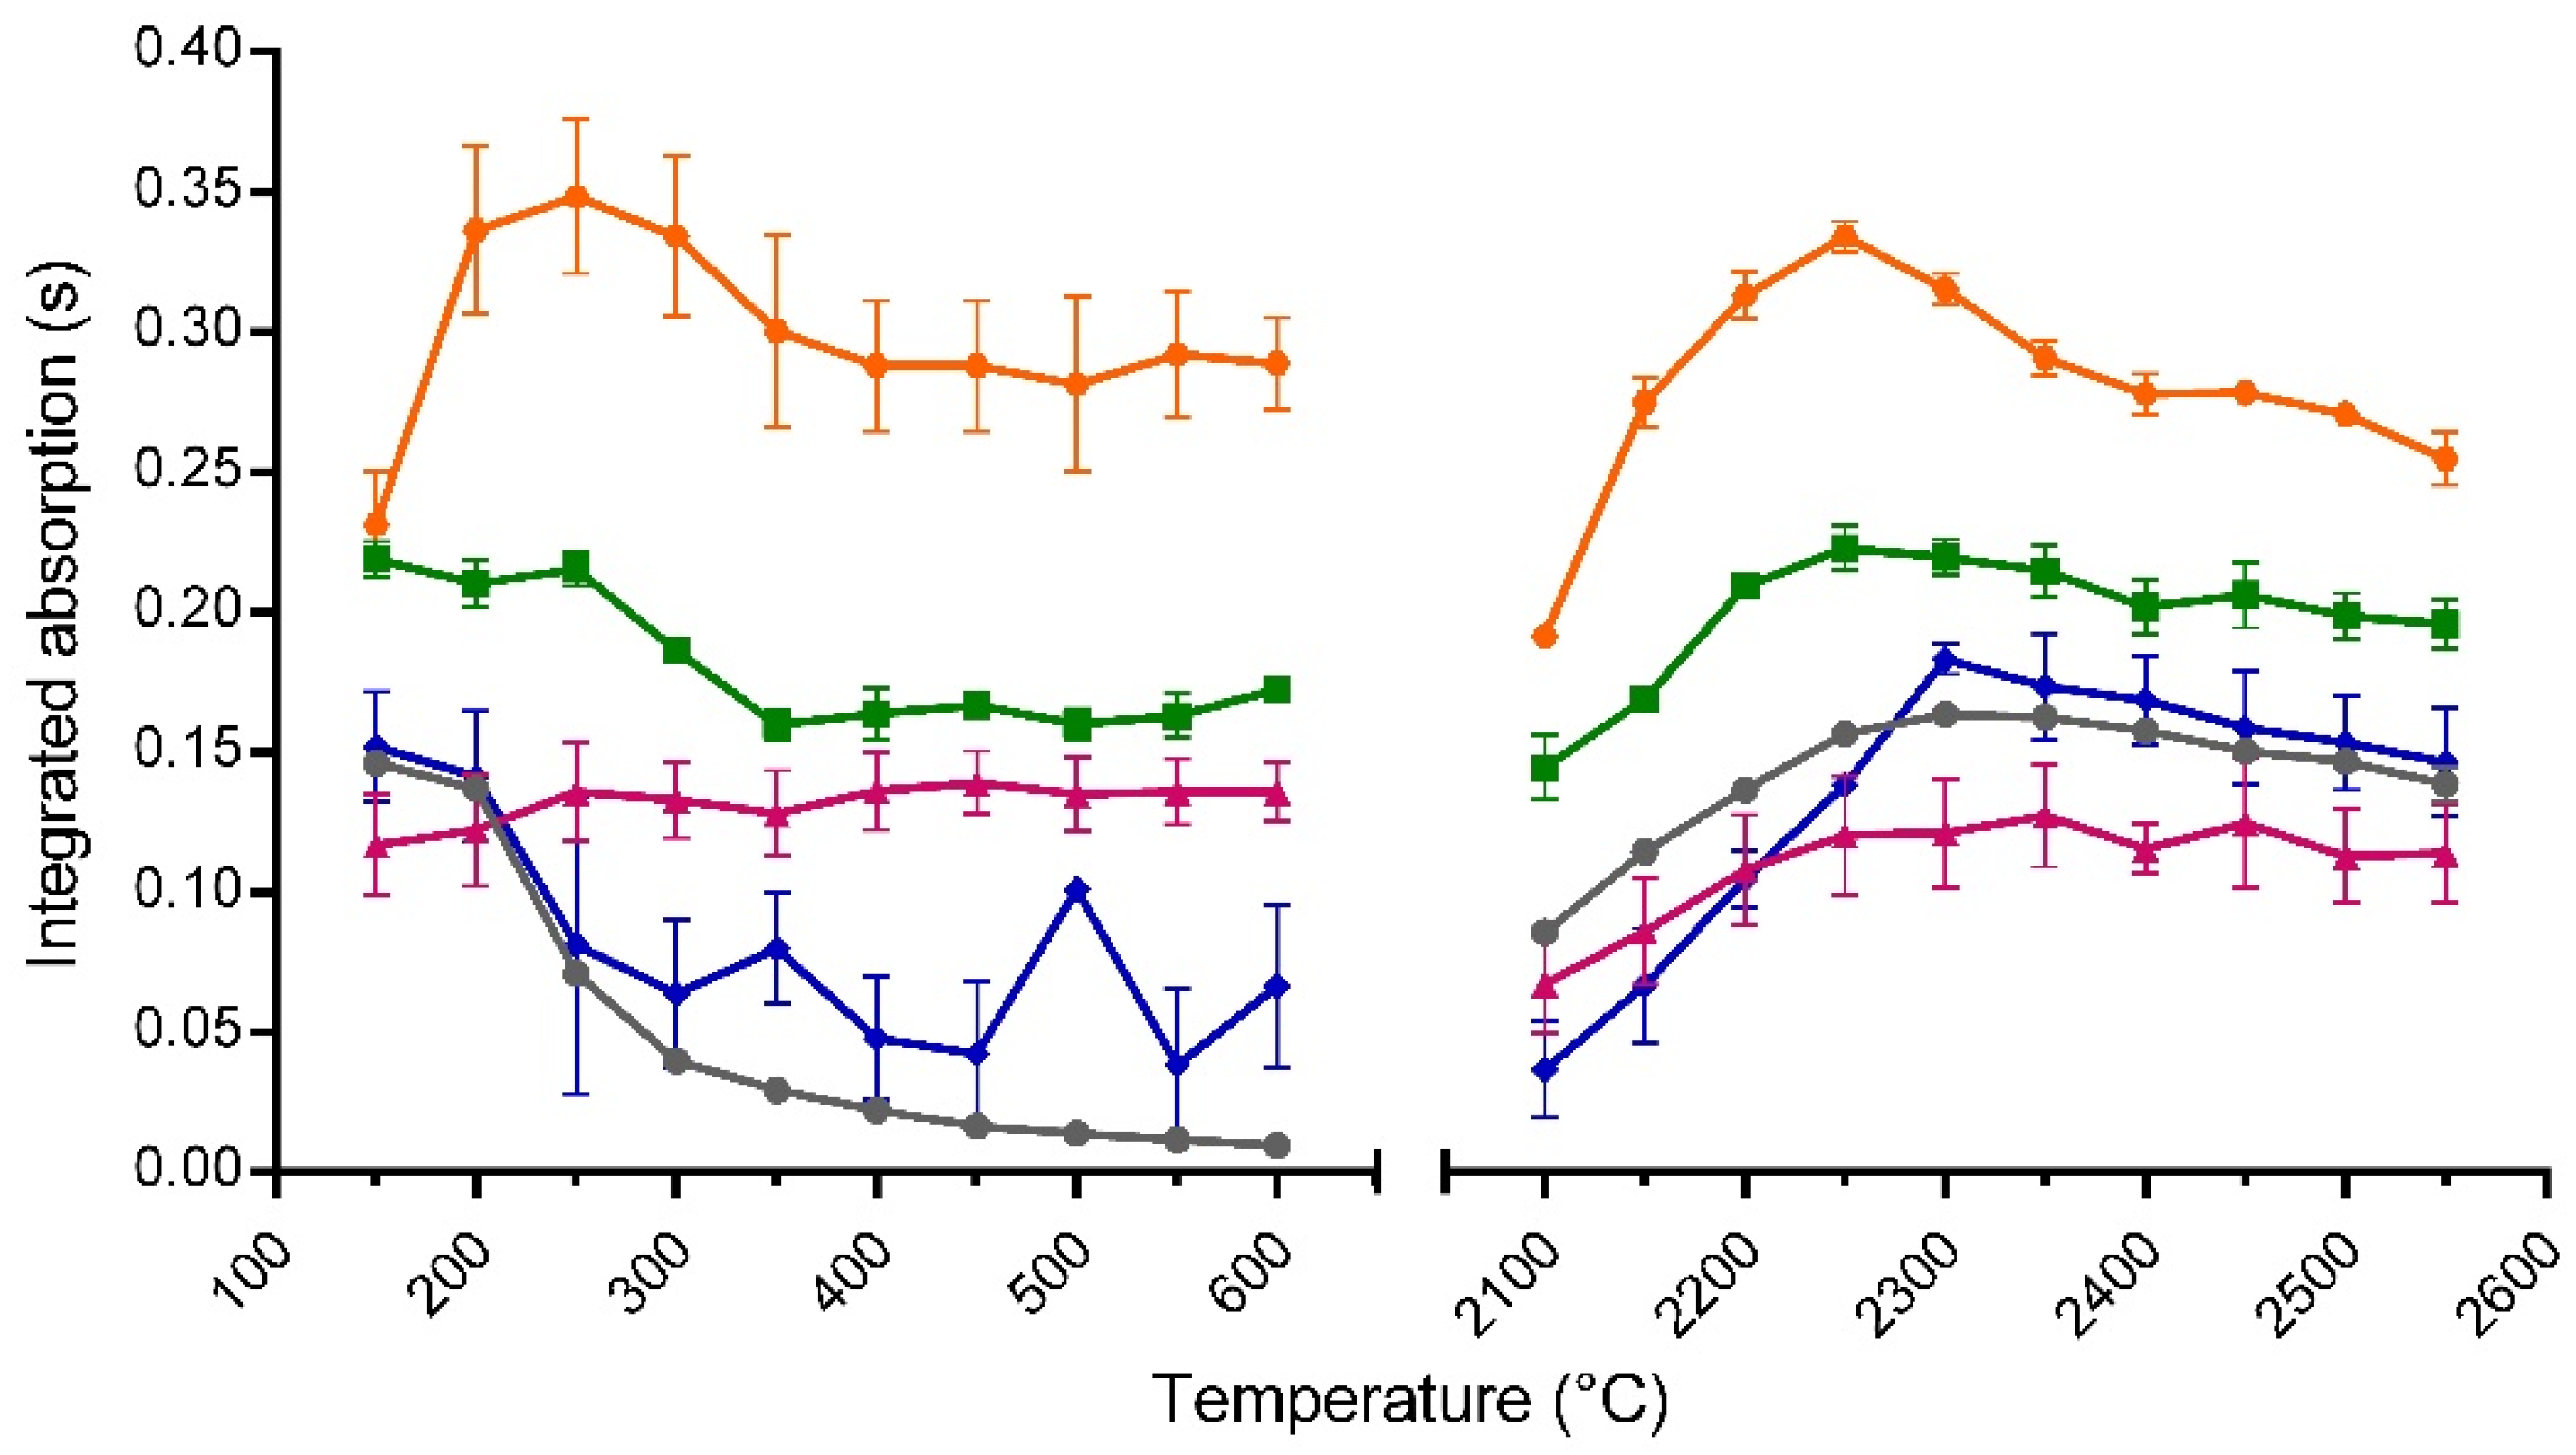
3.2. Optimization of the Pyrolysis/Vaporization Temperatures Considering Modifiers

The pyrolysis and vaporization temperatures represent crucial parameters of the furnace program. The optimization of these temperatures was carried out following the method established by Welz [31]. The procedure was performed in steps of 50 °C (from 150 °C to 600 °C and from 2100 °C to 2550 °C for the pyrolysis and vaporization curve, respectively) with an aqueous solution of GSH (concentration: 50 µg mL−1, injection volume: 10 µL) and a preliminary time-temperature program (with an integration time of 5 s), inspired by former studies [19,32].
Firstly, the sample was assessed by using a graphite tube without either a permanent or a chemical modifier. As was assumed, the analytical signal was tenuous (data not shown). This result is in agreement with former investigations focusing on CS signals arising from organic sulfur [33]. Poor signals could be related to the loss of analyte in terms of carbon disulfide (CS2). The formation of CS2 is undesirable when monitoring sulfur based on CS within MAS analysis since CS2 evaporates at low temperatures before pyrolysis ever takes place [34]. However, the generation of CS2, and probably other volatile molecules, is reduced when a carbide-forming metal is used as modifier. The interaction of the carbon of the graphite tube with the sulfur of the sample is then lowered.
To overcome this problem, the application of zirconium as a permanent modifier is widely established in MAS [24]. Optimization of the temperatures after coating of the platform with zirconium led to curves that indicate a pyrolysis and vaporization temperature of 150 °C and 2300 °C, respectively (Figure 3). A sudden drop of the signal occurred for pyrolysis temperatures greater than 200 °C. Conspicuously, this was accompanied by the rising of white smoke. A relation to the melting point of GSH (195 °C) [35] could be supposed but was not investigated further.
The use of further additives is advantageous in order to stabilize the analyte [36]. Therefore, the influence of different modifiers on the pyrolysis and vaporization temperatures was evaluated (Figure 3). Magnesium and palladium are known as universal modifiers and thus they were selected in the current study [37]. Besides, the use of palladium proved to be successful in multiple studies when measuring sulfur [14,16,27,38,39,40]. This can be related to the strong interaction of palladium with sulfur. It was also considered to determine the effects of calcium, which was shown to be effective within measurements of sulfur based on CS [19,32].
The addition of calcium did not appreciably enhance the absorption signals. As already found in the case of using just zirconium, 150 °C was revealed to be the best pyrolysis temperature. A distinct decline in signal intensity was also observed at temperatures above 200 °C. However, the formation of a fume was not observed on this occasion. After adding calcium, the vaporization curve was comparable as before. Indeed, the maximum absorption signal was slightly enhanced, though 2300 °C was determined again to be the optimal vaporization temperature.
In contrast, the additional use of magnesium as a chemical modifier was inferior to zirconium alone. It was not possible to exceed the maximal absorption signal when optimizing the pyrolysis temperature compared to zirconium coating alone or after adding calcium. However, the absorption signal showed a minimal increase up to a pyrolysis temperature of 250 °C and stayed nearly constant at this level, independent of further rises in temperature. No loss of analyte could be determined at temperatures greater than 200 °C. The vaporization curve after adding magnesium runs parallel to the curve, omitting an additional modifier besides zirconium coating. Unexpectedly, the graph was shifted to lower absorption values. This suggests that magnesium is not most qualified if the relatively lower sensitivity is adduced as a parameter to justify the use as a modifier. However, it might not necessarily represent a decisive factor for the choice of a proper modifier in cases where a high pyrolysis temperature is required, for example, when analyzing samples with a complex composition of the matrix. Then, the effect of the modifier on the thermal stability of the analyte becomes more relevant, making the current behavior of magnesium a remarkable result. Nevertheless, magnesium revealed to not be best suitable in the present analysis of aqueous samples, which can be considered a manageable matrix.
Adding palladium as a chemical modifier to the sample in combination with the permanent zirconium coating yielded the greatest augmentation of the absorption signals when applying one single chemical modifier. The pyrolysis curve documents that the maximal absorption value was increased by about 50% (0.15 → 0.22) compared to using zirconium alone. The temperature of 150 °C was determined to be most useful for the pyrolysis in the current case of using pure aqueous samples. At higher temperatures, the signal was not subject to such a strong decrease as observed with calcium and zirconium or zirconium alone. The absorption signal stayed nearly constant until 250 °C was reached and then dropped approximately by a third to a constant level, still exceeding the values of the other approaches. This documents that palladium exhibited a stabilizing effect on the analyte. The suitability of adding palladium besides the zirconium coating was also confirmed when optimizing the vaporization temperature. The maximal value of the integrated absorption was augmented by about 40% (0.16 → 0.22) when palladium was used in addition to the zirconium coating. Nevertheless, the shape of the signals showed a double peak (Figure 4a), probably suggesting a dual vaporization mechanism and leading to insufficient measurements. Such behavior was already reported in a previous study by another group [19] but was not investigated further in this pilot study.
This issue was remedied by using a mixture of chemical modifiers. The combination of palladium with magnesium did not prove to be as beneficial as reported in earlier publications [17,33]. Hence, this combination was not experimented with further in the current study. However, using palladium and calcium along with the permanent zirconium coating appears promising with respect to improve the peak shape and the absorption value. In order to evaluate the most suitable combination of the modifiers, different volumes of modifier were pipetted onto the sample and the signal was monitored (Table 2). This approach was performed with pyrolysis and vaporization temperatures of 150 °C and 2300 °C, respectively, as elaborated so far.
In an initial approach, a volume of 10 µL of the palladium modifier resulted in the highest absorption value compared to 5 µL and 15 µL. These findings indicate that the amount of modifier determines the extent of the signals. Furthermore, a volume effect can be excluded since adding both lower (5 µL) and higher (15 µL) volumes to the sample did not cause the highest signal.
Then, the amount of palladium was kept constant and the amount of additional calcium modifier was varied, using volumes from 2 µL to 8 µL. Increasing amounts of the calcium modifier were accompanied by a broadening and tailing of the peak. Consequently, these signals no longer had a Gaussian-like shape and were not fully covered by the integration over 5 s as the signals were cut off.
Thus, the integration time was prolonged to 7 s and the combinations of either 2 µL or 4 µL of calcium modifier with 10 µL of the palladium modifier were investigated. The highest absorption value was achieved when a volume of 2 µL of the calcium modifier was used; a nearly symmetrical signal was obtained under these conditions (Figure 4b).
Finally, the pyrolysis and the vaporization temperatures were optimized, considering 10 µL of the palladium (10 g L−1) combined with 2 µL of the calcium (1 g L−1) as a chemical modifier. Remarkably, this particular combination generated even higher absorption values than using palladium alone. The signal after adding only palladium as a chemical modifier was increased by about 75% (0.20 → 0.35) when the combination was used (Figure 3). Besides, the optimal pyrolysis temperature was revealed to be 250 °C. This temperature exceeds the value of 150 °C as elaborated in the case of using each palladium or calcium alone. Elevated pyrolysis temperatures generally assist in the elimination of matrix during the analysis of samples with complex matrices. However, this is not indispensable in the current analysis of aqueous samples but it was followed because thereby the highest signals were obtained. The optimized vaporization temperature appeared to be 2250 °C. This is slightly lower than that developed for the single modifiers, likely saving the lifetime of the graphite tubes.
In conclusion, the optimization of the furnace program revealed that the pyrolysis and vaporization temperatures of 250 °C and 2250 °C, respectively, were optimal. The final time-temperature program is outlined in Table 3. Moreover, adding 10 µL of the palladium modifier (10 g L−1) combined with 2 µL of the calcium modifier (1 g L−1), equal to 10 µg of palladium and 2 µg of calcium, as well as the permanent impregnation of the platform with zirconium resulted in the highest absorption values.

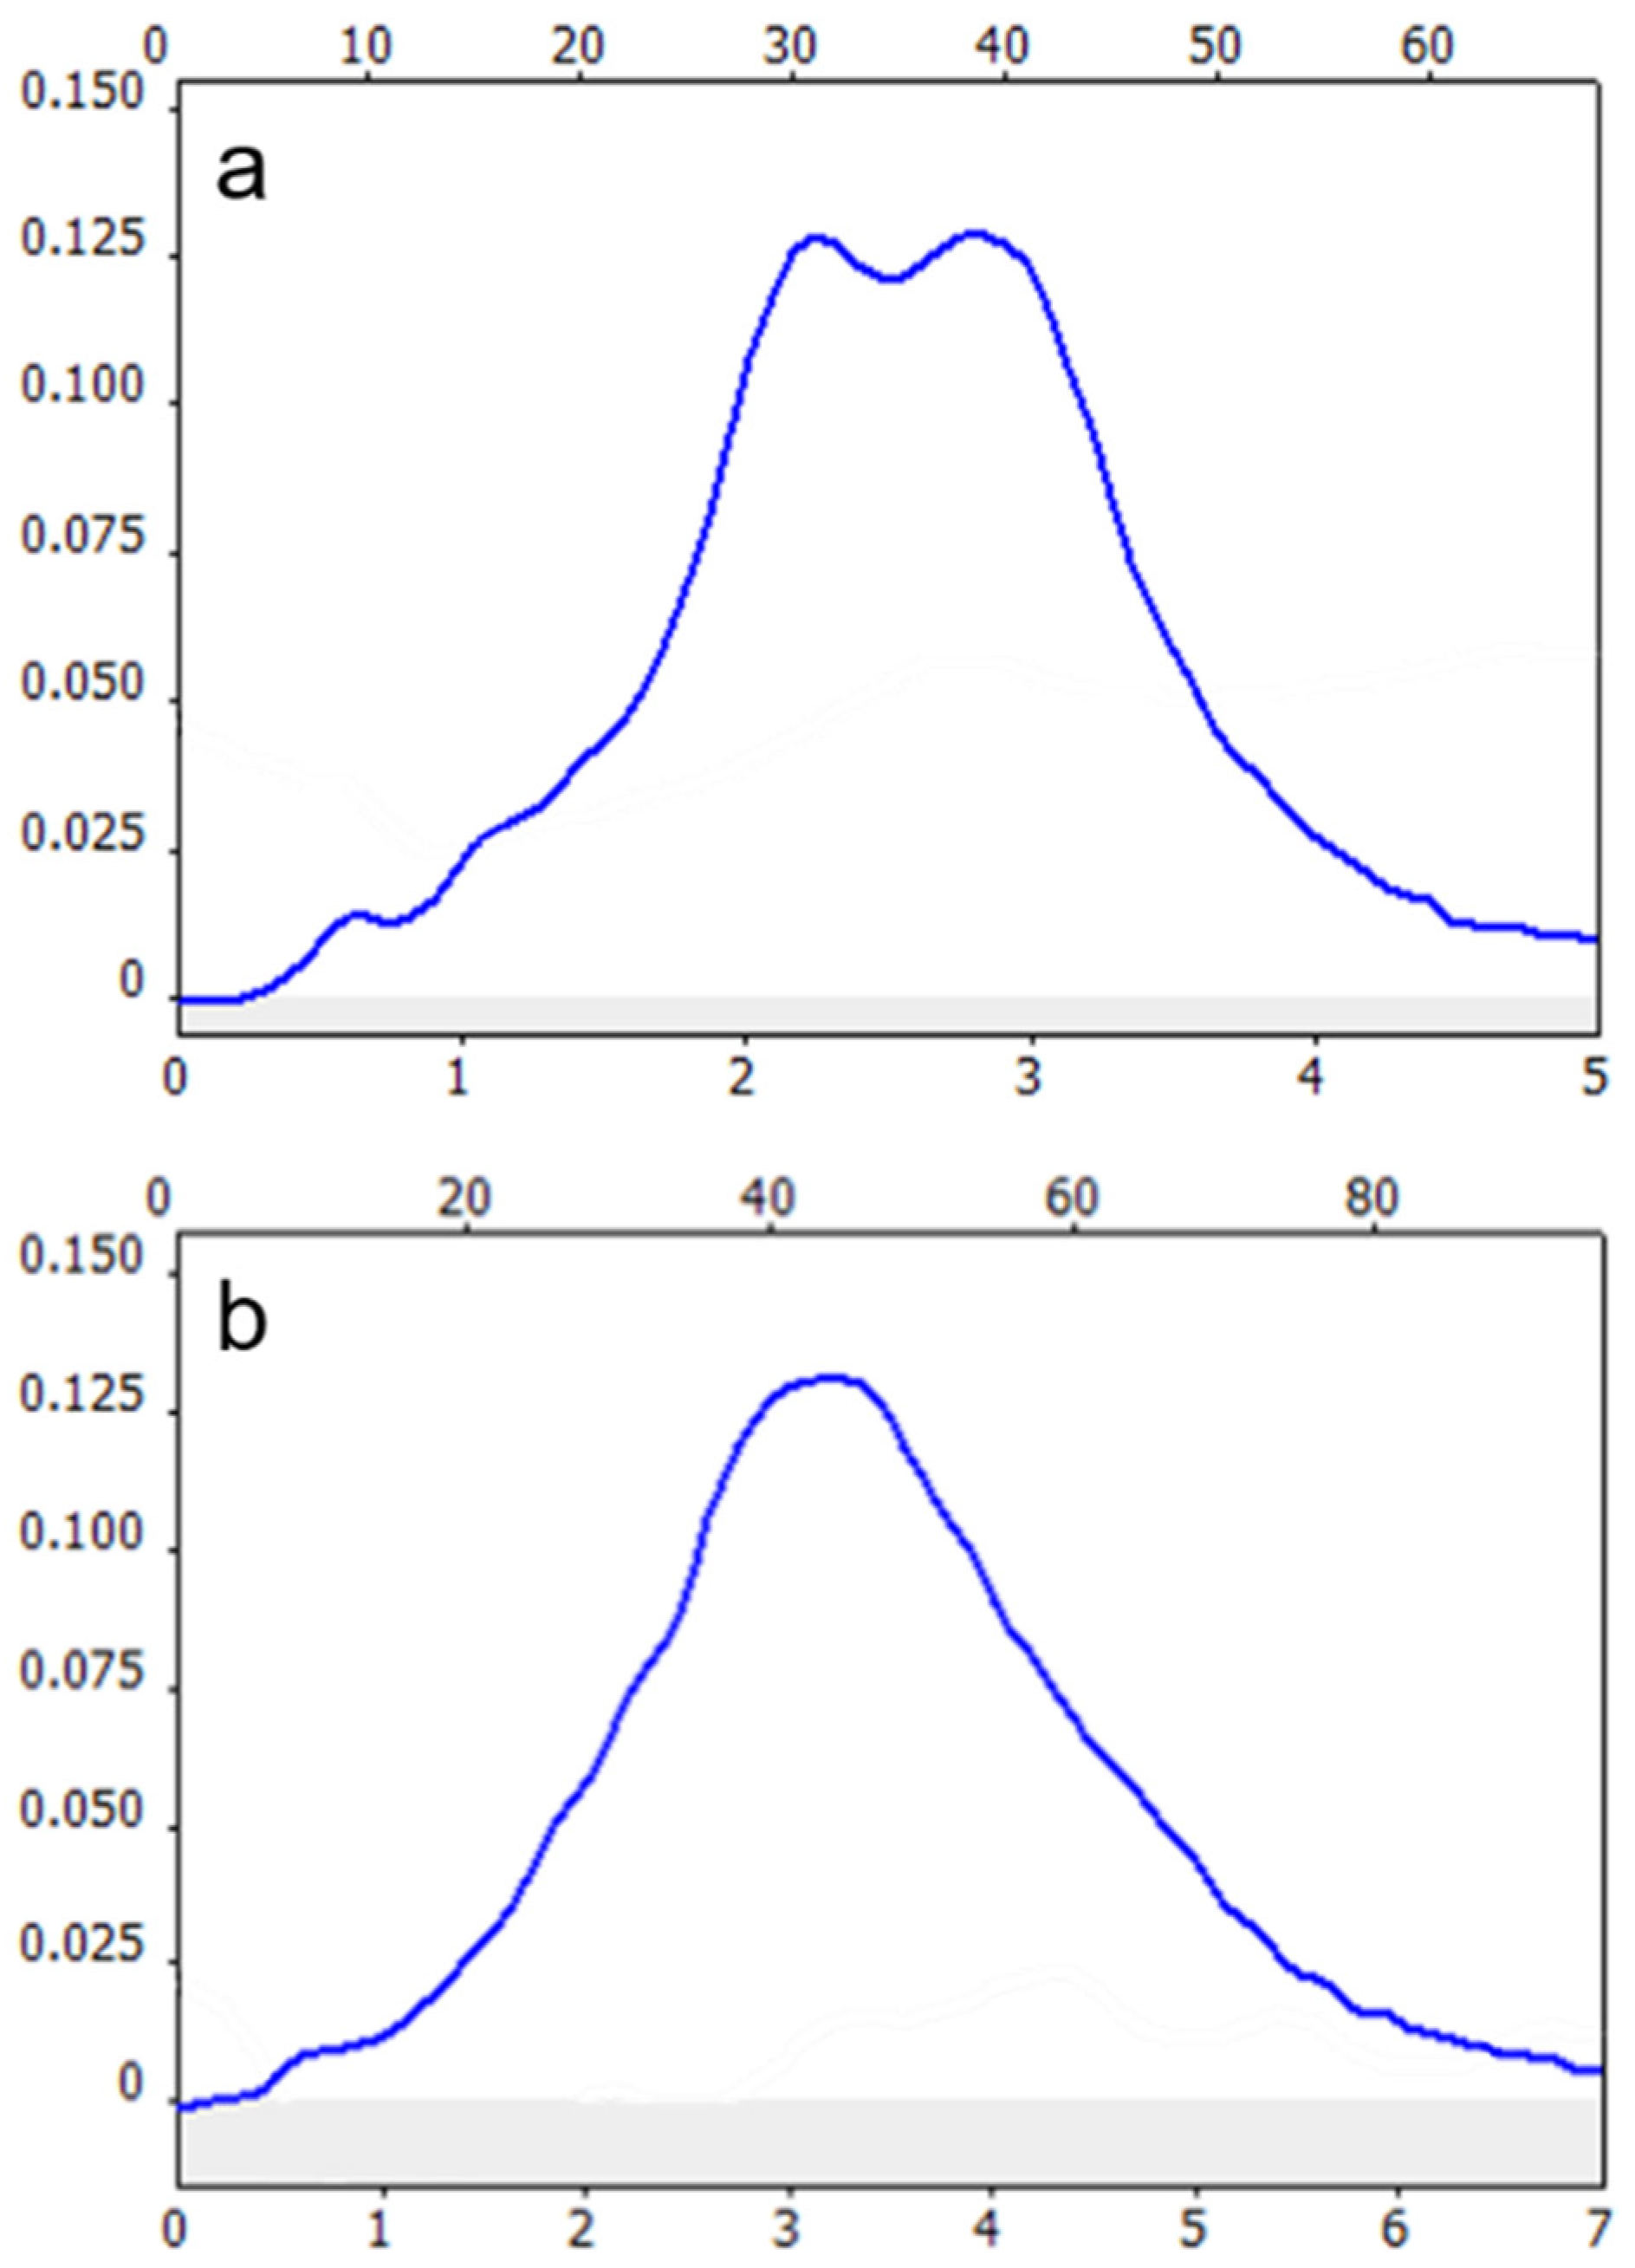
3.3. Calibration and Figures of Merit

A calibration curve utilizing a blank and nine aqueous standard solutions of GSH ranging from the blank up to 100 µg mL−1 of sulfur was investigated. The linear regression curve showed a squared correlation coefficient R2 of 0.9971.
The characteristic mass (m0) represents an established parameter of absorption spectrometry. It is defined as the mass of analyte that gives an integrated absorption signal of 0.0044 s. The characteristic mass of the elaborated method can be calculated using a datapoint obtained as part of the analytical curve according to the following Equation (1):
m 0 ( ng ) = volume   ( μ L )   ·   concentration   ( ng / μ L ) ·   0.0044   s   integrated   absorption   ( s ) .
Considering the integrated absorption (0.44523 s) after injecting 10 μL of a stock solution containing 60 μg mL−1 (equal to 60 ng μL−1) of sulfur, the characteristic mass accounted for 5.9 ng of sulfur contained in GSH.
Both the limit of detection (LOD) and the limit of quantification (LOQ) were evaluated. Therefore, the aqueous blank was measured eleven times. Notably, the used modifiers did not cause increased absorption values. The LOD and LOQ were calculated as the mean ( x ¯ ) of the blank augmented by the three-fold and ten-fold of its standard deviation (SD), respectively, according to Equations (2) and (3):
L O D = x ¯ + 3   S D
L O Q = x ¯ + 10   S D .
The LOD amounted to 2.1 µg mL−1 and the LOQ was 4.3 µg mL−1 of sulfur or else 0.06 mmol L−1 and 0.013 mmol L−1 of GSH, respectively. Indeed, these limits are inferior to the LODs achieved with other methods as reviewed before [8]. Nevertheless, the concentrations obtained in the present study coincide with the cellular level of GSH (0.1–15 mmol L−1) [3], thus making the method principally suitable to quantify GSH in physiological concentrations. However, it should be noted that developing a competitive method for the quantification of GSH was not aimed for in the current study. GSH solely served as an example to prove the general applicability of MAS to the analysis of oligopeptides.
In order to assess the recovery of the elaborated HR CS MAS method for the determination of GSH, the tripeptide was dissolved in urine, representing a real matrix. Urine samples spiked with GSH in the concentrations 5, 10, 50 and 100 µg mL−1 sulfur were analyzed. Unfortunately, very high absorption values (>2.3) were obtained. After subsequent measurement of urine only, the values were related to the matrix. However, no quantification was feasible since such high absorption values cover the range where no linear correlation between concentration and signal exists anymore.
In summary, the figures of merit (Table 4) of the current method for quantifying aqueous samples of the tripeptide GSH by HR CS MAS indeed did not exceed the analytical parameters found for earlier studies that assess sulfur for example in terms of Cys [16,17,19]. Nevertheless, herewith a method was elaborated which principally allows for the quantification of a peptide by MAS. This evidences that MAS is not facing a mid-life crisis as supposed recently [41]. It still represents an attractive and seminal analytical technique. The investigations should serve as groundwork to ignite further development and optimization of analytically more competent methods.

4. Discussion and Conclusions

In the current study, HR CS MAS has been applied for the first time to quantify an oligopeptide in aqueous solutions. On the example of the tripeptide GSH, a method was elaborated to measure sulfur based on the absorption of CS at the wavelength of 258.0560 nm. The furnace program was optimized regarding the pyrolysis and vaporization temperatures, which were found ideally to be 250 °C and 2250 °C, respectively. The highest absorption values were achieved when the platform of the graphite tube was permanently coated with zirconium (total amount of 400 µg), combined with a mixture of palladium (10 µL, 10 g L−1) and calcium (2 µL, 1 g L−1) as chemical modifiers.
Using HR CS MAS for the determination of GSH seems advantageous compared to other previously reported techniques such as HPLC analysis. Chemical modification would be necessary to allow for detection based on UV-Vis or fluorescence during analysis with HPLC. Such a modification can be omitted in the case of employing HR CS MAS. Indeed, detection without modification is possible when HPLC is connected to mass spectrometry. However, such devices have the drawback of high acquisition costs. Besides, the analysis with MAS is less expensive compared to HPLC as the latter method requires quantities of ultrapure solvents. The waiver of organic solvents and prevention of waste makes MAS a more ecologically friendly method (green chemistry). Furthermore, the analysis time covers only about two minutes in the case of the present MAS method whereas HPLC runs are by far more time consuming.
The general applicability of MAS to determine GSH based on sulfur was confirmed, but broad signals were obtained. Prolongation of the vaporization step and large transient peaks are actually unwanted because they affect precision, reduce lifetime of the graphite tubes and may cause memory effect. Such broadened peaks are often indicative of an insufficient vaporization temperature. However, this can be excluded since the vaporization temperature was optimized.
The recovery attempt exemplarily using urine samples revealed that sulfur might not be an appropriate tracer. A variety of sulphurous compounds is excreted by urine [42] or occurring in other biological samples. Therefore, it seems very challenging to measure GSH selectively in the presence of other sulfur-containing compounds. However, this was not the aim of the current study but represents a subject for improvement in the future. Previous research has already reported on the determination of sulfur in complex samples such as food and vegetable samples [28,29,38], as well as in wine [26] and different biological liquid samples [32], thus representing quite a feasible task for upcoming investigations. In order to allow for an exact determination of GSH, modifications of the procedure (e.g., sample preparation) would be necessary.
In order to apply HR CS MAS for the assessment of oligopeptides in real samples, a distinct tracer is essential. Further development could be based on fluorine instead of sulfur. Fluorination was already confirmed by us to be exploited successfully for bioanalytical labelling in the scope of MAS [43]. The consideration of fluorinated amino acids allows for the design of fluorine-labelled oligopeptides [44], which would be quantifiable with MAS more selectively. However, the use of a molecule-forming reagent would then become necessary.
Nevertheless, the present procedure shows, for the first time, the general suitability of MAS for the quantification of peptides and thus extends the applicability of this technique. Therefore, the current study provides the groundwork for further advancement in order to establish MAS as a valuable tool for the analytical determination of peptides.

Author Contributions

Conceptualization: D.B.; formal analysis: D.B.; investigation: D.B.; methodology: D.B.; project administration: D.B.; resources: S.G.; visualization: D.B.; writing—original draft: D.B.; writing—review and editing: S.G. All authors have read and agreed to the published version of the manuscript.

Funding

We acknowledge support for the Article Processing Charge from the DFG (German Research Foundation, 393148499) and the Open Access Publication Fund of the University of Greifswald.

Institutional Review Board Statement

Not applicable.

Acknowledgments

Technical support by the application department of Analytik Jena is kindly acknowledged.

Conflicts of Interest

The authors declare no conflict of interest.

Abbreviations

The following abbreviations are used in this manuscript:
AASAtomic absorption spectrometry
CECapillary electrophoresis
CSCarbon monosulfide
CysL-Cysteine
GFGraphite furnace
GluL-Glutaminic acid
GlyGlycin
GSHGlutathione
GSSGGlutathione disulfide
HPLCHigh-performance liquid chromatography
HR CS MASHigh-resolution continuum-source MAS
LODLimit of detection
LOQLimit of quantification
MASMolecular absorption spectrometry
RSDRelative standard deviation
SDStandard deviation

References

  1. Kent, S.B.H. The critical role of peptide chemistry in the life sciences. J. Pept. Sci. 2015, 21, 136–138. [Google Scholar] [CrossRef]
  2. Orenius, S.; Moldeus, P. The multiple roles of glutathione in drug metabolism. Trends Pharmacol. Sci. 1984, 5, 432–435. [Google Scholar] [CrossRef]
  3. Deponte, M. Glutathione catalysis and the reaction mechanisms of glutathione-dependent enzymes. Biochim. Biophys. Acta BBA-Gen. Subj. 2013, 1830, 3217–3266. [Google Scholar] [CrossRef] [Green Version]
  4. Chen, W.; Yue, X.; Zhang, H.; Li, W.; Zhang, L.; Xiao, Q.; Huang, C.; Sheng, J.; Song, X. Simultaneous detection of glutathione and hydrogen polysulfides from different emission channels. Anal. Chem. 2017, 89, 12984–12991. [Google Scholar] [CrossRef]
  5. Wu, G.; Fang, Y.-Z.; Yang, S.; Lupton, J.R.; Turner, N.D. Glutathione metabolism and its implications for health. J. Nutr. 2004, 134, 489–492. [Google Scholar] [CrossRef] [PubMed] [Green Version]
  6. Townsend, D.M.; Tew, K.D.; Tapiero, H. The importance of glutathione in human disease. Biomed. Pharmacother. 2003, 57, 145–155. [Google Scholar] [CrossRef]
  7. Chen, X.; Zhou, Y.; Yoon, J. Fluorescent and colorimetric probes for detection of thiols. Chem. Soc. Rev. 2010, 39, 2120–2135. [Google Scholar] [CrossRef] [PubMed]
  8. Hamad, A.; Elshahawy, M.; Negm, A.; Mansour, F.R. Analytical methods for determination of glutathione and glutathione disulfide in pharmaceuticals and biological fluids. Rev. Anal. Chem. 2019, 38, 20190019. [Google Scholar] [CrossRef]
  9. Yu, J.; Li, C.; Shen, S.; Liu, X.; Peng, Y.; Zheng, J. Mass spectrometry based detection of glutathione with sensitivity for single-cell analysis. Rapid Commun. Mass Spectrom. 2015, 29, 681–689. [Google Scholar] [CrossRef]
  10. Sakuragi, M.; Zushi, T.; Seguchi, R.; Arai, T.; Taguchi, K.; Kusakabe, K. Locational analysis of glutathione in liposomes by using small-angle X-ray scattering. Chem. Lett. 2017, 46, 185–187. [Google Scholar] [CrossRef]
  11. Camera, E.; Picardo, M. Analytical methods to investigate glutathione and related compounds in biological and pathological processes. J. Chromatogr. B Analyt. Technol. Biomed. Life Sci. 2002, 781, 181–206. [Google Scholar] [CrossRef]
  12. Heitmann, U.; Becker-Ross, H.; Florek, S.; Huang, M.D.; Okruss, M. Determination of non-metals via molecular absorption using high-resolution continuum source absorption spectrometry and graphite furnace atomization. J. Anal. At. Spectrom. 2006, 21, 1314–1320. [Google Scholar] [CrossRef]
  13. Ozbek, N.; Baysal, A. Determination of sulfur by high-resolution continuum source atomic absorption spectrometry: Review of studies over the last 10 years. Trends Anal. Chem. 2017, 88, 62–76. [Google Scholar] [CrossRef]
  14. Ferreira, H.S.; Lepri, F.G.; Welz, B.; Carasek, E.; Huang, M.-D. Determination of sulfur in biological samples using high-resolution molecular absorption spectrometry in a graphite furnace with direct solid sampling. J. Anal. At. Spectrom. 2010, 25, 1039–1045. [Google Scholar] [CrossRef]
  15. Welz, B.; Lepri, F.G.; Araujo, R.G.O.; Ferreira, S.L.C.; Huang, M.-D.; Okruss, M.; Becker-Ross, H. Determination of phosphorus, sulfur and the halogens using high-temperature molecular absorption spectrometry in flames and furnaces—A review. Anal. Chim. Acta 2009, 647, 137–148. [Google Scholar] [CrossRef] [PubMed]
  16. Resano, M.; Florez, M.R. Direct determination of sulfur in solid samples by means of high-resolution continuum source graphite furnace molecular absorption spectrometry using palladium nanoparticles as chemical modifier. J. Anal. At. Spectrom. 2012, 27, 401–412. [Google Scholar] [CrossRef]
  17. Mior, R.; Mores, S.; Welz, B.; Carasek, E.; de Andrade, J.B. Determination of sulfur in coal using direct solid sampling and high-resolution continuum source molecular absorption spectrometry of the CS molecule in a graphite furnace. Talanta 2013, 106, 368–374. [Google Scholar] [CrossRef] [Green Version]
  18. Camera, A.S.; Arcenio, P.P.; de Oliveira, W.; Filho, P.; de Andrade Maranhao, T.; de Oliveira, F.J.S.; Frescura, V.L.A. Method development and validation for sulfur determination via CS molecule in petroleum green coke by high resolution continuum source molecular absorption spectrometry. Microchem. J. 2017, 134, 301–308. [Google Scholar] [CrossRef]
  19. Vieira, A.A.; Pereira, E.R.; Carasek, E.; Welz, B. The use of Ca + Pd + Zr as modifiers in the determination of sulfur by HR-CS GF MAS with solid sampling. J. Anal. At. Spectrom. 2019, 34, 498–503. [Google Scholar] [CrossRef]
  20. Pignataro, M.F.; Herrera, M.G.; Dodero, V.I. Evaluation of peptide/protein self-assembly and aggregation by spectroscopic methods. Molecules 2020, 25, 4854. [Google Scholar] [CrossRef]
  21. Ruggeri, F.S.; Mannini, B.; Schmid, R.; Vendruscolo, M.; Knowles, T.P.J. Single molecule secondary structure determination of proteins through infrared absorption nanospectroscopy. Nat. Commun. 2020, 11, 2945. [Google Scholar] [CrossRef]
  22. Lorenz-Fonfria, V.A. Infrared difference spectroscopy of proteins: From bands to bonds. Chem. Rev. 2020, 120, 3466–3576. [Google Scholar] [CrossRef]
  23. Evans, E.H.; Pisonero, J.; Smith, C.M.M.; Taylor, R.N. Atomic spectrometry update: Review of advances in atomic spectrometry and related techniques. J. Anal. At. Spectrom. 2021, 36, 868–891. [Google Scholar] [CrossRef]
  24. Abad, C.; Florek, S.; Becker-Ross, H.; Huang, M.-D.; Buzanich, A.G.; Radtke, M.; Lippitz, A.; Hodoroaba, V.-D.; Schmid, T.; Heinrich, H.-J.; et al. Zirconium permanent modifiers for graphite furnaces used in absorption spectrometry: Understanding their structure and mechanism of action. J. Anal. At. Spectrom. 2018, 33, 2034–2042. [Google Scholar] [CrossRef]
  25. Huang, M.D.; Becker-Ross, H.; Florek, S.; Abad, C.; Okruss, M. Investigation of high-resolution absorption spectra of diatomic sulfides of group 14 elements in graphite furnace and the comparison of their performance for sulfur determination. Spectrochim. Acta B 2017, 135, 15–21. [Google Scholar] [CrossRef]
  26. Huang, M.D.; Becker-Ross, H.; Florek, S.; Heitmann, U.; Okruss, M. Direct determination of total sulfur in wine using a continuum-source atomic-absorption spectrometer and an air-acetylene flame. Anal. Bioanal. Chem. 2005, 382, 1877–1881. [Google Scholar] [CrossRef] [PubMed]
  27. Kowalewska, Z. Feasibility of high-resolution continuum source molecular absorption spectrometry in flame and furnace for sulphur determination in petroleum products. Spectrochim. Acta B 2011, 66, 546–556. [Google Scholar] [CrossRef]
  28. Ozbek, N.; Akam, S. Determination of total sulfur in food samples by solid sampling high-resolution continuum source graphite furnace molecular absorption spectrometry. J. Agric. Food Chem. 2013, 61, 4816–4821. [Google Scholar] [CrossRef]
  29. Ozbek, N.; Baysal, A. A new approach for the determination of sulphur in food samples by high-resolution continuum source flame atomic absorption spectrometer. Food Chem. 2015, 168, 460–463. [Google Scholar] [CrossRef] [PubMed]
  30. Ozbek, N.; Baysal, A. Determination of sulfur in human hair using high resolution continuum source graphite furnace molecular absorption spectrometry and its correlation with total protein and albumin. Spectrochim. Acta B 2017, 130, 17–20. [Google Scholar] [CrossRef]
  31. Welz, B.; Sperling, M. Atomabsorptionsspektrometrie, 4th ed.; Wiley-VHS: Weinheim, Germany, 1997; pp. 393–394. [Google Scholar]
  32. Pereira, E.R.; Welz, B.; Vieira, A.A. A systematic look at the carbon monosulfide molecule and chemical modifiers for the determination of sulfur by HR-CS GF MAS. J. Anal. At. Spectrom. 2018, 33, 1394–1401. [Google Scholar] [CrossRef]
  33. Fick, S.S.; Nakadi, F.V.; Fujiwara, F.; Smichowski, P.; Vale, M.G.R.; Welz, B.; de Andrade, J.B. Investigation of spectral interference in the determination of Pb in road dust using high-resolution continuum source graphite furnace atomic absorption spectrometry and direct solid sample analysis. J. Anal. At. Spectrom. 2018, 33, 593–602. [Google Scholar] [CrossRef]
  34. Kaneko, T.; Yashima, Y.; Ahmadi, E.; Natsui, S.; Suzuki, R.O. Synthesis of Sc sulfides by CS2 sulfurization. J. Solid State Chem. 2020, 285, 121268. [Google Scholar] [CrossRef]
  35. Alanazi, A.M.; Mostafa, G.A.E.; Al-Badr, A.A. Profiles of Drug Substances, Excipients and Related Methodology, 40th ed.; Academic Press: Cambridge, MA, USA, 2015; pp. 43–158. [Google Scholar]
  36. Ortner, H.M.; Bulska, E.; Rohr, U.; Schlemmer, G.; Weinbruch, S.; Welz, B. Modifiers and coatings in graphite furnace atomic absorption spectrometry—mechanisms of action (a tutorial review). J. Anal. At. Spectrom. 2002, 57, 1835–1853. [Google Scholar] [CrossRef]
  37. Schlemmer, G.; Welz, B. Palladium and magnesium nitrates, a more universal modifier for graphite furnace atomic absorption spectrometry. J. Anal. At. Spectrom. 1986, 41, 1157–1165. [Google Scholar] [CrossRef]
  38. Gunduz, S.; Akman, S. Determination of sulphur in various vegetables by solid sampling high-resolution electrothermal molecular absorption spectrometry. Food Chem. 2015, 172, 213–218. [Google Scholar] [CrossRef] [PubMed]
  39. Huber, C.S.; Vale, M.G.R.; Welz, B.; Andrade, J.B.; Dessuy, M.B. Investigation of chemical modifiers for sulfur determination in diesel fuel samples by high-resolution continuum source graphite furnace molecular absorption spectrometry using direct analysis. Spectrochim. Acta B 2015, 108, 68–74. [Google Scholar] [CrossRef]
  40. Dos Passos, A.S.; Dessuy, M.B.; Nakadi, F.V.; de Andrade, J.B.; Vale, M.G.R. Investigation of different chemical modifiers based on the Pd/Mg mixture for the determination of sulfur in shale oil by high-resolution continuum source graphite furnace molecular absorption spectrometry. Talanta 2019, 204, 206–212. [Google Scholar] [CrossRef] [PubMed]
  41. Resano, M.; Garcia-Ruiz, E.; Aramendi, M.; Belarra, M.A. Quo vadis high-resolution continuum source atomic/molecular absorption spectrometry? J. Anal. At. Spectrom. 2019, 34, 59–80. [Google Scholar] [CrossRef] [Green Version]
  42. Curno, R.; Magee, E.A.; Edmond, L.M.; Cummings, J.H. Studies of a urinary biomarker of dietary inorganic sulphur in subjects on diets containing 1–38 mmol sulphur/day and of the half-life of ingested 34SO42−. Eur. J. Clin. Nutr. 2008, 62, 1106–1115. [Google Scholar] [CrossRef]
  43. Baecker, D.; Obermoser, V.; Kirchner, E.A.; Hupfauf, A.; Kircher, B.; Gust, R. Fluorination as tool to improve bioanalytical sensitivity and COX-2-selective antitumor activity of cobalt alkyne complexes. Dalton Trans. 2019, 48, 15856. [Google Scholar] [CrossRef] [PubMed]
  44. Moschner, J.; Stulberg, F.; Fernandes, R.; Huhmann, S.; Leppkes, J.; Koksch, B. Approaches to obtaining fluorinated α-amino acids. Chem. Rev. 2019, 119, 10718–10801. [Google Scholar] [CrossRef] [PubMed]
Figure 1. Chemical structure of the tripeptide glutathione (γ-Glu-Cys-Gly).
Analytica 03 00003 g001
Figure 2. Wavelength-resolved absorbance spectrum of CS (blue curve) in the vicinity of the most prominent wavelength at 258.0560 nm (red line). The orange bar represents the range adduced for the measurement when considering three pixels.
Analytica 03 00003 g002
Figure 3. Pyrolysis (left) and vaporization (right) curves for measuring sulfur based on the absorption of CS. A volume of 10 µL of an aqueous solution of GSH (50 µg mL−1) was used. Zirconium coating () of the graphite tube was employed as permanent modifier and additionally 10 µL of calcium 1 g L−1 (), 10 µL of magnesium 1 g L−1 (), 10 µL of palladium 10 g L−1 (), or 2 µL of calcium 1 g L−1 and 10 µL of palladium 10 g L−1 ( Analytica 03 00003 i001) as chemical modifiers besides zirconium coating. The data represent mean ± standard error of 3 replications (merely 2 conductions for zirconium only) with each 3 injections.
Analytica 03 00003 g003
Figure 4. Shape of the time-resolved absorption signal for the determination of sulfur based on the absorption of CS at 258.0560 nm using a zirconium coated graphite tube. Double-peaked shape when employing only palladium as chemical modifier (a) and Gaussian-like shape when combining palladium and calcium (b).
Analytica 03 00003 g004
Table 1. Time-temperature program used for the coating of the graphite tube with zirconium (according to Vieira et al. [19]).
OperationTemperature
(°C)
Heating Rate
(°C s−1)
Holding Time
(s)
Argon Flow
Drying 1901020Maximal
Drying 2120520Maximal
Pyrolysis4005020Maximal
Atomization100010010Stop
Cleaning20001005Stop
Table 2. Determination of the volume of palladium (10 g L−1) and calcium (1 g L−1) within the generation of the diatomic molecule CS.
Volume (µL)Integration Time (s)Integrated Absorption (s)
PdCa Mean 1RSD (%) 2
5 50.235.3
10 50.255.8
15 50.233.5
10250.285.7
450.261.3
650.262.0
850.235.9
10270.314.4
470.285.2
1 Data represent the mean of 4 injections (rounded to two decimal figures). 2 Relative standard deviation (RSD) given in percent.
Table 3. Elaborated time-temperature program used for the determination of GSH based on measuring sulfur in terms of CS (λ = 258.0560 nm).
OperationTemperature
(°C)
Heating Rate
(°C s−1)
Holding Time
(s)
Argon Flow
Drying 1901010Maximal
Drying 2100510Maximal
Drying 3120510Maximal
Pyrolysis2505015Maximal
Auto-zero25005Stop
Vaporization225030007Stop
Cleaning260010005Maximal
Table 4. Analytical performance parameters of the elaborated method.
ParameterValue (S)Value (GSH)
Linear working range 2.5–100 µg mL−10.078–3.120 mmol L−1
Correlation coefficient of calibration (R2)0.99710.9971
Characteristic mass5.9 ng56.9 ng
LOD2.1 µg mL−10.06 mmol L−1
LOQ4.3 µg mL−10.13 mmol L−1
Publisher’s Note: MDPI stays neutral with regard to jurisdictional claims in published maps and institutional affiliations.

