Article

Optimized Spectrophotometry Method for Starch Quantification

by
Palina Bahdanovich
1,2,
Kevin Axelrod
1,2,
Andrey Y. Khlystov
1 and
Vera Samburova
1,2,*
1
Division of Atmospheric Sciences, Desert Research Institute, Reno, NV 89512, USA
2
Department of Physics, College of Science, University of Nevada, Reno, NV 89557, USA
*
Author to whom correspondence should be addressed.
Analytica 2022, 3(4), 394-405; https://doi.org/10.3390/analytica3040027
Submission received: 14 September 2022 / Revised: 17 October 2022 / Accepted: 21 October 2022 / Published: 26 October 2022

Abstract

:
Starch is a polysaccharide that is abundantly found in nature and is generally used as an energy source and energy storage in many biological and environmental processes. Naturally, starch tends to be in miniscule amounts, creating a necessity for quantitative analysis of starch in low-concentration samples. Existing studies that are based on the spectrophotometric detection of starch using the colorful amylose–iodine complex lack a detailed description of the analytical procedure and important parameters. In the present study, this spectrophotometry method was optimized, tested, and applied to studying starch content of atmospheric bioaerosols such as pollen, fungi, bacteria, and algae, whose chemical composition is not well known. Different experimental parameters, including pH, iodine solution concentrations, and starch solution stability, were tested, and method detection limit (MDL) and limit of quantification (LOQ) were determined at 590 nm. It was found that the highest spectrophotometry signal for the same starch concentration occurs at pH 6.0, with an iodine reagent concentration of 0.2%. The MDL was determined to be 0.22 μg/mL, with an LOQ of 0.79 μg/mL. This optimized method was successfully tested on bioaerosols and can be used to determine starch content in low-concentration samples. Starch content in bioaerosols ranged from 0.45 ± 0.05 (in bacteria) to 4.3 ± 0.06 μg/mg (in fungi).

1. Introduction

Starch is a polysaccharide that is used as an energy source for humans and can be found in different amounts in plants, bacteria, algae, and other microorganisms [1,2,3]. It is an abundant source of energy [4] and one of the most important and plentiful polysaccharides commercially [2]. Its structure consists of amylose and amylopectin, both of which are polymer glucose chains [5,6] and their ratio varies depending on the type of starch [7,8]. Major sources of starch are grains (such as corn), tubers (i.e., potatoes), roots, and fruit [9,10]. It has been studied in many disciplines and used in different applications, such as agriculture, food science, biofuels, and medicine [3,6,11,12]. There is also great interest in using starch as a biodegradable and renewable polymer [13]. Quantifying its content is essential to chemical composition studies and it assists in differentiating between mono-/di-saccharides and polysaccharides in samples.
Available research studies on starch have been mainly focused on the food industry and modification of starch components [4,6,9,11,14]. There are several studies that describe starch quantification methods for commercial purposes (i.e., biofuel), which mainly focus on cost and conversion of starch to ethanol [3,15]. One known method of quantitative analysis of starch is based on the formation of colorful amylose–iodine complex which can be detected with ultraviolet-visible (UV-Vis) spectrophotometry. Only a limited number of studies, which are based on the method published in 1943, describe this analytical method of starch quantification [5,14,16]. Starch and amylose–iodine complex optimization using a spectrophotometry method has also been used in medical research [12]. However, some important analytical parameters have not been investigated, such as optimized method detection limit (MDL) and limit of quantification (LOQ), and pH and iodine concentration dependance, which are important, particularly when quantitative analysis of low-level starch samples is required. One example of these samples are bioaerosols such as pollen, bacteria, fungi, and microalgae.
Bioaerosols are small (~0.5–~100 μm [17]) airborne biological particles and they can be very abundant in the atmosphere [17,18]. For example, global emissions of fungal spores can be as high as 190 teragrams (Tg) annually (Tg/a), while pollen emissions can range from 47 to 84 Tg/a [19]. Bioaerosols can become airborne by different mechanisms and can affect biological and atmospheric processes [17]. They have become an important research topic in recent years, as anthropogenic climate change is causing an increase in pollen season duration and pollen concentrations in air [20,21,22]. In addition, an increase in harmful algal blooms is causing an amplification of biological toxins being introduced into the atmosphere [23]. Major components of bioaerosols are proteins, carbohydrates, amino acids, fatty acids, and lipids [24,25,26]. A recent study reported significant chemical constituents of pollen species to be amino acids and saccharides [25]. Some functional groups have also been studied in pollen [27] and microalgae [26]. In addition, subpollen particles (~0.60–~2.5 μm [28]) have been found to be mainly composed of starch [29,30]. However, the chemical composition (including starch reserves), transformation, and atmospheric behavior of these bioaerosol particles are still largely unknown [17], which creates a necessity to quantify low-level starch concentrations.
The goal of this study is to optimize the absorption spectroscopy method for quantitative analysis of low-concentration starch samples, including bioaerosols. For this purpose, we adopted the McCready et al. (1943) [5] and Boonpo et al. (2017) [16] method, examined it, and optimized the method further for analysis of samples with low starch content. We used the Perkin Elmer Lambda 1050 UV/Vis spectrophotometer. pH dependance and iodine reagent concentration for amylose determination were optimized in this study. In addition, we determined the MDL, LOQ, and linearity of the calibration for low-concentration ranges of starch for this colorimetry method.

2. Materials and Methods

2.1. Chemicals and Reagents

Powdered soluble potato starch (≥95% purity) was purchased from Sigma-Aldrich Inc. (St. Louis, MO, USA). Ethyl alcohol (class 1b) and sodium hydroxide (NaOH) solutions (1 N) were obtained from Fisher Scientific (Fair Lawn, NJ, USA). Hydrochloric acid solution (1 N), d-(+)-glucose (99%), and sucrose (99.5%) were purchased from Sigma-Aldrich, Inc. pH test strips were acquired from JNW Direct (Amazon, Inc., Seattle, WA, USA). Reagents (potassium iodide and iodine) and NaOH pellets were purchased from Ward’s Science (Rochester, NY, USA). Ultra-high-purity water (≥18 MΩ cm−1) was dispensed by the Elga Veolia PURELAB Chorus 1 (Woodridge, IL, USA) water purification system. Bioaerosols were acquired in different ways. Microalgae (spirulina) was purchased from Amazon, Inc. in freeze-dried powder form, and bacteria (hay bacillus) was cultured (Desert Research Institute, Reno, NV, USA), then freeze-dried prior to extraction. Fungi (western gall rust) and pollen (lodgepole pine) were collected locally (see Table 1) through surface deposition. Bioaerosol specifications are listed in Table 1.

2.2. Instrumentation

The Perkin Elmer Lambda 1050 UV/Vis/NIR Spectrophotometer (Waltham, MA, USA) was used for this study, with the wavelength range set to 250–800 nm. Photomultiplier tube (PMT) slits were fixed at 2.00 nm, with a PMT detector response of 0.20 s. The ordinate mode was set at absorbance (A), and the data interval at 1.00 nm. For bioaerosol sample preparation, Foxx Life Sciences EZFlow Syringe Filters with hydrophilic polytetrafluoroethylene (PTFE) membrane (Salem, NH, USA) were used, with a pore size of 0.45 μm and diameter of 25 mm. Additionally, 3.5 mL UV quartz spectrophotometer cuvettes (with PTFE covers and a lightpath of 10 mm) were purchased from FireflySci, Inc. (Northport, NY, USA). Reagents and samples were weighed using a Cahn C-33 microbalance (Cerritos, CA, USA). Bioaerosol bacteria samples were freeze-dried at −40 °C for 24 h prior to extraction using a Thermo Micro Modulyo 115 freeze dryer system (Asheville, NC, USA).

2.3. Sample Preparation

2.3.1. Amylose Iodine Reagent

The 0.2% iodine reagent (I2/KI) was prepared by adding 20 mg iodine (I2) and 200 mg potassium iodide (KI), then adjusted to 10 mL with water. Similarly, the 0.1% iodine reagent was prepared by adding 10 mg of I2 and 100 mg KI, and the 0.02% iodine reagent was prepared by adding 2 mg I2 and 20 mg KI, then adjusted to 10 mL with ultra-high-purity water. The iodine reagent solution should be red-brown in color.

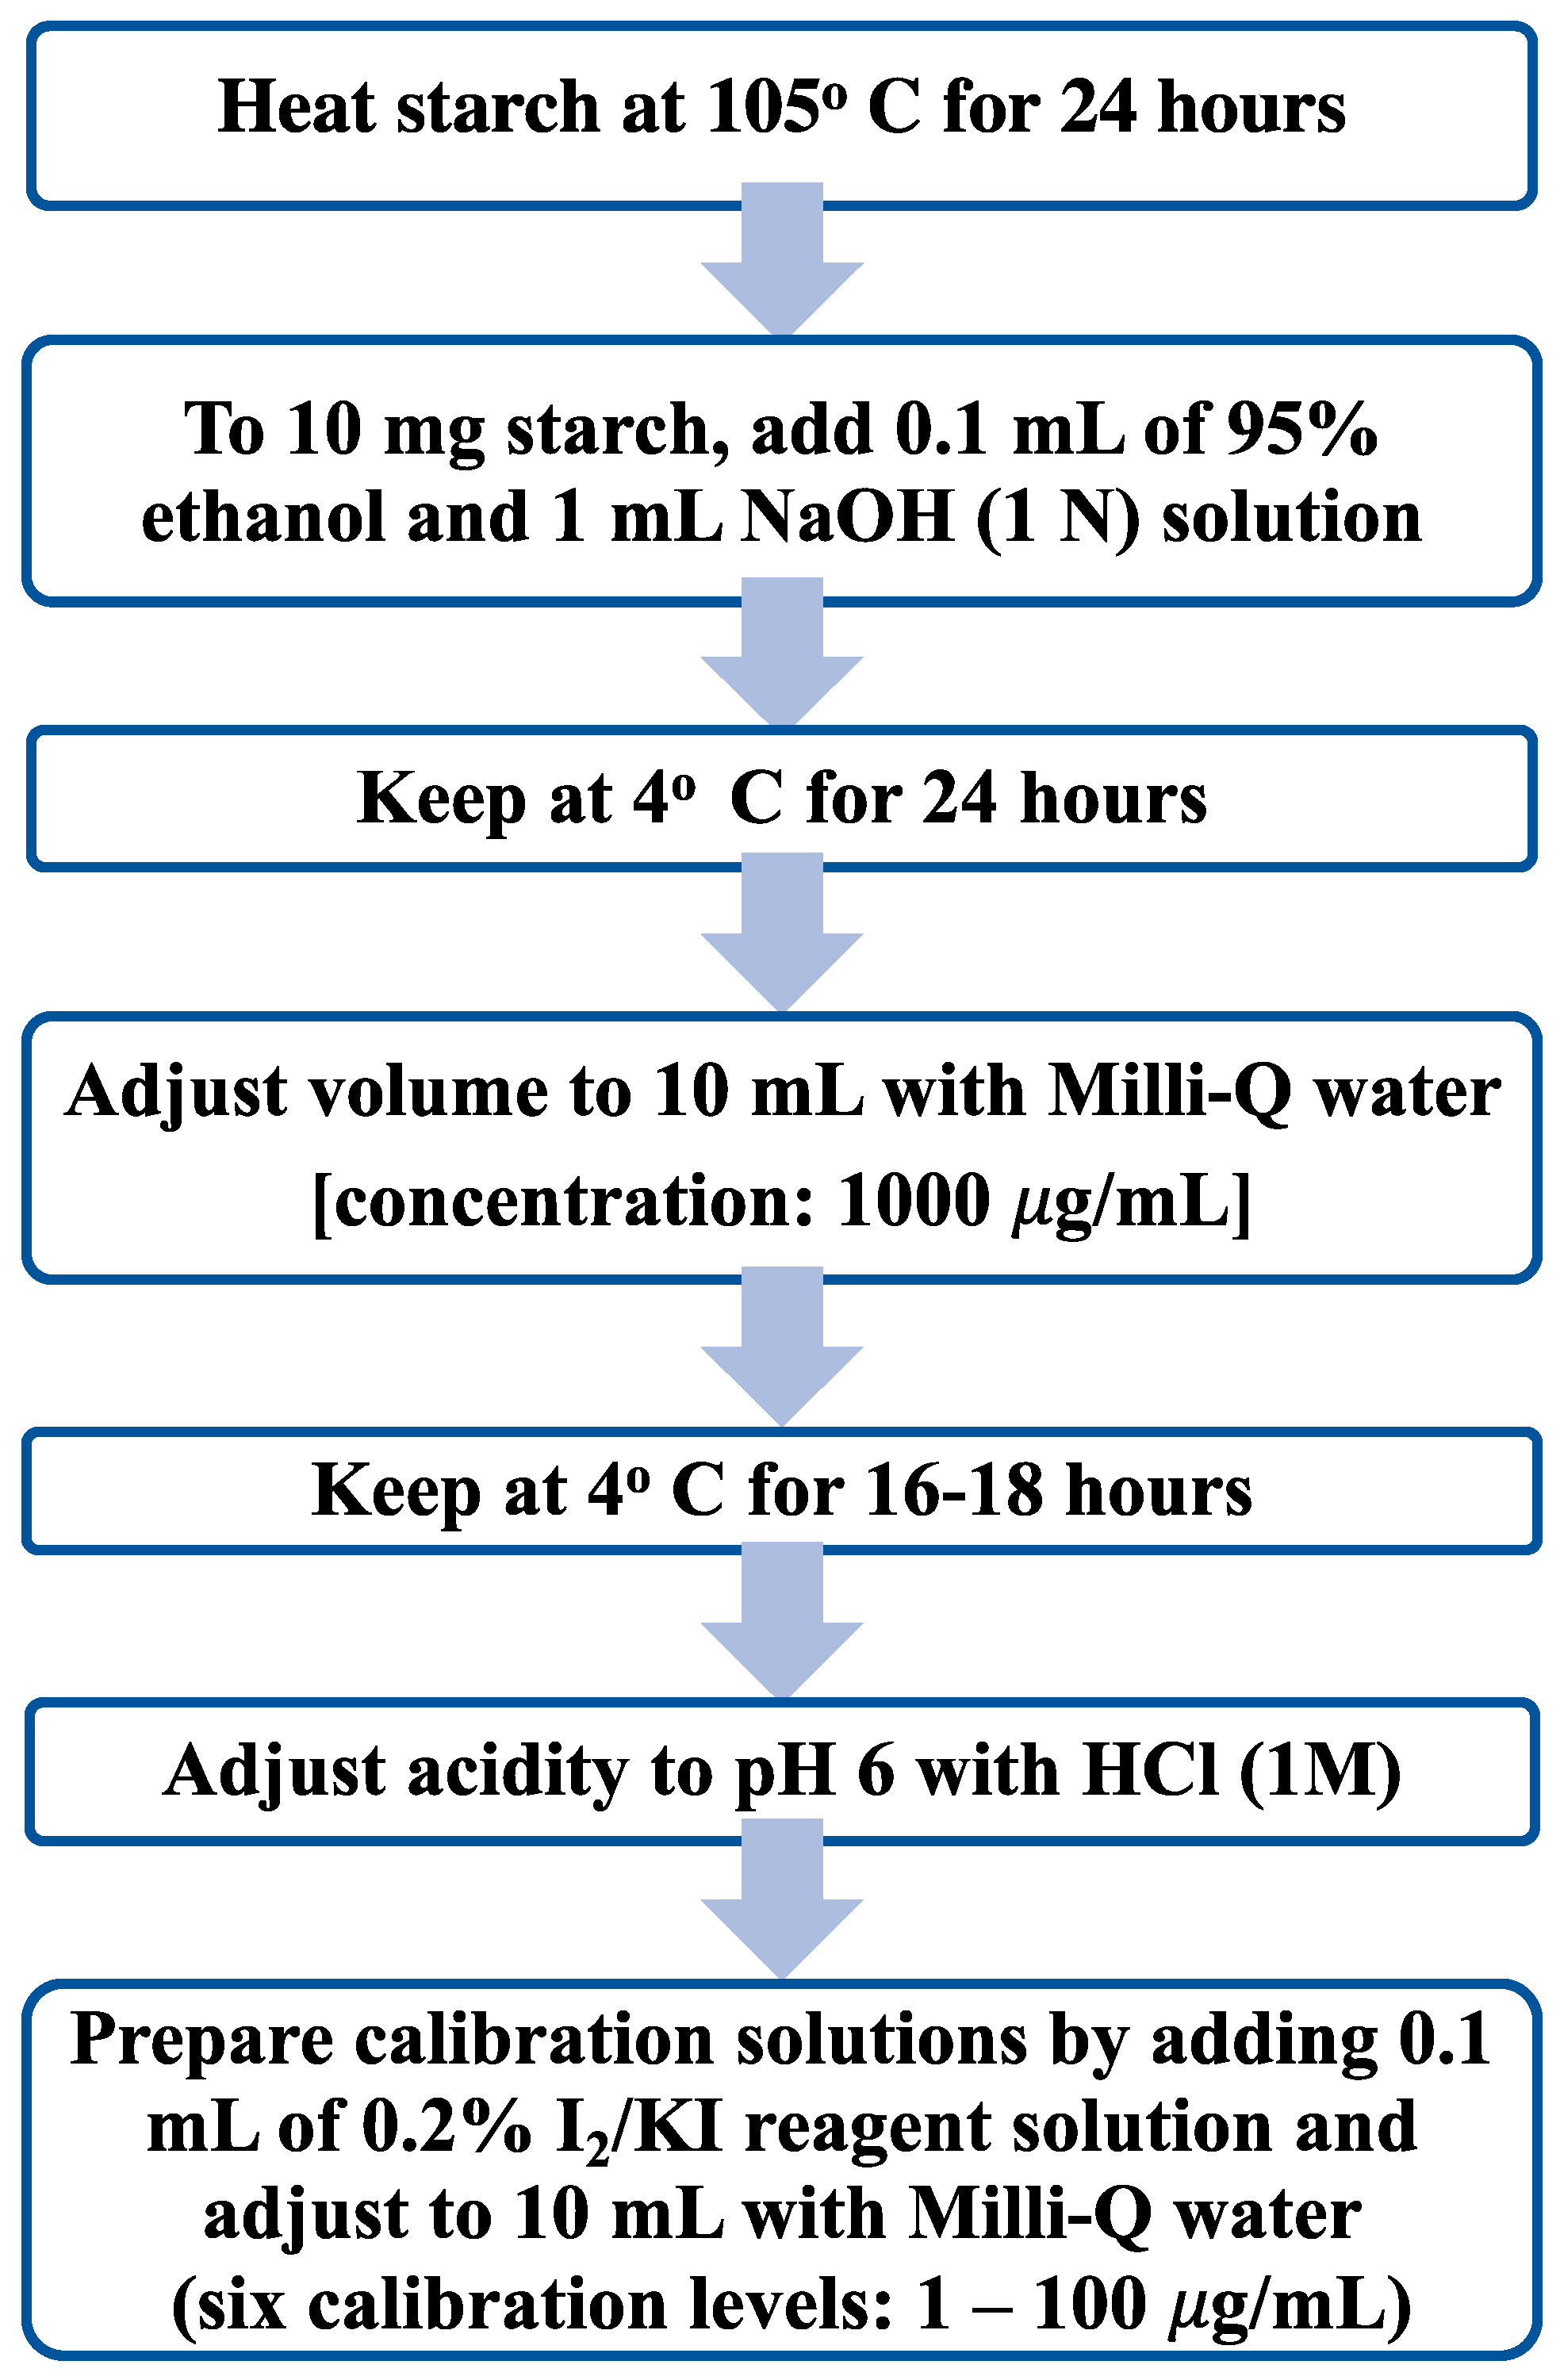
2.3.2. Starch Preparation

The optimized procedure for the preparation of starch/iodine reagent solution is presented in Figure 1. To prepare the starch stock solution, one gram of starch was heated at 105 °C for 24 h, following the temperature optimization of Noranizan et al. [31]. Afterwards, the starch was kept in a desiccator with NaOH pellets until ready for use. Then, 10 mg of desiccated starch was hydrated with 0.1 mL 95% ethanol and 1 mL NaOH solution (1 N) in a 10 mL volumetric flask. It is well described that in the presence of heat and NaOH, starch molecules swell and are physically modified, which encourages amylose to seep out due to its linear structure [32,33]. This reaction is what allows detection of starch by measuring the colorful amylose–iodine complex in the visible range of the spectrum with the UV-Vis spectrophotometer [34]. Although amylopectin is a significant portion of starch [8], it has been long known and well described in previous studies [34,35] that the amylopectin–iodine absorbs at much shorter wave lengths than the amylose–iodine complex, which makes amylose a perfect compound for quantitative analysis of starch. Moreover, amylopectin is not as easily extracted due to its highly branched structure [36], and thus, the transmission/absorption of the iodine solution is affected more by amylose than amylopectin [34]. The prepared starch mixture was refrigerated for 24 h at 4 °C. Next, the volume was then adjusted to 10 mL with ultra-pure water at the same temperature and refrigerated again for 16–18 h. The final concentration of the starch stock is 1000 μg/mL. Additionally, a “blank” sample with zero starch was prepared with 0.1 mL ethanol and 1 mL NaOH, then adjusted to 10 mL with water (following the same time frame).
Next, 5 mL of the prepared starch stock solution was brought to pH 6 by adding 500 µL of HCl (1 M). This final solution was used for calibration using calibration levels of 1, 10, 25, 50, 75, and 100 μg/mL (see Table S1). To prepare the calibration standards (concentration range: 1–100 (μg/mL)), 0.01, 0.1, 0.25, 0.5, 0.75, and 1.0 mL of stock solution (1000 μg/mL) was added to six separate volumetric flasks. Then, 0.1 mL of iodine reagent solution was added to each calibration level. With the addition of the iodine reagent, each level forms a different color. Boonpo et al. [16] varied the iodine solution amount added to each sample, however, we decided to keep the iodine solution amount consistent and vary the starch stock quantity instead. The calibration for this study was run in triplicates to determine the error of the sample preparation and/or the instrument, as well as for statistical purposes.
Due to the lack of studies on amylose–iodine complex absorbance due to pH dependance, starch solutions with varied pH levels (pH 2, 4, and 6) were prepared and analyzed to determine the optimized pH level. In addition, iodine reagent concentrations of 0.02, 0.1, and 0.2% were studied to determine which optimizes the absorbance. Although the iodine reagent concentrations were varied, the amount of the iodine solution added remained the same for every sample (0.1 mL). For these experimental conditions, calibration levels of 1 and 50 μg/mL were used and run in duplicates. A monosaccharide (glucose) and disaccharide (sucrose) were also analyzed for starch content at a concentration of 50 μg/mL, to ensure that the amylose–iodine complex would not form in simple saccharide solutions. These were prepared following the method described for starch, excluding the heat applied in the first step. The stability of the reagents was determined by testing an aliquot of 6-week-old and 16-week-old starch at 50 μg/mL (0.5 mL stock) and adding freshly prepared iodine reagent solution (0.1 mL). The liquid starch stock solution was stored at 4 °C.
The MDL and LOQ were determined following procedures adopted from the Analytical Detection Limit Guidance manual [37]. Ten samples were prepared for MDL analysis, following the blueprint presented in Figure 1. All ten samples were used in calculation for the MDL, with 9 degrees of freedom and a t-value of 2.821 at the 99% confidence level. The samples were prepared according to the optimized pH (pH = 6) and amylose iodine reagent concentration (0.2%). The MDL was calculated by taking the standard deviation of the 10 trials and multiplying by the t-value of 2.821. To obtain an accurate MDL, two out of three major requirements should pass. The spike level should be less than MDL × 10, and greater than the MDL itself [37]. The last requirement states that the signal-to-noise ratio (S/N) should be between 2.5 and 10. S/N is calculated by dividing the mean by the standard deviation. LOQ was calculated by multiplying the standard deviation of the MDL by 10 [37].
To estimate the uncertainty associated with the instrument (spectrophotometer) performance, two calibration standards (level 1 and level 4) and one sample (Lodgepole Pine pollen, see Table 1) were run as three replicate spectrophotometer measurements of each solution and estimated by calculation mean and standard deviation values. It must be noted that these values were not used in reporting starch concentrations in bioaerosol samples below. The standard deviations used in presenting starch measurements were calculated based on three replicates of bioaerosol samples prepared separately following the described procedure (Figure 1) from the same collected sample (Lodgepole Pine pollen, Table 1).

2.3.3. Bioaerosol Preparation

Several bioaerosols, such as pollen, fungi, bacteria, and microalgae, were chosen for starch content quantification (see Table 1). Microalgae and bacteria were both freeze-dried prior to the extraction. Bioaerosols were prepared following the same blueprint as starch (see Figure 1), along with centrifuging and syringe filtering (Foxx Life Sciences, 0.45 μm pore size) prior to pH adjustment. One set of bioaerosol samples was prepared without the heating step (Figure 1). Another set of samples was prepared using the additional step in which bioaerosol samples were preheated at 105 °C for 24 h (Figure 1). The aim of this step was to check if the pre-heating step helps release amylose in the starch from the tested bioaerosols.

3. Results and Discussion

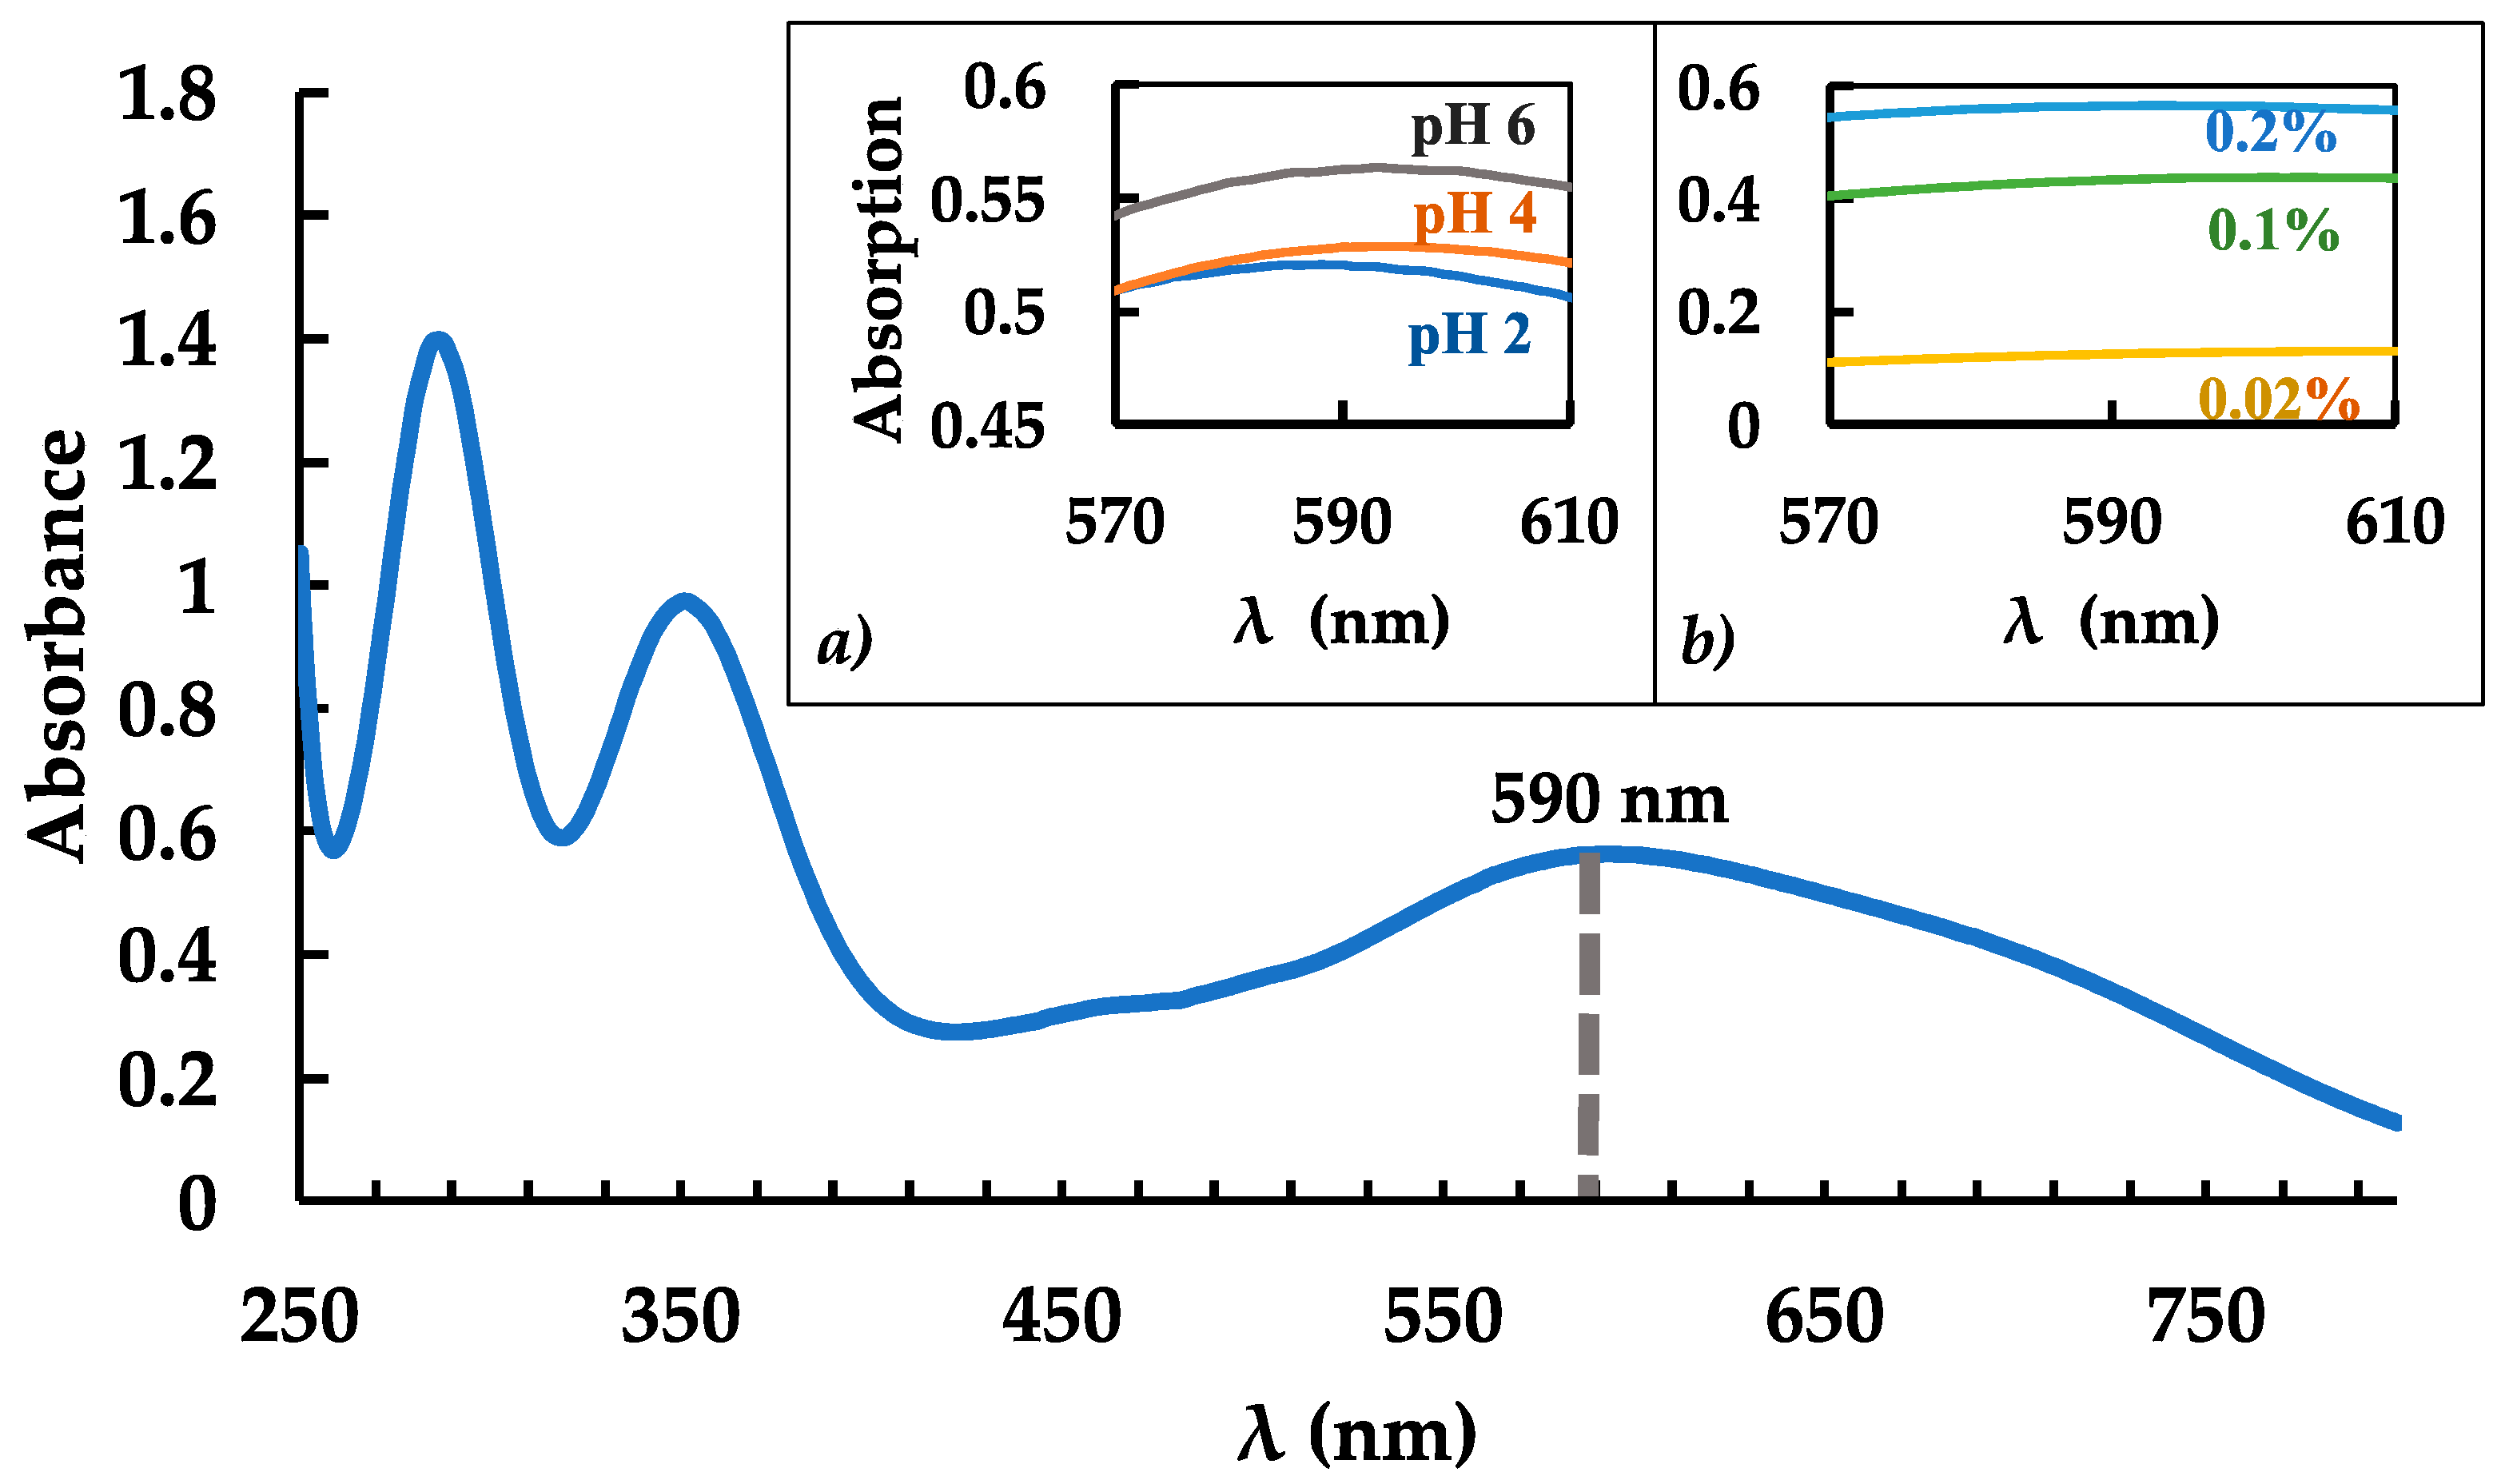
3.1. Dependance of pH and Iodine Reagent Concentration

The purpose of this study is to optimize the spectrophotometry method [16] for starch content quantification in low-concentration samples. For this task, first, the experimental parameters such as pH and iodine reagent concentration were tested. Figure 2 shows the dependance of pH and iodine reagent concentration on the absorption values of 50 μg/mL starch solution. We found that the addition of 0.1 mL of 0.2% iodine solution concentration to the starch solution (final volume—10 mL) shows a maximum absorption peak in the visible range at 590 nm, which was observed and confirmed in a previous study [35]. The UV-Vis spectrum of 50 μg/mL calibration level is presented in Figure 2. The maximum absorption was observed at the wavelength of 590 nm, and it is marked by a dashed grey line (Figure 2). In the previous studies, the absorption maximum of the amylose–iodine complex was reported at slightly longer wavelengths: 610 nm [13] and 615 nm [10]. This could be caused by differences in instrument calibrations, purity of the standards, or variation of pH levels. This could also be due to differences in starch types [38].
The absorption spectra acquired for the amylose–iodine complex standard solution prepared at different pH levels (pH 2, 4, and 6) are presented in Figure 2 Panel a, while Panel b shows the absorption spectra for standard starch solutions prepared with different percent of iodine reagent (0.02%, 0.1%, 0.2%). We added 0.1 mL of iodine reagent to the standard starch solutions, with a final volume of 10 mL. We found that the highest amylose–iodine complex absorption values were at pH 6.0, using an iodine reagent concentration of 0.2% (the final iodine concentration after addition to the starch solution is 0.002%). We did not see the formation of amylose–iodine complex at neutral and basic pH; therefore, we did not test solutions at pH 7 and higher (pH > 7). It has been found that optimization of the absorption at 590 nm depends more on iodine reagent concentration than pH, as the absorption at the chosen pH values ranges from 0.52 to 0.56 A and at the tested iodine concentration, the absorption ranges from 0.13 to 0.56 A. Although pH 2, 4, and 6 all provide linear calibrations, absorption values are 0.04 A higher in a solution of pH 6, providing a better sensitivity of absorption. Sulistyarti et al. [12] found that pH 5 was optimal for iodine quantification with the spectrophotometry method [12], while Boonpo et al. (2017) [16] did not specify what pH of starch solution was used. In addition, 0.2% iodine solution was found to be optimal by Boonpo et al. [16]. However, in their study, they found that larger amounts of iodine solution/higher concentration (4 mL) show maximum absorbance near 596–599 nm. In our study, we found that a small amount (0.1 mL) of iodine with 0.002% in the final starch solution shows the maximum absorption at 590 nm; both studies obtained the same final iodine concentration of 0.002% in the starch solution. Our results are comparable with those of Boonpo et al. [16] since their method was adopted for this experiment, and both studies used the same iodine solution concentration of 0.2% (and, therefore, obtained the same concentration of iodine in the final starch solution of 0.002%). Higher iodine reagent concentration values (>0.2%) were not tested in this study since low starch content samples were analyzed. However, higher concentrations of iodine reagent solution can be considered if testing for higher concentrations of starch. The 0.2% iodine solution was selected to be added to starch standards and bioaerosol samples to make the concentration of iodine 0.002% in the 10 mL final volume of starch sample.

3.2. Calibration and MDL

The calibration curve was plotted based on six calibration levels and it was linear between 1–100 μg/mL (y = 0.0106x − 0.002), with an R2 value average of 0.9989 ± 0.0015. The R2 value was calculated as an average of five separately prepared and run starch calibrations. The highest calibration level for this experiment was at a concentration of 100 μg/mL, since the trendline begins to plateau for concentrations higher than 100 μg/mL. The calibration curve and spectra can be found in Supplementary Materials (Figures S1 and S2). The MDL for this study was found to be 0.22 μg/mL, which is lower than the spike level of 0.25 μg/mL. MDL × 10 is greater than the spike of 0.25 μg/mL. The signal-to-noise ratio is 9.9. According to the MDL Guide [37], our MDL passes major required criteria. The MDL standard deviation is 0.079, from which the LOQ was found to be 0.79 μg/mL. To our knowledge, there have not been any MDL or LOQ reported for starch quantification using the spectrophotometry technique. The analytical uncertainty was calculated based on three consecutive spectrophotometry measurements of the lowest calibration level (calibration level 1, concentration 1 μg/mL) for the instrument used in this study and is 1.1%. For calibration level 4 (concentration 50 μg/mL), the instrument analytical uncertainty is 0.07%. Analytical uncertainty for bioaerosol sample preparation in this study is 0.3%.

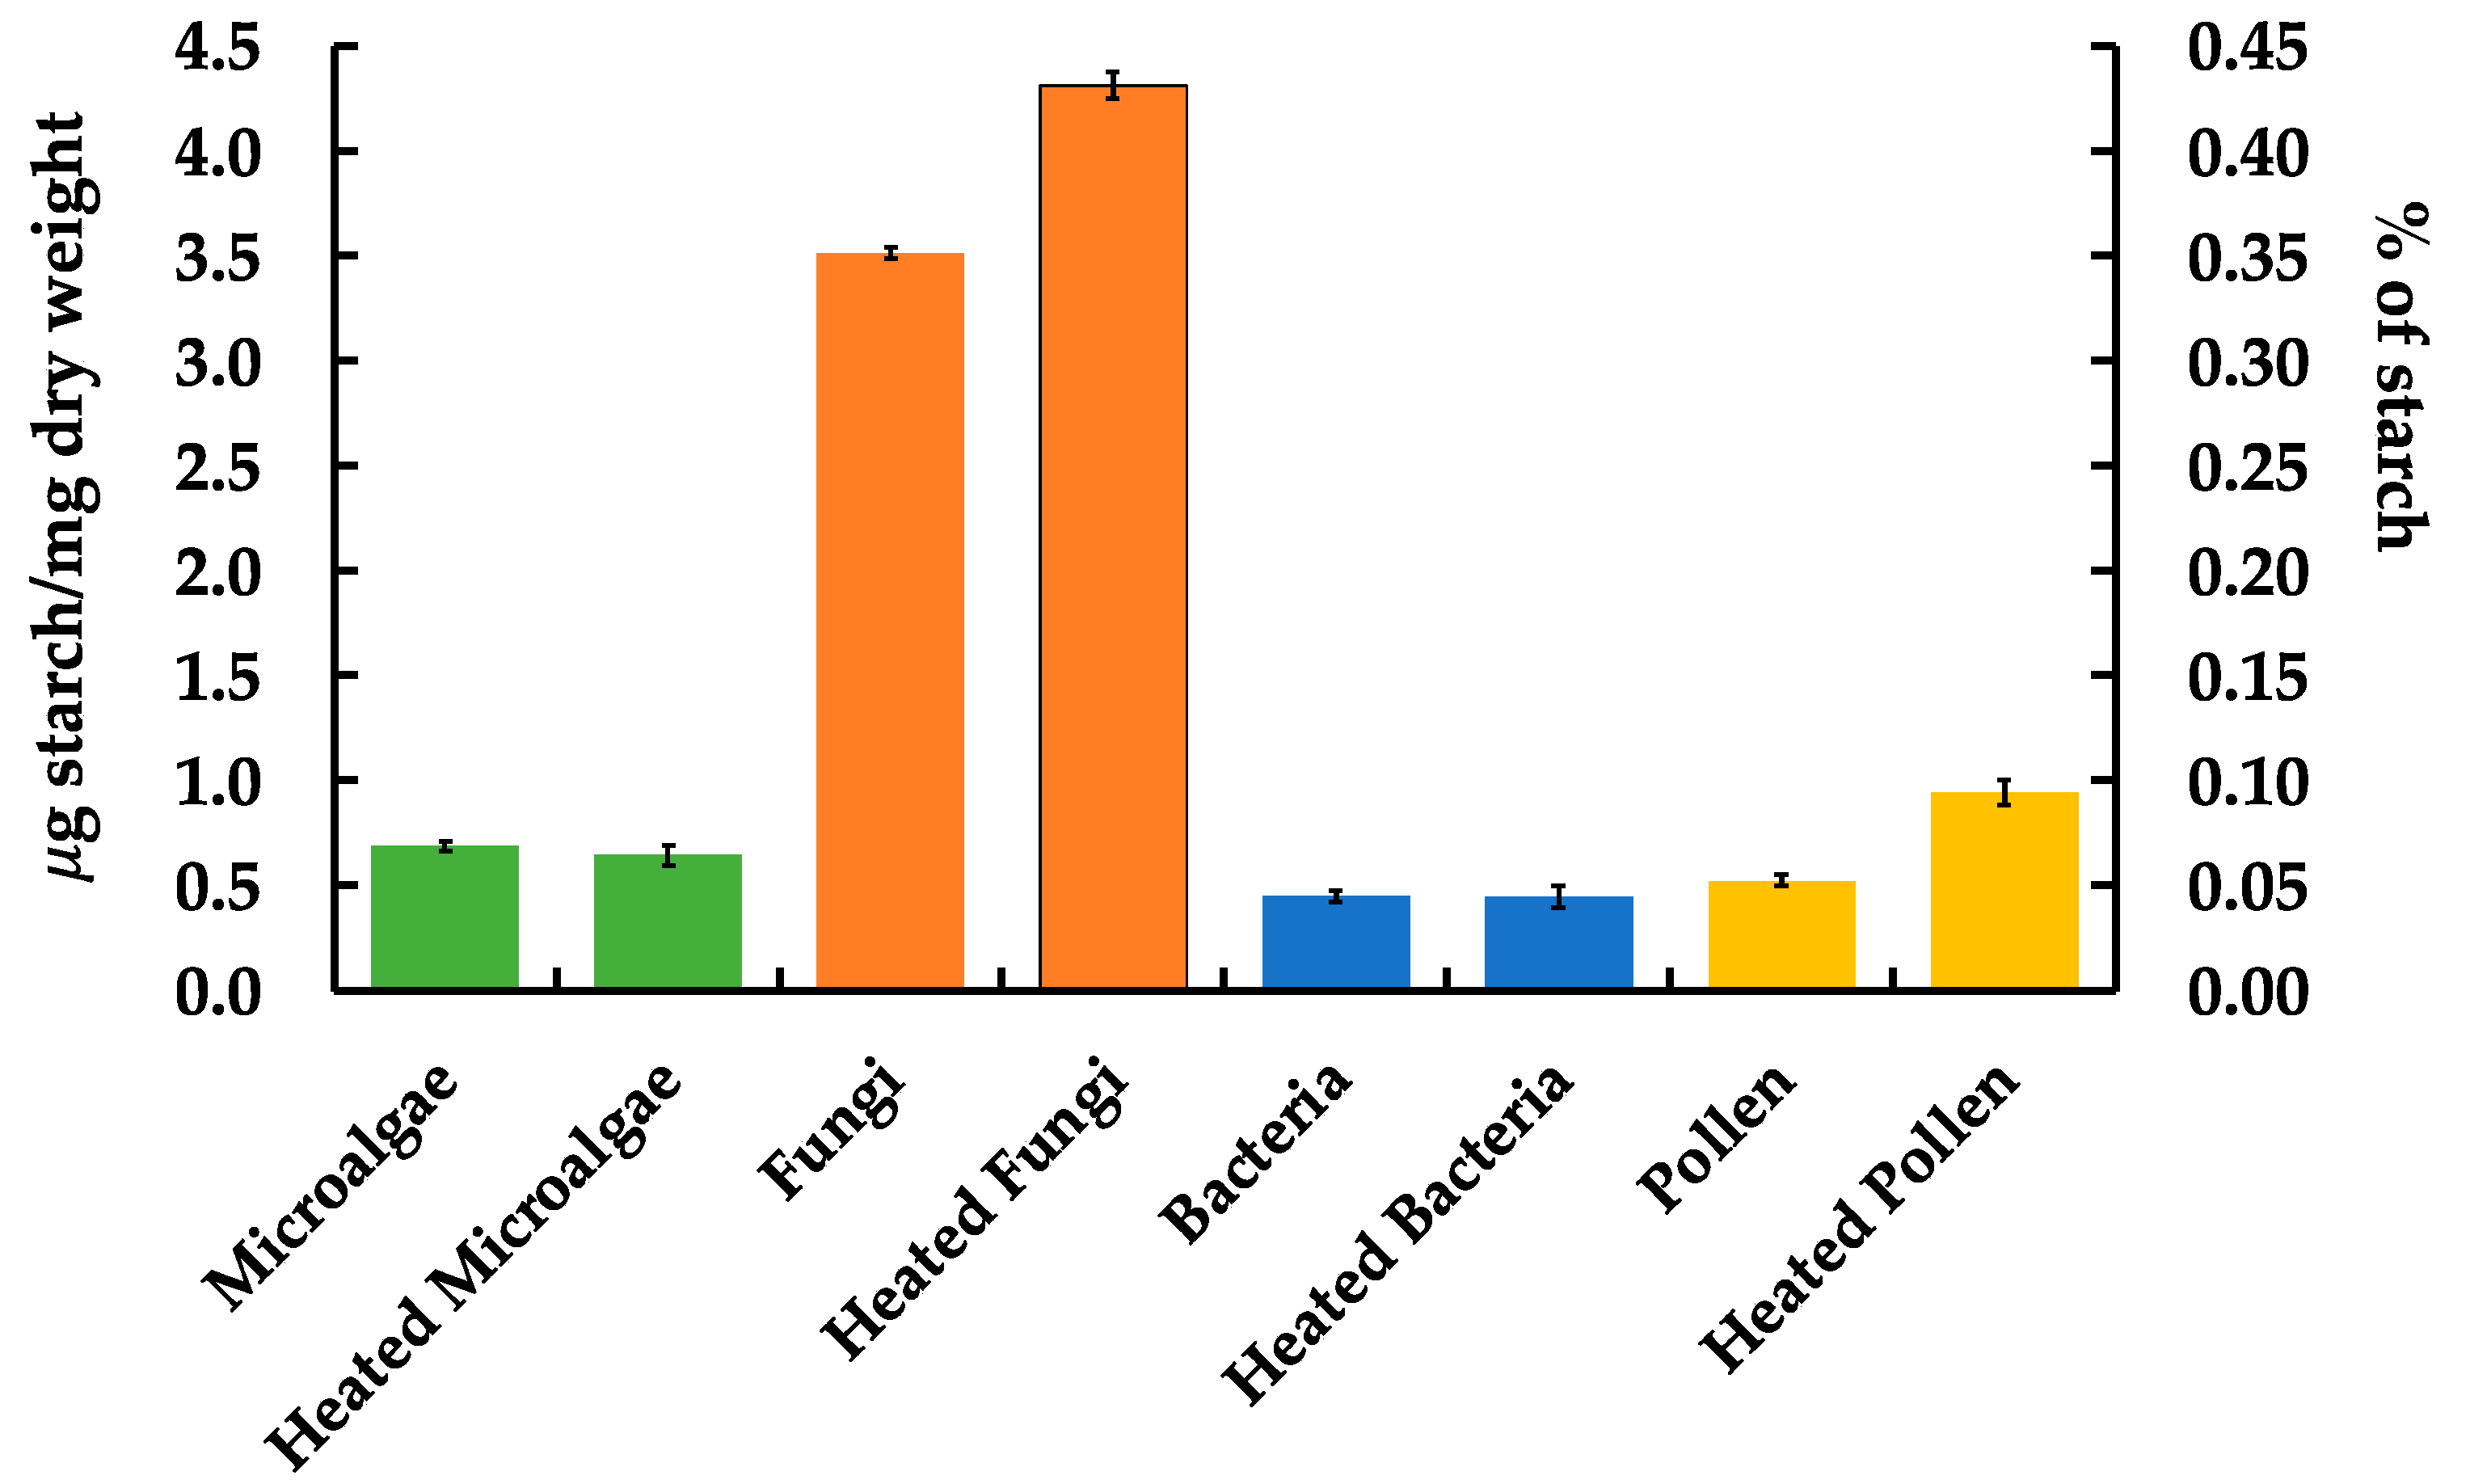
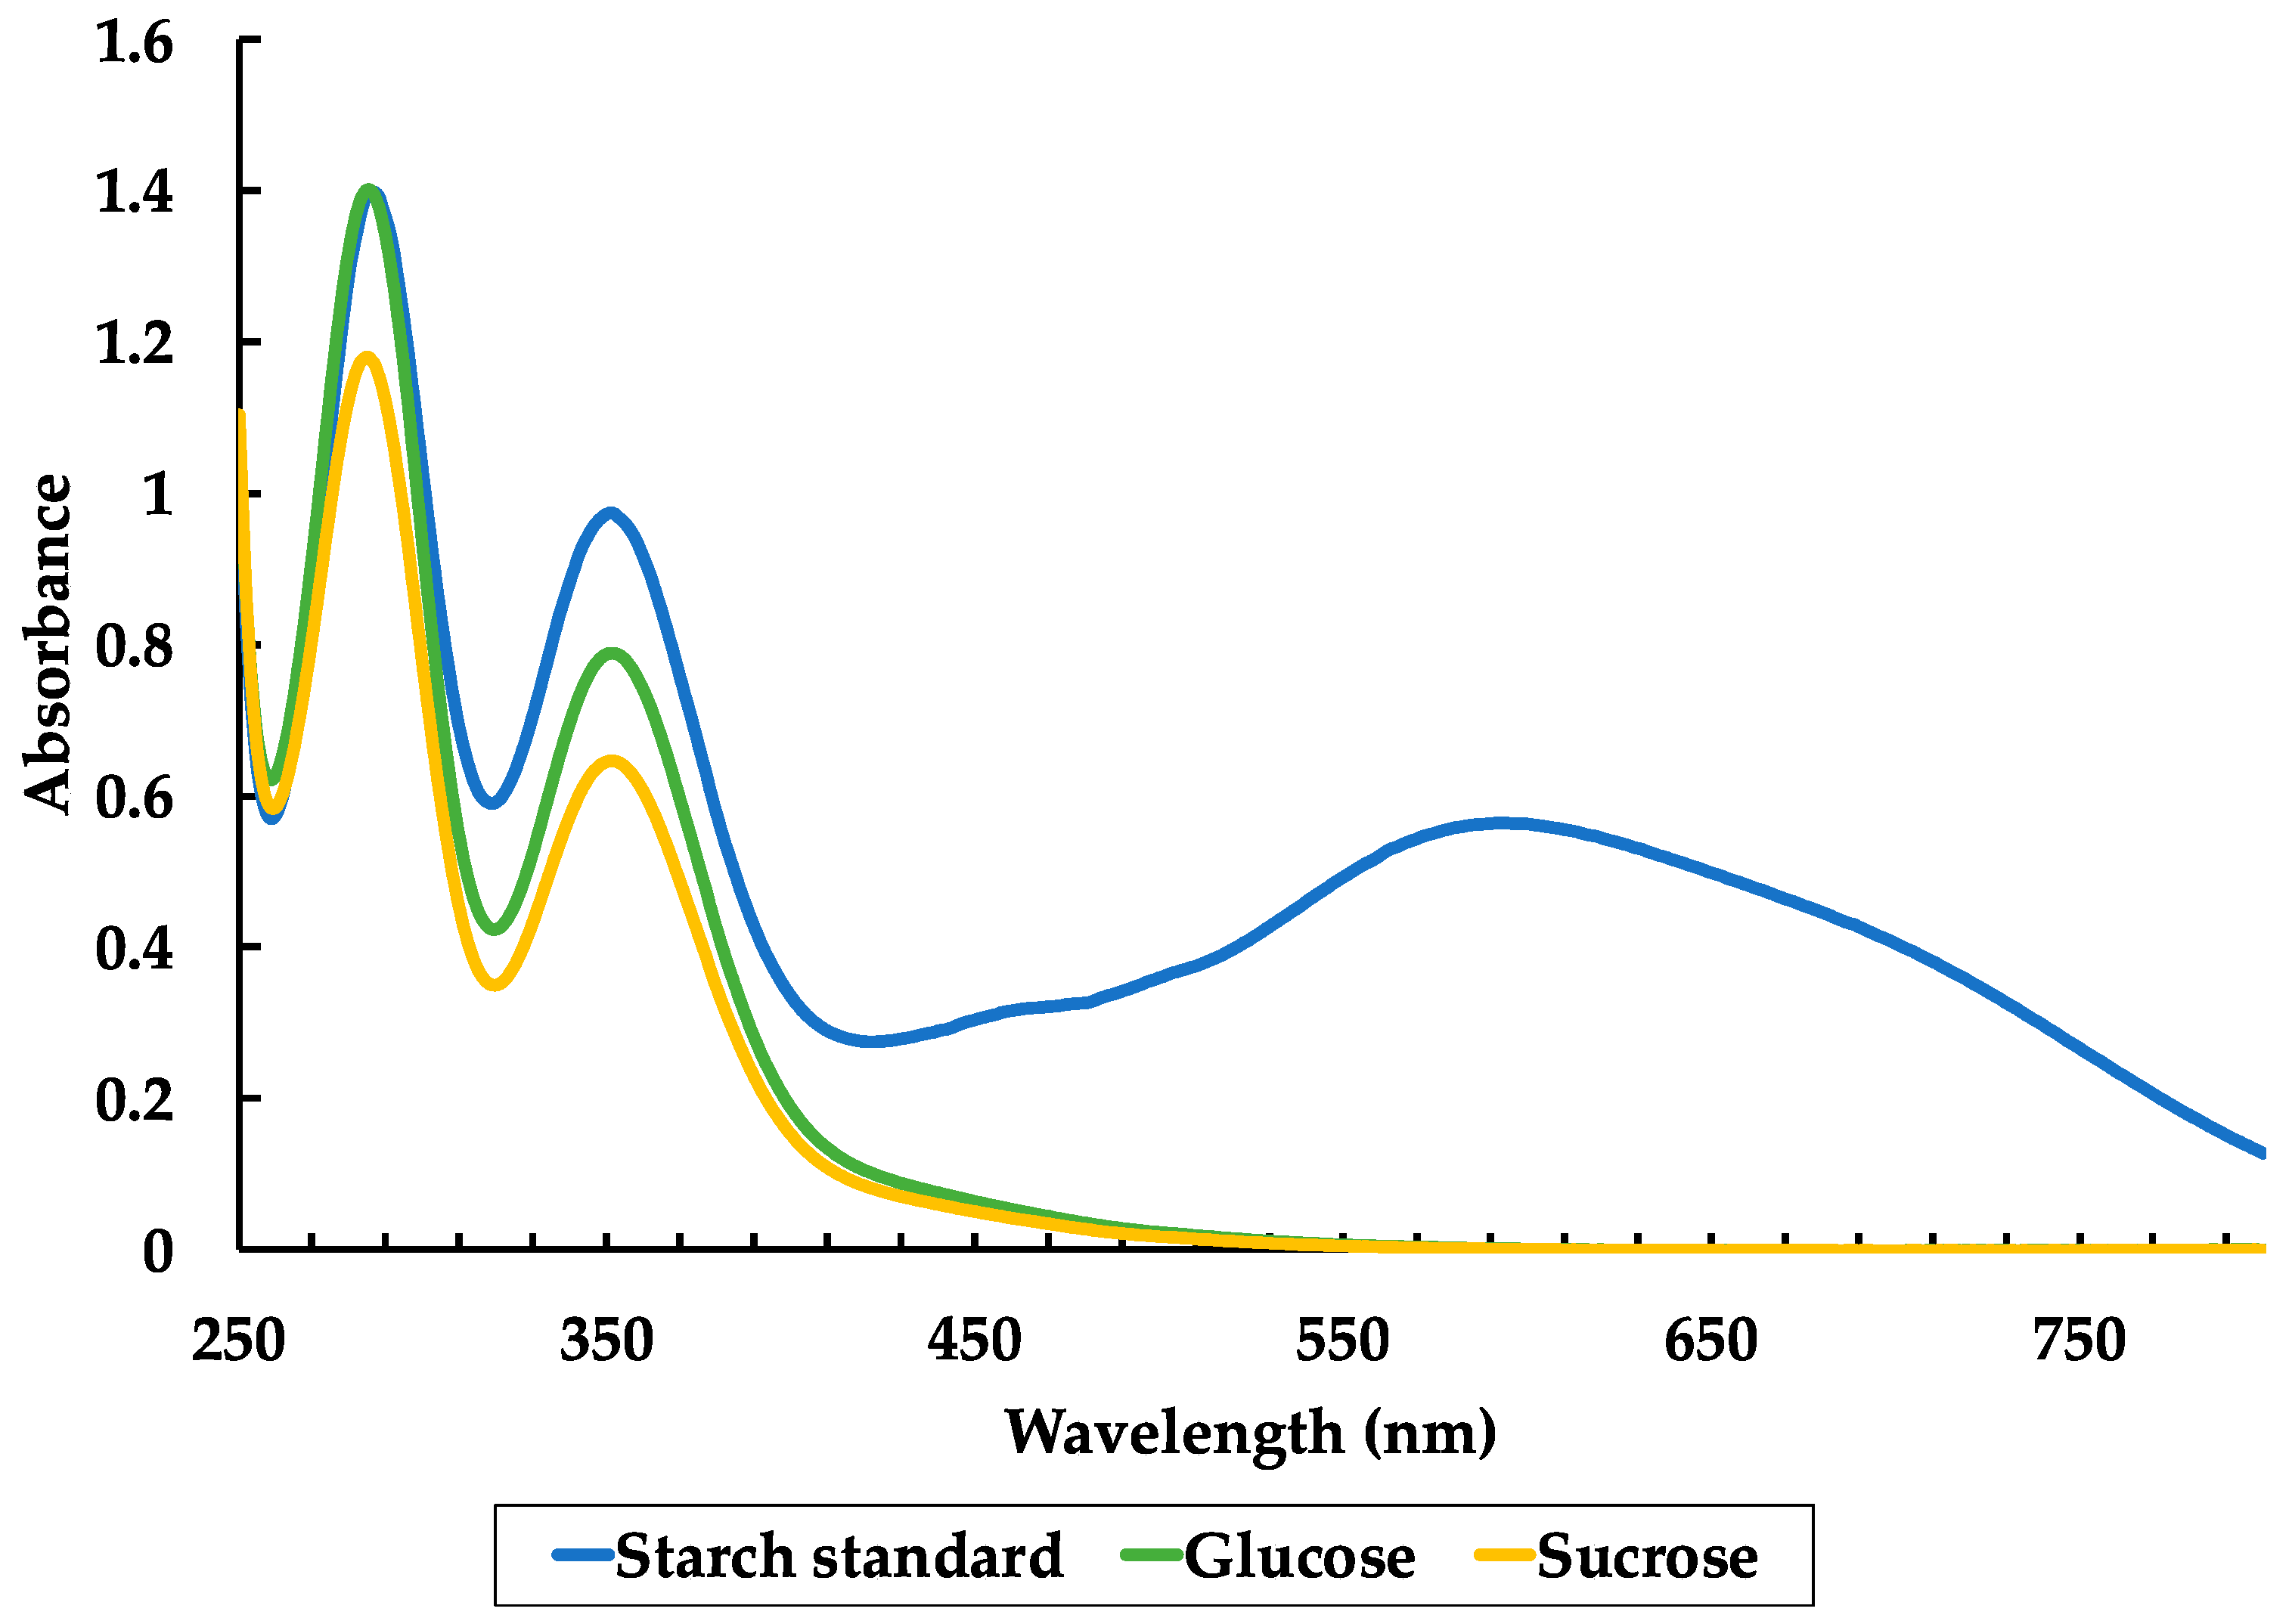
3.3. Bioaerosol and Saccharide Analysis

To prove this method can be used for starch quantification of low-concentration samples, several bioaerosols were selected (Table 1) and analyzed for starch content at 590 nm. To this end, 50 mg of each bioaerosol was prepared for the quantitative analysis of starch following the procedure described in Section 2.3.3. Figure 3 shows the starch content in bioaerosols in μg of starch per mg of dry weight of each individual bioaerosol. Microalgae, bacteria, and pollen have <1 μg of starch per mg of dry weight (microalgae: 0.69 ± 0.02 μg/mg, heated microalgae: 0.64 ± 0.05 μg/mg, bacteria: 0.45 ± 0.03 μg/mg, heated bacteria: 0.45 ± 0.05 μg/mg, pollen: 0.52 ± 0.03 μg/mg, heated pollen: 0.94 ± 0.06 μg/mg), whereas both fresh and heated fungi samples have >1 μg. Fresh fungi have 3.5 ± 0.03 μg of starch per mg dry weight, and heated fungi have 4.3 ± 0.06 μg/mg (see Table S2 in Supplementary Materials). Although the starch content is lower in microalgae, bacteria, and pollen, the concentration values are 33–127% higher the LOQ (0.79 μg/mL).
An unpaired (independent) t-test [39] was used for statistical analysis of starch content in bioaerosols. Pre-heating of microalgae and bacteria bioaerosol samples (Figure 3) does not show a statistically significant difference in starch content, being 6.4% for microalgae (p = 0.23) and 0.3% for bacteria (p = 0.97), as it clearly does for fungi (19% difference, p < 0.0001) and pollen (45% difference, p = 0.0004) (Figure 3). The higher concentration of starch for pre-heated fungi and pollen samples than for those without heating step, could be explained by the release of amylose during the heating process (Figure 1), while the microalgae and bacteria samples were initially freeze-dried, which caused the starch release. Across all bioaerosols, the concentration values are 1.4–11.6 times higher than the MDL (0.22 μg/mL), allowing us to have 99% confidence in the starch quantification method. This method may need to be adjusted for other types of bioaerosol particles (e.g., small fragments), especially those that may require additional preparation and starch isolation steps. This method can be applied for further research regarding the chemistry of starch in bioaerosols in the atmosphere.
Since saccharides have been also found to be present in bioaerosols, we examined if a mono- and di-saccharide may contribute to background noise during the spectrophotometric quantitative analysis of starch using the amylose–iodine complex approach. A recent study found that some pollen species can contain high concentrations (ranging from 4 to 24% of the dry mass) of saccharides and the most abundant saccharides were found to be glucose and sucrose [25,40]. Thus, glucose and sucrose were selected for the method assessment. When the iodine reagent was added to both saccharide solutions, no color change was observed as it would for starch-containing samples or starch standard solution. Figure 4 shows the absorption spectra for standard starch, glucose, and sucrose prepared at 50 μg/mL concentration. Neither the monosaccharide (fructose), nor the disaccharide (sucrose) gives a strong signal at 590 nm (green and yellow curves), whereas the starch standard does (blue curve). The saccharide spectra are quite similar in absorption and concentration, showing virtually no difference between mono- and di- saccharides as it pertains to absorbance spectrophotometry. Both glucose and sucrose standard solutions (concentration 50 µg/mL) yield a similar background signal at 590 nm that corresponds to 0.30 μg/mL. This is 8.2% above the MDL (0.22 μg/mL) and 48% below the LOQ level (0.79 μg/mL) (whereas bioaerosols are 33–840% higher than the LOQ), indicating that mono- and di-saccharides may add some background noise when analyzing for amylose–iodine complex in starch samples.

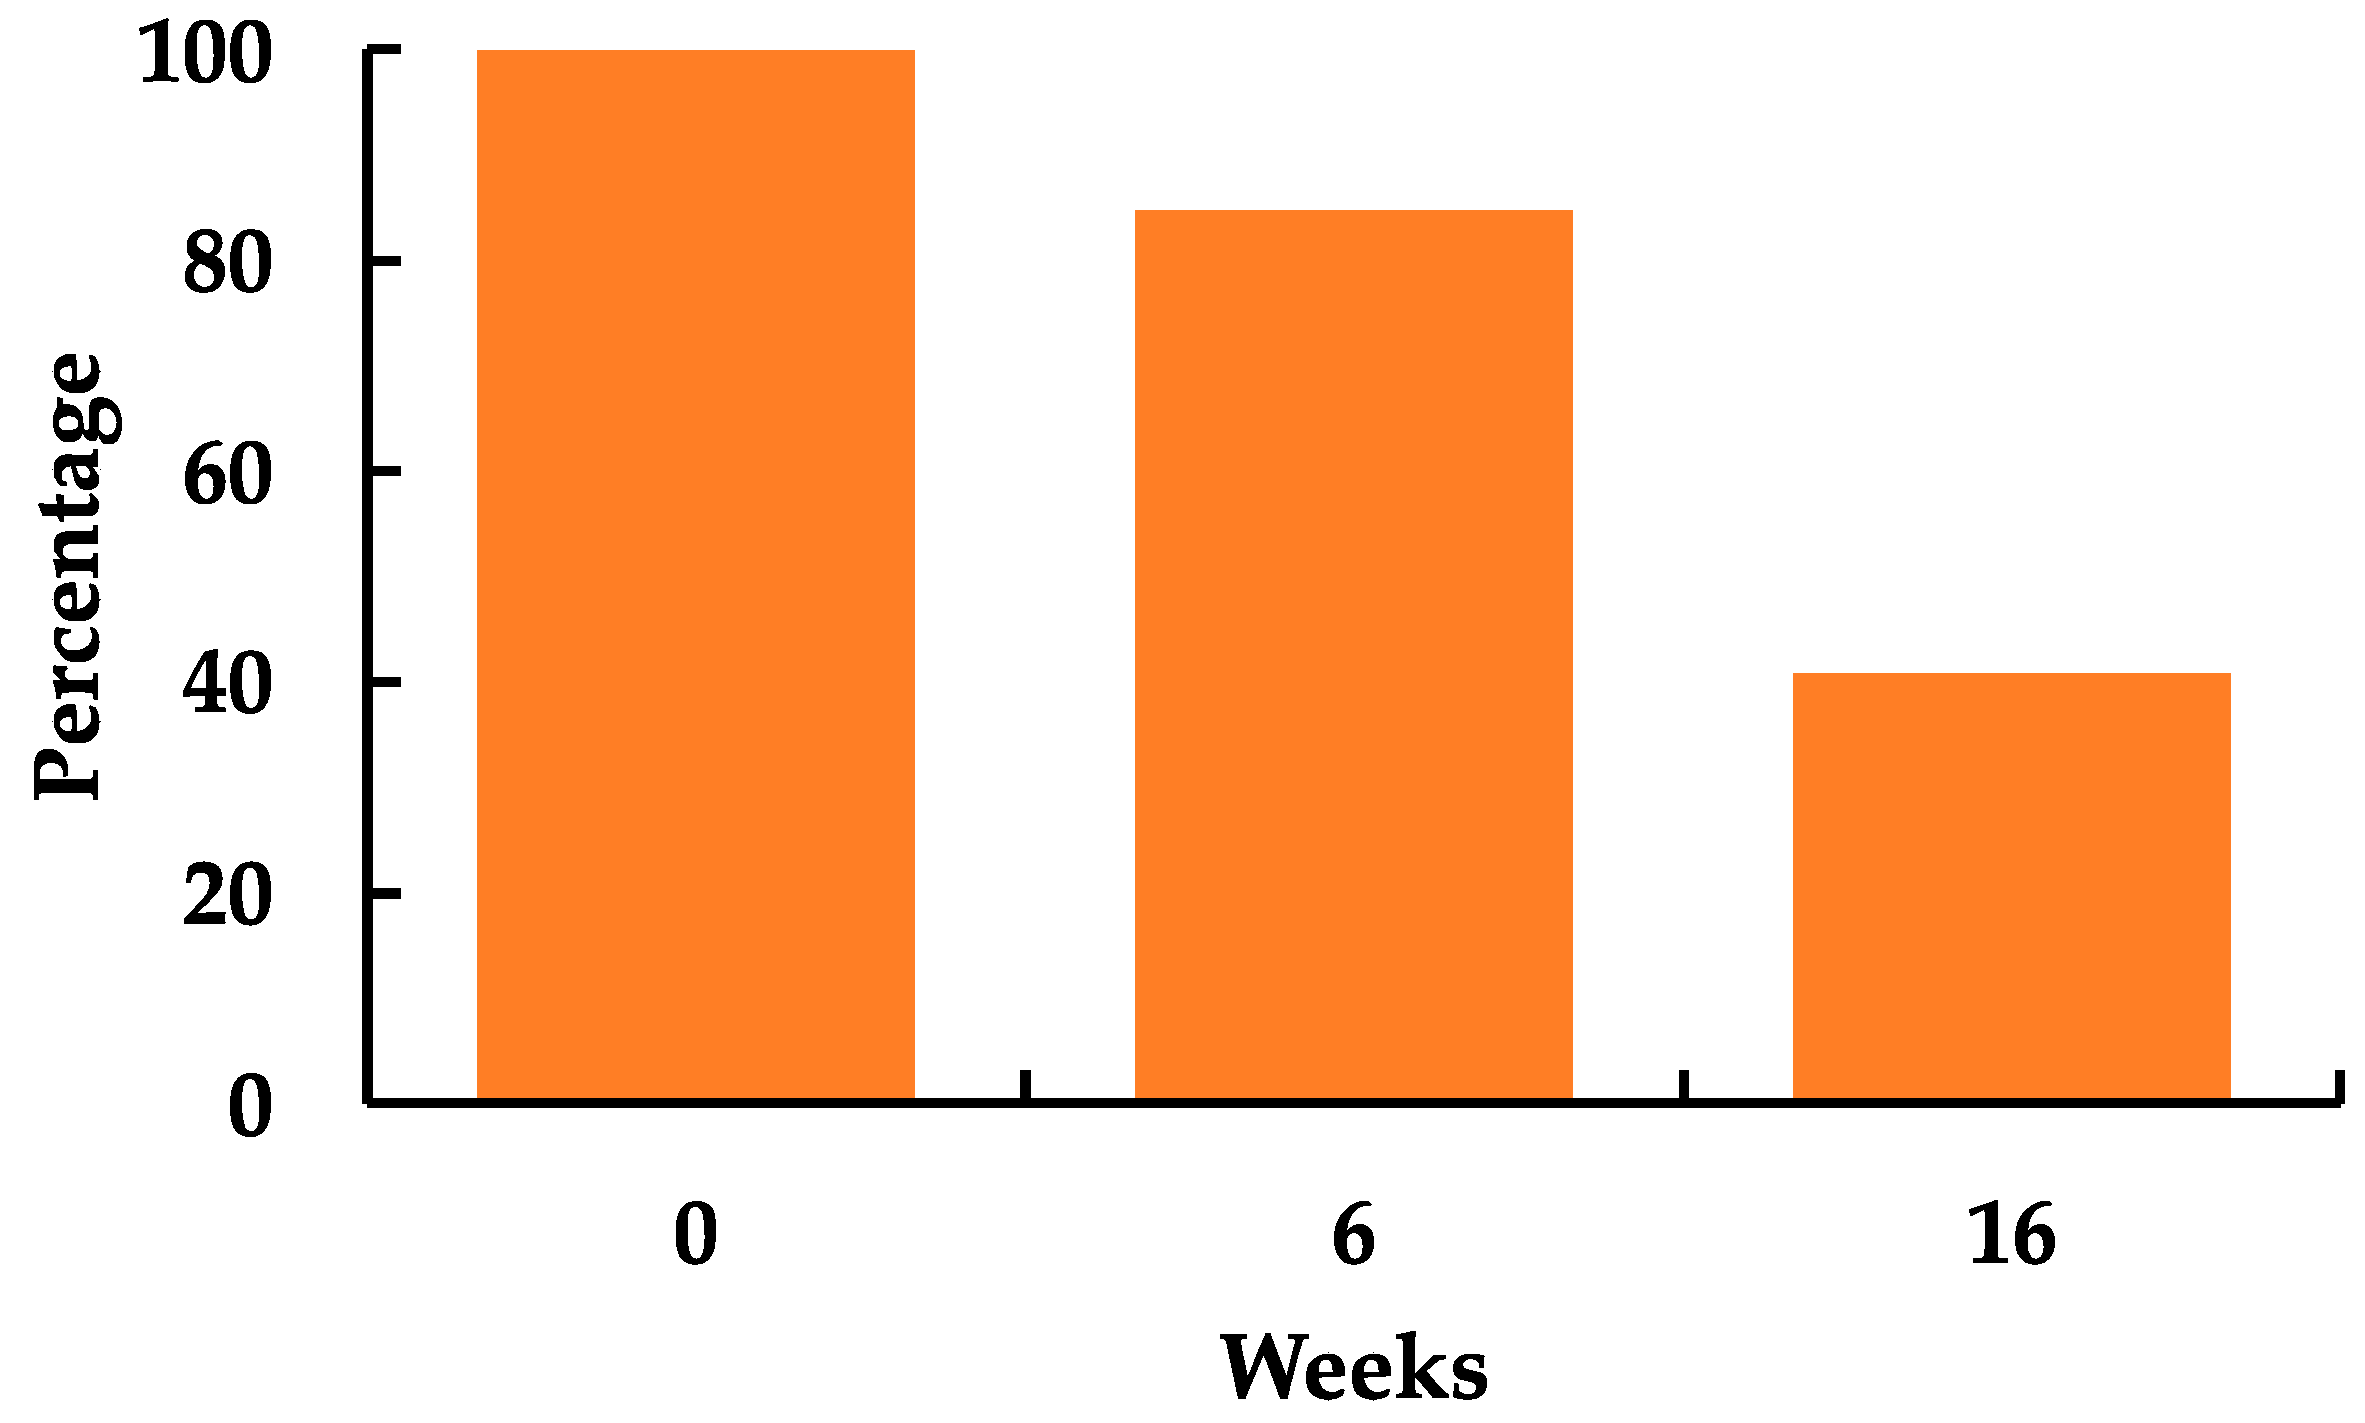
3.4. Starch Stability

The stability of the stock starch solution was studied over a 16-week period. Figure 5 shows starch decomposition in the stock solution with NaOH, ethanol, and water using the percentage of decay on the y-axis over time (in weeks) on the x-axis. After 6 weeks, the starch content decreased from 100% to 84.7% (which is a decomposition of 15.3%). After 16 weeks (about 4 months), the starch content further degraded to 40.9% (a decomposition of 59.1% from the original, fresh stock solution). The standard deviation percentage for starch decay is 0.32%, based on three replicates of fresh starch solution (starch content at 100%), which is almost negligible and thus was not added to the figure. This degradation is likely due to the decay of the starch molecule chains in the presence of high NaOH concentration, which is caused by the oxidation of the hydroxyl groups in the starch [16,41]. It must be noted that cooling of the starch solution (at 4 °C) after the dry heating process may strengthen the amylose–amylopectin and amylose–amylose chains [42], which may account for the decrease in absorption values of starch over time. Due to the decomposition, it is recommended to prepare new starch stock for every study and use within a couple of days’ time.

4. Conclusions

In the present study, the spectrophotometry method for quantitative analysis of starch/iodine complex in low-concentration starch samples, such as bioaerosols, was tested and optimized. The MDL for starch in low-concentration samples using the Perkin Elmer Lambda 1050 UV/Vis spectrophotometer is 0.22 μg/mL, and the LOQ is 0.79 μg/mL. The linearity of the starch calibration is 0.9989. This method was successfully tested on bioaerosols (pollen, fungi, bacteria, and algae) and it is suitable for analysis of starch in low concentrations. Naturally, there are some limitations to this study. Due to the plateauing of linearity past 100 μg/mL, and the fact that this study was conducted to optimize low-level starch concentrations, we did not test concentrations higher than 100 μg/mL. The plateauing could be the result of high concentrations of starch overwhelming the spectrophotometer, as the color of higher concentration samples was near black. We did not check if other compounds would add to or interfere with the signal of the amylose–iodine complex. However, since amylose and amylopectin are composed of polymer glucose chains, we believe that testing glucose for interferences within the UV-Vis spectrum was sufficient. In addition, amylose content naturally varies from source to source (22–29% [35]), which may affect starch quantification for different bioaerosols. We chose only pH 2, 4, and 6 for the optimization of this method, as one study found that pH 5 was optimal for iodine determination [12]. This study furthers our understanding and knowledge of starch content in bioaerosols, and this method can be used in fields other than bioaerosols, such as agriculture and medicine.

Supplementary Materials

The following supporting information can be downloaded at: https://www.mdpi.com/article/10.3390/analytica3040027/s1, Table S1: Calibration levels; Table S2: Starch content of bioaerosols; Figure S1: Calibration curve; Figure S2: Calibration spectra; Figure S3: Full spectrum of calibration level 4 (50 µg/mL) at pH 2, 4, and 6; Figure S4: Full spectrum of calibration level 4 (50 µg/mL) at iodine reagent concentration 0.02, 0.1, and 0.2%.

Author Contributions

Conceptualization, P.B and V.S.; methodology, P.B. and V.S.; validation, V.S., K.A. and A.Y.K.; formal analysis, P.B.; data curation, P.B.; writing—original draft preparation, P.B.; writing—review and editing, P.B., V.S., K.A. and A.Y.K.; visualization, P.B.; supervision, V.S.; funding acquisition, A.Y.K. and V.S. All authors have read and agreed to the published version of the manuscript.

Funding

This research was funded by the National Science Foundation, grant number AGS-1760328.

Institutional Review Board Statement

Not applicable.

Informed Consent Statement

Not applicable.

Data Availability Statement

All data is contained within the article and supplementary material.

Acknowledgments

The authors would like to thank Hans Moosmüller (Desert Research Institute, Reno, NV, USA) for generously providing the equipment necessary for this study. The authors would also like to thank Alison Murray (Desert Research Institute, Reno, NV, USA) for the donation of cultured bacteria for our bioaerosol sample study.

Conflicts of Interest

The authors declare no conflict of interest. The funders had no role in the design of the study; in the collection, analyses, or interpretation of data; in the writing of the manuscript; or in the decision to publish the results.

References

  1. Buléon, A.; Colonna, P.; Planchot, V.; Ball, S. Mini Review Starch Granules: Structure and Biosynthesis. Int. J. Biol. Macromol. 1998, 23, 85–112. [Google Scholar] [CrossRef] [Green Version]
  2. Lafont-Mendoza, J.J.; Severiche-Sierra, C.A.; Jaimes-Morales, J. Evaluation of the Starch Quantification Methods of Musa Paradisiaca, Manihot Esculenta, and Dioscorea Trífida Using Factorial Experiments. Int. J. Food Sci. 2018, 2018, 1–7. [Google Scholar] [CrossRef] [PubMed] [Green Version]
  3. Yong, T.C.; Chiu, C.S.; Chen, C.N.N. Optimization of a Simple, Accurate and Low Cost Method for Starch Quantification in Green Microalgae. Bot. Stud. 2019, 60, 1–6. [Google Scholar] [CrossRef] [PubMed] [Green Version]
  4. Bashir, K.; Aggarwal, M. Physicochemical, Structural and Functional Properties of Native and Irradiated Starch: A Review. J. Food Sci. Technol. 2019, 56, 513–523. [Google Scholar] [CrossRef]
  5. McCready, R.M.; Hassid, W.Z. The Separation and Quantitative Estimation of Amylose and Amylopectin in Potato Starch. J. Am. Chem. Soc. 1943, 65, 1154–1157. [Google Scholar] [CrossRef]
  6. Subroto, E.; Jeanette, G.; Meiyanasari, Y.; Luwinsky, I.; Baraddiaz, S. Review on the Analysis Methods of Starch, Amylose, Amylopectinin Food and Agricultural Products. Int. J. Emerg. Trends Eng. Res. 2020, 8, 3519–3524. [Google Scholar] [CrossRef]
  7. Bates, L.F.; French, D.; Rundle, R.E. Amylose and Amylopectin Content of Starches Determined by Their Iodine Complex Formation. J. Am. Chem. Soc. 1943, 65, 142–148. [Google Scholar] [CrossRef]
  8. Egharevba, H.O. Chemical Properties of Starch and Its Application in the Food Industry; IntechOpen: London, UK, 2019. [Google Scholar]
  9. Han, J.A.; BeMiller, J.N. Preparation and Physical Characteristics of Slowly Digesting Modified Food Starches. Carbohydr. Polym. 2007, 67, 366–374. [Google Scholar] [CrossRef]
  10. Takeda, C.; Takeda, Y.; Hizukuri, S. Structure of Amylomaize Amylose. Cereal Chem. 1989, 66, 22–25. [Google Scholar]
  11. Nakayoshi, Y.; Nakamura, S.; Kameo, Y.; Shiiba, D.; Katsuragi, Y.; Ohtsubo, K. Measurement of Resistant Starch Content in Cooked Rice and Analysis of Gelatinization and Retrogradation Characteristics. Biosci. Biotechnol. Biochem. 2015, 79, 1860–1866. [Google Scholar] [CrossRef] [Green Version]
  12. Sulistyarti, H.; Atikah, A.; Fardiyah, Q.; Febriyanti, S.; Asdauna, A. A Simple and Safe Spectrophotometric Method for Iodide Determination. Makara J. Sci. 2015, 19, 43–48. [Google Scholar] [CrossRef]
  13. Pokhrel, S. A Review on Introduction and Applications of Starch and Its Biodegradable Polymers. Int. J. Environ. 2015, 4, 114–125. [Google Scholar] [CrossRef] [Green Version]
  14. Desai, B.S.; Modi, Z.S.; Amit, K.J.; Parmar, S.C.; Shaikh, A.I.; Aparnathi, K.D. Development of Spectroscopic Method for Quantification of Starch in Milk. Int. J. Chem. Stud. 2018, 6, 53–57. [Google Scholar]
  15. Krajang, M.; Malairuang, K.; Sukna, J.; Rattanapradit, K.; Chamsart, S. Single-Step Ethanol Production from Raw Cassava Starch Using a Combination of Raw Starch Hydrolysis and Fermentation, Scale-up from 5-L Laboratory and 200-L Pilot Plant to 3000-L Industrial Fermenters. Biotechnol. Biofuels 2021, 14, 1–15. [Google Scholar] [CrossRef]
  16. Boonpo, S.; Kungwankunakorn, S. Study on Amylose Iodine Complex from Cassava Starch by Colorimetric Method. J. Adv. Agric. Technol. 2017, 4, 345–349. [Google Scholar] [CrossRef]
  17. Fröhlich-Nowoisky, J.; Kampf, C.J.; Weber, B.; Huffman, J.A.; Pöhlker, C.; Andreae, M.O.; Lang-Yona, N.; Burrows, S.M.; Gunthe, S.S.; Elbert, W.; et al. Bioaerosols in the Earth System: Climate, Health, and Ecosystem Interactions. Atmos. Res. 2016, 182, 346–376. [Google Scholar] [CrossRef] [Green Version]
  18. Zhang, Y.; Steiner, A.L. Projected Climate-Driven Changes in Pollen Emission Season Length and Magnitude over the Continental United States. Nat. Commun. 2022, 13, 1–10. [Google Scholar] [CrossRef]
  19. Després, V.R.; Huffman, J.A.; Burrows, S.M.; Hoose, C.; Safatov, A.S.; Buryak, G.; Fröhlich-Nowoisky, J.; Elbert, W.; Andreae, M.O.; Pöschl, U.; et al. Primary Biological Aerosol Particles in the Atmosphere: A Review. Tellus B Chem. Phys. Meteorol. 2012, 64, 15598. [Google Scholar] [CrossRef] [Green Version]
  20. Anderegg, W.R.L.; Abatzoglou, J.T.; Anderegg, L.D.L.; Bielory, L.; Kinney, P.L.; Ziska, L. Anthropogenic Climate Change Is Worsening North American Pollen Seasons. Proc. Natl. Acad. Sci. USA 2021, 118, e2013284118. [Google Scholar] [CrossRef]
  21. Ariano, R.; Canonica, G.W.; Passalacqua, G. Possible Role of Climate Changes in Variations in Pollen Seasons and Allergic Sensitizations during 27 Years. Ann. Allergy Asthma Immunol. 2010, 104, 215–222. [Google Scholar] [CrossRef]
  22. D’Amato, G.; Chong-Neto, H.J.; Monge Ortega, O.P.; Vitale, C.; Ansotegui, I.; Rosario, N.; Haahtela, T.; Cecchi, L.; Bergmann, C.; Ridolo, E.; et al. The Effects of Climate Change on Respiratory Allergy and Asthma Induced by Pollen and Mold Allergens. Eur. J. Allergy Clin. Immunol. 2020, 75, 2219–2228. [Google Scholar] [CrossRef] [PubMed]
  23. May, N.W.; Olson, N.E.; Panas, M.; Axson, J.L.; Tirella, P.S.; Kirpes, R.M.; Craig, R.L.; Gunsch, M.J.; China, S.; Laskin, A.; et al. Aerosol Emissions from Great Lakes Harmful Algal Blooms. Environ. Sci. Technol. 2018, 52, 397–405. [Google Scholar] [CrossRef] [PubMed]
  24. Estillore, A.D.; Trueblood, J.v; Grassian, V.H. Atmospheric Chemistry of Bioaerosols: Heterogeneous and Multiphase Reactions with Atmospheric Oxidants and Other Trace Gases. Chem. Sci. 2016, 7, 6604–6616. [Google Scholar] [CrossRef] [PubMed] [Green Version]
  25. Axelrod, K.; Samburova, V.; Khlystov, A.Y. Relative Abundance of Saccharides, Free Amino Acids, and Other Compounds in Specific Pollen Species for Source Profiling of Atmospheric Aerosol. Sci. Total Environ. 2021, 799, 149254. [Google Scholar] [CrossRef]
  26. Kumar, R.; Bansal, V.; Patel, M.B.; Sarpal, A.S. Compositional Analysis of Algal Biomass in a Nuclear Magnetic Resonance (NMR) Tube. J. Algal Biomass Util. 2014, 5, 36–45. [Google Scholar]
  27. Chalbot, M.-C.G.; Gamboa da Costa, G.; Kavouras, I.G. NMR Analysis of the Water-Soluble Fraction of Airborne Pollen Particles. Appl. Magn. Reson. 2013, 44, 1347–1358. [Google Scholar] [CrossRef]
  28. Hughes, D.D.; Mampage, C.B.A.; Jones, L.M.; Liu, Z.; Stone, E.A. Characterization of Atmospheric Pollen Fragments during Springtime Thunderstorms. Environ. Sci. Technol. Lett. 2020, 7, 409–414. [Google Scholar] [CrossRef]
  29. Mampage, C.B.A.; Hughes, D.D.; Jones, L.M.; Metwali, N.; Thorne, P.S.; Stone, E.A. Characterization of Sub-Pollen Particles in Size-Resolved Atmospheric Aerosol Using Chemical Tracers. Atmos. Environ. X 2022, 15, 100177. [Google Scholar] [CrossRef]
  30. Burkart, J.; Gratzl, J.; Seifried, T.M.; Bieber, P.; Grothe, H. Isolation of Subpollen Particles (SPPs) of Birch: SPPs Are Potential Carriers of Ice Nucleating Macromolecules. Biogeosciences 2021, 18, 5751–5765. [Google Scholar] [CrossRef]
  31. Noranizan, M.A.; Dzulkifly, M.H.; Russly, A.R. Effect of Heat Treatment on the Physico-Chemical Properties of Starch from Different Botanical Sources. Int. Food Res. J. 2010, 17, 127–135. [Google Scholar]
  32. Roberts, S.A.; Cameron, R.E. The Effects of Concentration and Sodium Hydroxide on the Rheological Properties of Potato Starch Gelatinisation. Carbohydr. Polym. 2022, 50, 133–143. [Google Scholar] [CrossRef]
  33. Sun, Q.; Gong, M.; Li, Y.; Xiong, L. Effect of Dry Heat Treatment on the Physicochemical Properties and Structure of Proso Millet Flour and Starch. Carbohydr. Polym. 2014, 110, 128–134. [Google Scholar] [CrossRef] [PubMed]
  34. Baldwin, R.R.; Bear, R.S.; Rundle, R.E. The Relation of Starch-Iodine Absorption Spectra to the Structure of Starch and Starch Components. J. Am. Chem. Soc. 1944, 66, 111–115. [Google Scholar] [CrossRef]
  35. McGrance, S.J.; Cornell, H.J.; Rix, C.J. A Simple and Rapid Colorimetric Method for the Determination of Amylose in Starch Products. Starch/Staerke 1998, 50, 158–163. [Google Scholar] [CrossRef]
  36. Hermansson, A.-M.; Svegmark, K. Developments in the Understanding of Starch Functionality. Trends Food Sci. Technol. 1996, 7, 345–353. [Google Scholar] [CrossRef]
  37. Ripp, J. Analytical Detection Limit Guidance & Laboratory Guide for Determining Method Detection Limits; Wisconsin Department of Natural Resources, Laboratory Certification Program: Madison, WI, USA, 1996. [Google Scholar]
  38. Brust, H.; Orzechowski, S.; Fettke, J. Starch and Glycogen Analyses: Methods and Techniques. Biomolecules 2020, 10, 1020. [Google Scholar] [CrossRef]
  39. Ross, A.; Willson, V.L. Independent Samples T-Test. In Basic and Advanced Statistical Tests; Sense Publishers: Rotterdam, The Netherlands, 2017; pp. 13–16. [Google Scholar]
  40. Pacini, E.; Guarnieri, M.; Nepi, M. Pollen Carbohydrates and Water Content during Development, Presentation, and Dispersal: A Short Review. Protoplasma 2006, 228, 73–77. [Google Scholar] [CrossRef]
  41. Qin, Y.; Zhang, H.; Dai, Y.; Hou, H.; Dong, H. Effect of Alkali Treatment on Structure and Properties of High Amylose Corn Starch Film. Materials 2019, 12, 1705. [Google Scholar] [CrossRef] [Green Version]
  42. Gou, M.; Wu, H.; Saleh, A.S.M.; Jing, L.; Liu, Y.; Zhao, K.; Su, C.; Zhang, B.; Jiang, H.; Li, W. Effects of Repeated and Continuous Dry Heat Treatments on Properties of Sweet Potato Starch. Int. J. Biol. Macromol. 2019, 129, 869–877. [Google Scholar] [CrossRef]
Figure 1. Optimized procedure of starch preparation for amylose–iodine complex spectrophotometry analysis.
Analytica 03 00027 g001
Figure 2. Absorption spectrum of calibration level 4 (50 μg/mL) at pH 6 and iodine reagent (I2/KI) concentration of 0.2% (which was added to the starch sample (final volume 10 mL)) with a wavelength range of 250–800 nm. The peak absorption is noted at 590 nm. Panel a shows the pH dependance of starch, with 3 pH levels noted near the peak of 590 nm (50 μg/mL). Panel b shows the iodine reagent concentration added to the starch solution, with 3 concentration levels near the peak of 590 nm (50 μg/mL). Full spectra figures at different pH and iodine reagent concentrations are provided in the (supplementary section Figures S3 and S4).
Analytica 03 00027 g002
Figure 3. Concentration of starch per milligram of dry weight of selected bioaerosols on the primary axis, with standard deviations. Standard deviations were calculated based on three separate replicates prepared from the same pre-heated pollen stock sample. Percentage of starch of dry weight is found on the secondary axis.
Analytica 03 00027 g003
Figure 4. Absorbance spectra of selected saccharides with starch standard for reference using a wavelength range of 250–800 nm. Each sample was run using a concentration of 50 μg/mL.
Analytica 03 00027 g004
Figure 5. Deterioration of starch solution after four weeks and four months. Each sample was run at 50 μg/mL in the wavelength range of 250–800 nm.
Analytica 03 00027 g005
Table 1. Bioaerosols used for sample preparation of starch content quantification.
Bioaerosol TypeCommon NameBotanical NameOrigin
PollenLodgepole PinePinus
contorta
Collected in North Lake Tahoe, NV, USA (39°18′03″ N 119°55′22″ W) on 7 July 2020
FungiWestern Gall RustEndocronartium
harknessii
Collected in Mt. Shasta, CA, USA on 31 May 2021
BacteriaHay BacillusBacillus
subtilis
Cultured in the Molecular Microbial Ecology and Genomics Lab at the Desert Research Institute, NV, USA
MicroalgaeSpirulinaArthrospira
platensis
Purchased commercially from Amazon, Inc. (Seattle, WA, USA)
Publisher’s Note: MDPI stays neutral with regard to jurisdictional claims in published maps and institutional affiliations.

