Article

All-Step-in-One Test Kit for Paraquat Detection in Water and Vegetable Samples

by
Chanakarn Sangsum
1,2 and
Phoonthawee Saetear
1,2,*
1
Flow Innovation-Research for Science and Technology Laboratories (Firstlabs), Mahidol University, Rama 6 Road, Bangkok 10400, Thailand
2
Department of Chemistry and Center of Excellence for Innovation in Chemistry, Faculty of Science, Mahidol University, Bangkok 10400, Thailand
*
Author to whom correspondence should be addressed.
Analytica 2022, 3(1), 92-105; https://doi.org/10.3390/analytica3010007
Submission received: 9 February 2022 / Revised: 20 February 2022 / Accepted: 21 February 2022 / Published: 23 February 2022

Abstract

:
This work presents the first development of an all-steps-in-one test kit for the determination of paraquat in natural water, and vegetable and agricultural samples. A handheld photometer incorporated with a magnetic stirrer was used to complete the steps of extraction, mixing, and detection. Paraquat produces a blue free radical ion via a reduction with sodium dithionite in alkaline conditions. Sodium dithionite powder was investigated for the enhancement of reagent stability duration, which was added directly into sample solution that showed insignificant difference in sensitivity as compared with that of the solution format of sodium dithionite. The developed test kit showed good performance with the linear calibration of 0.5 to 10 mg L−1 with a high coefficient of determination (r2 = 0.9947). The lower limit of quantitation (LLOQ = 3SD of intercept per slope) carried out from the method using the handheld photometer was 0.50 mg L−1. The limit of detection (LOD) by naked eye was 0.30 mg L−1. The recovery study was acceptable in the range of 101–115%. Intraday (n = 3) and interday (n = 3) precision was less than 1%. On the basis of the significance test at the 95% confidence interval, quantitative results of the developed test kit agreed well with those from high-performance liquid chromatography (HPLC). To the best of our knowledge, this is the first report demonstrating an online extraction for vegetables incorporated into a test kit, applicable for on-site analysis. Single-point calibration based on the Beer–Lambert law also demonstrated the measurement of paraquat. In testing with a nominal standard solution of 5.00 mg L−1 paraquat, the reading concentration was 5.09 ± 0.03 mg L−1 paraquat (n = 20) with a K value of 0.0967 (close to the slope of multipoint calibration). This research is a direct benefit to agricultural products and the health of a population for the analysis of pesticides and herbicides.

1. Introduction

Paraquat is highly toxic to humans, causing damage to the liver, lungs, heart, and kidneys, and contributes to the development of Parkinson’s disease even at concentrations of 3–5 mg kg−1 [1,2]. In addition, paraquat was involved in many cases of acute poisoning and even death when ingested in high doses. Paraquat is also toxic to algae, fish, and other aquatic organisms such as crayfish and insects. Residual paraquat can be degraded by microbiological and photochemical processes. However, the degradation process is slow, especially in soil clay. The paraquat ion is strongly attracted to the negative charge of soil and it becomes adsorbed residue paraquat in environment with a half-life from 1.3 to 13 years [3]. The overuse of paraquat in agriculture causes residue pollution and contamination in the environment. Thus, paraquat was banned in some countries, such as China, Korea, Brazil, and EU country members [4]. The United States Environment Protection Agency (US EPA) has limited paraquat at 0.03 mg L−1 in drinking water and 0.0045 mg kg−1 day−1 for acceptable daily intake (ADI). Thailand also has a regulation of usage limitation of paraquat with the following maximal allowed level of paraquat: (1) the Pollution Control Department, Ministry of Natural Resources and Environment (PCD) of Thailand: 0.5 mg L−1 in water for fresh water animal [5], and (2) the Thailand Food and Drug Administration (FDA): 0.005–2 mg L−1 in food (based on type of food or agricultural product) [6], reported in Food Containing Pesticide Residues.
Some test kits were developed for the analysis of paraquat by using colorimetric reaction, which produces a change in color, one of the simplest ways to interpret a signal for people without scientific skill. The common chemical reaction for paraquat detection is based on a reduction of paraquat using dithionite in alkaline medium forming blue paraquat radical ion. Besides sodium dithionite, several reducing agents such as phenyl hydrazine [7], sodium borohydride [8,9], ascorbic acid [10,11,12], and sodium dithionite [13,14,15,16], are employed. Moreover, an electrostatic interaction between paraquat and gold nanoparticles modified with sodium 3-mercapto-1- 1propanesulfonate (AuNPs-3MPS) was proposed with changing the solution color from red to blue-gray [17].
Commercial paraquat test kits are sold and widely used for the detection of paraquat poisoning in patients. A simple colorimetric test using dithionite from Syngenta® (Basel, Switzerland) is used to identify paraquat in the urine and stomach contents. The test kit can only be provided with positive or negative results, considered on the basis of the color change into blue. There are two available test kits developed by Thai organizations. The Department of Medical Science, Ministry of Public Health of Thailand developed a test kit for drinking water and urine with detection limits of 0.03 and 0.1 mg L−1, respectively. The Department of Chemistry, Faculty of Science, Naresuan University proposed the NU Test Kit, to detect paraquat in agricultural products, soil, and water. Its working range is from 0.20 to 40 mg L−1 with a limit of detection of 0.25 mg L−1. Both test kits are based on the semiquantitative analysis of paraquat with a standard color chart to estimate the concentration of paraquat.
To the best of our knowledge, we present, for the first time, a fully furnished test kit with an all-steps-in-one operation, including the extraction, mixing, and detection of paraquat. The test kit was developed by employing a well-known colorimetric reaction with sodium dithionite as reducing agent to form the blue of paraquat radical ion. Detection is based on using a handheld photometer incorporated with a magnetic stirrer. The photometer and stirrer are connected via programmable command embedded in the printed circuit board. The developed test kit offers convenient and rapid extraction and measurement by simply adding a sample and color-forming reagent (reducing agent) into the reaction cell. At a certain time, the stirrer’s mixed solution becomes homogeneous, and the absorbance of the blue product can be measured, subsequently displaying the concentration of paraquat. With single-point calibration, the concentration of paraquat is shown on the digital screen of the handheld photometer. The proposed test kit has potential in quantitative analysis for screening and determination of paraquat in natural water, vegetables, and agricultural products.

2. Materials and Methods

2.1. Chemicals and Reagents

All solutions were prepared in deionized (DI) Milli-Q® water. A 1000 mg L−1 paraquat (PQ) stock standard solution was prepared by dissolving an appropriate amount of paraquat dichloride hydrate (Sigma Aldrich, St. Louis, MO, USA) in DI water in a volumetric flask. The stock solution was kept in a plastic bottle at 4 °C. Working solutions of paraquat were obtained by appropriate dilution with DI water.
A color-forming reagent was freshly prepared at concentration 0.1% (w/v) by dissolving the 0.10 g of sodium dithionite (Sigma Aldrich, St. Louis, MO, USA) in 0.06 mol L−1 sodium hydroxide (Merck, Darmstadt, Germany) and increasing the volume to 100.0 mL with a sodium hydroxide solution in volumetric flask. This reagent is unstable and should be used within 3 h.
Interfering species investigated in this work were glyphosate, diquat, atrazine, and propanil. All were purchased from Sigma Aldrich (St. Louis, MO, USA). Anion and cations were prepared from ionic salts (NaCl, NaNO3, Na2CO3, Na2SO4, Na3PO4, Mg(NO3)2· 6H2O and CaCl2· 2H2O) purchased from Merck (Darmstadt, Germany).

2.2. Sample

2.2.1. Commercial Product of Paraquat Pesticide

The commercial solution was purchased from the local market in Thailand. Two different brands of samples were labeled with a concentration at 20% (w/v) of paraquat ion. Consequently, the sample solution was diluted with DI water to obtain the concentration at 0.5 and 5.0 mg L−1 of paraquat.

2.2.2. Water Sample

Natural water samples were collected from different agricultural fields and rivers near the agricultural area in Suphan Buri province, Thailand. All water samples were kept in plastic bottles at 4 °C until used.

2.2.3. Vegetable Samples

The vegetable samples were collected from a local market in Thailand. Vegetables were cut into small pieces and weighed at 20 g for each sample. Then, 200 mL of DI water was added to rinse out the paraquat residue on the vegetables. Filtration was then applied using a no.1 filter paper. Each clear extractant was spiked with a standard paraquat solution to obtain final concentrations of 0.5 and 5.0 mg L−1, and recovery values for paraquat detection were studied.
In addition, a daikon radish sample was selected to investigate the possibility of online extraction with weighing 1 g of sample and adding 10 mL of DI water into the reaction cell, stirring for 1 min. Then, it was spiked with a standard paraquat solution to obtain a final concentration of 5.0 mg L−1 for the recovery study.
Percentages of recoveries were determined by the following equation:
% Recovery = ( C spiked   sample C sample   C standard ) × 100 %
where Cspiked sample: concentration of paraquat found in sample spiked with standard; Csample: concentration of paraquat found in sample; and Cstandard: concentration of standard.

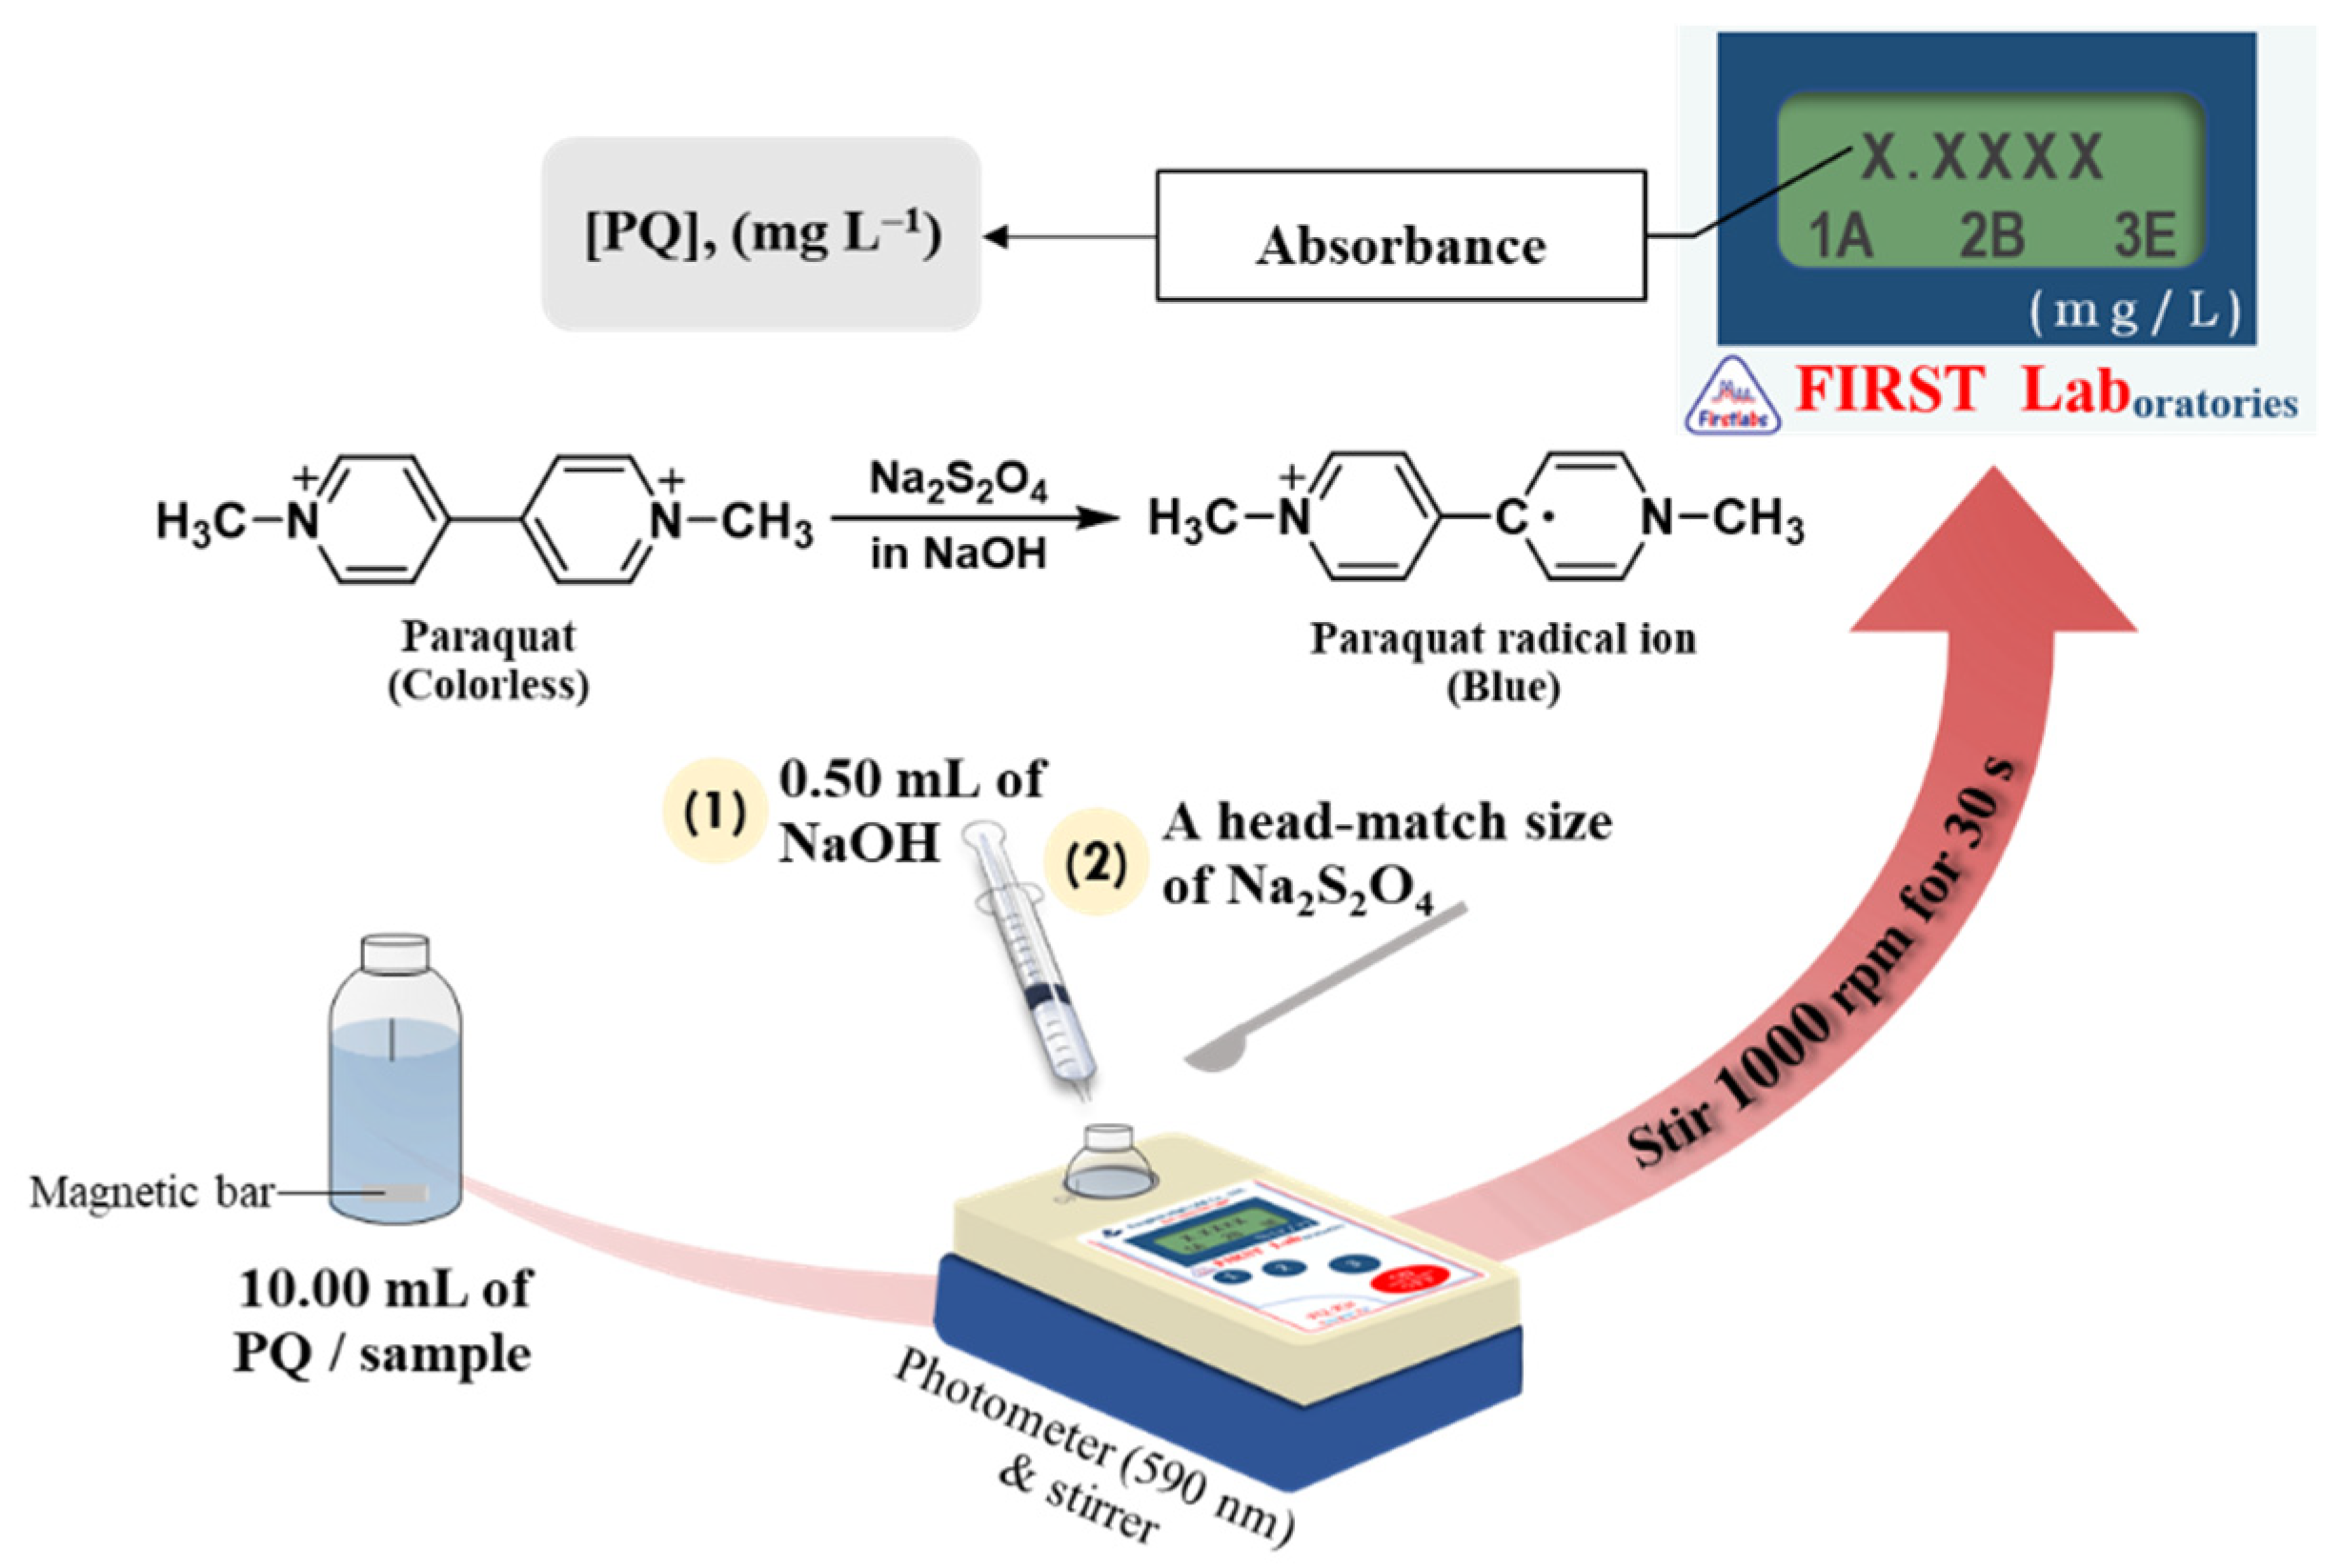
2.3. Paraquat Test Kit

The paraquat test kit consists of a handheld photometer (Bangkok High Lab Co., Ltd., Bangkok, Thailand) equipped with light-emitting diode (LED) at 590 nm and a magnetic stirrer programable from the circuit board embedded in the photometer. A glass reaction cell (2.3 cm diameter) is used as sample container placed in the sample compartment. Plastic syringes of 1.0 and 10.0 mL were used to transfer sodium hydroxide solution and sample, respectively. A tiny plastic spatula was used to take solid powder of sodium dithionite. A magnetic bar placed inside the reaction cell assists the mixing of solution.
The operation procedure of test kit for paraquat analysis by using a handheld photometer is shown in Figure 1. The operational steps are described as followings.
At 0 s: add 10.00 mL of standard/sample solution into the reaction cell.
At 10 s: add 0.5 mL of alkaline and approximately 5 mg (match-head size) of sodium dithionite powder into the reaction cell.
Allow stirring at 1000 rpm for 30 s.
At 40 s: stop mixing for 20 s.
At 60 s: read the absorbance of blue product or paraquat concentration in mg L−1.

2.4. Validation

A high-performance liquid chromatographic (HPLC) technique coupled with a UV–vis detector used for validation for paraquat detection was adapted from Hara et al. [18]. The method was carried out under isocratic elution mode by using a reverse-phase column (Water Reliant TM C18, 4.6 mm × 150 mm, 5 µm) with mobile phase of 20% (v/v) methanol containing 200 mmol L−1 phosphoric acid, 0.1 mol L−1 diethylamine, and 12 mmol L−1 sodium 1-heptanesulfonate. Flow rate, injection volume, and detection wavelength were 1 mL min−1, 10.00 µL, and 258 nm, respectively. Ambient column temperature was used. For the preparation of the mobile phase, HPLC-grade methanol and mixture solution were vacuum-filtrated through a 0.22 µm nylon membrane filter. Before use, both solutions were degassed in an ultrasonic bath for 15 min. The standard paraquat solution was prepared as described in Section 2.1 for constructing the calibration curve. Standard paraquat and all samples were filtrated through a 0.45 µm nylon syringe filter prior to injection into the HPLC–UV system.

3. Results and Discussion

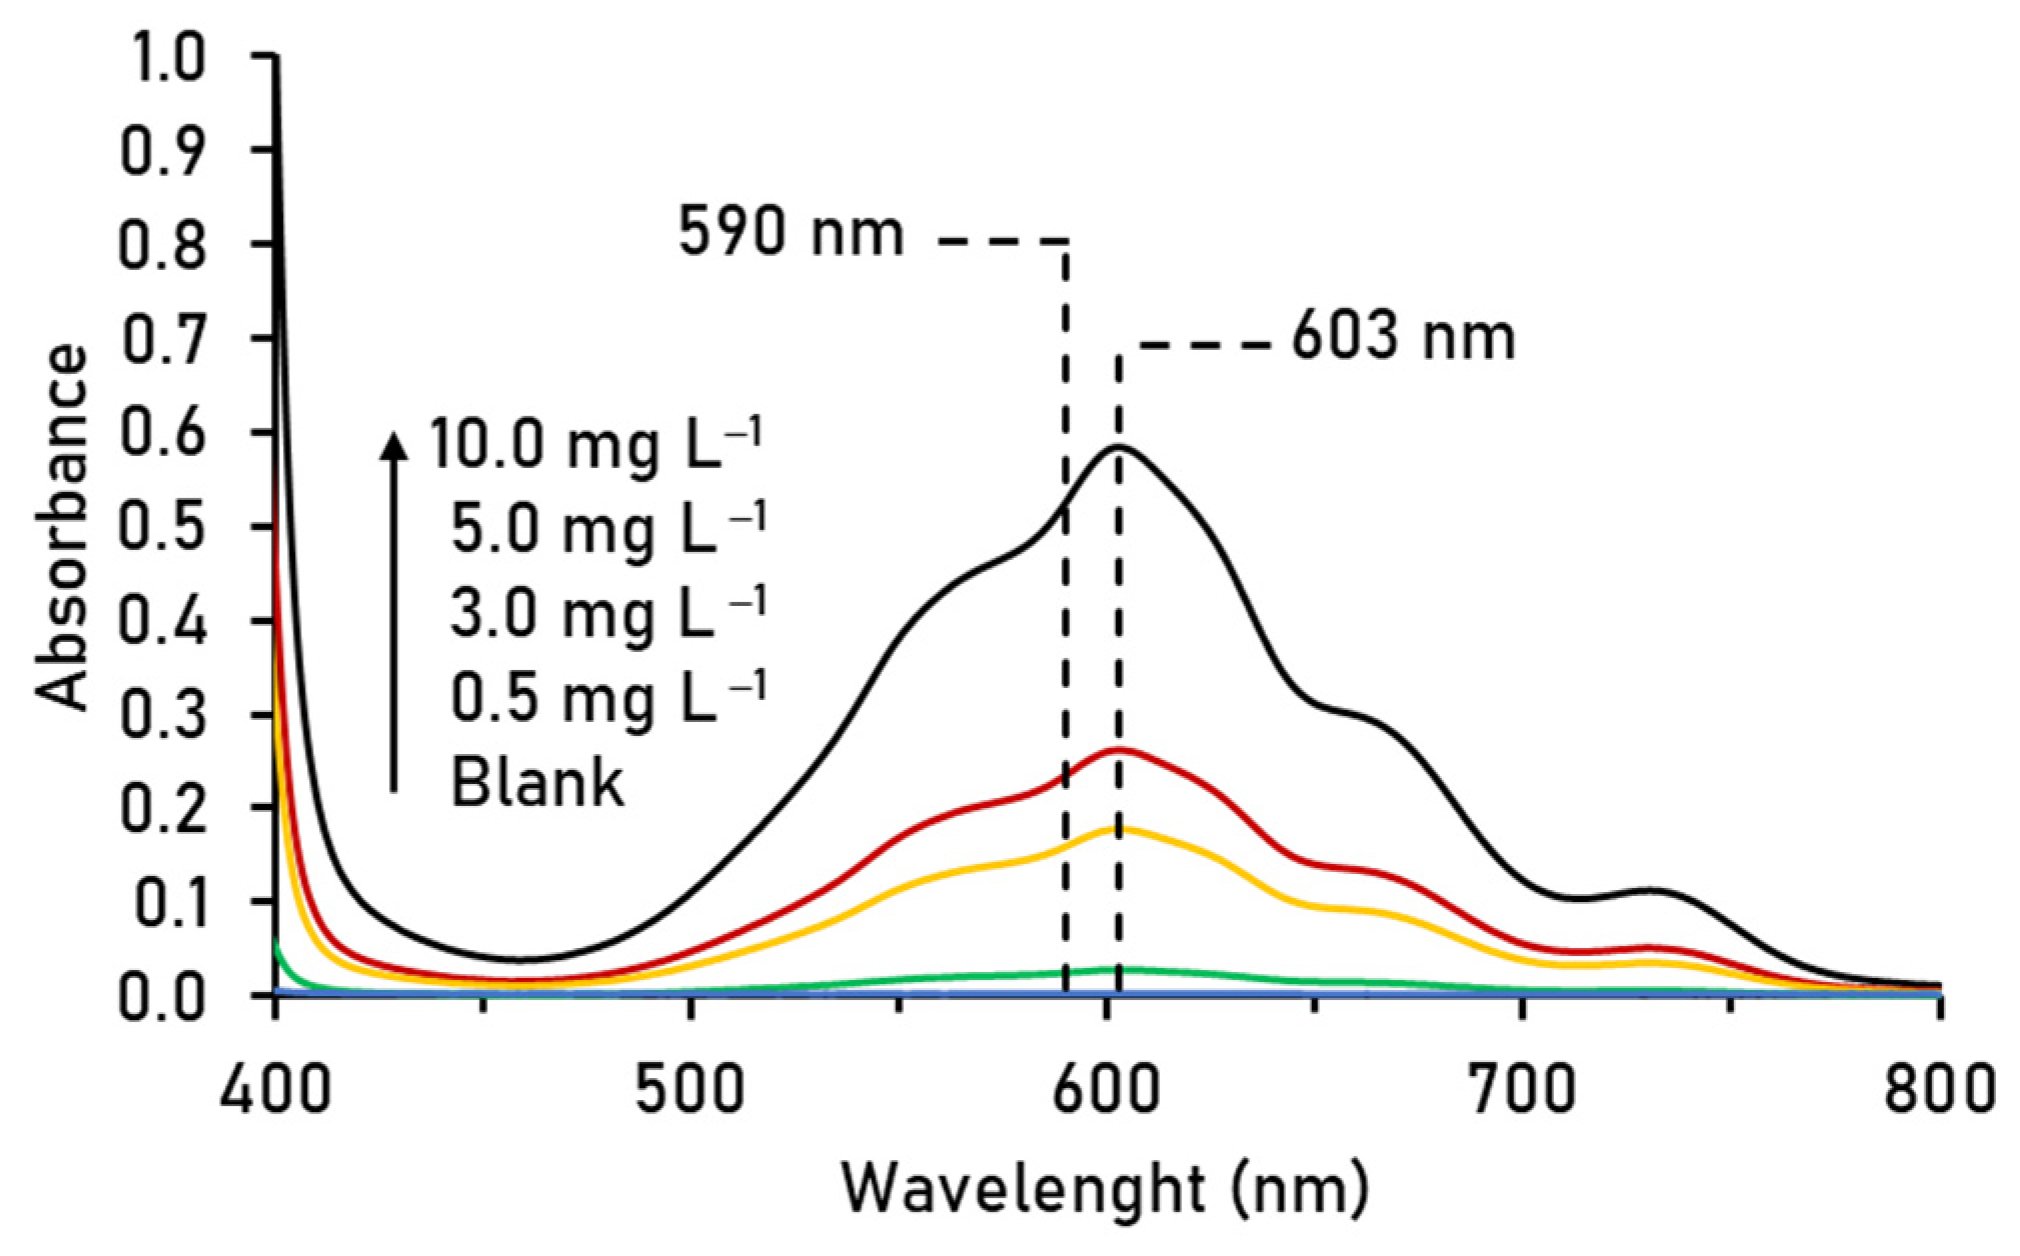
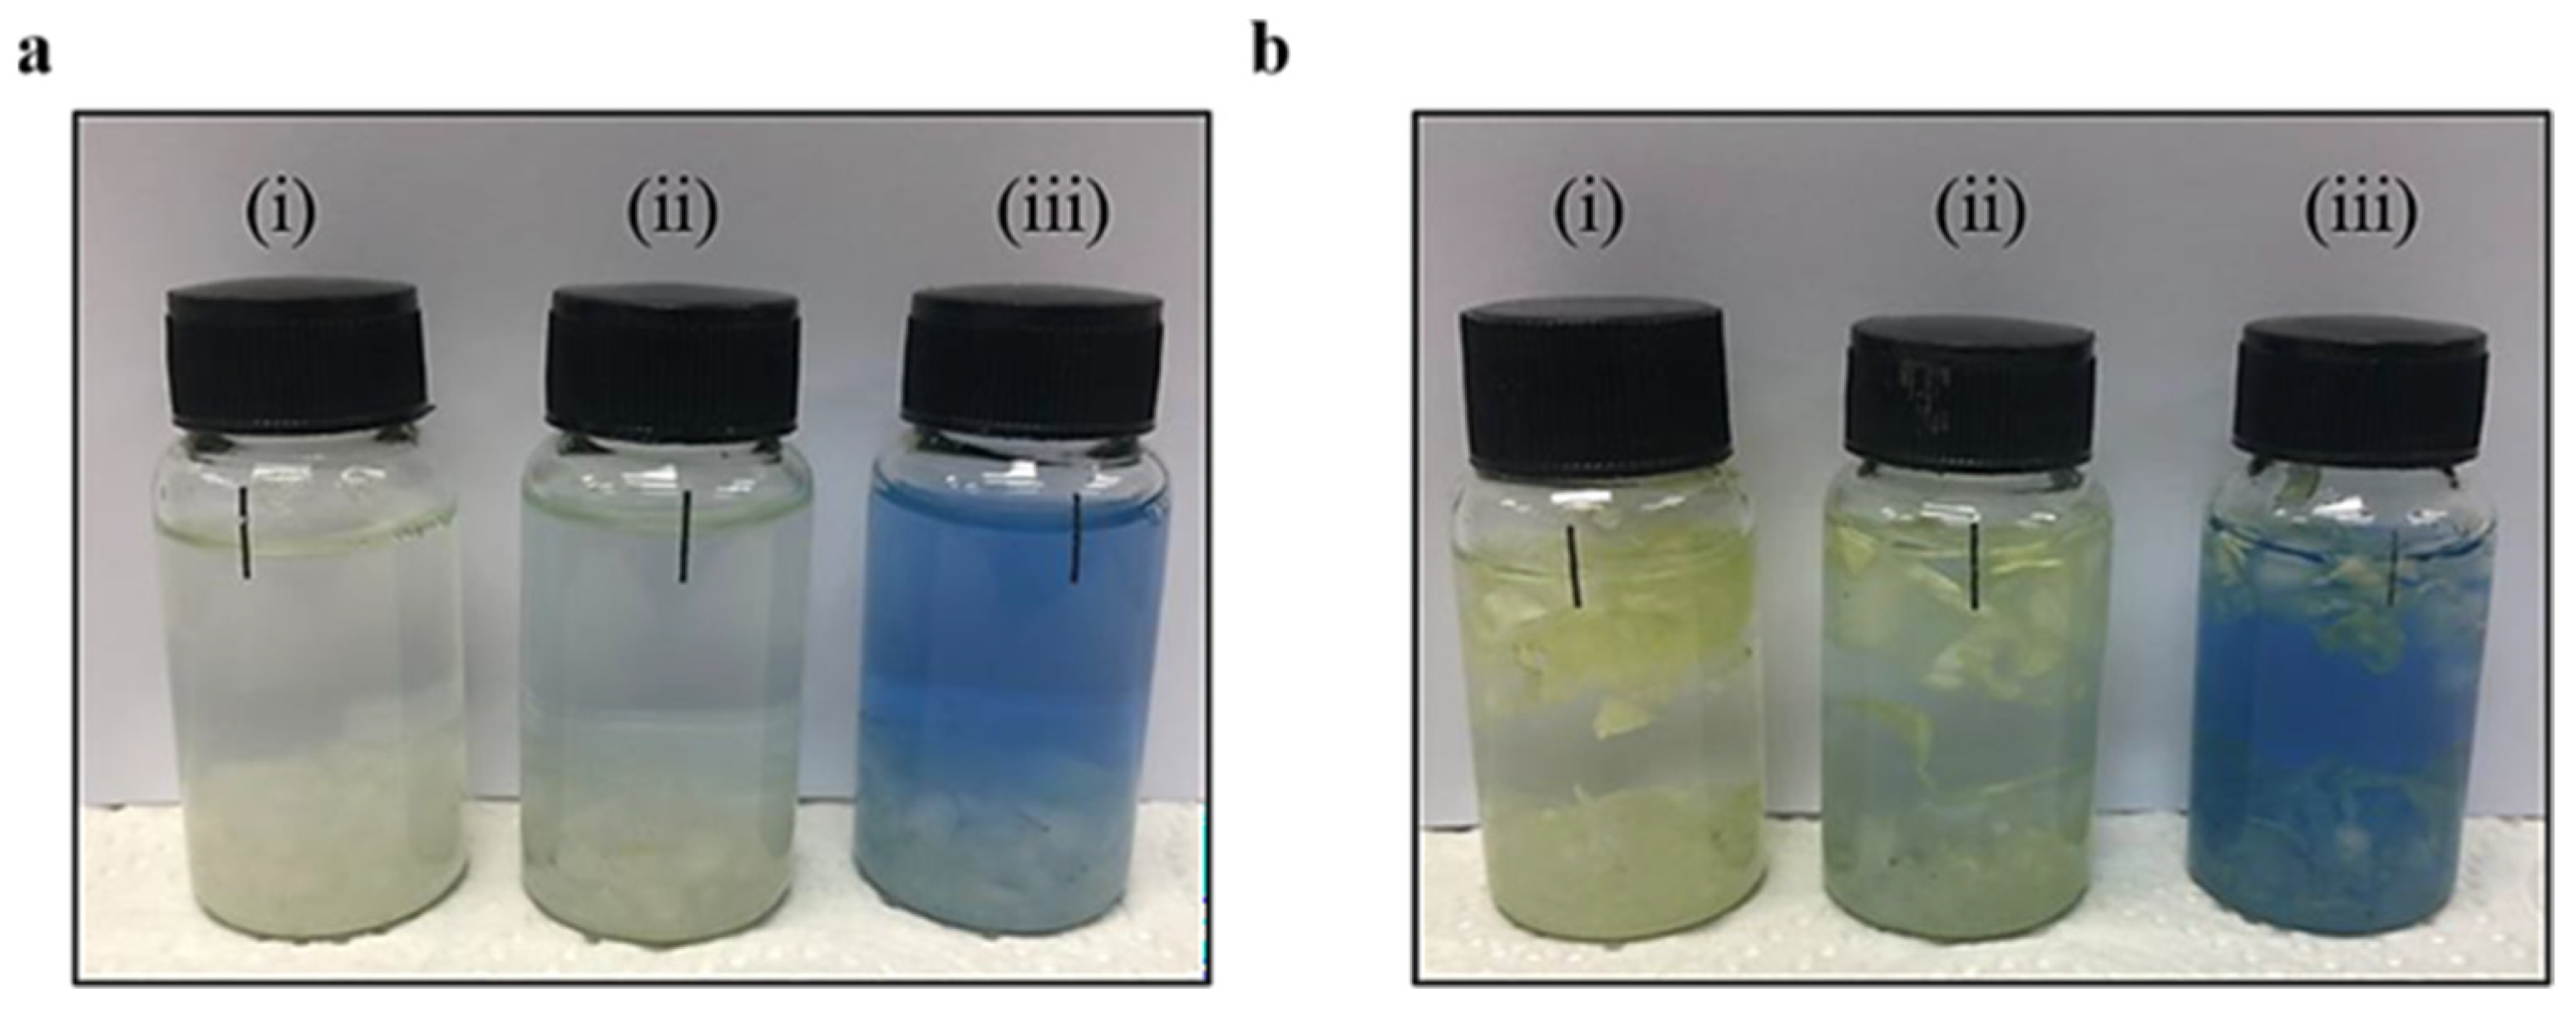
3.1. Spectra of Blue Product of Paraquat Radical Ion

According to the reduction of paraquat ion, sodium dithionite as a reducing agent in alkaline condition reacts with paraquat to produce the blue product of paraquat free radical ion. The spectra of the blue product are shown in Figure 2. As a result, a maximal absorption wavelength (λmax) at 603 nm was observed. The λmax of paraquat free-radical ion was at 603 nm; a handheld photometer equipped with a 590 nm light-emitting diode (LED) was used for the detection of the paraquat free-radical ion since both wavelengths were closed. On the basis of the calibration plots, both detection wavelengths gave comparable slopes of the calibration plots (λmax 603 nm: y = (0.0591 ± 0.0038)x − (0.0123 ± 0.0222), r2 = 0.992; λLED 590 nm: y = (0.0531 ± 0.0034)x − (0.0114 ± 0.0201), r2 = 0.992). Thus, the handheld photometer equipped with a 590 nm LED can be used to detect the blue product of paraquat free-radical ion.

3.2. Optimization

According to the operational procedure mentioned in Section 2.3, physical and chemical parameters were optimized to obtain the suitable procedure for detection of paraquat.

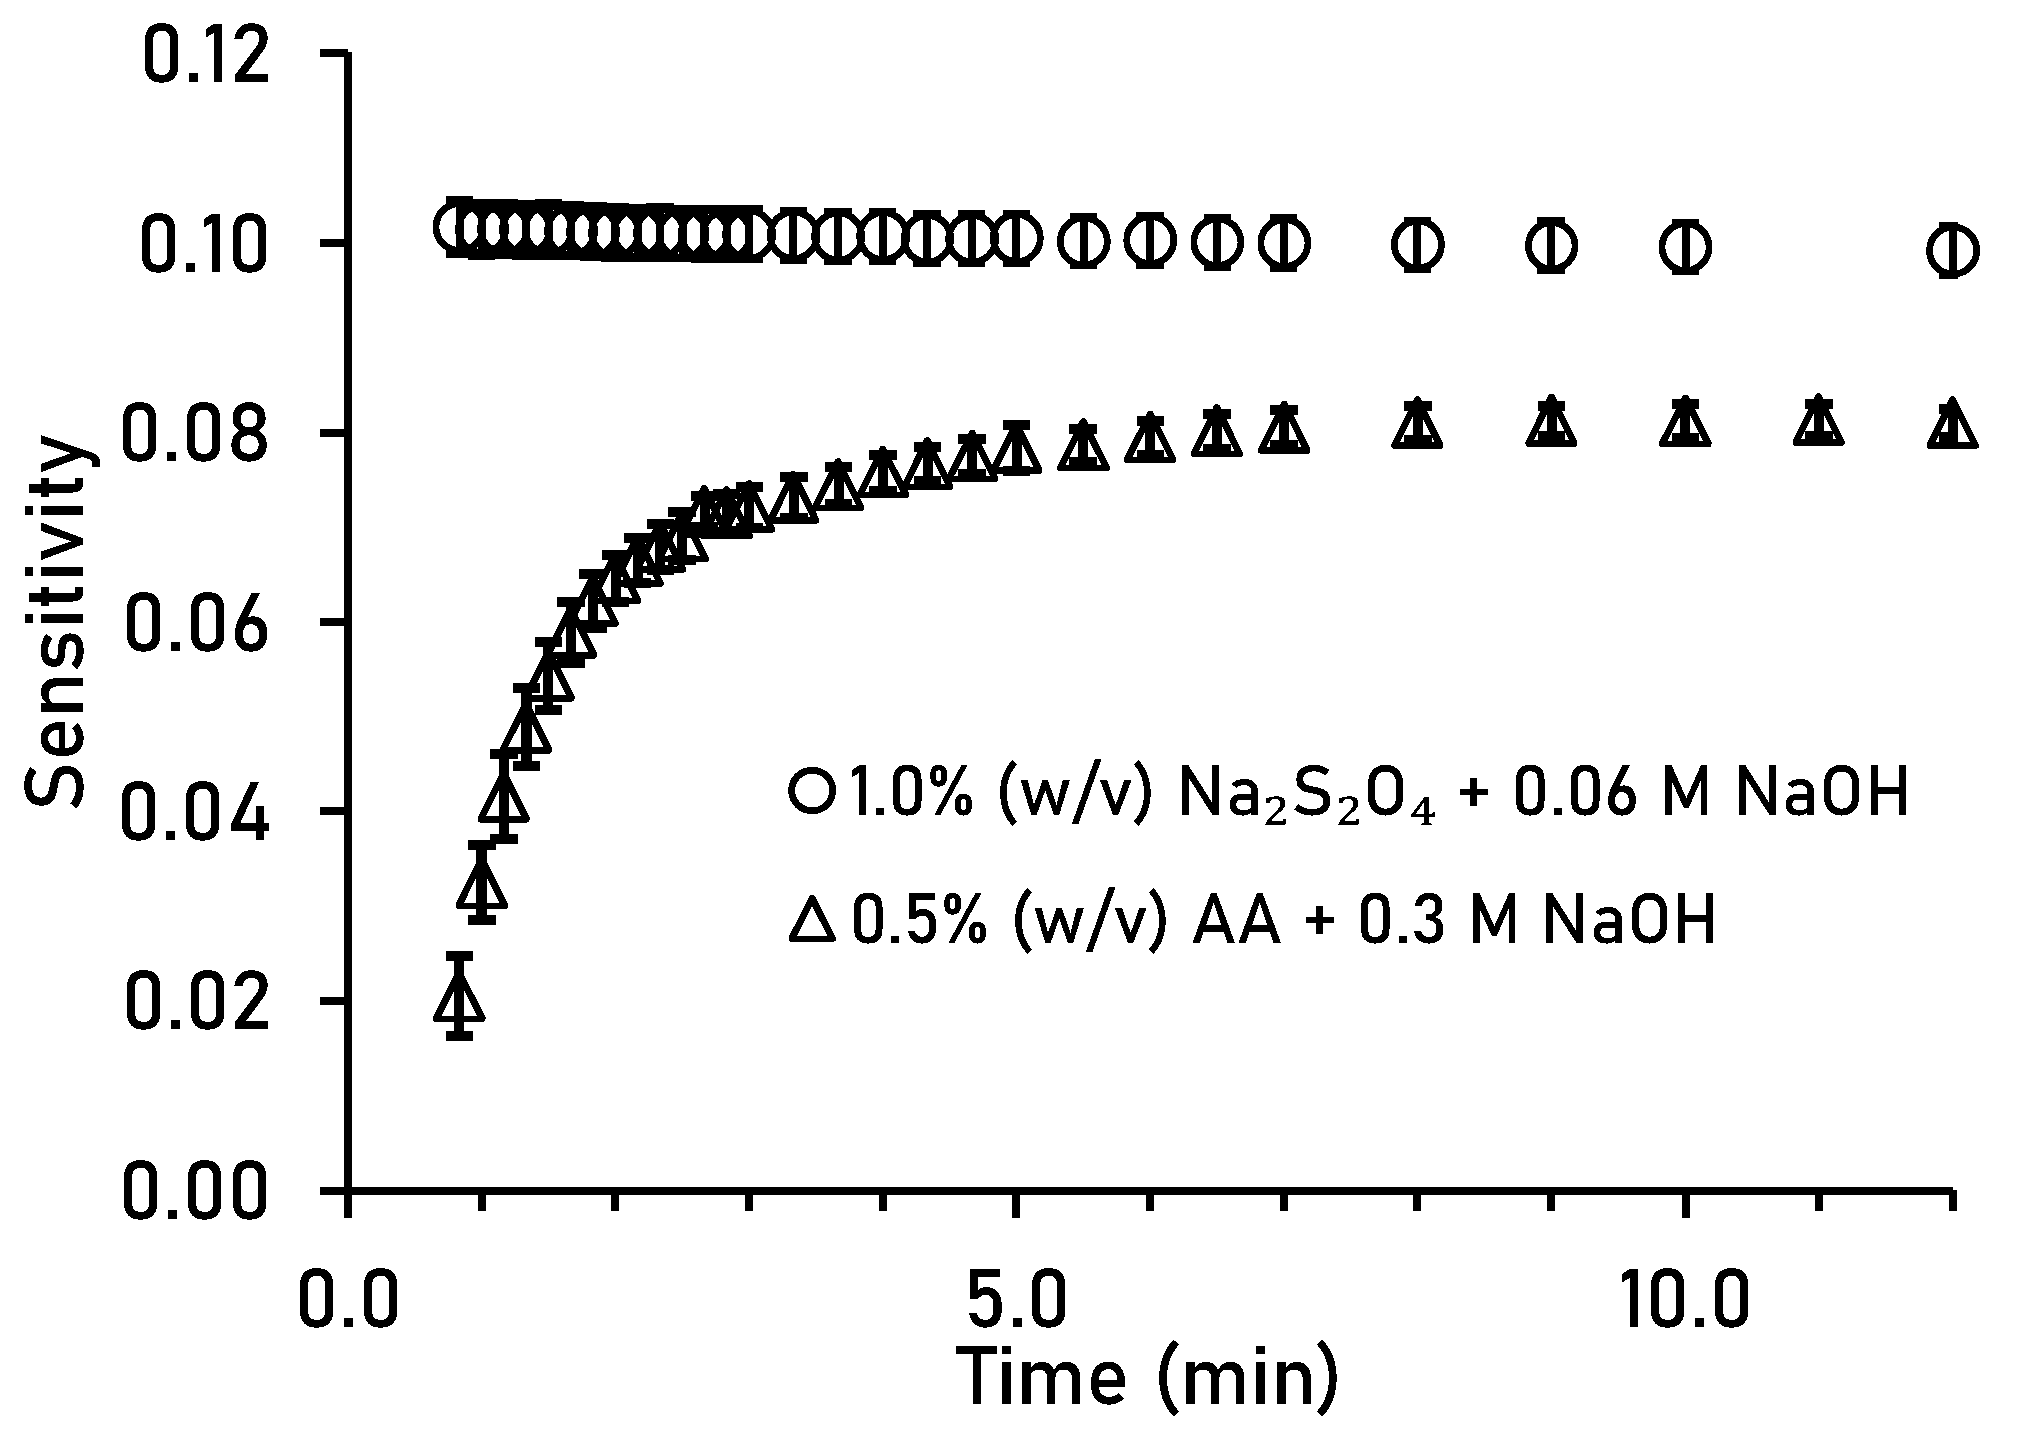
3.2.1. Type of Reducing Agent

The reduction of paraquat was based on reducing an agent under alkaline condition that produces the blue product of paraquat free radical ion. In this work, we studied two different types of reducing agent: sodium dithionite and ascorbic acid (adopted from Shivhare and Gupta, 1991 [19]). The result is shown in Figure 3. Both reducing agents produced the blue free-radical ion within 1 min. However, sodium dithionite was more sensitive than ascorbic acid was due to higher sensitivity from 1 min in. Ascorbic acid took approximately 6–7 min for reaching equilibrium of the reaction and the sensitivity is lower than that of sodium dithionite. In addition, previous works reported that the use of ascorbic acid requires more chemicals for the reducing agent, including potassium iodate as a catalyst and EDTA for masking the metal ions [10,11]. Therefore, sodium dithionite was selected as the reducing agent to form the blue free-radical ion.

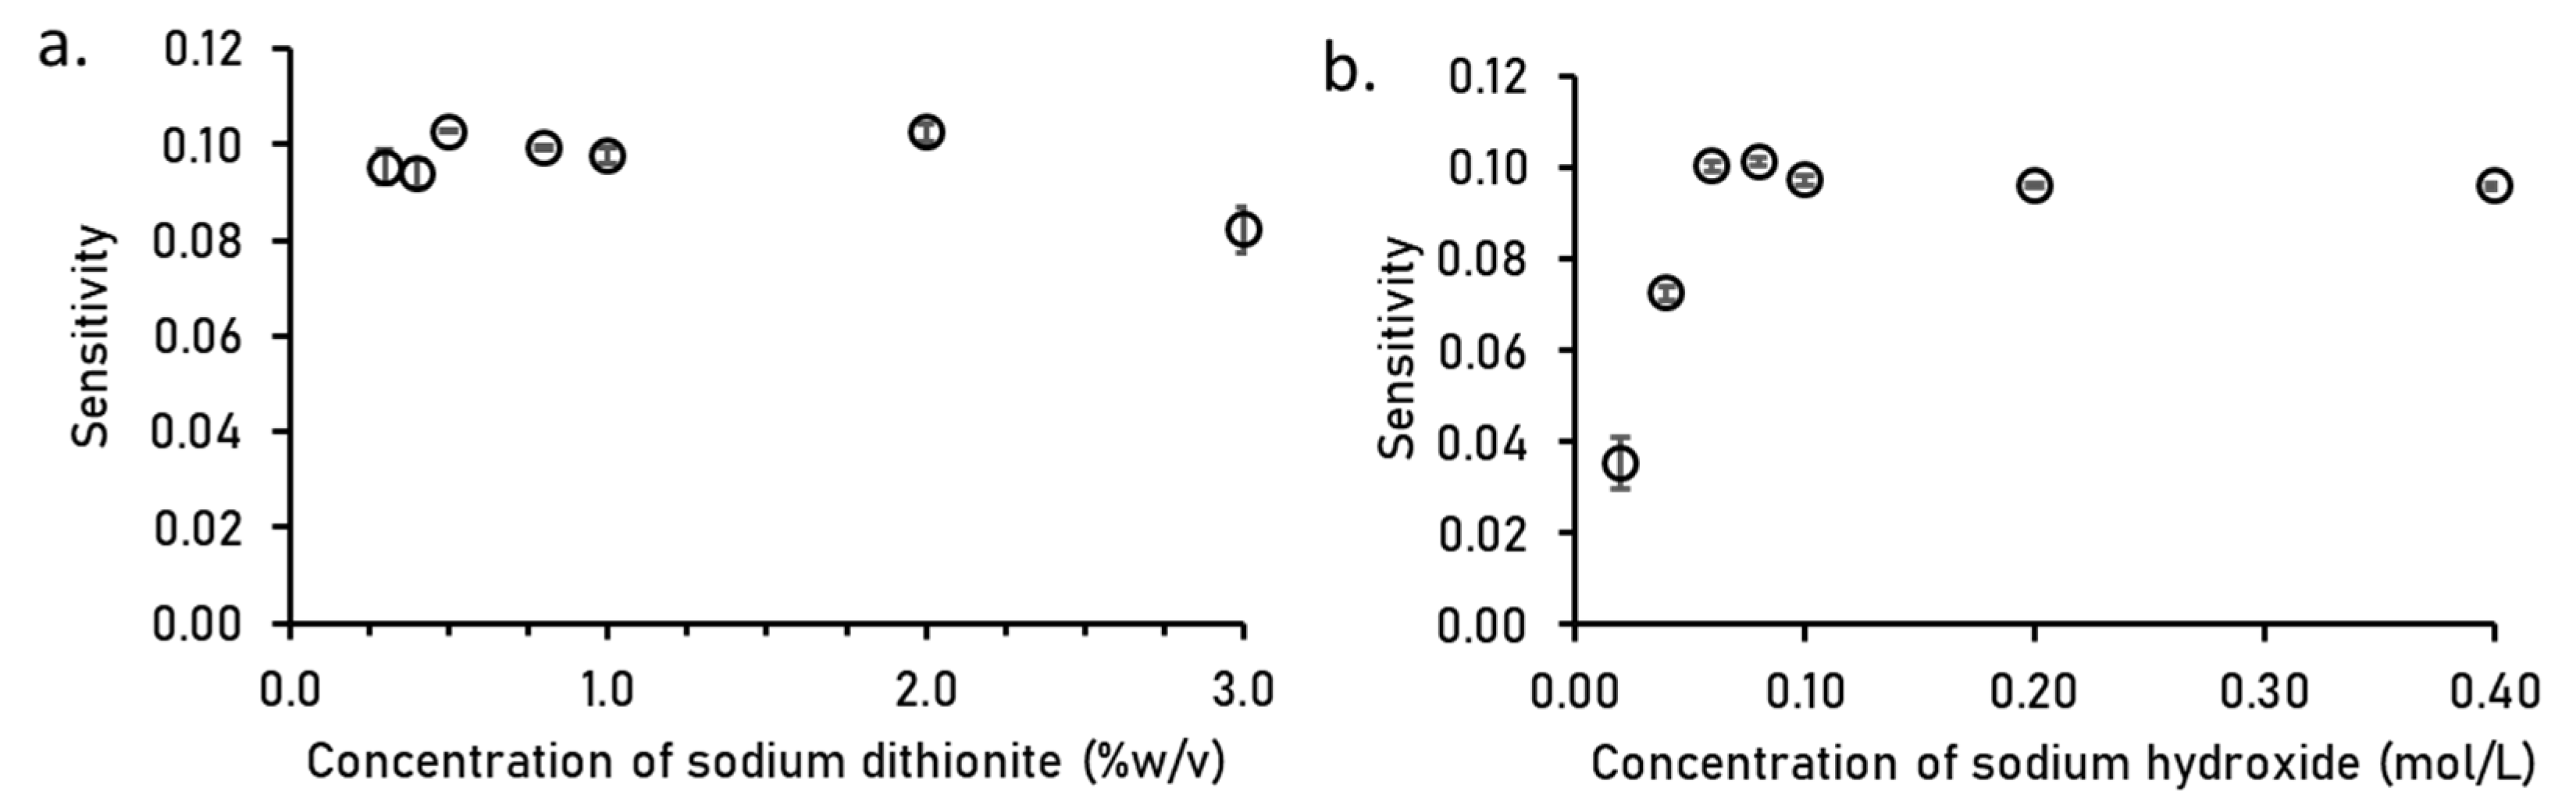
3.2.2. Reagent Concentration in Reducing Agent

Sodium dithionite was selected as the reducing agent to chemically react with paraquat for producing the paraquat free radical ion. Effect of sodium dithionite concentration was investigated. Results shown in Figure 4a indicated that the sensitivity of sodium dithionite concentration at 0.3 to 2.0% (w/v) were not significantly different. Sensitivity slightly decreased with sodium dithionite concentration at 3.0% (w/v) due to higher volatility. To ensure excess sodium dithionite to react with the paraquat ion in the sample, 1.0% (w/v) of sodium dithionite was chosen as the optimal concentration.
Paraquat was reduced under alkaline condition. Sodium dithionite must be stabilized in a strong alkaline solution to prevent loss in ambient condition. In this work, sodium hydroxide was used and investigated, and the result is shown in Figure 4b. Sensitivities significantly increased with the increase in sodium hydroxide concentration from 0.02 to 0.06 mol L−1. When the concentration of sodium hydroxide was more than 0.06 mol L−1 and up to 0.4 mol L−1, sensitivities were not significantly different. A concentration of 0.06 mol L−1 sodium hydroxide (pH 12.8) was selected and adopted for this work. The influence of pH is crucial for the detection of paraquat free-radical ion. There should be a minimal pH of 11.5 for the measuring solution to ensure that the reduction of paraquat would be completed (based on the volume and concentration used in the analysis: 0.50 mL of 0.06 mol L−1 in 10.00 mL of sample).

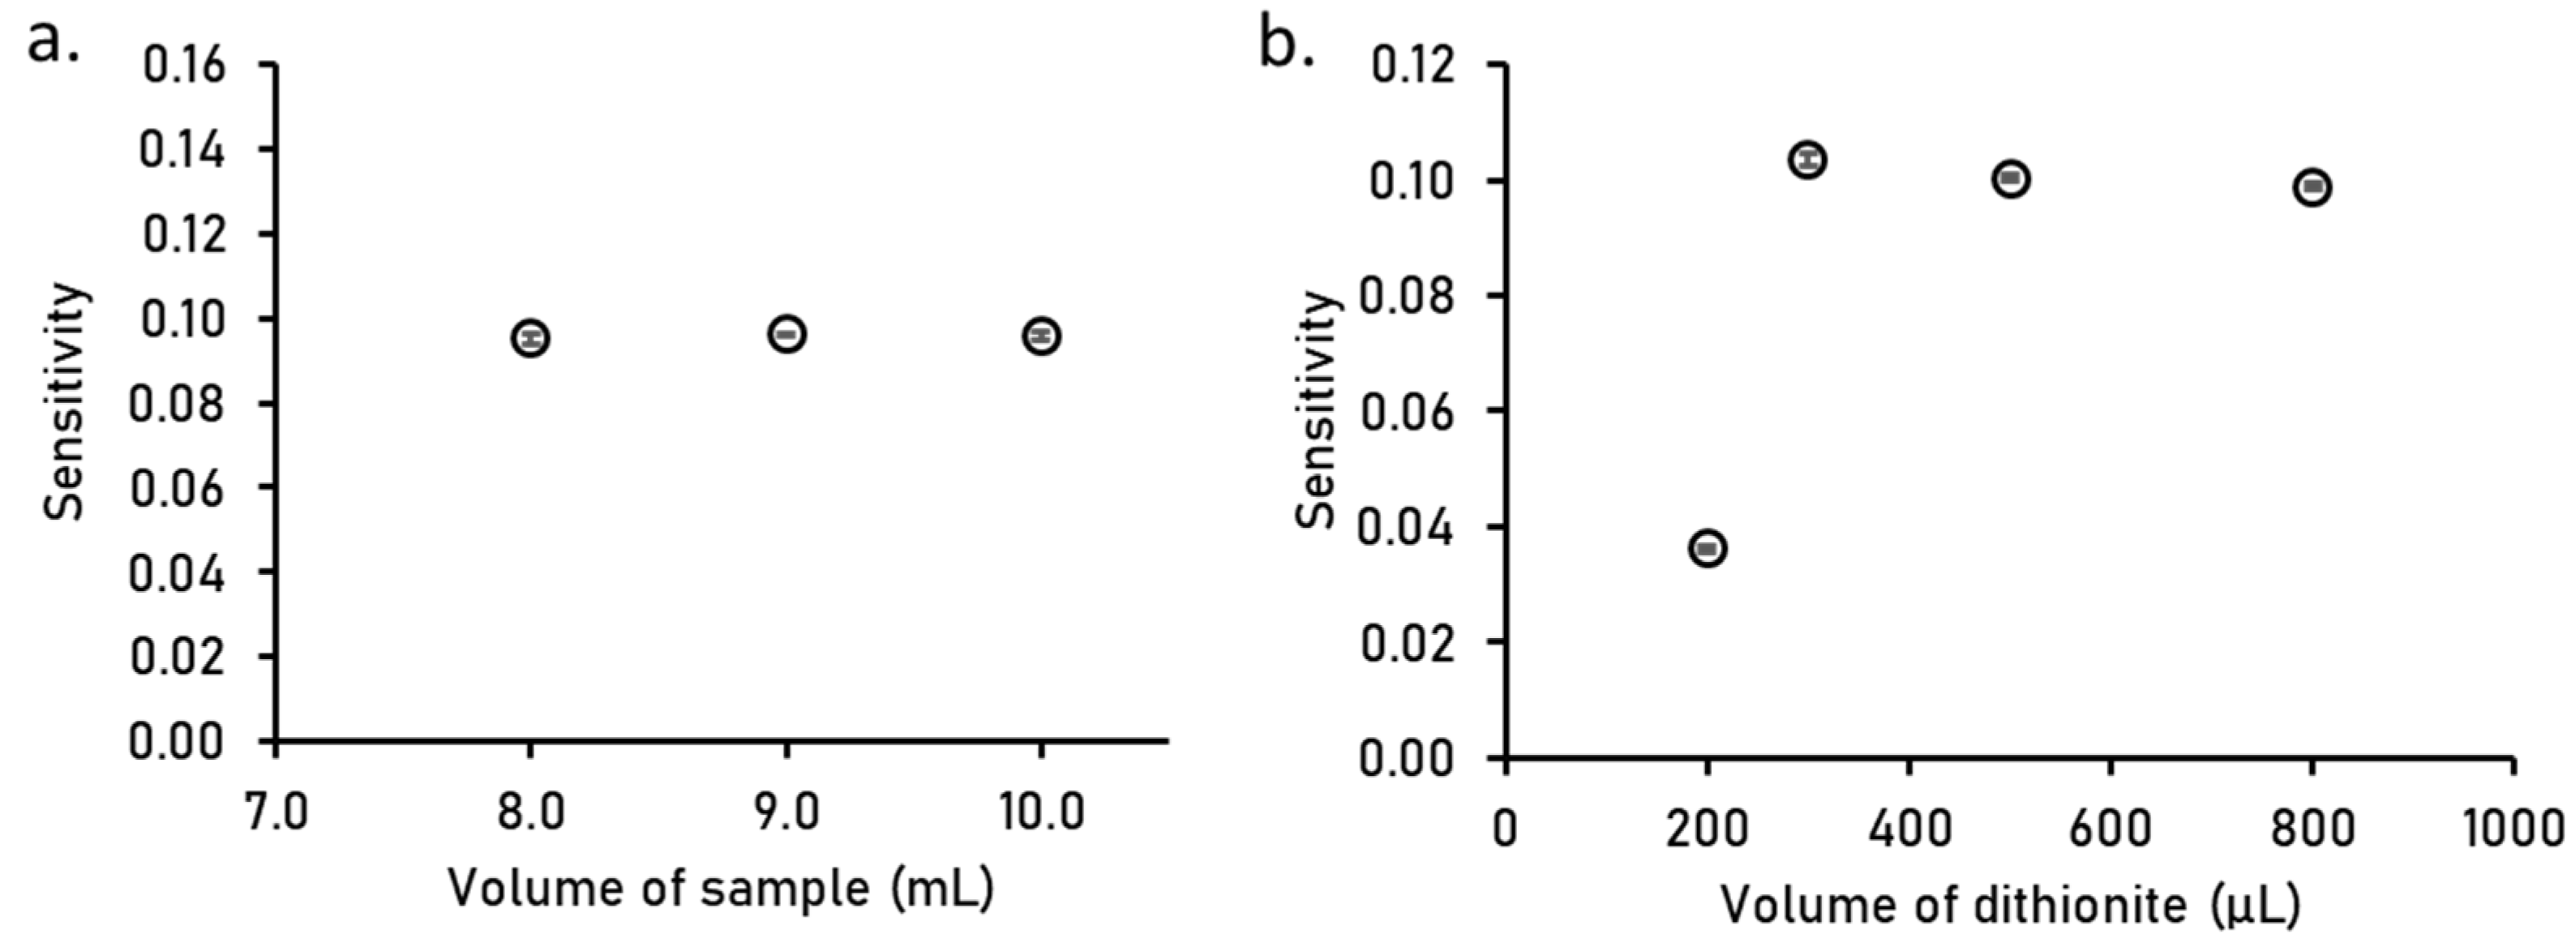
3.2.3. Sample and Reagent Volume

According to the proposed procedure in Section 2.3, paraquat was detected in a 10 mL glass-reaction cell. An 8 mL sample was enough volume for the light path from the LED light source to the photodiode detector. Paraquat was reduced in the reaction cell. Any sample volume above 8 mL was adequate (Figure 5a). However, we also investigated the sample volume from 8 to 10 mL, and 10 mL of the sample was the simplest volume to introduce into the reaction cell. Therefore, 10 mL sample volume was selected.
The volume of color-forming reagent was investigated. The result is shown in Figure 5b. Sensitivities significantly increased when using 200 µL up to 300 µL of reagent. Sensitivities were relatively comparable from 300 to 800 µL of reagent volume due to sufficient sodium dithionite. Therefore, the reagent volume of 500 µL was selected as the optimal condition because this volume gave adequate sensitivity, and it was the simplest volume to introduce in the reaction cell.

3.2.4. Stirring Speed of Magnetic Stirrer

A programmable magnetic stirrer was used to mix sample and reagent to obtain a homogeneous solution. Stirring speed was investigated from 100 to 1250 rpm. Stirring speed did not affect analysis sensitivity. In this work, the stirring speed of the magnetic stirrer at 1000 rpm was chosen as optimal because the solution of this condition was quickly homogeneous without splashing out of the reaction cell. It could also decrease the analytical time of the procedure after adding sample and reagent into the reaction cell. At 1000 rpm speed, analytical time was 1 min.

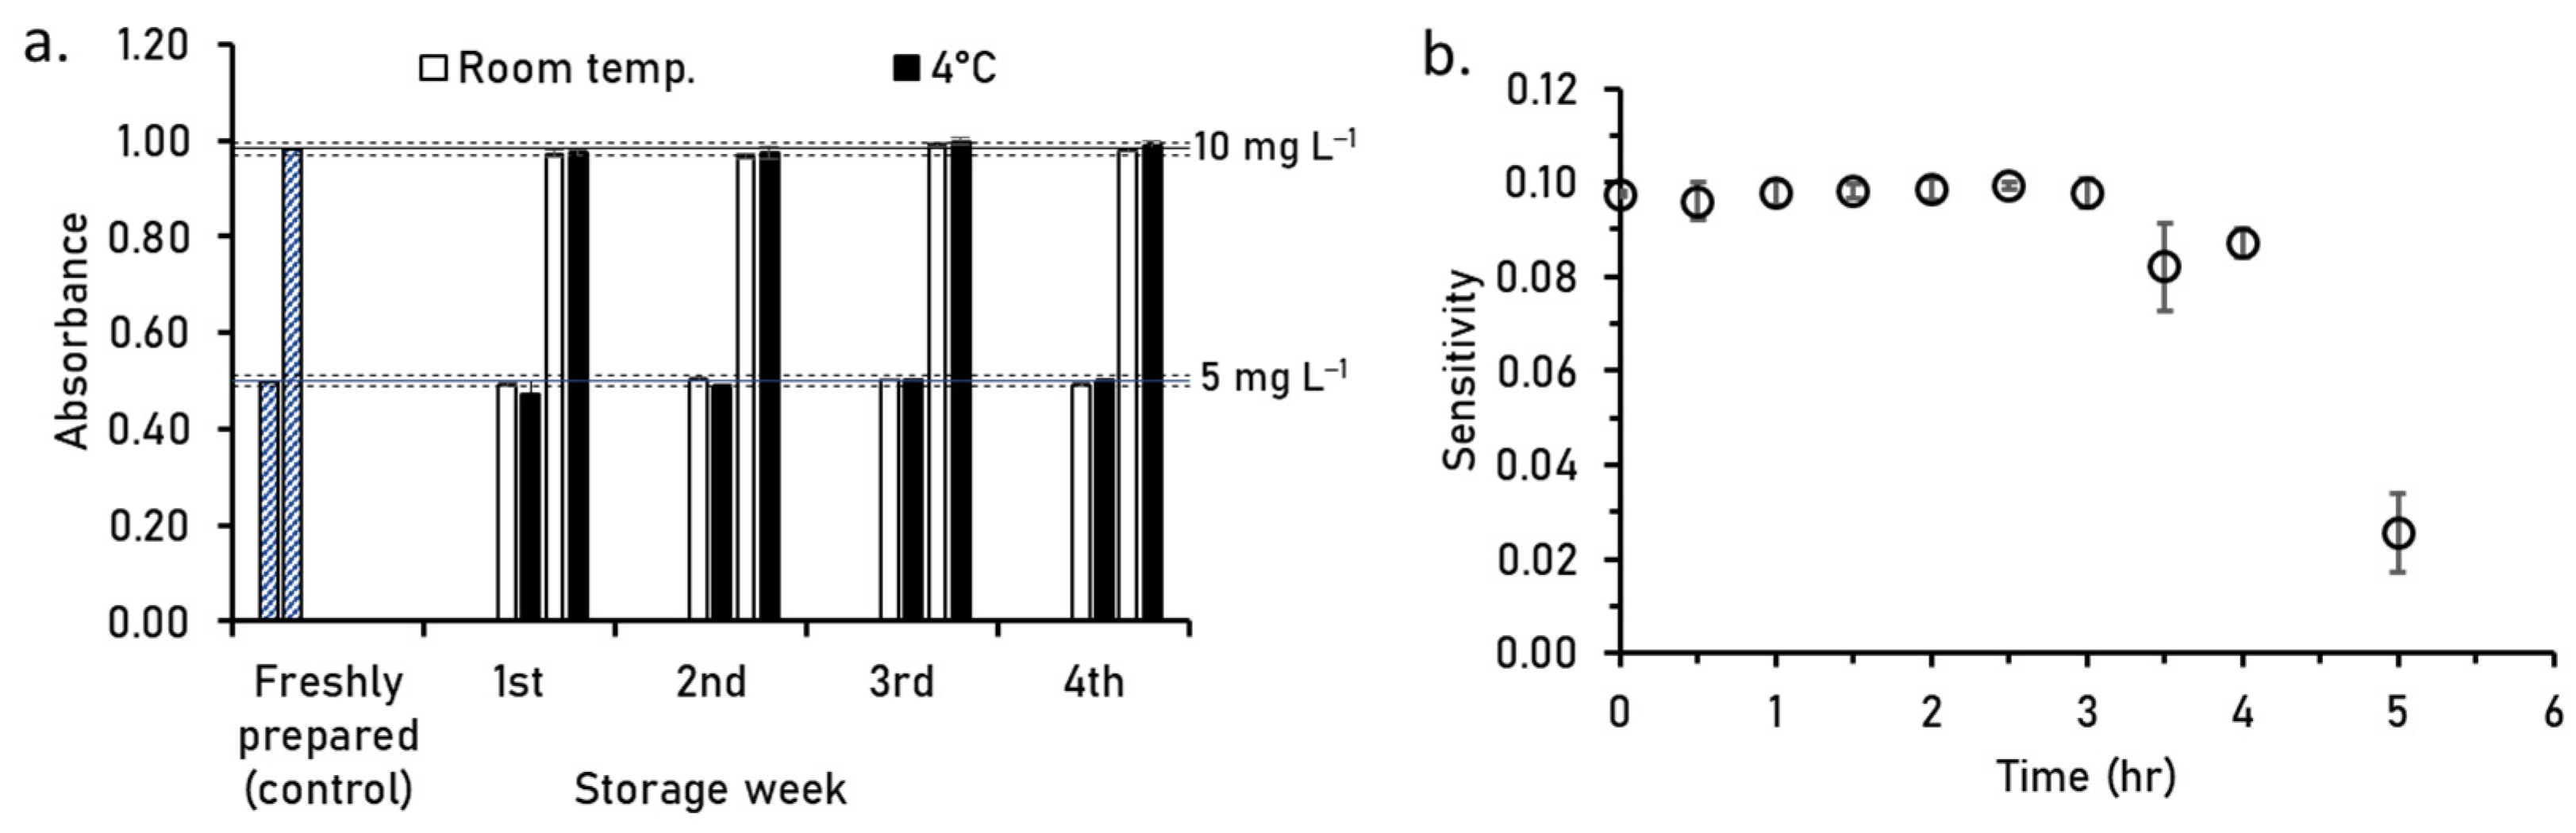
3.3. Stability of Standard Solution and Color-Forming Reagent

The investigation of standard solution stability is shown in Figure 6a. In each storage week, the sensitivities of both paraquat concentrations (5.0 and 10.0 mg L−1) at both storage temperatures (room temperature and at 4 °C) were not significantly different from the control experiment. Regarding the results in Figure 6a, the standard solution can be kept up to 4 weeks even in ambient temperature. However, we accidentally found that standard paraquat can be kept in 4 °C for a year with giving comparable sensitivity for paraquat.
Sodium dithionite in solution format was easily decomposed due to oxidation with oxygen in the air [13], as shown in Equation (1). Strong alkaline condition was used to enhanced the stability of sodium dithionite. Reagent stabilities were comparable with those freshly prepared up to 3 h and significantly decreased with leaning more than 3 h (see Figure 6b). Therefore, this sodium dithionite reagent should be used within 3 h after fresh preparation that was sufficient for laboratory analysis.
Na2S2O4(aq) + O2(g) + H2O(l) → NaHSO4(aq) + NaHSO3(aq)
3Na2S2O4(aq) + 6NaOH(aq) → 5Na2SO3(aq) + Na2S(aq) + 3H2O(l)

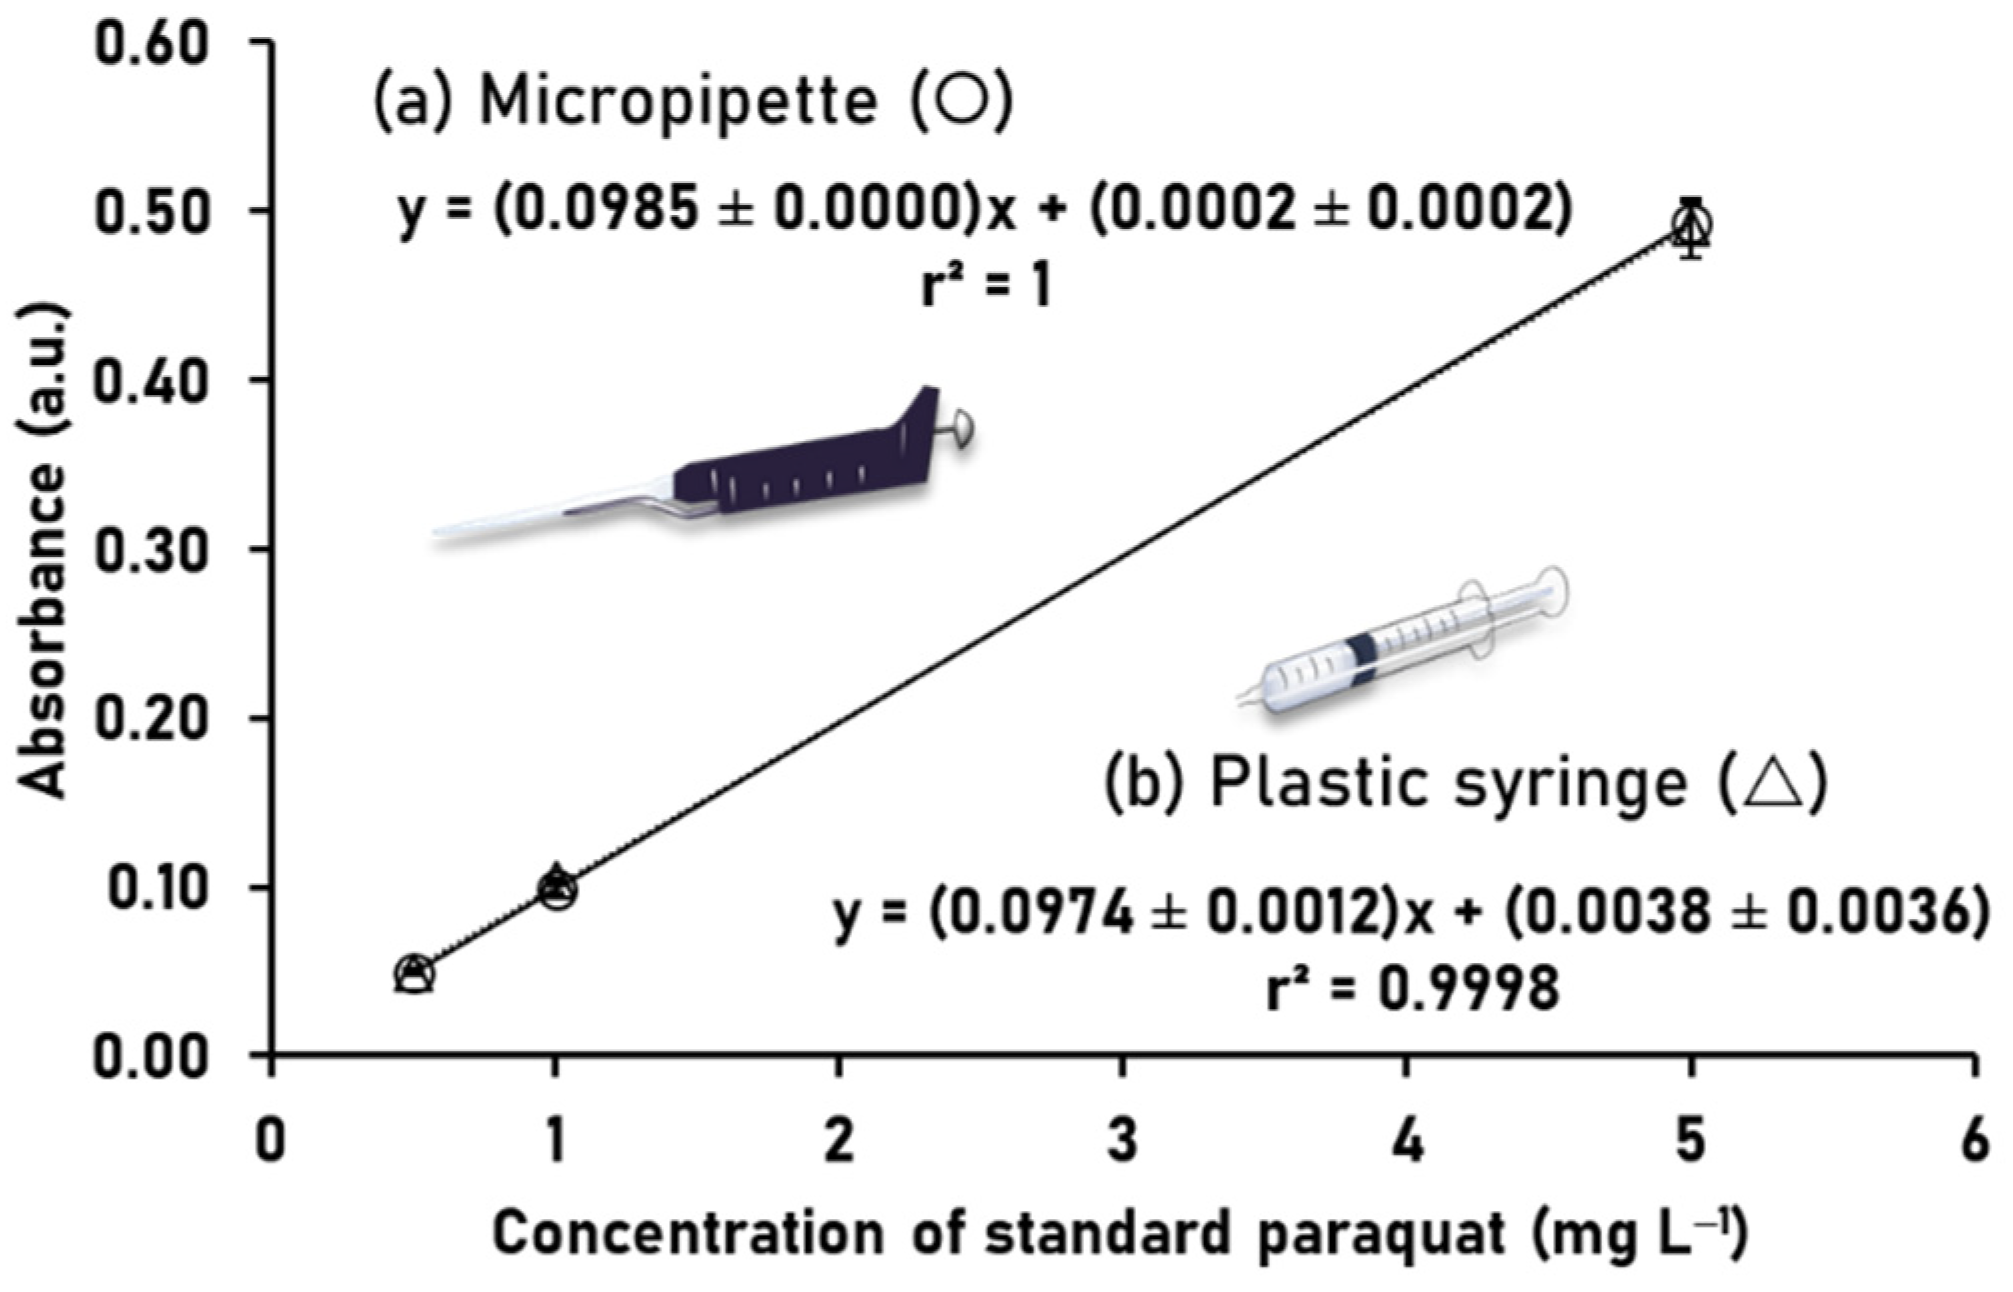
3.4. Transferring Device of Liquid Sample and Reagent

The transferring device must be simple and low-cost when applying the proposed procedure to the test kit. Statistical analysis (t-test) was employed to compare the calibration curves of standard paraquat solution introduced by micropipette and plastic syringe. Figure 7 demonstrates that the obtained absorbance signal from the micropipette was not significantly different to that from the plastic syringe (tstat: 1.12 and tcritical: 2.78 at p = 0.05). This proves that the introduction of the sample by plastic syringe gave acceptable precision to the control volume for the test kit.

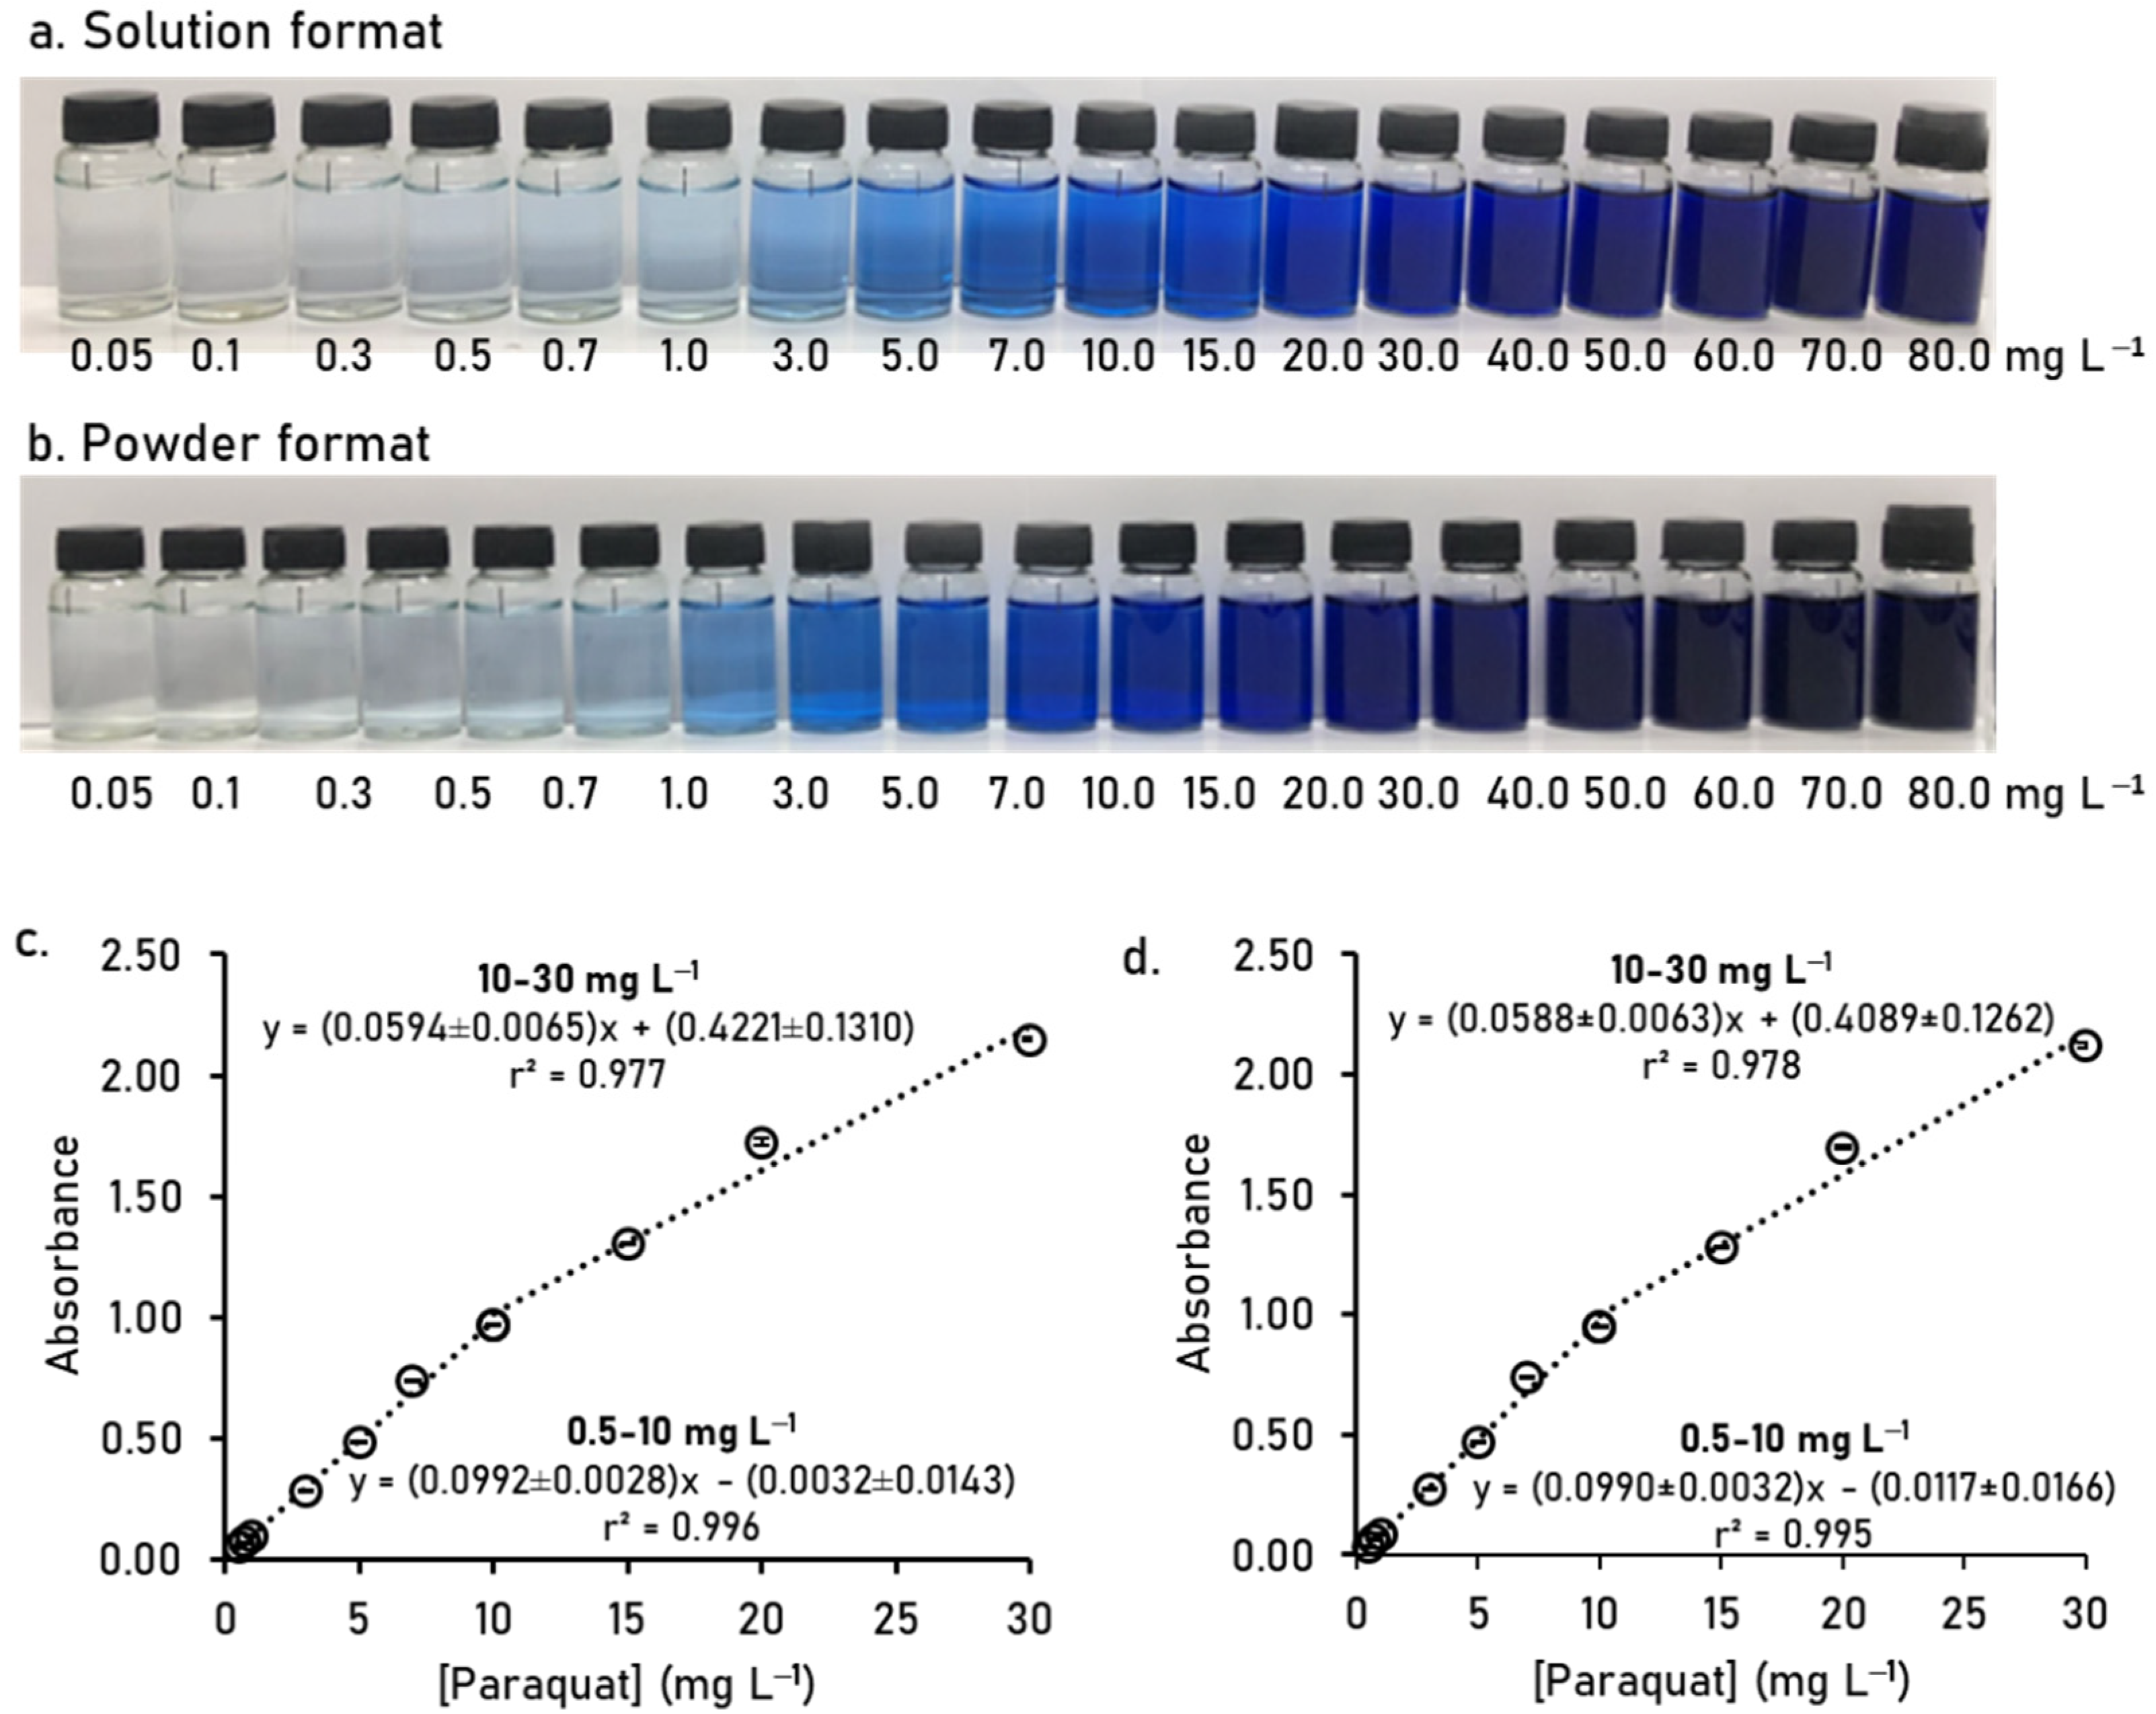
3.5. Format Use of Reducing Agent

According to the stability of sodium dithionite for 3 h, it was too short for applying the proposed method to on-site analysis. Simple and stable reagents are required. Thus, sodium dithionite powder was examined to use instead of solution format. The color shades of the blue product with both formats were similar and based on paraquat concentration, which can be used for naked-eye detection at 0.3 mg L−1 (see Figure 8a,b). Calibration curves of standard paraquat solution from both solution format and powder were comparable (see Figure 8c,d). Results showed good linearity of calibrations and insignificant difference in the sensitivity between both formats (tstat: 0.52 and tcritical: 3.18 at p = 0.05). The powder of the sodium dithionite added directly into the sample was more stable to use as reagent due to the powder format of sodium dithionite being more stable than the solution format.

3.6. Analytical Feature

Under optimal conditions and operation, the analytical performance of developed test kit for the determination of paraquat is shown in Table 1. Values obtained from our method showed good performance with a working range of 0.5–10 mg L−1 and high coefficient of determination. The repeatability of the proposed method was obtained from relative standard deviation (RSD) for 10 replicate additions of 0.5, 5.0, and 10.0 mg L−1 paraquat is 6.35%, 0.67% and 0.86%, respectively. Precision obtained from RSD of the slope of calibration curves is 0.49% for intraday (n = 3) and 0.82% for interday (n = 3) measurements. Moreover, this method is covering the limitation of paraquat with following of the maximum concentration allowance in water for fish water animal of 0.5 mg L−1 [5] and in foodstuffs of 0.005–2 mg L−1 [6]. The proposed procedure could be applied for the determination of paraquat in natural water and agricultural products.
The signal and sensitivity obtained from the handheld photometer were compared to those obtained from the spectrophotometer. The sensitivity (slope of the calibration plot) from the handheld photometer was higher than that from the spectrophotometer (handheld photometer: 0.0992 a.u. L mg−1 and spectrophotometer: 0.0531 a.u. L mg−1). This is because the path lengths of the reaction cell were different, which obeyed Beer–Lambert’s law. The spectrophotometer used a 1 cm cuvette pathlength; our photometer used a 2.3 cm reaction cell diameter.

3.7. Tolerance Limit for Possible Interfering Species

In this study, some anions and cations were investigated by spiking possible interfering species into water containing 1.0 mg L−1 of paraquat solution. Tolerance concentration was defined as the concentration that did not vary by more than 5% for the analytical signal of 1 mg L−1 paraquat. The tolerance limit levels of different foreign species are presented in Table 2. Almost all species at a concentration normally found in natural water did not interfere.

3.8. Analysis of Paraquat in Samples

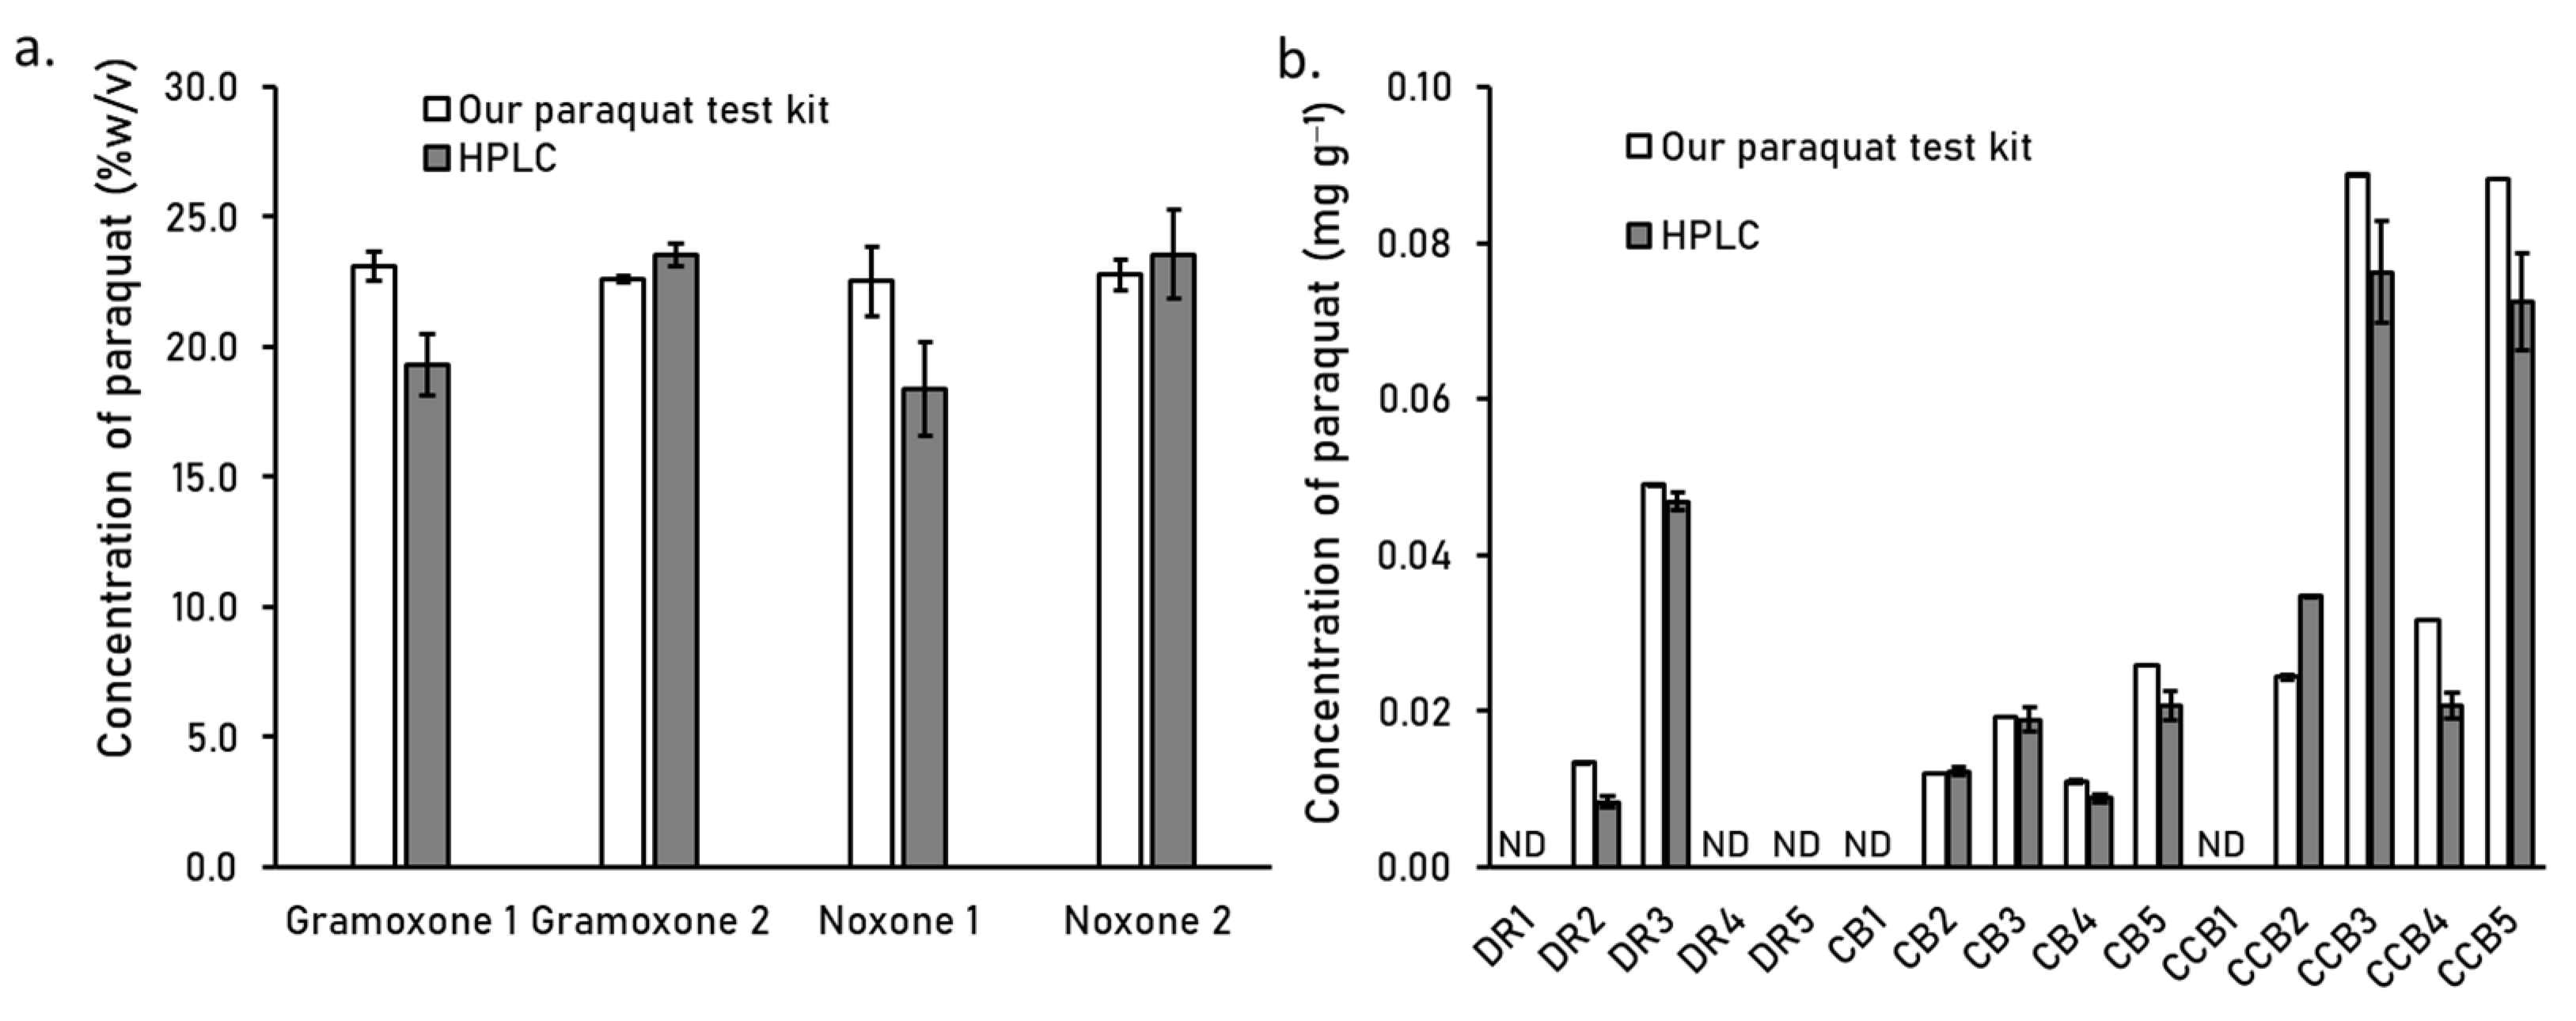
3.8.1. Analysis of Paraquat in Commercial Herbicide, Water, and Vegetable Samples Using Paraquat Test Kit

The proposed procedure method was applied for the determination of paraquat in various finds of samples. Paraquat in all samples was determined by the external calibration method. The percentages of recovery were also determined. The recovery values of each sample were obtained from 101 to 115%. Results are summarized in Table 3.
The paraquat test kit was verified for accuracy by comparing with HPLC–UV detection. The determination of paraquat in the samples (commercial pesticides and vegetable samples) using the test kit level and HPLC are presented in Figure 9. The paired t-test at 95% confidence showed insignificant difference between our test kit and HPLC (all samples: tstat: 1.09 and tcritical: 2.16 at p = 0.05; commercial pesticides: tstat: 0.48 and tcritical: 4.30 at p = 0.05; vegetable: tstat: 1.61 and tcritical: 2.31 at p = 0.05). This proves that our developed test kit was accurate and reliable for screening paraquat in the real samples.

3.8.2. Possibility of Paraquat Test Kit with Online Extraction for Analysis of Paraquat in Vegetable Samples

In order to develop this test kit to be all-steps-in-one for paraquat analysis in vegetable sample, an online extraction was investigated. As shown in Figure 10, the daikon radish (Figure 10a) sunk to the bottom of the reaction cell; cabbage (Figure 10b) floated, which interfered with the light path of LED-photodiodes for a reading of absorbance. Thus, vegetable samples suitable for online extraction must be sunk to the bottom of the reaction cell. Another way for applying online extraction to the floated vegetable sample is putting the vegetable into a net bag, such as a teabag. This facilitates sinking the vegetable to the bottom of the reaction cell. In this investigation, only the daikon radish was suitable.
The daikon radish was selected to investigate recovery with online extraction. The recovery values of samples were obtained from 95% to 101% as shown in Table 4. This demonstrated that the developed test kit can be applied for the determination of paraquat with the concept of all-steps-in-one for daikon radish sample.

3.9. Single-Point Calibration for Paraquat Test Kit

The possibility of calibrating the photometer was investigated. We calibrated the photometer by using a single standard solution of 10.00 mg L−1 paraquat, and the slope of the calibration was memorized as K value. The paraquat concentration was obtained from absorbance (A) of blue product divided by K or molar absorption coefficient (ε), and we assumed that the length of light path (b) was constant, following Beer–Lambert law in Equation (4).
A = εbC
where A is absorbance, ε is molar absorption coefficient, b is length of light path, and C is paraquat concentration.
The test solution was standard paraquat with a nominal value of 5.00 mg L−1, reading concentration was 5.09 ± 0.03 mg L−1 paraquat with a K value of 0.0967, close to the slope of the calibration obtained from multipoint calibration. The relative standard deviation for 20 replicated additions of 5.00 mg L−1 standard paraquat was 0.64%. This proves that the single-point calibration is adequate for our developed test kit.

4. Conclusions

In this research, a test kit was developed for the determination of paraquat in water and agricultural products. A handheld photometer was employed as a 590 nm LED detector for measuring the paraquat concentration of sample in a proposed procedure. Paraquat analysis was based on the absorption of solution under a reduction of paraquat with 1.0% (w/v) sodium dithionite in alkaline condition by using 0.06 mol L−1 sodium hydroxide. A blue free-radical ion occurred. At the optimal condition, the blue free radical ion was immediately produced and detected at room temperature within 1 min. The calibration curve was linear on the range of 0.5 to 10 mg L−1, with a high coefficient. Lower limit of quantitation was achieved of 0.50 mg L−1 for both reagent format of determination of solution and powder. Reproducibility provided a satisfying relative standard deviation (RSD) of less than 5% for 10 replicate additions of 5.0 and 10.0 mg L−1. Intraday (n = 3) and interday (n = 3) precision were both less than 1%. The recovery of paraquat in water, vegetables, and commercial products was acceptable. The developed test kit demonstrated good accuracy and reliability by the statistic paired t-test at 95% confidence as compared with HPLC results. The test kit was successfully applied to the determination of paraquat in water and vegetable. Online extraction for daikon radish was incorporated in the test kit. A single-point calibration based on the Beer–Lambert law demonstrated paraquat measurement. Testing with nominal standard solution of 5.00 mg L−1 paraquat, the reading concentration was 5.09 ± 0.03 mg L−1 paraquat (n = 20) with a K value of 0.0967 (close to slope of multipoint calibration). Regarding cost per analysis, the developed test kit costs around USD 0.5 per sample compared to commercial semiquantitative test kits. However, our test kit provides all-steps-in-one analysis for the convenient and rapid quantitative analysis of paraquat.

Author Contributions

Conceptualization, P.S.; methodology, C.S. and P.S.; validation, C.S.; formal analysis, C.S.; investigation, C.S.; resources, P.S.; data curation, C.S. and P.S.; writing—original draft preparation, C.S.; writing—review and editing, P.S.; visualization, P.S.; supervision, P.S.; project administration, P.S.; funding acquisition, P.S. All authors have read and agreed to the published version of the manuscript.

Funding

This research was funded by Mahidol University, grant number NDFR 02/2565.

Institutional Review Board Statement

Not applicable.

Informed Consent Statement

Not applicable.

Data Availability Statement

Not applicable.

Acknowledgments

This research project is supported by Mahidol University (research contract NDFR 02/2565), given to P.S. Scholarship from the Faculty of Science, Mahidol University under the Scholarship for Young Scientists (academic year 2018) given to C.S. is also acknowledged. Equipment was partially supported by the Center of Excellence for Innovation in Chemistry (PERCH-CIC), Ministry of Higher Education, Science, Research, and Innovation. The authors would like to thank the equipment support from the CIF Grant, Faculty of Science, Mahidol University.

Conflicts of Interest

The authors declare no conflict of interest.

References

  1. Roberts, J.R.; Reigart, J.R. Paraquat and Diquat. In Recognition and Management of Pesticide Poisonings, 6th ed.; Office of Pesticide Programs U.S. Environmental Protection Agency: Washington, DC, USA, 2013; pp. 110–116. [Google Scholar]
  2. Nasir, T.; Herzog, G.; Hebrant, M.; Despas, C.; Liu, L.; Walcarius, A. Mesoporous Silica Thin Films for Improved Electrochemical Detection of Paraquat. ACS Sens. 2018, 3, 484–493. [Google Scholar] [CrossRef]
  3. Rashidipour, M.; Maleki, A.; Kordi, S.; Birjandi, M.; Pajouhi, N.; Mohammadi, E.; Heydari, R.; Rezaee, R.; Rasoulian, B.; Davari, B. Pectin/Chitosan/Tripolyphosphate Nanoparticles: Efficient Carriers for Reducing Soil Sorption, Cytotoxicity, and Mutagenicity of Paraquat and Enhancing Its Herbicide Activity. J. Agric. Food Chem. 2019, 67, 5736–5745. [Google Scholar] [CrossRef]
  4. Zou, T.; He, P.; Cao, J.; Li, Z. Determination of paraquat in vegetables using HPLC-MS-MS. J. Chromatogr. Sci. 2015, 53, 204–209. [Google Scholar] [CrossRef] [PubMed] [Green Version]
  5. The Pollution Control Department, Ministry of Natural Resources and Environment (PCD) of Thailand. Water Quality for Freshwater Animal. Available online: https://www.pcd.go.th/wp-content/uploads/2020/05/pcdnew-2020-05-19_06-52-11_300668.pdf (accessed on 22 February 2022).
  6. Government Gazette. In 387, Thailand Food and Drug Administration; Ministry of Public Health of Thailand, Cabinet Publishing and the Government Gazette, Cabinet Secretariat of Thai Government: Bangkok, Thailand, 2017; Volume 134, pp. 8–33.
  7. Pathan, A.M.; Baseer, M.A.; Kadam, A.B.; Junne, S.B. A Novel Chromogenic Spray Reagent for Thin-Layer Chromatographic Analysis of Paraquat and Design of an Ultra-Low-Cost Sensor for On-The-Field Detection of Viologens. J. Planar Chromatogr. Mod. TLC 2019, 32, 335–338. [Google Scholar] [CrossRef]
  8. Siangproh, W.; Somboonsuk, T.; Chailapakul, O.; Songsrirote, K. Novel colorimetric assay for paraquat detection on-silica bead using negatively charged silver nanoparticles. Talanta 2017, 174, 448–453. [Google Scholar] [CrossRef] [PubMed]
  9. Rai, M.K.; Das, J.V.; Gupta, V.K. A sensitive determination of paraquat by spectrophotometry. Talanta 1997, 45, 343–348. [Google Scholar] [CrossRef]
  10. Maya, F.; Estela, J.M.; Cerda, V. Improved spectrophotometric determination of paraquat in drinking waters exploiting a Multisyringe liquid core waveguide system. Talanta 2011, 85, 588–595. [Google Scholar] [CrossRef] [PubMed]
  11. Infante, C.M.; Morales-Rubio, A.; de la Guardia, M.; Rocha, F.R. A multicommuted flow system with solenoid micro-pumps for paraquat determination in natural waters. Talanta 2008, 75, 1376–1381. [Google Scholar] [CrossRef] [PubMed]
  12. Chang, T.H.; Tung, K.H.; Gu, P.W.; Yen, T.H.; Cheng, C.M. Rapid Simultaneous Determination of Paraquat and Creatinine in Human Serum Using a Piece of Paper. Micromachines 2018, 9, 586. [Google Scholar] [CrossRef] [PubMed] [Green Version]
  13. Chuntib, P.; Jakmunee, J. Simple flow injection colorimetric system for determination of paraquat in natural water. Talanta 2015, 144, 432–438. [Google Scholar] [CrossRef] [PubMed]
  14. Kuan, C.M.; Lin, S.T.; Yen, T.H.; Wang, Y.L.; Cheng, C.M. Paper-based diagnostic devices for clinical paraquat poisoning diagnosis. Biomicrofluidics 2016, 10, 034118. [Google Scholar] [CrossRef] [PubMed]
  15. Seetasang, S.; Kaneta, T. On-site analysis of paraquat using a completely portable photometric detector operated with small, rechargeable batteries. Anal. Chim. Acta 2020, 1135, 99–106. [Google Scholar] [CrossRef] [PubMed]
  16. Chaikhan, P.; Udnan, Y.; Sananmuang, R.; Ampiah-Bonney, R.J.; Chuachuad Chaiyasith, W. A low-cost microfluidic paper-based analytical device (µPAD) with column chromatography preconcentration for the determination of paraquat in vegetable samples. Microchem. J. 2020, 159, 105355. [Google Scholar] [CrossRef]
  17. Zhang, Y.; Huang, Y.; Fu, L.; Qiu, J.; Wang, Z.; Wu, A. Colorimetric detection of paraquat in aqueous and fruit juice samples based on functionalized gold nanoparticles. J. Food Compos. Anal. 2020, 92, 103574. [Google Scholar] [CrossRef]
  18. Hara, S.; Sasaki, N.; Takase, D.; Shiotsuka, S.; Ogata, K.; Futagami, K.; Tamura, K. Rapid and Sensitive HPLC Method for the Simultaneous Determination of Paraquat and Diquat in Human Serum. Anal. Sci. 2007, 23, 523–526. [Google Scholar] [CrossRef] [PubMed] [Green Version]
  19. Shivhare, P.; Gupta, V.K. Spectrophotometric Method for the Determination of Paraquat in Water, Grain and Plant Materials. Analyst 1991, 116, 391–393. [Google Scholar] [CrossRef] [PubMed]
  20. Wetzel, R.G. 10—Salinity of Inland Waters. In Limnology, 3rd ed.; Wetzel, R.G., Ed.; Academic Press: San Diego, CA, USA, 2001; p. 170. [Google Scholar]
  21. Fadiran, A.O.; Dlamini, S.C.; Mavuso, A. A comparative study of the phosphate levels in some surface and ground water bodiesof Swaziland. Bull. Chem. Soc. Ethiop. 2008, 22, 197–206. [Google Scholar] [CrossRef] [Green Version]
  22. Rendon-von Osten, J.; Dzul-Caamal, R. Glyphosate Residues in Groundwater, Drinking Water and Urine of Subsistence Farmers from Intensive Agriculture Localities: A Survey in Hopelchen, Campeche, Mexico. Int. J. Environ. Res. Public Health 2017, 14, 595. [Google Scholar] [CrossRef] [PubMed]
  23. Hamilton, D.J.; Ambrus, Á.; Dieterle, R.M.; Felsot, A.S.; Harris, C.A.; Holland, P.T.; Katayama, A.; Kurihara, N.; Linders, J.; Unsworth, J.; et al. Regulatory limits for pesticide residues in water (IUPAC Technical Report). Pure Appl. Chem. 2003, 75, 1123–1155. [Google Scholar] [CrossRef]
  24. Panuwet, P.; Siriwong, W.; Prapamontol, T.; Ryan, P.B.; Fiedler, N.; Robson, M.G.; Barr, D.B. Agricultural Pesticide Management in Thailand: Situation and Population Health Risk. Environ. Sci. Policy 2012, 17, 72–81. [Google Scholar] [CrossRef] [Green Version]
Figure 1. Schematic of all operational steps for paraquat test kit using handheld photometer.
Analytica 03 00007 g001
Figure 2. UV–vis spectra of blue product of paraquat free-radical ion.
Analytica 03 00007 g002
Figure 3. Effect of reducing agent on sensitivity of paraquat analysis. Experimental conditions: 10.00 mL of standard paraquat, 0.50 mL of reducing agent, 1000 rpm of stirring speed, and 30 s of stirring time.
Analytica 03 00007 g003
Figure 4. Effect of reagent concentrations of (a) Na2S2O4 and (b) NaOH on paraquat sensitivity. Experimental conditions: 10.00 mL of standard paraquat, 0.50 mL of color-forming reagent solution, 1000 rpm of stirring speed, and 30 s of stirring time.
Analytica 03 00007 g004
Figure 5. Investigation of (a) sample volume and (b) reagent volume for paraquat analysis. Experimental conditions: 0.50 mL of color-forming reagent solution, 1000 rpm of stirring speed, and 30 s stirring time.
Analytica 03 00007 g005
Figure 6. Investigation of stability of (a) standard paraquat solution and (b) alkaline sodium dithionite reagent.
Analytica 03 00007 g006
Figure 7. Calibration curves of paraquat with investigating the possibility study for use of (a) micropipette and (b) plastic syringe for liquid handling (10 mL for standard/sample solution and 1 mL for color-forming reagent.
Analytica 03 00007 g007
Figure 8. Naked-eye observation of paraquat free-radical ion by using sodium dithionite with (a) solution format and (b) powder format in concentration range of 0.05–80.0 mg L−1 standard paraquats with calibration plots for (c) solution format and (d) powder format of sodium dithionite.
Analytica 03 00007 g008
Figure 9. Paraquat content obtained from the developed test kit and HPLC for (a) commercial pesticide solutions and (b) vegetable samples. ND: not detected.
Analytica 03 00007 g009
Figure 10. Investigation of paraquat analysis and recovery study using paraquat test kit with online extraction in the reaction cell of (a) daikon radish and (b) cabbage with (i) nonspiked and spiked standard paraquat at (ii) 0.5 and (iii) 5.0 mg L−1.
Analytica 03 00007 g010
Table 1. Analytical performance of the test kit for paraquat determination.
Analytical ParameterValue
Sodium Dithionite SolutionSodium Dithionite Powder
Linear range0.5–10 and 10–30 mg L−10.5–10 and 10–30 mg L−1
Working range0.5–10 mg L−10.5–10 mg L−1
Working linear equationAbs. = (0.0992 ± 0.0028)
[PQ2+]–(0.0032 ± 0.0143)
Abs. = (0.0990 ± 0.0032)
[PQ2+]–(0.0117 ± 0.0166)
Coefficient of determination (r2)0.9960.995
LOD a0.30 mg L−10.30 mg L−1
LLOQ b0.43 mg L−10.50 mg L−1
PQ: paraquat; a; limit of detection: a lowest concentration giving color appearance to naked eye; b Lower limit of quantitation: 3SD of intercept/slope.
Table 2. Tolerance limit of some interferences on determination of 1.0 mg L−1 paraquat.
Foreign SpeciesTolerance Limit
(mg L−1)
Normally Found in Natural Water
(mg L−1)
Cl200220 a
NO3200017 a
CO32−1500958 a
SO42−2500233 a
PO43−8000.11–0.37 b
Na+700274 a
K+70059 a
Ca2+1500750 a
Mg2+2000342 a
Glyphosate150<1.3 × 10⁻⁴–0.037 c
Diquat0.200.02 d
Atrazine2005.8 × 10−5–8.6 × 10⁻⁵ e
Propanil3000.5 f
a Wetzel, 2001 [20]. b Fadiran, Dlamini, and Mavuso, 2008 [21]. c Rendon-von Osten and Dzul-Caamal, 2017 [22]. d Hamilton et al., 2003 [23]. e Panuwet et al., 2012 [24]. f limitation of concentration was reported in the Pollution Control Department [5].
Table 3. Paraquat concentrations and recovery studies found in samples using our developed test kit.
SampleParaquat Concentration (mg L−1)Recovery (%)
AddedFound (n = 3)%RSD (n = 3)
Gramoxone®-0.58 ± 0.012.41-
0.501.09 ± 0.011.20105
5.005.60 ± 0.020.39102
Noxone®-0.57 ± 0.034.61-
0.501.08 ± 0.076.51104
5.005.79 ± 0.091.52102
W1 -<LOD--
0.500.61 ± 0.047.00106
5.005.17 ± 0.061.22101
W2 -<LOD--
0.500.61 ± 0.035.30109
5.005.20 ± 0.040.67101
W3 -<LOD--
0.500.55 ± 0.023.54106
5.005.14 ± 0.030.53101
W4 -<LOD--
0.50.64 ± 0.023.03106
5.005.20 ± 0.020.48101
DR-<LOD--
0.500.59 ± 0.022.62115
5.005.22 ± 0.030.60103
CB-<LOD--
0.500.59 ± 0.023.84111
5.005.24 ± 0.040.76103
CCB-<LOD--
0.500.61 ± 0.034.78114
5.005.29 ± 0.071.41104
ND not detected; W: water sample; DR: daikon radish; CB: cabbage; and CCB: Chinese cabbage.
Table 4. Investigation of paraquat concentration and recovery study with online extraction for daikon radish samples.
SamplesParaquat Concentration (mg L−1)%Recovery
AddedFound%RSD (n = 3)
DR1-<LOD--
5.005.03-98
DR2-0.93 ± 0.064.1-
5.005.841.2101
DR3-3.06 ± 0.124.0-
5.007.691.495
DR: daikon radish.
Publisher’s Note: MDPI stays neutral with regard to jurisdictional claims in published maps and institutional affiliations.

