Article

Development and Validation of a Novel RP-HPLC Method for the Determination of Cetrimide and Chlorhexidine Gluconate in Antiseptic Solution

1
Laboratory of Pharmaceutical Analysis, Department of Pharmacy, National and Kapodistrian University of Athens, Panepistimioupoli Zografou, 15771 Athens, Greece
2
Greek Military Pharmaceutical Laboratories, Pireos 174, Tavros, 11778 Athens, Greece
*
Author to whom correspondence should be addressed.
Analytica 2022, 3(1), 79-91; https://doi.org/10.3390/analytica3010006
Submission received: 10 January 2022 / Revised: 7 February 2022 / Accepted: 11 February 2022 / Published: 17 February 2022
(This article belongs to the Section Chromatography)

Abstract

:
Cetrimide (CE) is a quaternary ammonium compound and a cationic surfactant, which can be used as an antiseptic and preservative in various formulations. Antiseptic solutions of Cetrimide are available in combination with Chlorhexidine Gluconate (CHG) for external use. Chlorhexidine is a biguanide with high microbicidal activity and is widely known as a skin disinfectant. The present work displays the development and validation of an RP-HPLC isocratic method for the simultaneous determination of CE and CHG. The method consists of a Hypersil® SAS C1 (4.6 × 250 mm) 5 μm column, with a mobile phase of 85%/15% v/v MeOH-NaH2PO4·H2O, aqueous solution. In addition, 0.2% of triethylamine (Et3N) was added to the buffer for the confrontation of peak tailing, and then the pH was adjusted to 3.0 with ortho-phosphoric acid (H3PO4). The flow rate was set at 1 mL/min, and adequate detection was achieved with a diode array detector (PDA) at 205 nm. The method was successfully validated according to ICH guidelines for specificity, linearity, accuracy, precision and stability for sample and standard solutions. In addition, the robustness of the method was evaluated through statistical and graphical analysis, using a fractional factorial experimental design.

1. Introduction

Antiseptics and disinfectants are used to an extended degree by both individuals and hospital units, and when put to good use they can become an important tool against microbes [1]. Various chemical substances form different categories of antiseptics, due to their different structure. Cetrimide (CE) falls in the category of cationic surfactants, and more specifically, in the sub-category of the quaternary ammonium compounds. These compounds consist of two parts, one large hydrophobic chain and the positively charged quaternary ammonium ion, which is responsible for the antiseptic properties of these molecules [1,2]. In consequence, cetrimide is a very polar analyte, which remains ionic in the whole pH range [3]. Chlorhexidine (CH) is the most popular substance in the category of biguanides, and due to its low toxicity, is used extensively in various commercial formulations [4]. It is a strong base that consists of two symmetrical chlorophenyl groups connected through a hydrophobic chain (Figure 1) [5]. The molecule is available in three different salts: Acetate (CHA), hydrochloride (CHH) and gluconate (CHG), with the last one being the most stable and the most soluble in water [6]. The combination of CE and CHG has shown to be effective against a wide variety of Gram (+) bacteria and thus very useful in cleaning wounds, abrasions and burns and finds application in the fields of obstetrics, dentistry, gynecology and urology [7,8,9].
Even though commercial formulations of these compounds are available in Europe and around the world, little information can be found about their simultaneous quantification and separation. CE is included in the European Pharmacopeia where a titration method is described as an assay [10], while this technique can also be found in the literature with even better accuracy and precision data [11]. Regarding High-Performance Liquid Chromatography (HPLC), a series of publications [12,13,14,15] refer to the role of CE as an ion-pairing agent for the analysis of negatively charged ions, but none for its single quantification. On the contrary, an HPLC method for the determination of CHG is described in both the European Pharmacopeia [10] and the USP [16]. Furthermore, numerous analytical methods have been described for the quantification of CHG in different dosage forms, such as oral rinses, ointments, ophthalmic and skin solutions [5,17]. As for the simultaneous determination of CE and CHG, a literature survey revealed a single HPLC method, using a C-18 column (4.6 × 150 mm) and 5μm of a mobile phase consisting of 30%/55%/15% v/v/v ACN:MeOH:Phosphate buffer [18].
Therefore, based on the above, we considered it to be very useful to develop and validate an alternative HPLC method for the simultaneous determination of both compounds in an antiseptic solution. To this point, the aims of this study were to develop a simple, low-cost, rapid and reproducible method and validate it in accordance with the current ICH guidelines. As for the estimation of the robustness of this method, a fractional factorial design was utilized in order to distinguish and delimit the factors with significant effects on the responses.

2. Materials and Methods

2.1. Reagents and Solvents

CE powder (97.7% purity) and q CHG 20% water solution were provided by Greek military laboratories. Chlorhexidine Acetate (CHA) Secondary Reference Standard (Lot LRAC4108) was purchased from Sigma-Aldrich (St. Louis, MO, USA). In addition, HPLC-grade MeOH, ACN, UPLC-grade water, sodium dihydrogen phosphate monohydrate, triethylamine (Et3N), sodium nitrite and ortho-phosphoric acid were also obtained from Sigma-Aldrich. For the preparation of the diluent, HPLC-grade water was obtained by a Merck Millipore Milli-Q device (Merck S.A. Hellas, Athens, Greece).

2.2. Instrumentation

For the purpose of this study, two chromatographic systems were used. The first one was the VWR Hitachi Chromaster HPLC (Tokyo, Japan), which consisted of 5 parts: An autosampler supplied with a 100 μL loop, a pump with an online degassing system, a column oven, a PDA detector and an RI detector, which was not used in the present research. The second one, a Merck-Hitachi system, was only used in the evaluation of intermediate precision and contained an autosampler equipped with a 200 μL loop, a pump, an external column oven and a UV detector. In both systems, the Hypersil® SAS C-1 column (Thermo Scientific, Leicestershire, UK) was kept inside the ovens. All chromatograms were recorded and collected using the Clarity VA software package (DataApex®).

2.3. Chromatographic Conditions

The mobile phase was a mixture of MeOH and 50 mM of NaH2PO4·H2O at a ratio of 85%/15% v/v. During the preparation of the aqueous solution, 0.2% Et3N was added, before the adjustment of the pH to 3.0 with ortho-phosphoric acid. The process was undertaken under isocratic conditions, hence the composition of the mobile phase remained constant. The flow rate was set at 1.0 mL/min and detection occurred at 205 nm. Lastly, the injection volume was set at 10 μL and the temperature was controlled at 25 °C, via a column oven.

2.4. Preparation of Stock and Working Solutions

The assay method for CHG in USP [16] suggests the use of CHA for the preparation of the standard solutions (STDs), therefore it was decided to use CHA in the preparation of STDs, while accuracy and precision were assessed using spiked samples of CHG during the validation process. Finally, the recovery of each spiked sample was calculated using a correction factor based on the molecular weights of CHA and CHG.

2.4.1. Preparation of Stock Standard Solutions and Working Standard Solutions

For the stock standard solutions, CE (750 μg/mL) and CHA (75.0 μg/mL) were accurately weighed and dissolved using an 85%/15% v/v MeOH-H2O diluent, into a 100 mL volumetric flask. Consequently, the appropriate dilutions from each stock led to the desired working standard solutions. The solutions were stored in a refrigerator at 5 °C.

2.4.2. Preparation of Stock Solution for Spiked Samples

The CHG 20% solution presents increased viscosity and is not recommended for use as it is in the analysis. Therefore, a sample solution of CHG (10.25 mg/mL) was prepared, by diluting an accurately weighed quantity of CHG in a 100 mL volumetric flask with water. For the preparation of the stock solution, an accurately weighed quantity (0.0758 g) of CE was transferred into a 100 mL volumetric flask and dissolved using the same diluent as the STDs. Afterward, an accurately measured volume (1 mL) of CHG from the sample solution was added to the same volumetric flask, reaching the concentrations of 750 μg/mL and 102.5 μg/mL for CE and CHG, respectively.

2.4.3. Sample Preparation

With regards to sample preparation, at first, a stock solution was prepared by accurately measuring a certain volume (1 mL) of antiseptic solution and diluting it in a 100 mL volumetric flask, using the same diluent and obtaining concentrations of 1500 μg/mL and 150 μg/mL for CE and CHG, respectively. The sample solution (test solution) was then obtained by diluting 2 mL of the stock in a 20 mL volumetric flask. Before each part of the analysis, the sample solution was filtered through a PVDF 0.45 μm syringe filter.

2.5. Validation Process

In order to ensure that the developed method is fit for the intended purpose, method validation took place. Taking into consideration the ICH guidelines, the following parameters were evaluated: Specificity, linearity, Limit of Detection (LOD), Limit of Quantitation (LOQ), accuracy, precision and stability.

2.5.1. Specificity

A method is identified as specific if the analyte of interest is quantified without any interference from other components of the analyzed sample. In assay methods, the resolution (R) between peaks is used to assess the specificity, and the commonly accepted values are RS ≥ 2 [19]. To this purpose, a series of different samples were analyzed, and the received chromatograms were subjected to visual evaluation before measuring the resolution. These samples were as follows: The standard solution of CE and CHA, the sample solution (antiseptic) of CE and CHG, a placebo solution of the antiseptic, the placebo solution spiked with known quantities of CE and CHG and the diluent solution. Each test solution was analyzed in triplicate, and the mean peak area was then calculated.

2.5.2. Linearity, LOD and LOQ

Linearity was assessed though a calibration curve, constructed by pairing the analytical response with the theoretical concentration of each sample. The proportional relation is evaluated using statistical tools such as least-square regression analysis. Five standard solutions were analyzed in triplicate, covering a range of 50–150% (50%, 75%, 100%, 125% and 150%) of the nominal concentrations for CE (150 μg/mL) and CHA (15 μg/mL), respectively. More specifically, the following concentrations were prepared: 75.0, 112.5, 150, 187.5 and 225 μg/mL for CE, while for CHA, the relevant concentrations were 7.50, 11.25, 15.0, 18.75 and 22.5 μg/mL. In addition, LOD and LOQ for both CE and CHG were calculated using the following equations: LOD = 3.3 × (s/b), LOQ = 10 × (s/b), where s is the standard deviation of the residuals and b is the slope of the calibration curve.

2.5.3. Accuracy

Accuracy refers to the closeness between the mean of a series of measurements and the theoretical value of the measured quantity. This theoretical value can be obtained by a certified reference standard, a specially prepared spiked sample or from the results of another certified method [19]. In this study, accuracy was evaluated by the means of %Recovery (%R), using a series of synthetic mixtures (spiked samples) analyzed against a standard solution at a concentration of 100%. The spiked samples covered three concentration levels, 75% (112.5 for CE and 15.38 μg/mL for CHG), 100% (150 for CE and 20.5 μg/mL for CHG) and 125% (187.5 for CE and 25.63 μg/mL for CHG), while at the same time, three measurements took place for each level, leading to a total of 9 determinations. The following equations were used:
%R = [(ASPIKED/ASTD) × (CSTD/CSPIKED)] × 100 for CE
%R = [(ASPIKED/ASTD) × (CSTD/CSPIKED) × (MW(CHG)/MW(CHA))] × 100 for CHG
where ASPIKED and CSPIKED refer to the area and concentration of the spiked sample, ASTD and CSTD refer to the area and concentration of standard solution and MW is the molecular weight.

2.5.4. Precision

Precision examines the dispersion of repeated measurements that come out of a certain method. Three levels of precision are studied: Repeatability, Intermediate Precision (IP) and reproducibility. In the context of this research, repeatability and IP were assessed using six replicate spiked samples at a concentration of 100% (150 for CE and 20.5 μg/mL for CHG), over three consecutive days. As a result, during each day, the dispersion of the results was monitored, by the same analyst, under the same conditions, using the same method and the same HPLC system (Repeatability). Afterward, the IP was evaluated by comparing the results of the three consecutive days, which simulate different conditions, such as a different analyst (day 3) and a different HPLC system (day 2). Reproducibility was not estimated, as the current analytical method is not intended to be transferred to another laboratory.

2.5.5. Stability

The stability of working standard solutions and sample solutions was evaluated for a period of 2 days (0 h, 5 h, 25 h and 48 h) and under different storage conditions (25 °C and 6 °C). For that purpose, three independent stock solutions were prepared (for both STD and sample solutions) and the test solutions were obtained by following the appropriate dilutions.

2.6. Robustness Testing

Robustness is related to the capacity of the method, to random unintended small changes of the experimental parameters [20]. To study the various changes on these parameters, an experimental design is often used. Then, the factors with significant effects on the responses are identified and set to strict tolerances. It is recommended that the robustness of the method is studied during method development, as the upcoming results will form the system suitability criteria to ensure the reliability of the method. The selection of the experimental design, that is of the examined parameters and their levels, derives from the experience of the analyst and from bibliographic data. In the current study, a fractional factorial design was selected (2k−3) and the examined factors were the %MeOH content and the flow rate of the mobile phase, the ratio of Et3N used, the pH, the salt concentration (mM), the wavelength (λ) and lastly the column temperature (T). Each factor was assessed at two levels (−1, +1), symmetrical to the nominal value (Table 1).
Nineteen runs (Table 2) were proposed for the fractional factorial design by Design-Expert software v.10-trial version (Stat-Ease-Inc., Minneapolis, MN, USA) including 3 replicates of the central values. The experimental responses evaluated were areas, the number of theoretical plates (N), the tailing factors (Tf), the retention times (tR) for both analytes and the resolution (Rs) between CE and CHA.

3. Results and Discussion

3.1. Method Development

Initially, the physicochemical properties of the two analytes were studied. CE is a very polar, ionic molecule that remains unaffected by changes in the pH. The same can be said about Chlorhexidine, which is a strong base (pKa = 10.8) that remains positively charged in pH values below 8, commonly used in HPLC mobile phases. Even though the molecules seemed to not be affected by the pH, it was decided to adjust it to 3.0, since pH values between 2 and 4 provide more-stable retention times and reduce the silanophilic effect [21]. Considering the above, a number of trials took place starting with the use of a non-polar Pinacle II® C-18 column (250 × 4.6 mm, 5 μm,) and the XTERA® RP C-18 column (150 × 4.6 mm, 5 μm) with a mobile phase consisting of ACN and phosphate buffer. The major problems with these conditions were that CE exhibited poor retention (overlap with dead time) with a characteristic disturbance of the baseline, and in some cases, the symmetry of CHA peak was not acceptable. A change to the buffer solution using chaotropic salt was tested, and even though the disturbance of the baseline seemed to be minimized, it still appeared simultaneously with the peak of CE. Afterward, the use of relatively more polar stationary phases was considered, such as Allure® biphenyl (250 × 4.6 mm, 5 μm) and Pinacle DB® Cyano (250 × 4.6 mm, 5 μm,). The retention time of CE was slightly improved, an indication that a more polar stationary phase is suitable, but the disturbance to its peak remained the same or worsened. MeOH was also tested at this stage, with all the aforementioned stationary phases but with no improvement.
After that, other approaches were brought to the table, such as HILIC and Ion pair Chromatography. For HILIC (Kinetex® 150 × 3 mm, 2.6 μm), the conditions chosen were a mobile phase, which consisted of ACN and ammonium acetate as a buffer, at different ratios and flow rates that fluctuated from 0.3 to 0.8 mL/min. All the trials led to very poor retention times for both analytes, below 1 min, and to deficient separation. As for the Ion pair, the same Pinacle® C-18 column was chosen, using a mobile phase consisting of ACN and phosphate buffer with the addition of sodium 1-octanesulfonic monohydrate, as the ion pair reagent. Even though the retention times of CE and CHG were slightly improved, as was the separation between the two peaks, CE was still affected by a small disturbance of the baseline, which would lead to problems during the quantification. Ultimately, the Hypesil® SAS C1 column was utilized, which consists of alkyl chains and is suitable for the analysis of polar molecules and appropriate for Ion pair chromatography [22]. With this stationary phase and the use of MeOH in the mobile phase, at a ratio of 85% or above, in combination with the phosphate buffer, the disturbance of the baseline was utterly diminished. The peaks exhibited good retention times and good resolution and, therefore, this column was selected. The ratio of the mobile phase was eventually established at 85%/15% v/v MeOH/phosphate buffer, because in greater amounts of MeOH, poor reproducibility at the retention times of CHG was observed.
Another chromatographic parameter that needed attention was the peak tailing that occurred mostly on Chlorhexidine. A common problem observed is the interactions developed between basic molecules and the free silanol groups of the silica. As a result, chromatographic peaks exhibit long retention times and extensive tailing. In order to confront this problem, the addition of Et3N was employed in the aqueous solution of the mobile phase. Triethylamine blocks these interactions leading to an improved peak shape and retention times [23]. At first, 0.4% Et3N was added, but then reduced to 0.2% to avoid significant changes in the retention times of CE and CHG. Additionally, flow rate values in the range of 0.8 to 1.0 mL/min were tested and consequently set at 1.0 mL/min, in order for the run time to be reduced to the minimum. As for the wavelength, Cetrimide absorbs at regions below 210 nm, and Chlorhexidine displays a maximum near 205 nm, which was finally selected.
Besides the current application, the abovementioned trials can be very useful for the chromatographic analysis of compounds bearing permanent charges, such as CE.

3.2. Validation Data
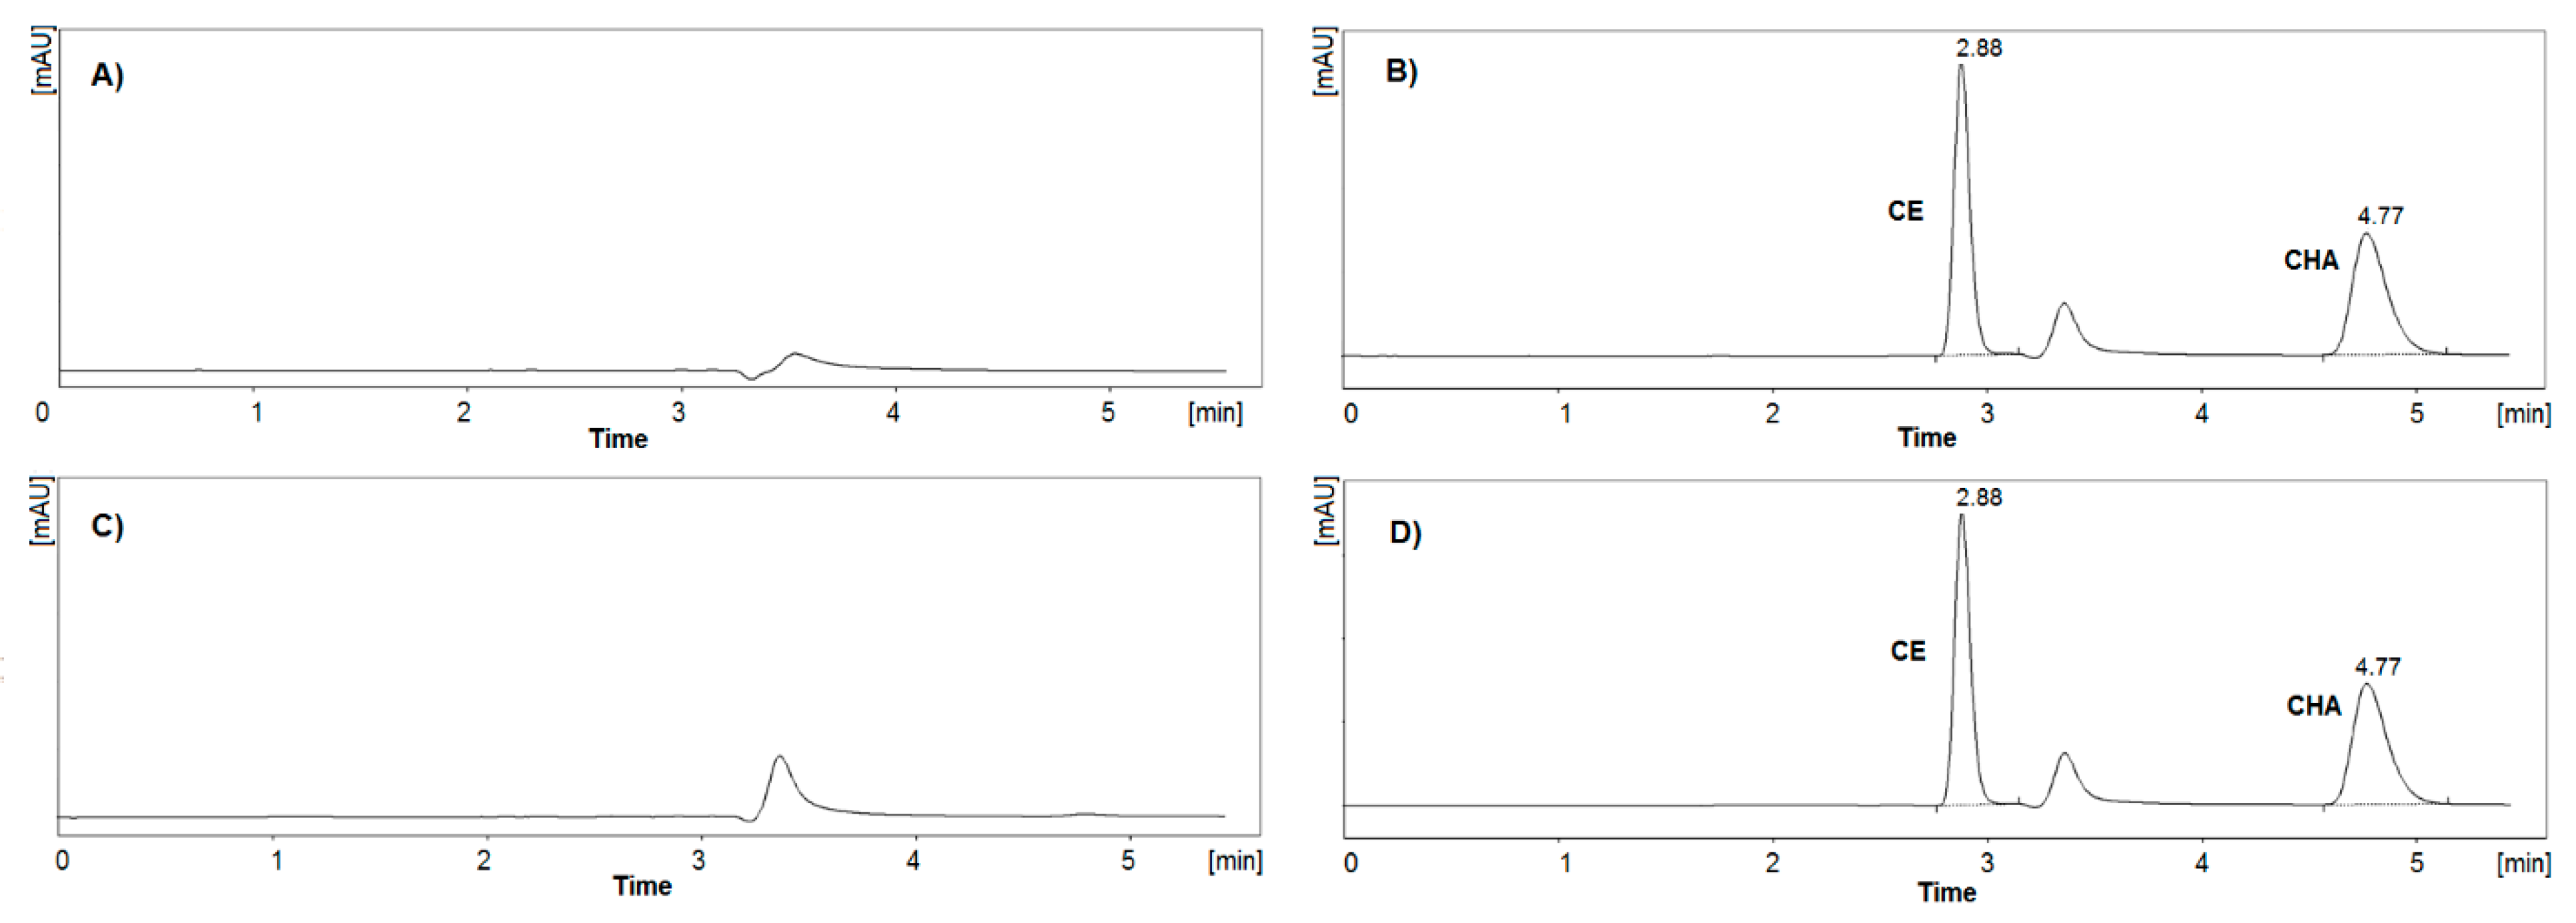
3.2.1. Specificity

Specificity evaluation showed that Cetrimide and Chlorhexidine can be identified and quantified without any interference from the diluent, nor from substances formulated alongside the active ingredients, such as excipients. In particular, the placebo solution, which contained these excipients at the appropriate quantities, showed no influence on the chromatographic peaks (Figure 2). Moreover, the two peaks exhibited accepted values of the resolution, Rs ≈ 7–8. From the chromatograms below, the t0 value cannot be monitored. In order to evaluate it, sodium nitrite was added as a marker and t0 was revealed at 2.39 min, with no overlap with the peak of CE.

3.2.2. Linearity, LOD and LOQ

Two calibration plots were prepared after analyzing five standard samples of CE and CHA in triplicate. Then, the use of linear regression analysis (y = ax + b) led to the calculation of the regression equations and the relevant coefficients of determination (r2). The values of r were greater than 0.998, suggesting a strong linear connection between y (analytical response) and × (concentration) variables for each substance (Table 3). Furthermore, the residual plots for both analytes showed a random pattern, and no outliers were revealed. Furthermore, LOD and LOQ values were calculated.

3.2.3. Accuracy

According to USP and European Pharmacopeia, the criteria for the mean %Recovery of active substances in pharmaceutical formulations are 98% ≤ R ≤ 102%. Within this study, these criteria were satisfied for each of the three levels, as was the total of nine measurements (Table 4). Moreover, the precision of the measurements was assessed via the %Relative Standard Deviation (%RSD). The criterion %RSD ≤ 1 in both cases was met.

3.2.4. Precision

Spiked samples at a 100% concentration were measured for the assessment of repeatability and intermediate precision. The criterion of %RSD ≤ 2, related to the percentage of recovery of the measurements, was accomplished, proving the method to be precise on different days and under different conditions. Table 5 presents the %Recovery for six replicate spiked samples for each day, as well as the %RSD for Repeatability (%RSDr). Dixon’s Q-test took place for the detection of outlier values, leading to the elimination of one measurement for cetrimide on the first day of experiments. As for IP, the values of %RSDR were 0.86 and 1.1 for CE and CHG, respectively.

3.2.5. Stability

The stability tests led to the conclusion that the standard and sample solutions remained stable for the interval of 48 h, both at ambient and refrigerated conditions. The %RSD values for replicate measurements of each standard solution were assessed and found to be ≤0.71 for CE and ≤0.78 for CHA. As for the sample solutions, the %RSD values were found to be ≤0.62 and ≤0.56 for CE and CHG, respectively.

3.3. Robustness Results

As previously mentioned, 19 experiments were proposed using Design-Expert software. The results of these experiments are demonstrated in Table 6 below.

3.3.1. Statistical Approach

After the experiments were terminated, the effect of each factor on the responses was assessed through statistical and graphical interpretation. Firstly, the statistical approach was conducted, where the effect (Ex) of each parameter was calculated and then compared to a critical value (Ecritical). The criterion of |Ex| ≥ Ecritical must be established for a factor to have a significant effect on a response. The way to calculate these values is described in detail by Y. Van Der Heyden [20,24]. For Ex, the following equation is used:
E x = Σ Υ + N / 2 Σ Υ N / 2   × 100 %
Ex is the effect of factor X to the response Y, ΣΥ(+) and ΣΥ(-) is the sum of the responses in which X is set at the extreme levels of −1 and +1, respectively, and N is equal to 2k−3, where k is the number of the examined parameters.
At the same time, the critical effect that will lead to the determination of the significant factors was calculated through the replicate experiments of the nominal values. The t-test statistic is usually used for the calculation of the above-mentioned limit, as is exhibited below:
t   = E x SE e     t critical
This equation can also be written as follows:
E x     E critical   =   t critical × SE e
The tcritical value for a confidence interval of 95% is 4303. Moreover, (SE)e is the standard error of the effects, which derives from the experiments of the central values and is calculated in various ways. In robustness experiments, SE is usually calculated using the following equations:
SE = SD a 2 n a + SD b 2 n b
SDa and SDb represent the variances of the two sets of measurements and na and nb are the number of experiments for each set. Nevertheless, since the variance between the two sets and the number of experiments is the same, Equation (6) can be rewritten as:
SE e = SD 2 N / 2 + SD 2 N / 2 = 4 × SD 2 N
Finally, based on the above calculations, the obtained values for Ex are exhibited in Table 7 and Table 8.

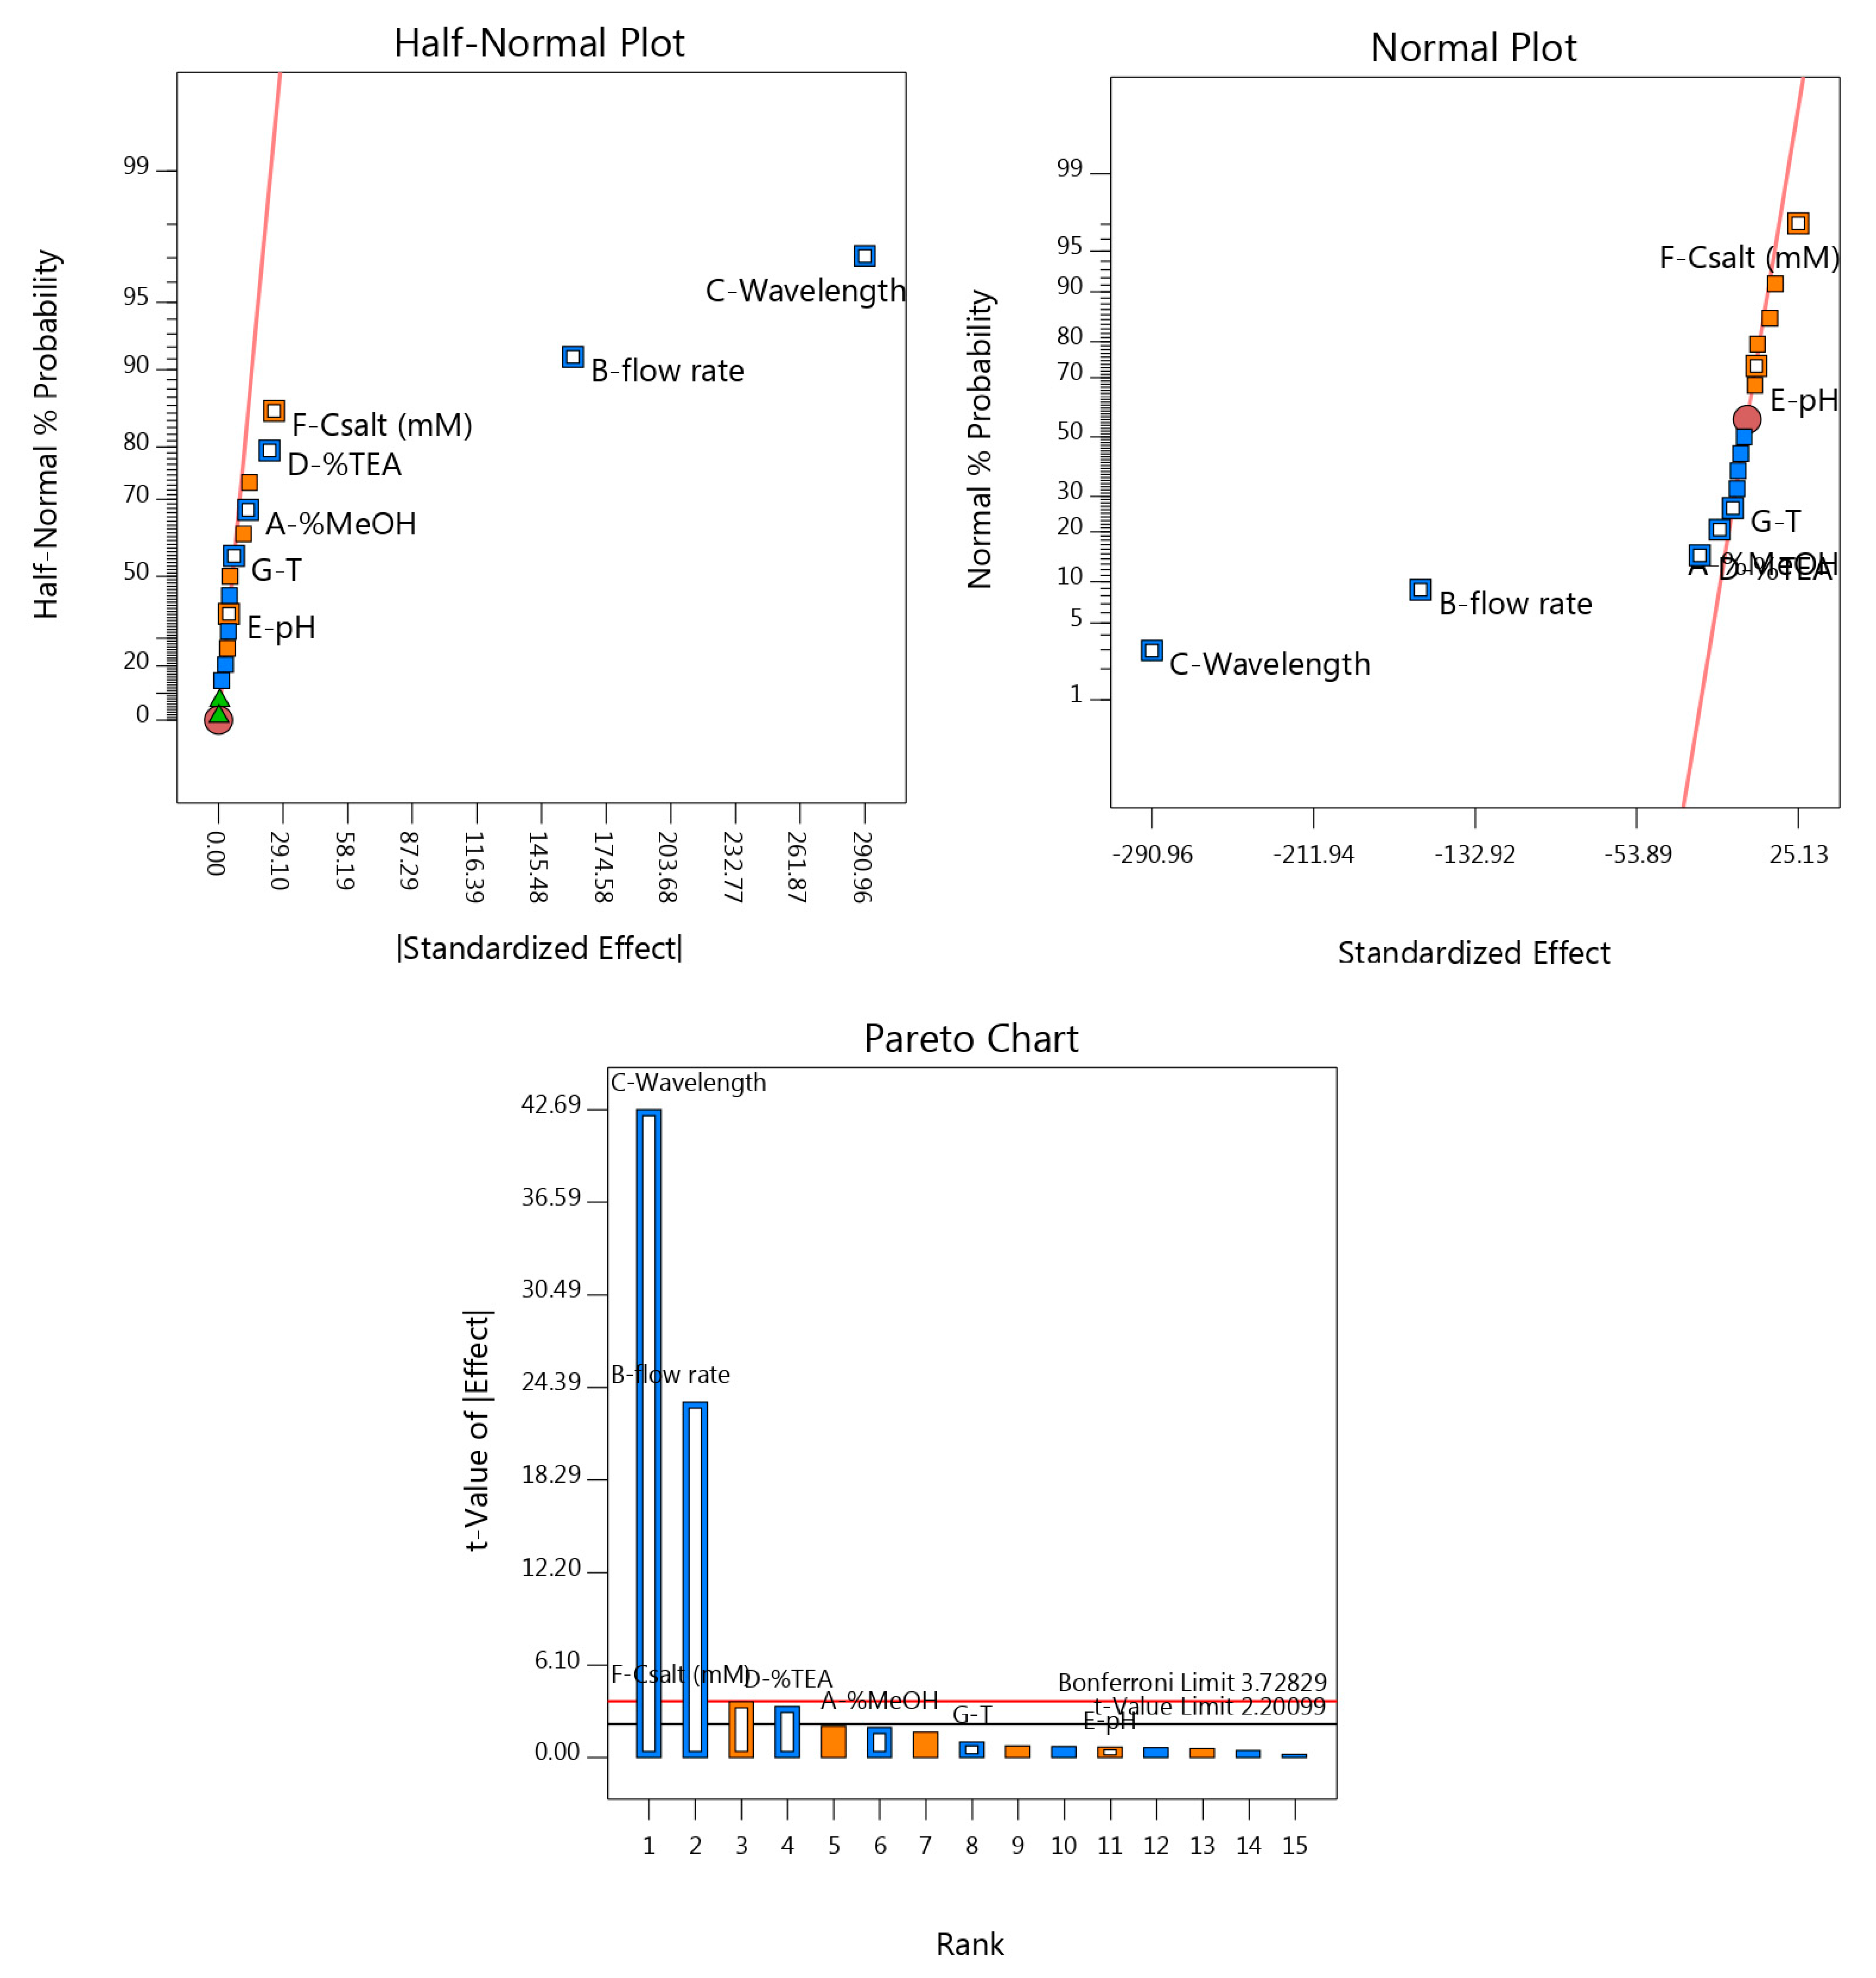
3.3.2. Graphical Approach

For the easiest estimation of the significant effects, a graphical approach was also employed. The most common graphs used are the normal and half-normal plots. Both plots lead to the same conclusion, by which the points that derive from the straight line through zero have a significant impact on the responses. The only difference consists of the fact that in the half-normal plot, only the absolute values of each parameter are used. As a result, the factors with a significant effect can be determined without knowing whether their sign is positive or negative. This can be concluded using a normal plot, with the help of which the impact of each parameter can be determined and compared to that of the others. A third graph used during this study was the Pareto chart. These charts include two limits, the Bonferoni and the t-value limit. Factors that exceed the Bonferoni limit have a significant effect on the response, while those that do not exceed the t-value limit are non-significant. Finally, the factors that are found between these two limits are considered potentially significant and need to be studied further (Figure 3).

3.3.3. Comparison of the Two Approaches

The results of the two approaches were then summed, in order to compare the ability of these two methods to determine the significant factors.
As seen in Table 9, the two approaches agree by a large percentage regarding the determination of the significant factors. More factors appeared to have a significant effect on the responses according to the statistical approach. This is expected, as the statistical method is considered more strict and more reliable, hence more factors appear significant compared to the graphical method. All the parameters that turned out to have a significant effect, according to the statistics and the graphs, were characterized as significant. With regards to the potentially significant parameters, it was decided they would be marked as significant, as the statistical evaluation also revealed them as such. pH had no significant effect at any response, as was already expected from the method development.
Lastly, for all the above factors, it was decided non-significant limits were to be adopted (Table 10). For %MeOH, the flow rate and wavelength, these limits were strict as these parameters have a significant effect on the majority of the responses and are considered crucial for the method’s performance.

4. Conclusions

A simple, rapid and low-cost RP-HPLC method was developed for the simultaneous determination of CE and CHG. This is based on the fact that scarce and undemanding pretreatment of the samples is needed, all the raw materials are easily supplied and at low cost and the overall run time does not exceed 6 min. Another advantage of this method is that it underwent isocratic conditions, avoiding the time-consuming equilibration of the chromatographic system. Furthermore, the analytical procedure proved to be specific, linear, accurate and precise and the samples to be stable for the interval of 48 h. Thus, the method is in compliance with the ICH guidelines for validation. Finally, caution is needed for the factors that proved to have a significant effect during the robustness assessment, in order to ensure the satisfactory performance of the method.

Author Contributions

Conceptualization, Y.D. and H.B.; methodology, A.V. and K.G; validation, A.V. and K.G.; writing—original draft preparation, A.V. and K.G.; writing—review and editing, Y.D. and H.B.; supervision, Y.D. and H.B. All authors have read and agreed to the published version of the manuscript.

Funding

This research received no external funding.

Institutional Review Board Statement

Not applicable.

Informed Consent Statement

Not applicable.

Data Availability Statement

Data presented in this study are available on request from the corresponding author.

Acknowledgments

The authors would like to thank the personnel of Greek Military Pharmaceutical Laboratories for their assistance during the study.

Conflicts of Interest

The authors declare no conflict of interest.

References

  1. McDonnell, G.; Russell, A.D. Antiseptics and Disinfectants: Activity, Action, and Resistance. Clin. Microbiol. Rev. 1999, 12, 147–179. [Google Scholar] [CrossRef] [PubMed] [Green Version]
  2. Boothe, H.W. Antiseptics and Disinfectants. Vet. Clin. Small Anim. Pract. 1998, 28, 233–248. [Google Scholar] [CrossRef]
  3. Cross, J.; Singer, E.J. Cationic Surfactants: Analytical and Biological Evaluation, 1st ed.; CRC Press: Boca Raton, FL, USA, 1994; pp. 1–26. [Google Scholar]
  4. Havlíková, L.; Matysová, L.; Nováková, L.; Hájková, R.; Solich, P. HPLC determination of chlorhexidine gluconate and p-chloroaniline in topical ointment. J. Pharm. Biomed. Anal. 2007, 43, 1169–1173. [Google Scholar] [CrossRef] [PubMed]
  5. Nicolay, A.; Wolff, E.; Vergnes, M.F.; Kaloustian, J.; Portugal, H. Rapid HPLC Method for Determination of Parachlo-roaniline in Chlorhexidine Antiseptic Agent in Mouthrinses, Ophthalmic and Skin Solution. Am. J. Anal. Chem. 2011, 2, 422–428. [Google Scholar] [CrossRef] [Green Version]
  6. Zeng, P.; Rao, A.; Wiedmann, T.S.; Bowles, W. Solubility Properties of Chlorhexidine Salts. Drug Dev. Ind. Pharm. 2009, 35, 172–176. [Google Scholar] [CrossRef]
  7. Galinos. Available online: https://www.galinos.gr/web/drugs/main/substances/cetrimide/usage (accessed on 26 November 2021).
  8. Galinos. Available online: https://www.galinos.gr/web/drugs/main/substances/chlorhexidine/usage (accessed on 26 November 2021).
  9. Galinos. Available online: https://www.galinos.gr/web/drugs/main/packages/12750/usage (accessed on 21 December 2021).
  10. Council of Europe; European Pharmacopoeia Commission; European Directorate for the Quality of Medicines & Healthcare. European Pharmacopoeia, 10th ed.; Council of Europe: Strasbourg, France, 2019; pp. 2159–2177. [Google Scholar]
  11. Rasmussen, C.D.; Nielsen, H.B.; Andersen, J.E.T. Analysis of the purity of cetrimide by titrations. PDA J. Pharm. Sci. Technol. 2006, 60, 104–110. [Google Scholar]
  12. Andraws, G.; Trefi, S. Ionisable substances chromatography: A new approach for the determination of Ketoprofen, Etoricoxib, and Diclofenac sodium in pharmaceuticals using ion—pair HPLC. Heliyon 2020, 6, 4613. [Google Scholar] [CrossRef]
  13. Trefi, S.; Bitar, Y.; Gilard, V. Separation and Quantification of Sacubitril-Valsartan Combination in Tablets by a New Ion-pair HPLC. Res. J. Pharm. Technol. 2019, 12, 1017–1022. [Google Scholar] [CrossRef]
  14. Hammash, L.; Bitar, Y.; Trefi, S. Novel Ion Pair HPLC Methods for the Assessment of Sitagliptin and Pioglitazone in Tablets. Res. J. Pharm. Technol. 2019, 12, 3713–3719. [Google Scholar] [CrossRef]
  15. Trefi, S. Simultaneous assessment of atorvastatin-ezetimibe combination in tablets by an ion-pair rp-hplc. Res. J. Pharm. Technol. 2020, 13, 4195–4199. [Google Scholar] [CrossRef]
  16. USP Monographs: Chlorhexidine Gluconate Solution. Available online: http://www.pharmacopeia.cn/v29240/usp29nf24s0_m15620.html (accessed on 30 November 2021).
  17. Colombo, M. Validation of a Simple Hplc Method for the Determination of Chlorhexidine Digluconate in Solution. Bachelor’s Thesis, Federal University of Rio Grande do Sul (UFRGS), Porto Alegre, Brazil, November 2013. [Google Scholar]
  18. Rajput, S.J.; Sathe, M.A. Application of doe and statistical analysis for development and validation of analytical method for chlrohexidine gluconate and cetrimide in its bulk and pharmaceutical dosage forms. Int. J. Pharm. Sci. Res. 2018, 9, 2800–2806. [Google Scholar] [CrossRef]
  19. Lee, T.D. Introduction to Modern Liquid Chromatography, Third Edition. J. Am. Soc. Mass Spectrom. 2011, 22, 196. [Google Scholar] [CrossRef] [Green Version]
  20. Vander Heyden, Y.; Nijhuis, A.; Smeyers-Verbeke, J.; Vandeginste, B.G.; Massart, D.L. Guidance for robustness/ruggedness tests in method validation. J. Pharm. Biomed. Anal. 2001, 24, 723–753. [Google Scholar] [CrossRef]
  21. Agilent|Chemical Analysis, Life Sciences, and Diagnostics. Available online: https://www.agilent.com/cs/library/ (accessed on 24 December 2021).
  22. HypersilTM SAS C1 HPLC Columns. Available online: https://www.thermofisher.com/order/catalog/product/30505-014001 (accessed on 22 December 2021).
  23. Wirth, M.J.; Fatunmbi, H.O. Horizontal polymerization of mixed trifunctional silanes on silica: A potential chroma-to-graphic stationary phase. Anal. Chem. 1992, 64, 2783–2786. [Google Scholar] [CrossRef]
  24. Neofotistos, A.D.; Gkountanas, K.; Boutsikaris, H.; Dotsikas, Y. A Validated RP-HPLC Method for the Determination of Bu-tamirate Citrate and Benzoic Acid in Syrup, Based on an Experimental Design Assessment of Robustness. Separations 2021, 8, 163. [Google Scholar] [CrossRef]
Figure 1. Molecular structures of (A) CHG and (B) CE.
Analytica 03 00006 g001
Figure 2. Chromatograms of: (A) Diluent, (B) STD, (C) placebo, (D) spiked sample.
Analytica 03 00006 g002
Figure 3. Half-normal and normal plots (top) and Pareto chart (bottom) for the response Area of CE. A: %MEOH, B: Flow Rate, C: λ, D: %Et3N, E: pH, F: Csalt, G: T.
Analytica 03 00006 g003
Table 1. Experimental factors and their examined levels.
Experimental ParametersLevels
−10
(Nominal Value)
+1
Flow Rate0.901.001.10
% MeOH838587
T232527
λ204205206
pH2.83.03.2
Csalt485052
% Et3N0.150.200.25
Table 2. All the experiments proposed by the software.
RunExperimental Factor
FlowpH% MeOHCsaltTλ% Et3N
10.92.88752232060.15
21.13.28352232040.15
31.12.88348272060.15
41.13.28748232060.15
51.12.88752272040.15
61.12.88352232060.25
71.03.08550252050.20
81.03.08550252050.20
90.92.88348232040.15
100.92.88748272060.25
110.93.28352272060.15
120.93.28748272040.15
130.93.28348232060.25
141.13.28348272040.25
151.12.88748232040.25
160.92.88352272040.25
170.93.28752232040.25
181.13.28752272060.25
191.03.08550252050.20
Table 3. Regression analysis results, LOD and LOQ values.
CompoundRegression Equationr2LOD
(μg/mL)
LOQ
(μg/mL)
Cetrimidey = 5.3 × (±0.06) − 28.5 (±9.0)0.99974.1412.53
Chlorhexidiney = 53.7 × (±0.7) − 78.1 (±11.8)0.99940.541.64
Table 4. Accuracy results obtained for three concentration levels.
CompoundConcentration
(μg/mL)
Mean % Recovery%RSD
Cetrimide112.50100.980.37
150.00101.73
187.50101.22
Chlorhexidine15.3898.650.73
20.50100.11
25.6399.38
Table 5. Results of repeatability for an interval of 3 days.
CompoundDay 1Day 2Day 3
Cetrimide100.5299.32101.23
101.47101.47100.55
101.64100.09101.59
101.35101.48101.27
100.42100.05102.04
99.19101.88
%RSDr0.561.000.53
Chlorhexidine99.0099.8699.11
99.42100.8998.97
100.1199.6599.32
101.74100.7499.42
101.6799.7599.79
96.9099.32100.02
%RSDr1.820.630.40
Table 6. Values of the responses after the conduction of the fractional factorial design.
RunResponse
tR CE
(min)
tR CHA
(min)
Area CE
(mAU × min)
Area CHA
(mAU × min)
RsNCENCHATF CETF CHA
13.394.36744.28753.554.32729435051.461.82
22.803.36901.50650.483.09578338981.181.43
32.713.62562.53608.635.10637340841.101.53
42.673.96557.72600.736.07527133941.331.88
52.594.65836.80639.528.90493534431.331.79
62.753.50555.00606.634.20656238171.101.47
72.874.69797.55694.358.23608940501.401.63
82.954.61782.14691.467.81643338301.301.65
93.334.411013.38793.585.31706645901.271.59
103.314.74685.68727.076.04806533301.271.85
113.424.17734.79765.963.67743944711.171.63
123.314.71999.12766.105.87698232831.271.75
133.334.45693.60744.765.29703842791.171.59
142.713.65827.25658.655.28634241441.201.47
152.713.84818.13645.805.32637329411.201.82
163.334.411023.55808.285.34703845901.181.59
173.274.931002.07791.006.97681435981.271.80
182.703.81560.49607.205.44631031361.331.71
192.944.57799.21697.617.67640439521.301.71
Table 7. Effects of each factor to the respective responses.
Experimental ParameterEx
Values
tR CEtR CHAArea CEArea CHARsNCENCHATF CETF CHA
Flow Rate0.63−0.72−159.63−141.580.07−1223.38−348.63−0.04−0.07
pH0.01−0.064.650.23−0.35−215.88−12.130.002−0.03
% MeOH−0.050.43−13.41−13.251.46−199.63−905.380.140.27
Csalt0.02−0.0225.139.66−0.29−166.8851.630.03−0.03
T−0.020.12−6.94−0.640.64160.3757.38−0.02−0.01
λ0.03−0.17−290.9742.36−0.74377.38−58.880.0020.03
% Et3N−0.010.01−23.041.360.19424.88−104.13−0.05−0.02
Table 8. SE and Ecritical values for every response examined.
Response
tR CEtR CHAArea CEArea CHARsNCENCHATF CETF CHA
(SE)e0.020.034.701.540.1595.3955.110.030.02
Ecritical0.100.1320.256.620.63410.48237.130.120.08
Table 9. Summarized significant factors from the statistical (√) and graphical approach () and potential significant factors from graphical approach ().
FactorstR CEtR CHAArea CEArea CHARsNCENCHATF CETF CHA
Flow
pH
%MeOH
Csalt
T
Λ
% Et3N
Table 10. Non-significant limits for each factor.
FactorsLimits
Flow Rate(0.995, 1.005)
pH(2.8, 3.2)
%MeOH(84.5, 85.5)
Csalt(48.6, 51.4)
T(23, 27)
λ(204.93, 205.07)
% Et3N(0.16, 0.24)
Publisher’s Note: MDPI stays neutral with regard to jurisdictional claims in published maps and institutional affiliations.

